Pure in Millions
As required by Section 953(a) of the Dodd-Frank Wall Street Reform and Consumer Protection Act and Item 402(v) of Regulation S-K, the following table reports the compensation of our Principal Executive Officer (PEO), and the average compensation of our other Named Executive Officers (Other NEOs) as reported in the Summary Compensation Table for the past five fiscal years, as well as their “compensation actually paid”(“CAP”) as calculated pursuant to recently adopted SEC rules and certain performance measures required by such rules.
| | | | | | | | | | | | | | | | | | Value of Initial Fixed $100 Investment Based on: (5) | | | | | | Company Selected Measure | |
|||||||
Fiscal Year (1) (a) | | Summary Compensation Table Total for PEO (2) (b) | | | Compensation Actually Paid to PEO (3) (c) | | | Average Compensation Table Total for Other NEOs (4) (d) | | | Average Compensation Actually Paid to Other NEOs (3) (e) | | | LYTS Total Stockholder Return (f) | | | Peer Group Total Stockholder Return (g) |
|
| GAAP Net Income ($ mil.) (6) (h) | | | Adj. EBITDA ($ mil.) (7) (i) | |
||||||||
2026 | | $ | 3,395,505 | | | $ | 6,179,363 | | | $ | 1,342,289 | | | $ | 2,172,996 | | | $ | 359 | | | $ | 164 | | | $ | 22.6 | | | $ | 61.3 | |
2025 | | $ | 2,908,119 | | | $ | 4,333,750 | | | $ | 1,105,346 | | | $ | 1,524,944 | | | $ | 228 | | | $ | 139 | | | $ | 24.4 | | | $ | 55.1 | |
2024 | | $ | 2,737,617 | | | $ | 4,223,123 | | | $ | 1,026,751 | | | $ | 1,474,215 | | | $ | 192 | | | $ | 132 | | | $ | 25.0 | | | $ | 51.4 | |
2023 | | $ | 2,817,123 | | | $ | 6,402,557 | | | $ | 932,243 | | | $ | 1,585,393 | | | $ | 164 | | | $ | 109 | | | $ | 25.8 | | | $ | 51.6 | |
2022 | | $ | 2,641,256 | | | $ | 2,316,647 | | | $ | 924,816 | | | $ | 790,710 | | | $ | 79 | | | $ | 78 | | | $ | 15.0 | | | $ | 35.1 | |
(1) | NEOs included in these columns reflect the following: |
Fiscal Year | PEO | Non-PEO NEOs |
2026 | James A. Clark | James E. Galeese and Thomas A. Caneris |
2025 | James A. Clark | James E. Galeese and Thomas A. Caneris |
2024 | James A. Clark | James E. Galeese and Thomas A. Caneris |
2023 | James A. Clark | James E. Galeese, Thomas A. Caneris, and Jeffrey S. Bastian |
2022 | James A. Clark | James E. Galeese, Thomas A. Caneris, Michael C. Beck, and Jeffrey S. Bastian |
(2) | The dollar amounts reported in this column are the amounts of total compensation reported for Mr. Clark for each corresponding year in the "Total" column of the Summary Compensation table. |
(3) | The dollar amounts reported in this column represent the amount of “compensation actually paid” to the PEO and Other NEOs, as computed in accordance with Item 402(v) of Regulation S-K, with dividends already accounted for in the fair value of equity awards. The dollar amounts do not reflect the actual amount of compensation earned by or paid to the PEO or Other NEOs during the applicable year. In accordance with the requirements, the following adjustments were made to the PEO and Other NEOs’ total compensation for each year to determine the "compensation actually paid": |
| | Fiscal Year 2026 | | | Fiscal Year 2025 | | | Fiscal Year 2024 | | | Fiscal Year 2023 | | | Fiscal Year 2022 | |
|||||||||||||||||||||||||
| | PEO ($) | | | Other NEOs ($) | | | PEO ($) | | | Other NEOs ($) | | | PEO ($) | | | Other NEOs ($) | | | PEO ($) | | | Other NEOs ($) | | | PEO ($) | | | Other NEOs ($) | |
||||||||||
Summary Compensation Table Total | | $ | 3,395,505 | | | $ | 1,342,289 | | | $ | 2,908,119 | | | $ | 1,105,346 | | | $ | 2,737,617 | | | $ | 1,026,751 | | | $ | 2,817,123 | | | $ | 932,243 | | | $ | 2,641,256 | | | $ | 924,816 | |
Less Change in Pension Value Reported in Summary Compensation Table | | $ | 0 | | | $ | 0 | | | $ | 0 | | | $ | 0 | | | $ | 0 | | | $ | 0 | | | $ | 0 | | | $ | 0 | | | $ | 0 | | | $ | 0 | |
Less Stock Award and Option Value Reported in Summary Compensation Table for the Fiscal Year(a) | | $ | 1,500,000 | | | $ | 490,000 | | | $ | 1,500,000 | | | $ | 435,000 | | | $ | 1,500,000 | | | $ | 435,000 | | | $ | 1,099,998 | | | $ | 263,334 | | | $ | 939,363 | | | $ | 224,861 | |
Plus (Less) Fair value of Equity Awards Granted During Fiscal Year that are Outstanding and Unvested at End of Fiscal Year(b) | | $ | 2,081,342 | | | $ | 679,911 | | | $ | 1,900,419 | | | $ | 551,119 | | | $ | 1,724,532 | | | $ | 500,115 | | | $ | 2,034,199 | | | $ | 486,977 | | | $ | 945,810 | | | $ | 207,974 | |
Plus (Less) Fair value of Equity Awards Granted in Any Prior Fiscal Year that are Outstanding and Unvested at End of Fiscal Year | | $ | 1,759,389 | | | $ | 510,229 | | | $ | 932,112 | | | $ | 273,903 | | | $ | 1,040,792 | | | $ | 314,375 | | | $ | 1,569,428 | | | $ | 378,507 | | | $ | (379,279 | ) | | $ | (95,786 | ) |
Plus Fair Value at Vesting Date of Awards Granted and Vested During the Fiscal Year | | $ | 0 | | | $ | 0 | | | $ | 0 | | | $ | 0 | | | $ | 0 | | | $ | 0 | | | $ | 0 | | | $ | 0 | | | $ | 0 | | | $ | 10,270 | |
Plus (Less) Change in Fair Value of Equity Awards granted in Prior Fiscal Years that Vested During the Fiscal Year | | $ | 443,127 | | | $ | 130,567 | | | $ | 93,101 | | | $ | 29,577 | | | $ | 220,182 | | | $ | 67,974 | | | $ | 1,081,804 | | | $ | 51,000 | | | $ | 48,223 | | | $ | (31,702 | ) |
Compensation Actually Paid (CAP) | | $ | 6,179,363 | | | $ | 2,172,996 | | | $ | 4,333,750 | | | $ | 1,524,944 | | | $ | 4,223,123 | | | $ | 1,474,215 | | | $ | 6,402,557 | | | $ | 1,585,393 | | | $ | 2,316,647 | | | $ | 790,710 | |
| (a) | The amounts reflect the aggregate grant-date fair value reported in the “Stock Awards” columns in the Summary Compensation Table for the applicable year. |
| (b) | In accordance with Item 402(v) requirements, the fair values of unvested and outstanding equity awards to our NEOs were measured as of the end of each fiscal year, and as of each vesting date, during the years displayed in the table above. |
(4) | The dollar amounts reported in this column are the average amounts of total compensation reported for Other NEOs for each corresponding year in the "Total" column of the Summary Compensation table. |
(5) | The Company is using as its Peer Group the S&P 600 Building Products Index, which is an index used by the Company for purposes of disclosure in its Form 10-K under Item 201(e) of Regulation S-K. |
(6) | The dollar amounts reported represent the amount of net income reflected in our consolidated audited financial statements for the applicable year. |
(7) | Adjusted EBITDA was chosen as the “Company Selected Measure”, as it represents the most important financial performance measure used to align compensation actually paid to the PEO and other NEOs in 2026 to the Company's performance: |
| | Fiscal Year 2026 | | | Fiscal Year 2025 | | | Fiscal Year 2024 | | | Fiscal Year 2023 | | | Fiscal Year 2022 | |
|||||||||||||||||||||||||
| | PEO ($) | | | Other NEOs ($) | | | PEO ($) | | | Other NEOs ($) | | | PEO ($) | | | Other NEOs ($) | | | PEO ($) | | | Other NEOs ($) | | | PEO ($) | | | Other NEOs ($) | |
||||||||||
Summary Compensation Table Total | | $ | 3,395,505 | | | $ | 1,342,289 | | | $ | 2,908,119 | | | $ | 1,105,346 | | | $ | 2,737,617 | | | $ | 1,026,751 | | | $ | 2,817,123 | | | $ | 932,243 | | | $ | 2,641,256 | | | $ | 924,816 | |
Less Change in Pension Value Reported in Summary Compensation Table | | $ | 0 | | | $ | 0 | | | $ | 0 | | | $ | 0 | | | $ | 0 | | | $ | 0 | | | $ | 0 | | | $ | 0 | | | $ | 0 | | | $ | 0 | |
Less Stock Award and Option Value Reported in Summary Compensation Table for the Fiscal Year(a) | | $ | 1,500,000 | | | $ | 490,000 | | | $ | 1,500,000 | | | $ | 435,000 | | | $ | 1,500,000 | | | $ | 435,000 | | | $ | 1,099,998 | | | $ | 263,334 | | | $ | 939,363 | | | $ | 224,861 | |
Plus (Less) Fair value of Equity Awards Granted During Fiscal Year that are Outstanding and Unvested at End of Fiscal Year(b) | | $ | 2,081,342 | | | $ | 679,911 | | | $ | 1,900,419 | | | $ | 551,119 | | | $ | 1,724,532 | | | $ | 500,115 | | | $ | 2,034,199 | | | $ | 486,977 | | | $ | 945,810 | | | $ | 207,974 | |
Plus (Less) Fair value of Equity Awards Granted in Any Prior Fiscal Year that are Outstanding and Unvested at End of Fiscal Year | | $ | 1,759,389 | | | $ | 510,229 | | | $ | 932,112 | | | $ | 273,903 | | | $ | 1,040,792 | | | $ | 314,375 | | | $ | 1,569,428 | | | $ | 378,507 | | | $ | (379,279 | ) | | $ | (95,786 | ) |
Plus Fair Value at Vesting Date of Awards Granted and Vested During the Fiscal Year | | $ | 0 | | | $ | 0 | | | $ | 0 | | | $ | 0 | | | $ | 0 | | | $ | 0 | | | $ | 0 | | | $ | 0 | | | $ | 0 | | | $ | 10,270 | |
Plus (Less) Change in Fair Value of Equity Awards granted in Prior Fiscal Years that Vested During the Fiscal Year | | $ | 443,127 | | | $ | 130,567 | | | $ | 93,101 | | | $ | 29,577 | | | $ | 220,182 | | | $ | 67,974 | | | $ | 1,081,804 | | | $ | 51,000 | | | $ | 48,223 | | | $ | (31,702 | ) |
Compensation Actually Paid (CAP) | | $ | 6,179,363 | | | $ | 2,172,996 | | | $ | 4,333,750 | | | $ | 1,524,944 | | | $ | 4,223,123 | | | $ | 1,474,215 | | | $ | 6,402,557 | | | $ | 1,585,393 | | | $ | 2,316,647 | | | $ | 790,710 | |
| (a) | The amounts reflect the aggregate grant-date fair value reported in the “Stock Awards” columns in the Summary Compensation Table for the applicable year. |
| (b) | In accordance with Item 402(v) requirements, the fair values of unvested and outstanding equity awards to our NEOs were measured as of the end of each fiscal year, and as of each vesting date, during the years displayed in the table above. |
(4) | The dollar amounts reported in this column are the average amounts of total compensation reported for Other NEOs for each corresponding year in the "Total" column of the Summary Compensation table. |
(5) | The Company is using as its Peer Group the S&P 600 Building Products Index, which is an index used by the Company for purposes of disclosure in its Form 10-K under Item 201(e) of Regulation S-K. |
(6) | The dollar amounts reported represent the amount of net income reflected in our consolidated audited financial statements for the applicable year. |
(7) | Adjusted EBITDA was chosen as the “Company Selected Measure”, as it represents the most important financial performance measure used to align compensation actually paid to the PEO and other NEOs in 2026 to the Company's performance: |
Compensation Actually Paid versus Total Shareholder Return
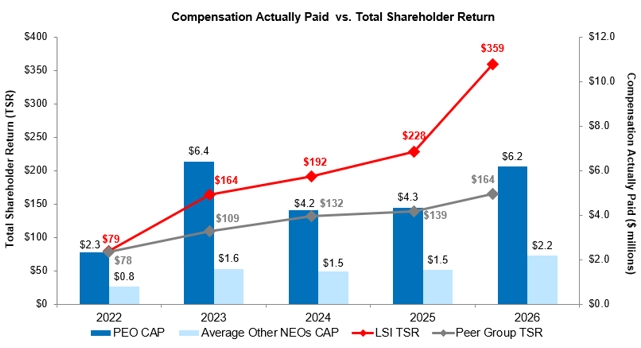
We use a variety of quantitative and qualitative metrics to align compensation with our performance and the value we are delivering to our shareholders. The graph below reflects the relationship between the CAP for the PEO and the average Other NEOs versus the Company's TSR and the peer group TSR, assuming an initial fixed investment of $100 for the fiscal years ended June 30, 2026, 2025, 2024, 2023, and 2022.
Compensation Actually Paid versus Net Income
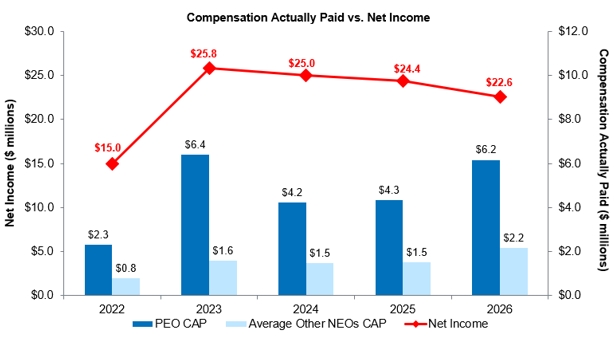
Although Net Income is a required metric for purposes of the Pay Versus Performance Table (PVP Table), it is not a measure we use in our short- or long-term incentive plan and is not a factor the Committee considers in determining pay for our NEOs. The graph below presents CAP and Net Income for each of the five fiscal years reported in the PVP Table.
Compensation Actually Paid versus Adjusted EBITDA
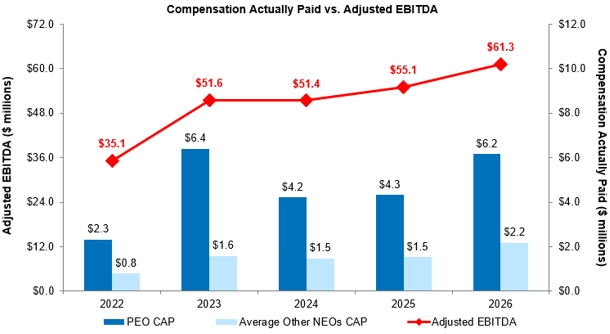
The graph below reflects the relationship between the PEO and Average Other NEOs CAP and the Company’s Adjusted EBITDA metric for each of the five fiscal years reported in the PVP Table.
Tabular list of Company Performance Measures
We design our executive compensation plans to help attract, motivate, reward, and retain highly qualified executives who can create and sustain value for our shareholders. The metrics and performance criteria used in our short- and long-term incentive plans were selected based on their link to shareholder value creation over the long-term. The most important financial performance metrics used to link pay and performance for the most recently completed fiscal year are:
Most Important Performance Measures |
Adjusted EBITDA |
Net Sales |
Return on Net Assets (RONA) |