Pay vs Performance Disclosure - USD ($)
Dec. 31, 2025
Dec. 31, 2024
Dec. 31, 2023
Summary Compensation Table Total for PEO(2) | Compensation Actually Paid to PEO(3) | Average Summary Compensation Table Total for Non-PEO NEOs(2) | Average Compensation Actually Paid to Non-PEO NEOs(3) | Value of Initial Fixed $100 Investment Based On: | ||||||||||||||||||||||
Year(1) | Total Shareholder Return(4) | Peer Group Total Shareholder Return(5) | Net Income (in thousands) | Adjusted Pre-Bonus Net Income (in thousands)(6) | ||||||||||||||||||||||
| 2025 | $ | 1,100,403 | $ | 5,504,512 | $ | 721,753 | $ | 1,940,248 | $ | 3,565 | $ | 181 | $ | 133,130 | $ | 126,503 | ||||||||||
| 2024 | 2,224,113 | 11,513,249 | 2,159,975 | 8,011,836 | 2,394 | 180 | 78,522 | 56,012 | ||||||||||||||||||
| 2023 | 1,943,439 | 2,058,886 | 1,117,556 | 1,163,004 | 192 | 134 | 7,098 | 7,986 | ||||||||||||||||||
(1)For all years presented, our principal executive officer ("PEO") was Charles Youakim. Our non-PEO NEOs were, for 2025 and 2024, Karen Hartje, Paul Paradis, and Amin Sabzivand, and for 2023, Karen Hartje and Paul Paradis.
(2)Amounts reported in these columns represent (i) the total compensation reported in the Summary Compensation Table for the applicable year for our PEO and (ii) the average of the total compensation reported in the Summary Compensation Table for our non-PEO NEOs.
(3)Compensation actually paid represents the Summary Compensation Table total compensation adjusted as required by Item 402(v)(2)(iii) of Regulation S-K. A reconciliation of the adjustments for our PEO and our non-PEO NEOs is set forth following the footnotes to this table.
(4)Pursuant to Item 201(e) of Regulation S-K, the comparison assumes $100 was invested on December 30, 2022, and that dividends were reinvested during the measurement period. Our common stock was listed on the Nasdaq Capital Market in August 2023; before that date it traded on the Australian Securities Exchange ("ASX") in the form of CHESS Depositary Interests ("CDIs"), each representing one share of common stock. The starting value is based on the ASX closing price of our CDIs on December 30, 2022, converted to U.S. dollars at the Reserve Bank of Australia exchange rate on that date and adjusted for our 1-for-38 reverse stock split (May 2023) and 6-for-1 stock split (March 2025). Year-end values thereafter are based on Nasdaq closing prices. We have not paid dividends during the measurement period. Historical stock price performance is not necessarily indicative of future stock price performance.
(5)Peer group total shareholder return reflects the cumulative total return of the KBW Nasdaq Financial Technology Index (total return version, ticker KFTXT), a published industry index, assuming an initial investment of $100 in the index at the close of trading on December 30, 2022, and that dividends were reinvested during the measurement period. Peer group total shareholder return is calculated over the same measurement periods as our total shareholder return. We selected this index because it is an independently maintained index of U.S.-listed financial technology companies, which we believe provides a meaningful comparison for our business.
(6)Adjusted Pre-Bonus Net Income is a non-GAAP financial measure, computed as GAAP pre-tax income plus PSIP bonus expense accrued for the year, tax-effected at an assumed rate of 25%. For 2025, GAAP pre-tax income of $162.9 million plus PSIP expense of $5.8 million, less assumed taxes of $42.2 million, equaled Adjusted Pre-Bonus Net Income of $126.5 million. Because the measure applies an assumed tax rate, it may be lower than GAAP net income.
Reconciliation of Compensation Actually Paid Adjustments
| 2025 | 2024 | 2023 | ||||||||||||||||||||||||
| PEO | Average Non-PEO NEOs(8) | PEO | Average Non-PEO NEOs(8) | PEO | Average Non-PEO NEOs(8) | |||||||||||||||||||||
Summary Compensation Table ("SCT") Total(1) | $ | 1,100,403 | $ | 721,753 | $ | 2,224,113 | $ | 2,159,975 | $ | 1,943,439 | $ | 1,117,556 | ||||||||||||||
Minus: Stock award values reported in SCT(2) | — | (154,640) | (463,920) | (1,489,289) | (1,168,691) | (648,576) | ||||||||||||||||||||
Minus: Option award values reported in SCT(2) | — | — | (682,642) | — | — | — | ||||||||||||||||||||
Plus: Year-end fair value of outstanding and unvested equity awards granted in fiscal year(3) | — | 253,920 | 2,616,901 | 3,836,997 | 1,080,009 | 540,004 | ||||||||||||||||||||
Plus/(Minus): Change in fair value of outstanding and unvested equity awards granted in prior fiscal years(4) | 2,869,729 | 1,528,864 | 6,965,694 | 3,084,989 | — | — | ||||||||||||||||||||
Plus: Vesting date fair value of equity awards granted and vested during the fiscal year(5) | — | — | — | — | 198,562 | 148,454 | ||||||||||||||||||||
Plus/(Minus): Change in fair value from end of prior year to vesting date of equity awards granted in prior years that vested during the fiscal year(6) | 1,534,380 | 684,321 | 853,103 | 419,164 | 5,567 | 5,566 | ||||||||||||||||||||
Minus: Fair value at the end of prior years of equity awards granted in prior years that were forfeited during the fiscal year(7) | — | (1,093,970) | — | — | — | — | ||||||||||||||||||||
| Compensation Actually Paid | $ | 5,504,512 | $ | 1,940,248 | $ | 11,513,249 | $ | 8,011,836 | $ | 2,058,886 | $ | 1,163,004 | ||||||||||||||
(1)With respect to the PEO, amounts shown represent Total Compensation reported in the Summary Compensation Table. With respect to the non-PEO NEOs, amounts shown represent averages.
(2)Represents the grant date fair value of the equity awards granted during the applicable year, computed in accordance with the methodology used for financial reporting purposes.
(3)Represents the fair value as of the applicable year-end on outstanding and unvested equity awards granted during such year, computed in accordance with the methodology used for financial reporting purposes.
(4)Represents the change in fair value during the applicable year of each equity award that was granted in a prior fiscal year and that remained outstanding and unvested as of the last day of the applicable fiscal year, computed in accordance with the methodology used for financial reporting purposes, and, for awards subject to performance-based vesting conditions, based on the probable outcome of such performance-based vesting conditions as of the last day of the applicable fiscal year.
(5)Represents the fair value at vesting of equity awards that were granted and vested during the applicable fiscal year, computed in accordance with the methodology used for financial reporting purposes.
(6)Represents the change in fair value, measured from the prior fiscal year-end to the vesting date, of each equity award that was granted in a prior fiscal year and that vested during the applicable fiscal year, computed in accordance with the methodology used for financial reporting purposes.
(7)Represents the fair value as of the last day of the prior fiscal year of the equity awards that were granted in a prior fiscal year and which failed to meet the applicable vesting conditions in the applicable fiscal year, computed in accordance with the methodology used for financial reporting purposes.
(8)See footnote 1 in the pay versus performance table above for the NEOs included in the average.
Reconciliation of Compensation Actually Paid Adjustments
| 2025 | 2024 | 2023 | ||||||||||||||||||||||||
| PEO | Average Non-PEO NEOs(8) | PEO | Average Non-PEO NEOs(8) | PEO | Average Non-PEO NEOs(8) | |||||||||||||||||||||
Summary Compensation Table ("SCT") Total(1) | $ | 1,100,403 | $ | 721,753 | $ | 2,224,113 | $ | 2,159,975 | $ | 1,943,439 | $ | 1,117,556 | ||||||||||||||
Minus: Stock award values reported in SCT(2) | — | (154,640) | (463,920) | (1,489,289) | (1,168,691) | (648,576) | ||||||||||||||||||||
Minus: Option award values reported in SCT(2) | — | — | (682,642) | — | — | — | ||||||||||||||||||||
Plus: Year-end fair value of outstanding and unvested equity awards granted in fiscal year(3) | — | 253,920 | 2,616,901 | 3,836,997 | 1,080,009 | 540,004 | ||||||||||||||||||||
Plus/(Minus): Change in fair value of outstanding and unvested equity awards granted in prior fiscal years(4) | 2,869,729 | 1,528,864 | 6,965,694 | 3,084,989 | — | — | ||||||||||||||||||||
Plus: Vesting date fair value of equity awards granted and vested during the fiscal year(5) | — | — | — | — | 198,562 | 148,454 | ||||||||||||||||||||
Plus/(Minus): Change in fair value from end of prior year to vesting date of equity awards granted in prior years that vested during the fiscal year(6) | 1,534,380 | 684,321 | 853,103 | 419,164 | 5,567 | 5,566 | ||||||||||||||||||||
Minus: Fair value at the end of prior years of equity awards granted in prior years that were forfeited during the fiscal year(7) | — | (1,093,970) | — | — | — | — | ||||||||||||||||||||
| Compensation Actually Paid | $ | 5,504,512 | $ | 1,940,248 | $ | 11,513,249 | $ | 8,011,836 | $ | 2,058,886 | $ | 1,163,004 | ||||||||||||||
(1)With respect to the PEO, amounts shown represent Total Compensation reported in the Summary Compensation Table. With respect to the non-PEO NEOs, amounts shown represent averages.
(2)Represents the grant date fair value of the equity awards granted during the applicable year, computed in accordance with the methodology used for financial reporting purposes.
(3)Represents the fair value as of the applicable year-end on outstanding and unvested equity awards granted during such year, computed in accordance with the methodology used for financial reporting purposes.
(4)Represents the change in fair value during the applicable year of each equity award that was granted in a prior fiscal year and that remained outstanding and unvested as of the last day of the applicable fiscal year, computed in accordance with the methodology used for financial reporting purposes, and, for awards subject to performance-based vesting conditions, based on the probable outcome of such performance-based vesting conditions as of the last day of the applicable fiscal year.
(5)Represents the fair value at vesting of equity awards that were granted and vested during the applicable fiscal year, computed in accordance with the methodology used for financial reporting purposes.
(6)Represents the change in fair value, measured from the prior fiscal year-end to the vesting date, of each equity award that was granted in a prior fiscal year and that vested during the applicable fiscal year, computed in accordance with the methodology used for financial reporting purposes.
(7)Represents the fair value as of the last day of the prior fiscal year of the equity awards that were granted in a prior fiscal year and which failed to meet the applicable vesting conditions in the applicable fiscal year, computed in accordance with the methodology used for financial reporting purposes.
(8)See footnote 1 in the pay versus performance table above for the NEOs included in the average.
Relationship Between Pay and Performance
The following graphs illustrate the relationship between the Compensation Actually Paid to our PEO and the average Compensation Actually Paid to our other NEOs, and our cumulative total shareholder return, net income, and adjusted pre-bonus net income, our Company-Selected Measure, for fiscal years 2023, 2024, and 2025, as well as the relationship between our cumulative total shareholder return and the cumulative total shareholder return of our peer group over the same period.
Because our executive compensation program rewards our named executive officers primarily through long-term incentives in the form of stock option and restricted stock unit awards, Compensation Actually Paid ("CAP"), as calculated in accordance with Item 402(v) of Regulation S-K, is driven predominantly by the year-over-year change in the fair value of equity awards that are outstanding and unvested at fiscal year-end, or that vest during the covered year. As a result, CAP is highly sensitive to movements in our share price and to the timing of annual grants, vesting events, and any forfeitures, and may diverge materially from the totals reported in the Summary Compensation Table in any given year.
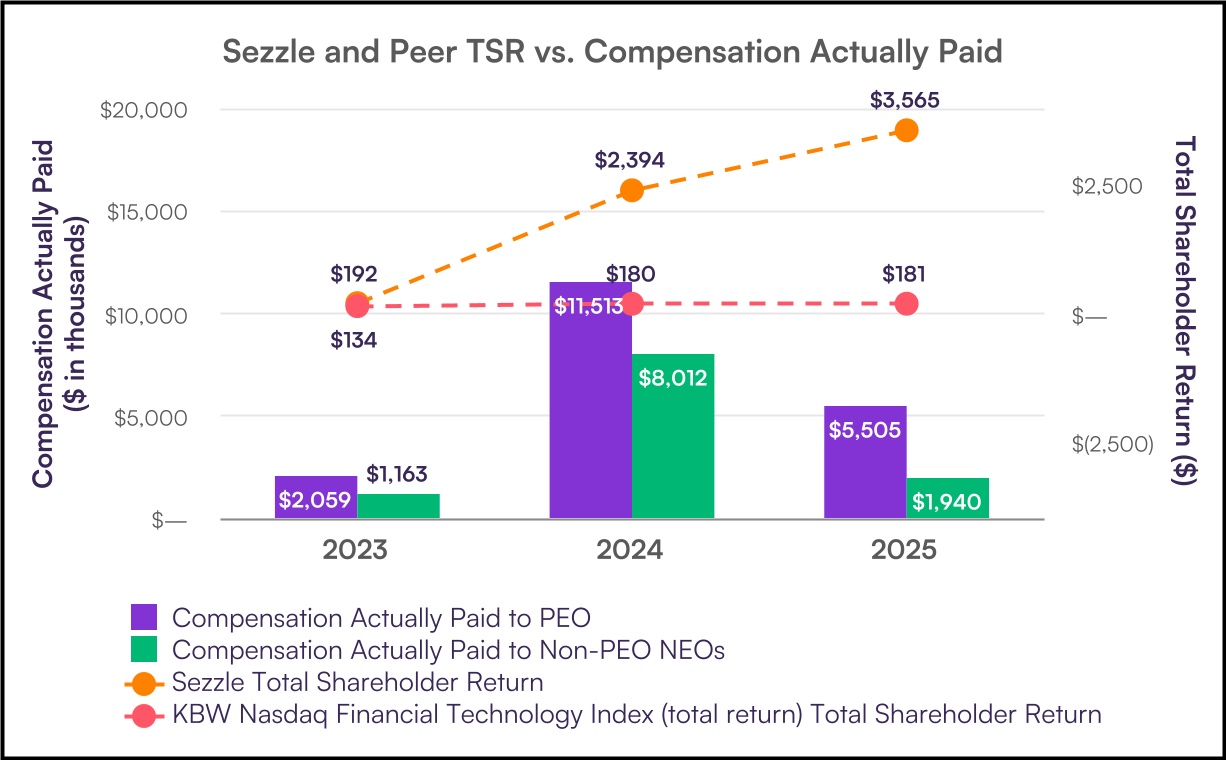
As of December 31, 2023, 2024, and 2025, the value of a $100 initial fixed investment on December 30, 2022, the last trading day of fiscal year 2022, was $192 (return of 92%), $2,394 (return of 2,294%) and $3,565 (return of 3,465%), respectively. Because our common stock was not listed on the Nasdaq Capital Market until August 2023, the starting value is based on the closing price of our CDIs on the ASX, as described in footnote 4 to the table above. Over the same period, the value of a $100 initial fixed investment in the KBW Nasdaq Financial Technology Index (total return), which we use as our peer group for this purpose, was $134 (return of 34%), $180 (return of 80%) and $181 (return of 81%), respectively. Our cumulative total shareholder return exceeded that of our peer group as of the end of each year in the measurement period. Our net income grew from $7.1 million in 2023 to $78.5 million in 2024, and $133.1 million in 2025. Adjusted Pre-Bonus Net Income, which we have identified as the most important financial performance measure used to link CAP to Company performance for 2025, and which is the primary measure used to fund our annual profit-sharing incentive plan, grew from $8.0 million in 2023 to $56.0 million in 2024 and $126.5 million in 2025. In 2023, CAP paid to our PEO, totaling $2.1 million, was generally in line with the Summary Compensation Table total of $1.9 million; similarly, the average CAP paid to our non-PEO NEOs totaled $1.2 million, generally in line with the Summary Compensation Table total of $1.1 million. CAP paid to our PEO and the average CAP paid to our non-PEO NEOs were meaningfully higher than the corresponding Summary Compensation Table totals in 2024 and 2025, reflecting continued appreciation in the fair value of previously granted unvested equity. CAP increased substantially from 2023 to 2024, consistent with the increase in our share price, net income, and adjusted pre-bonus net income over that period. From 2024 to 2025, however, CAP declined from $11.5 million to $5.5 million for our PEO and from $8.0 million to $1.9 million on average for our non-PEO NEOs. We believe this year-over-year decline reflects measurement dynamics specific to the CAP framework rather than a deterioration in Company performance, as Adjusted Pre-Bonus Net Income more than doubled over the same period: (i) aside from Mr. Sabzivand, no new equity awards were granted to our named executive officers during fiscal 2025, so CAP for 2025 included a smaller "year-end fair value of awards granted in the covered year" component; (ii) following significant vesting activity during 2024, the population of prior-year unvested awards subject to mark-to-market adjustment in 2025 was smaller than in 2024, producing a smaller absolute-dollar fair-value change notwithstanding further share-price appreciation; and (iii) the average CAP paid to our non-PEO NEOs in 2025 was reduced by the approximately $1.1 million deduction associated with the forfeiture of unvested equity held by our former Chief Financial Officer upon her transition to consultant status on October 31, 2025.
Viewed over the full three-year measurement window, we believe CAP is generally reflective of our cumulative Total Shareholder Return, including our performance relative to our peer group, net income, and our adjusted pre-bonus net income, and reflects the intended linkage between long-term stockholder value creation and the realized and realizable compensation of our named executive officers. Because our equity grant cadence and the accounting-based fair-value methodology can introduce year-to-year volatility — including from one-time grants, the cliff vesting of sizable prior-year awards, and forfeitures — we believe the relationship between CAP and Company performance is best evaluated on a multi-year basis rather than on the basis of a single year's movement.
Relationship Between Pay and Performance
The following graphs illustrate the relationship between the Compensation Actually Paid to our PEO and the average Compensation Actually Paid to our other NEOs, and our cumulative total shareholder return, net income, and adjusted pre-bonus net income, our Company-Selected Measure, for fiscal years 2023, 2024, and 2025, as well as the relationship between our cumulative total shareholder return and the cumulative total shareholder return of our peer group over the same period.
Because our executive compensation program rewards our named executive officers primarily through long-term incentives in the form of stock option and restricted stock unit awards, Compensation Actually Paid ("CAP"), as calculated in accordance with Item 402(v) of Regulation S-K, is driven predominantly by the year-over-year change in the fair value of equity awards that are outstanding and unvested at fiscal year-end, or that vest during the covered year. As a result, CAP is highly sensitive to movements in our share price and to the timing of annual grants, vesting events, and any forfeitures, and may diverge materially from the totals reported in the Summary Compensation Table in any given year.
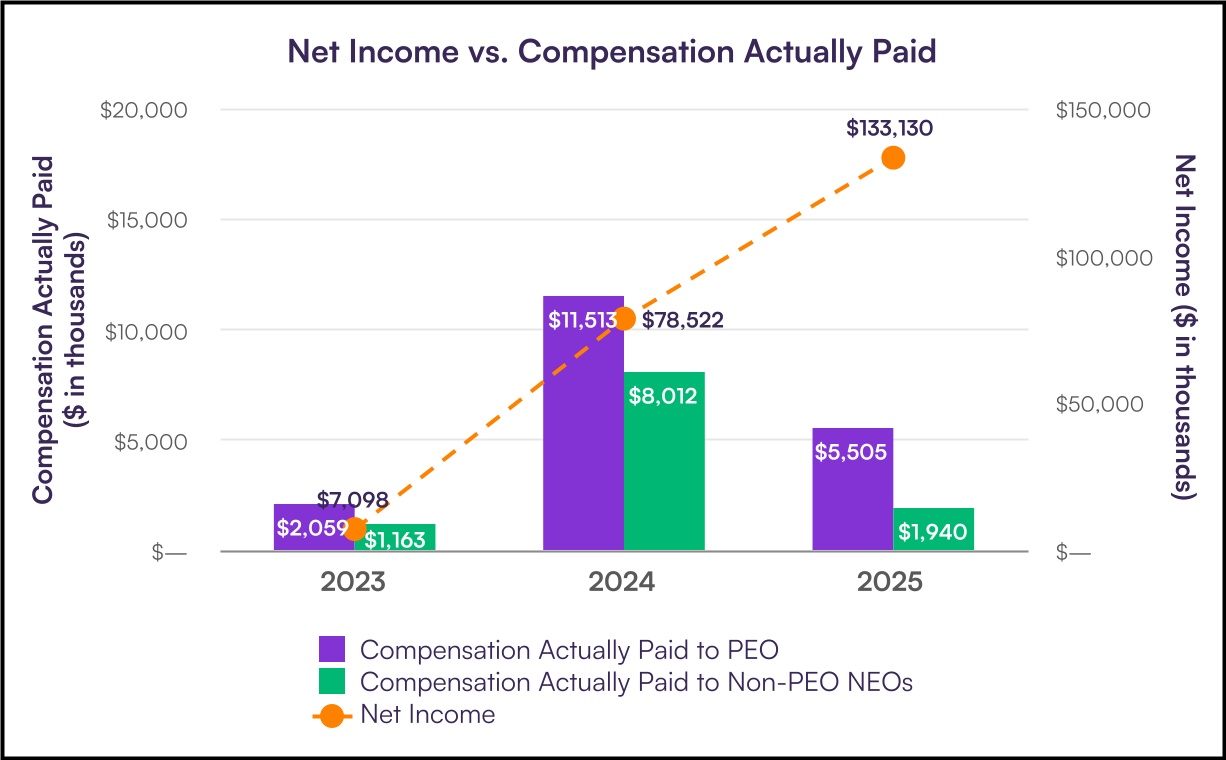
As of December 31, 2023, 2024, and 2025, the value of a $100 initial fixed investment on December 30, 2022, the last trading day of fiscal year 2022, was $192 (return of 92%), $2,394 (return of 2,294%) and $3,565 (return of 3,465%), respectively. Because our common stock was not listed on the Nasdaq Capital Market until August 2023, the starting value is based on the closing price of our CDIs on the ASX, as described in footnote 4 to the table above. Over the same period, the value of a $100 initial fixed investment in the KBW Nasdaq Financial Technology Index (total return), which we use as our peer group for this purpose, was $134 (return of 34%), $180 (return of 80%) and $181 (return of 81%), respectively. Our cumulative total shareholder return exceeded that of our peer group as of the end of each year in the measurement period. Our net income grew from $7.1 million in 2023 to $78.5 million in 2024, and $133.1 million in 2025. Adjusted Pre-Bonus Net Income, which we have identified as the most important financial performance measure used to link CAP to Company performance for 2025, and which is the primary measure used to fund our annual profit-sharing incentive plan, grew from $8.0 million in 2023 to $56.0 million in 2024 and $126.5 million in 2025. In 2023, CAP paid to our PEO, totaling $2.1 million, was generally in line with the Summary Compensation Table total of $1.9 million; similarly, the average CAP paid to our non-PEO NEOs totaled $1.2 million, generally in line with the Summary Compensation Table total of $1.1 million. CAP paid to our PEO and the average CAP paid to our non-PEO NEOs were meaningfully higher than the corresponding Summary Compensation Table totals in 2024 and 2025, reflecting continued appreciation in the fair value of previously granted unvested equity. CAP increased substantially from 2023 to 2024, consistent with the increase in our share price, net income, and adjusted pre-bonus net income over that period. From 2024 to 2025, however, CAP declined from $11.5 million to $5.5 million for our PEO and from $8.0 million to $1.9 million on average for our non-PEO NEOs. We believe this year-over-year decline reflects measurement dynamics specific to the CAP framework rather than a deterioration in Company performance, as Adjusted Pre-Bonus Net Income more than doubled over the same period: (i) aside from Mr. Sabzivand, no new equity awards were granted to our named executive officers during fiscal 2025, so CAP for 2025 included a smaller "year-end fair value of awards granted in the covered year" component; (ii) following significant vesting activity during 2024, the population of prior-year unvested awards subject to mark-to-market adjustment in 2025 was smaller than in 2024, producing a smaller absolute-dollar fair-value change notwithstanding further share-price appreciation; and (iii) the average CAP paid to our non-PEO NEOs in 2025 was reduced by the approximately $1.1 million deduction associated with the forfeiture of unvested equity held by our former Chief Financial Officer upon her transition to consultant status on October 31, 2025.
Viewed over the full three-year measurement window, we believe CAP is generally reflective of our cumulative Total Shareholder Return, including our performance relative to our peer group, net income, and our adjusted pre-bonus net income, and reflects the intended linkage between long-term stockholder value creation and the realized and realizable compensation of our named executive officers. Because our equity grant cadence and the accounting-based fair-value methodology can introduce year-to-year volatility — including from one-time grants, the cliff vesting of sizable prior-year awards, and forfeitures — we believe the relationship between CAP and Company performance is best evaluated on a multi-year basis rather than on the basis of a single year's movement.
Relationship Between Pay and Performance
The following graphs illustrate the relationship between the Compensation Actually Paid to our PEO and the average Compensation Actually Paid to our other NEOs, and our cumulative total shareholder return, net income, and adjusted pre-bonus net income, our Company-Selected Measure, for fiscal years 2023, 2024, and 2025, as well as the relationship between our cumulative total shareholder return and the cumulative total shareholder return of our peer group over the same period.
Because our executive compensation program rewards our named executive officers primarily through long-term incentives in the form of stock option and restricted stock unit awards, Compensation Actually Paid ("CAP"), as calculated in accordance with Item 402(v) of Regulation S-K, is driven predominantly by the year-over-year change in the fair value of equity awards that are outstanding and unvested at fiscal year-end, or that vest during the covered year. As a result, CAP is highly sensitive to movements in our share price and to the timing of annual grants, vesting events, and any forfeitures, and may diverge materially from the totals reported in the Summary Compensation Table in any given year.
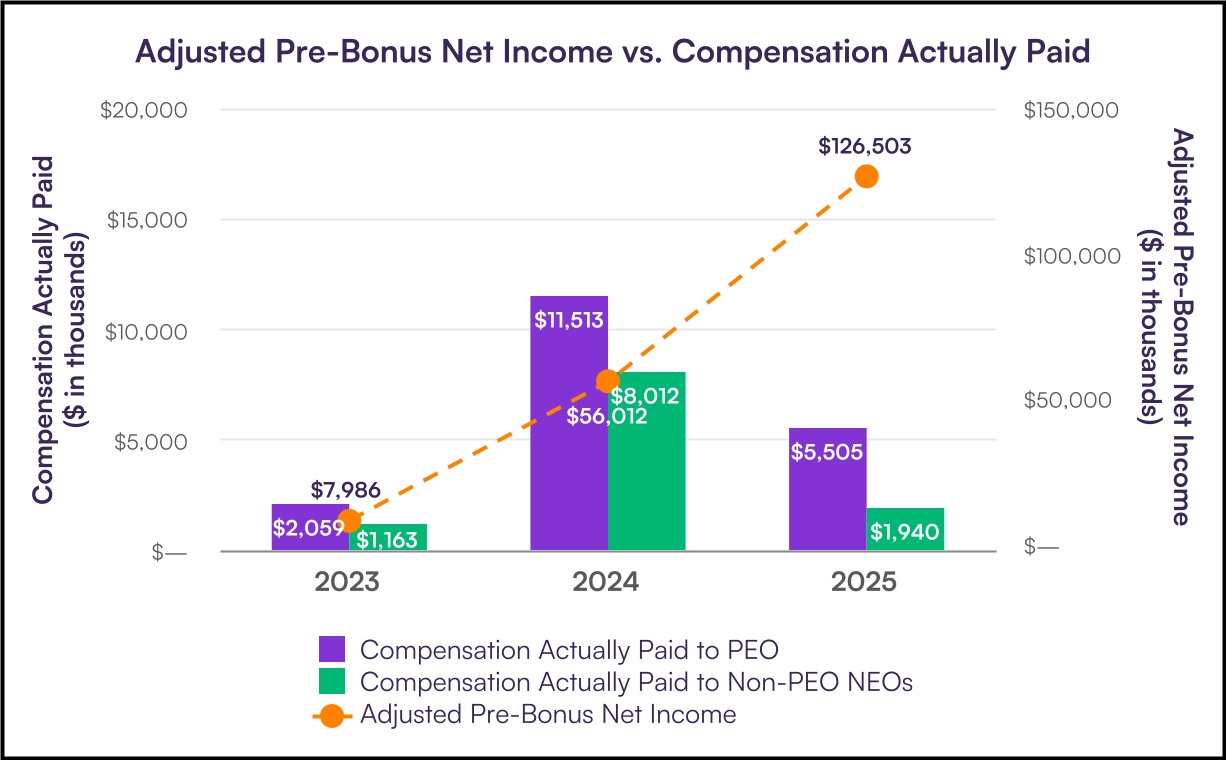
As of December 31, 2023, 2024, and 2025, the value of a $100 initial fixed investment on December 30, 2022, the last trading day of fiscal year 2022, was $192 (return of 92%), $2,394 (return of 2,294%) and $3,565 (return of 3,465%), respectively. Because our common stock was not listed on the Nasdaq Capital Market until August 2023, the starting value is based on the closing price of our CDIs on the ASX, as described in footnote 4 to the table above. Over the same period, the value of a $100 initial fixed investment in the KBW Nasdaq Financial Technology Index (total return), which we use as our peer group for this purpose, was $134 (return of 34%), $180 (return of 80%) and $181 (return of 81%), respectively. Our cumulative total shareholder return exceeded that of our peer group as of the end of each year in the measurement period. Our net income grew from $7.1 million in 2023 to $78.5 million in 2024, and $133.1 million in 2025. Adjusted Pre-Bonus Net Income, which we have identified as the most important financial performance measure used to link CAP to Company performance for 2025, and which is the primary measure used to fund our annual profit-sharing incentive plan, grew from $8.0 million in 2023 to $56.0 million in 2024 and $126.5 million in 2025. In 2023, CAP paid to our PEO, totaling $2.1 million, was generally in line with the Summary Compensation Table total of $1.9 million; similarly, the average CAP paid to our non-PEO NEOs totaled $1.2 million, generally in line with the Summary Compensation Table total of $1.1 million. CAP paid to our PEO and the average CAP paid to our non-PEO NEOs were meaningfully higher than the corresponding Summary Compensation Table totals in 2024 and 2025, reflecting continued appreciation in the fair value of previously granted unvested equity. CAP increased substantially from 2023 to 2024, consistent with the increase in our share price, net income, and adjusted pre-bonus net income over that period. From 2024 to 2025, however, CAP declined from $11.5 million to $5.5 million for our PEO and from $8.0 million to $1.9 million on average for our non-PEO NEOs. We believe this year-over-year decline reflects measurement dynamics specific to the CAP framework rather than a deterioration in Company performance, as Adjusted Pre-Bonus Net Income more than doubled over the same period: (i) aside from Mr. Sabzivand, no new equity awards were granted to our named executive officers during fiscal 2025, so CAP for 2025 included a smaller "year-end fair value of awards granted in the covered year" component; (ii) following significant vesting activity during 2024, the population of prior-year unvested awards subject to mark-to-market adjustment in 2025 was smaller than in 2024, producing a smaller absolute-dollar fair-value change notwithstanding further share-price appreciation; and (iii) the average CAP paid to our non-PEO NEOs in 2025 was reduced by the approximately $1.1 million deduction associated with the forfeiture of unvested equity held by our former Chief Financial Officer upon her transition to consultant status on October 31, 2025.
Viewed over the full three-year measurement window, we believe CAP is generally reflective of our cumulative Total Shareholder Return, including our performance relative to our peer group, net income, and our adjusted pre-bonus net income, and reflects the intended linkage between long-term stockholder value creation and the realized and realizable compensation of our named executive officers. Because our equity grant cadence and the accounting-based fair-value methodology can introduce year-to-year volatility — including from one-time grants, the cliff vesting of sizable prior-year awards, and forfeitures — we believe the relationship between CAP and Company performance is best evaluated on a multi-year basis rather than on the basis of a single year's movement.
Relationship Between Pay and Performance
The following graphs illustrate the relationship between the Compensation Actually Paid to our PEO and the average Compensation Actually Paid to our other NEOs, and our cumulative total shareholder return, net income, and adjusted pre-bonus net income, our Company-Selected Measure, for fiscal years 2023, 2024, and 2025, as well as the relationship between our cumulative total shareholder return and the cumulative total shareholder return of our peer group over the same period.
Because our executive compensation program rewards our named executive officers primarily through long-term incentives in the form of stock option and restricted stock unit awards, Compensation Actually Paid ("CAP"), as calculated in accordance with Item 402(v) of Regulation S-K, is driven predominantly by the year-over-year change in the fair value of equity awards that are outstanding and unvested at fiscal year-end, or that vest during the covered year. As a result, CAP is highly sensitive to movements in our share price and to the timing of annual grants, vesting events, and any forfeitures, and may diverge materially from the totals reported in the Summary Compensation Table in any given year.
As of December 31, 2023, 2024, and 2025, the value of a $100 initial fixed investment on December 30, 2022, the last trading day of fiscal year 2022, was $192 (return of 92%), $2,394 (return of 2,294%) and $3,565 (return of 3,465%), respectively. Because our common stock was not listed on the Nasdaq Capital Market until August 2023, the starting value is based on the closing price of our CDIs on the ASX, as described in footnote 4 to the table above. Over the same period, the value of a $100 initial fixed investment in the KBW Nasdaq Financial Technology Index (total return), which we use as our peer group for this purpose, was $134 (return of 34%), $180 (return of 80%) and $181 (return of 81%), respectively. Our cumulative total shareholder return exceeded that of our peer group as of the end of each year in the measurement period. Our net income grew from $7.1 million in 2023 to $78.5 million in 2024, and $133.1 million in 2025. Adjusted Pre-Bonus Net Income, which we have identified as the most important financial performance measure used to link CAP to Company performance for 2025, and which is the primary measure used to fund our annual profit-sharing incentive plan, grew from $8.0 million in 2023 to $56.0 million in 2024 and $126.5 million in 2025. In 2023, CAP paid to our PEO, totaling $2.1 million, was generally in line with the Summary Compensation Table total of $1.9 million; similarly, the average CAP paid to our non-PEO NEOs totaled $1.2 million, generally in line with the Summary Compensation Table total of $1.1 million. CAP paid to our PEO and the average CAP paid to our non-PEO NEOs were meaningfully higher than the corresponding Summary Compensation Table totals in 2024 and 2025, reflecting continued appreciation in the fair value of previously granted unvested equity. CAP increased substantially from 2023 to 2024, consistent with the increase in our share price, net income, and adjusted pre-bonus net income over that period. From 2024 to 2025, however, CAP declined from $11.5 million to $5.5 million for our PEO and from $8.0 million to $1.9 million on average for our non-PEO NEOs. We believe this year-over-year decline reflects measurement dynamics specific to the CAP framework rather than a deterioration in Company performance, as Adjusted Pre-Bonus Net Income more than doubled over the same period: (i) aside from Mr. Sabzivand, no new equity awards were granted to our named executive officers during fiscal 2025, so CAP for 2025 included a smaller "year-end fair value of awards granted in the covered year" component; (ii) following significant vesting activity during 2024, the population of prior-year unvested awards subject to mark-to-market adjustment in 2025 was smaller than in 2024, producing a smaller absolute-dollar fair-value change notwithstanding further share-price appreciation; and (iii) the average CAP paid to our non-PEO NEOs in 2025 was reduced by the approximately $1.1 million deduction associated with the forfeiture of unvested equity held by our former Chief Financial Officer upon her transition to consultant status on October 31, 2025.
Viewed over the full three-year measurement window, we believe CAP is generally reflective of our cumulative Total Shareholder Return, including our performance relative to our peer group, net income, and our adjusted pre-bonus net income, and reflects the intended linkage between long-term stockholder value creation and the realized and realizable compensation of our named executive officers. Because our equity grant cadence and the accounting-based fair-value methodology can introduce year-to-year volatility — including from one-time grants, the cliff vesting of sizable prior-year awards, and forfeitures — we believe the relationship between CAP and Company performance is best evaluated on a multi-year basis rather than on the basis of a single year's movement.
| Most Important Measures to Determine Fiscal Year 2025 Compensation Actually Paid | ||
| Adjusted Pre-Bonus Net Income | ||
| Stock Price | ||