Pay Versus Performance Table (“PVP Table”)
| Value of Initial Fixed $100 Investment Based On: | ||||||||||||||||
| Year | Summary Compensation Table Total for PEO ($)(1)(2) | Compensation Actually Paid to PEO ($)(3) | Average Summary Compensation Table for Non-PEO NEOs ($)(1)(2) | Average Compensation Actually Paid to Non-PEO NEOs ($)(3) | Total Shareholder Return ($) | Peer Group Total Shareholder Return ($) | Net Income ($) (in millions) | Revenue ($) (in millions) | ||||||||
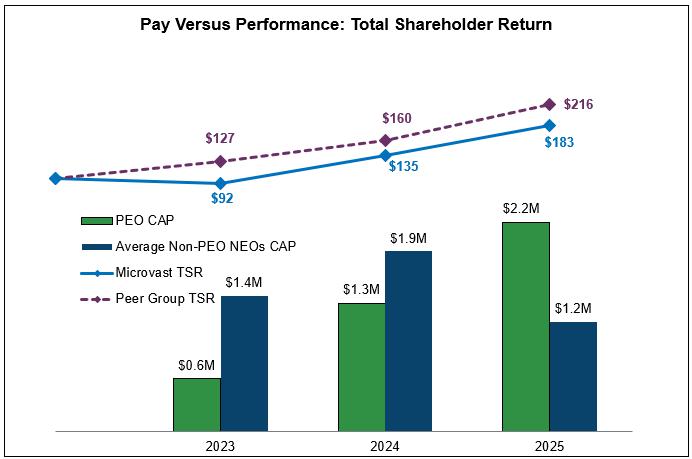
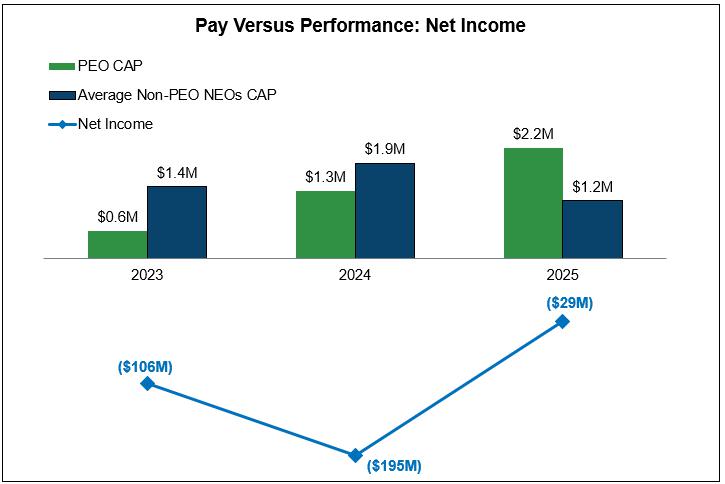
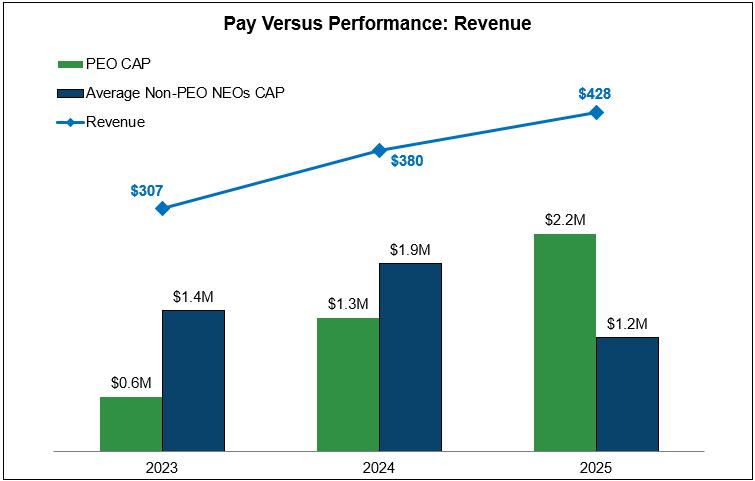
| 2025 | 3,775,310 | 2,197,717 | 916,591 | 1,152,592 | 183 | 216 | (29) | 428 | ||||||||
| 2024 | 1,141,226 | 1,349,785 | 1,241,315 | 1,895,256 | 135 | 160 | (195) | 380 | ||||||||
| 2023 | 649,008 | 554,345 | 1,506,396 | 1,425,089 | 92 | 127 | (106) | 307 | ||||||||
| (1) | For each of 2023, 2024 and 2025, the Chief Executive Officer in the compensation columns is Mr. Wu. For 2023, the NEOs in the compensation columns are Craig Webster, Zachariah Ward, and Shane Smith. For 2024, the NEOs in the compensation columns are Dr. Wu and Ms. Tushe. For 2025, the NEOs in the compensation columns are Mr. Worthen, Ms. Tushe, Dr. Wu, Dr. Mattis, Mr. Schultz, and Ms. Khanbabi. |
| (2) | Amounts reported in these columns represent (i) the total compensation reported in the Summary Compensation Table (“SCT”) for the applicable year for our PEO, Mr. Wu, and (ii) the average total compensation reported in the SCT for the applicable year for our Non-PEO NEOs. The 2024 SCT amounts previously reported were incorrectly calculated. The amounts previously reported were $1,141,207 for our PEO and $1,269,434 for our Non-PEO NEOs. |
| (3) | Amounts reported in these columns represent compensation actually paid; adjustments were made to the amounts reported in the Summary Compensation Table for the applicable year. A reconciliation of the adjustments for 2025 for Mr. Wu and for the average of the Non-PEO NEOs is set forth in the following table, which describes the adjustments, each of which is prescribed by the SEC rules, to calculate the CAP Amounts from SCT amounts. |
| 2025 | ||||||
| CEO | Average Non-PEO NEOs | |||||
| Summary Compensation Table Total | $3,775,310 | $916,591 | ||||
| Minus Stock Award Value & Option Award Value Reported in SCT for the Covered Year | $3,099,998 | $575,517 | ||||
| Plus Year End Fair Value of Equity Awards Granted During the Covered Year that Remain Outstanding and Unvested as of Last Day of the Covered Year | $1,522,405 | $212,959 | ||||
| Plus Year over Year Change in Fair Value as of the Last Day of the Covered Year of Outstanding and Unvested Equity Awards Granted in Prior Years | $0 | $219,068 | ||||
| Plus Fair Value as of Vesting Date of Equity Awards Granted and Vested in the Covered Year | $0 | $46,666 | ||||
| Plus Year over Year Change in Fair Value as of the Vesting Date of Equity Awards Granted in Prior Years that Vested During the Covered Year | $0 | $332,824 | ||||
| Minus Fair Value at the End of the Prior Year of Equity Awards that Failed to Meet Vesting Conditions in the Covered or were Forfeited During the Covered Year | $0 | $0 | ||||
| Plus Value of Dividends or other Earnings Paid on Stock or Option Awards Not Otherwise Reflected in Fair Value or Total Compensation for the Covered Year | $0 | $0 | ||||
| Compensation Actually Paid | $2,197,717 | $1,152,592 | ||||
In the table above, the unvested equity values are computed in accordance with the methodology used for financial reporting purposes, and for unvested awards subject to performance-based vesting conditions, based on the probable outcome of such performance-based vesting conditions as of the last day of the year.
| (4) | We selected the Russell 2000 Electrical Components Subsector Index (referred to herein as the “Peer Group”) as our peer group for purposes of this disclosure. |
| (5) | We have selected Revenue as the as the company-selected measure for the pay versus performance disclosure, representing the most important financial performance measure used to link compensation actually paid to the PEO and the other NEOs in Fiscal 2025 to the Company’s performance. |
Pay Versus Performance: Total Shareholder Return $127 $160 $216 $92 $135 $183 PEO CAP Average Non-PEO NEOs CAP Microvast TSR Peer Group TSR $0.6M $1.4M $1.3M $1.9M $2.2M $1.2M 2023 2024 2025
Pay Versus Performance: Net Income PEO CAP Average Non-PEO NEOs CAP Net Income $0.6M $1.4M $1.3M $1.9M $2.2M $1.2M 2023 2024 2025 ($106M) ($195M) ($29M)
| (1) | For each of 2023, 2024 and 2025, the Chief Executive Officer in the compensation columns is Mr. Wu. For 2023, the NEOs in the compensation columns are Craig Webster, Zachariah Ward, and Shane Smith. For 2024, the NEOs in the compensation columns are Dr. Wu and Ms. Tushe. For 2025, the NEOs in the compensation columns are Mr. Worthen, Ms. Tushe, Dr. Wu, Dr. Mattis, Mr. Schultz, and Ms. Khanbabi. |
| (2) | Amounts reported in these columns represent (i) the total compensation reported in the Summary Compensation Table (“SCT”) for the applicable year for our PEO, Mr. Wu, and (ii) the average total compensation reported in the SCT for the applicable year for our Non-PEO NEOs. The 2024 SCT amounts previously reported were incorrectly calculated. The amounts previously reported were $1,141,207 for our PEO and $1,269,434 for our Non-PEO NEOs. |
| (4) | We selected the Russell 2000 Electrical Components Subsector Index (referred to herein as the “Peer Group”) as our peer group for purposes of this disclosure. |
| (3) | Amounts reported in these columns represent compensation actually paid; adjustments were made to the amounts reported in the Summary Compensation Table for the applicable year. A reconciliation of the adjustments for 2025 for Mr. Wu and for the average of the Non-PEO NEOs is set forth in the following table, which describes the adjustments, each of which is prescribed by the SEC rules, to calculate the CAP Amounts from SCT amounts. |
| 2025 | ||||||
| CEO | Average Non-PEO NEOs | |||||
| Summary Compensation Table Total | $3,775,310 | $916,591 | ||||
| Minus Stock Award Value & Option Award Value Reported in SCT for the Covered Year | $3,099,998 | $575,517 | ||||
| Plus Year End Fair Value of Equity Awards Granted During the Covered Year that Remain Outstanding and Unvested as of Last Day of the Covered Year | $1,522,405 | $212,959 | ||||
| Plus Year over Year Change in Fair Value as of the Last Day of the Covered Year of Outstanding and Unvested Equity Awards Granted in Prior Years | $0 | $219,068 | ||||
| Plus Fair Value as of Vesting Date of Equity Awards Granted and Vested in the Covered Year | $0 | $46,666 | ||||
| Plus Year over Year Change in Fair Value as of the Vesting Date of Equity Awards Granted in Prior Years that Vested During the Covered Year | $0 | $332,824 | ||||
| Minus Fair Value at the End of the Prior Year of Equity Awards that Failed to Meet Vesting Conditions in the Covered or were Forfeited During the Covered Year | $0 | $0 | ||||
| Plus Value of Dividends or other Earnings Paid on Stock or Option Awards Not Otherwise Reflected in Fair Value or Total Compensation for the Covered Year | $0 | $0 | ||||
| Compensation Actually Paid | $2,197,717 | $1,152,592 | ||||
In the table above, the unvested equity values are computed in accordance with the methodology used for financial reporting purposes, and for unvested awards subject to performance-based vesting conditions, based on the probable outcome of such performance-based vesting conditions as of the last day of the year.
List of Most Important Financial Performance Measures for Fiscal Year 2025
As described in greater detail in “—Compensation Discussion and Analysis,” the Company’s executive compensation program reflects a commitment to pay-for-performance. Listed below are the financial performance measures which in our assessment represent the most important performance measures we used to link compensation actually paid to our NEOs, for Fiscal 2025, to Company performance.
| Accounts Receivable Collection | ||||
| Operating Profit Margin | ||||
| Revenue |