Shareholder Report
Jul. 31, 2026
USD ($)
$ / shares
https://angeloakcapital.com/resources/. You can also request this information by contacting us at 1-855-751-4324.
WHAT WERE THE FUND COSTS FOR THE LAST SIX MONTHS? (based on a hypothetical $10,000 investment)
|
Class Name
|
Costs of a $10,000 investment
|
Costs paid as a percentage of a $10,000 investment*
|
|
Class A
|
$73
|
1.46%
|
HOW DID THE FUND PERFORM DURING THE PERIOD?
The Fund’s Class A shares returned 1.79%, excluding sales charges, for the six-month period ended July 31, 2026. The Fund outperformed its benchmark, the Bloomberg U.S. Aggregate Bond Index, by 259 basis points. The benchmark returned -0.80% during the same period.
WHAT FACTORS INFLUENCED PERFORMANCE?
The Fund benefited from higher current income, shorter-duration positioning, lower exposure to corporate credit, and spread outperformance across its credit allocations, particularly in non-agency residential mortgage-backed securities (RMBS) and asset-backed securities (ABS). The Fund’s agency RMBS positions were the primary detractor from performance.
HOW WAS THE FUND POSITIONED DURING THE PERIOD?
The Fund increased its allocations to agency RMBS and collateralized loan obligations (CLOs) to capitalize on attractive market opportunities as CLO valuations became increasingly compelling. In addition, the Fund decreased its allocations to non-agency RMBS and agency commercial mortgage-backed securities to enhance overall portfolio diversification.
|
Top Contributors
|
|
|
↑
|
Non-Agency RMBS
|
|
↑
|
ABS
|
|
Top Detractors
|
|
|
↓
|
Agency RMBS
|
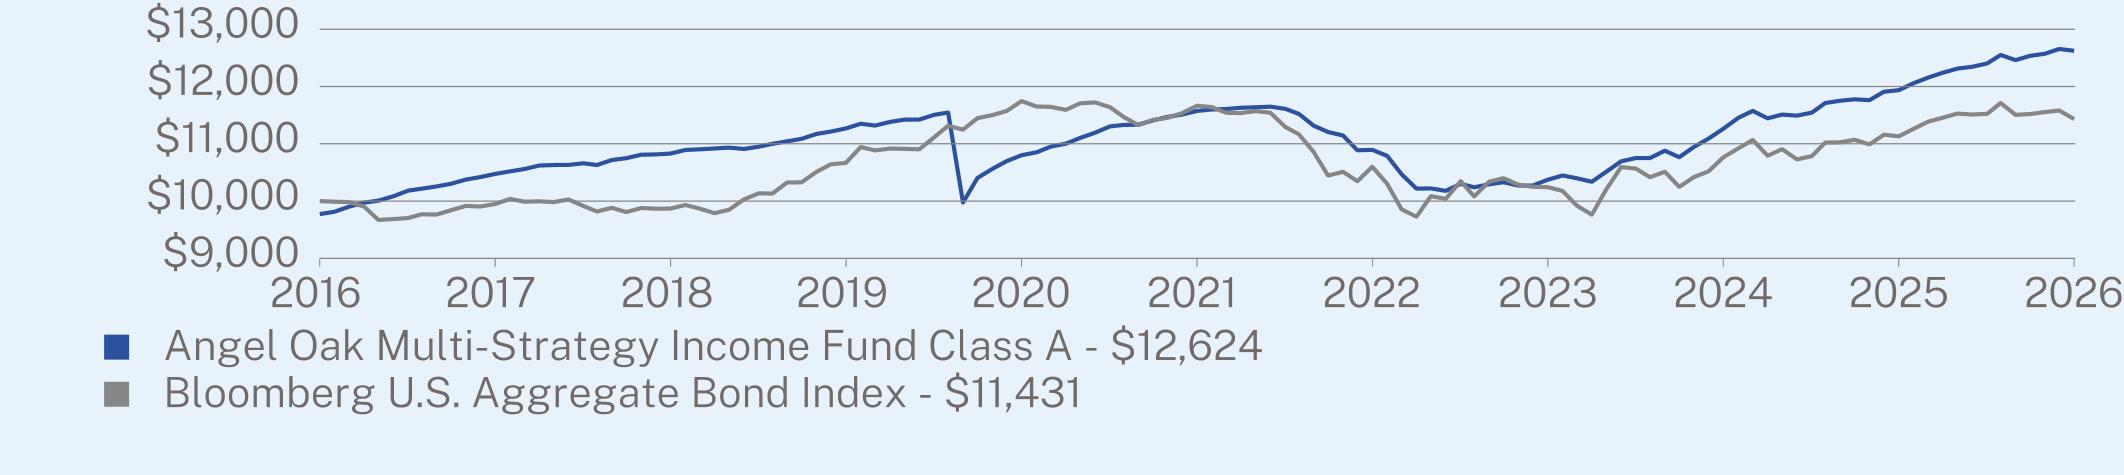
ANNUAL AVERAGE TOTAL RETURN (%)
|
|
1 Year
|
5 Year
|
10 Year
|
|
Class A (without sales charge)
|
5.77
|
1.75
|
2.59
|
|
Class A (with maximum 2.25% sales charge)
|
3.39
|
1.29
|
2.36
|
|
Bloomberg U.S. Aggregate Bond Index
|
2.71
|
-0.40
|
1.35
|
https://angeloakcapital.com/investments/ for more recent performance information.
KEY FUND STATISTICS (as of July 31, 2026)
|
Net Assets
|
$2,501,155,649
|
Effective Duration
|
4.00 years
|
|
|
Number of Holdings
|
1,048
|
30-Day SEC Yield (Class A)
|
6.18%
|
|
|
Net Advisory Fee
|
$11,098,585
|
30-Day SEC Yield Unsubsidized (Class A)
|
6.18%
|
|
|
Portfolio Turnover
|
27%
|
Weighted Average Life
|
6.36 years
|
|
|
Average Credit Quality
|
BBB
|
Distribution Yield (Class A)
|
5.27%
|
WHAT DID THE FUND INVEST IN? (as of July 31, 2026)
Top Security Types (% of net assets)
|
Residential Mortgage-Backed Securities
|
38.3
|
%
|
|
Residential Mortgage-Backed Securities - U.S. Government Agency
|
16.8
|
%
|
|
Asset-Backed Securities
|
13.2
|
%
|
|
Corporate Obligations
|
12.4
|
%
|
|
Collateralized Loan Obligations
|
9.7
|
%
|
|
Commercial Mortgage-Backed Securities
|
3.7
|
%
|
|
Commercial Mortgage-Backed Securities - U.S. Government Agency
|
3.3
|
%
|
|
Residential Whole Loans
|
2.7
|
%
|
|
Exchange Traded Funds
|
1.2
|
%
|
|
Cash & Other
|
-1.3
|
%
|
Top 10 Holdings (% of net assets)
|
Saluda Grade Alternative Mortgage Trust, Series 2022-SEQ2, Class CERT
|
1.4
|
%
|
|
Federal Home Loan Mortgage Corp.
|
1.4
|
%
|
|
Goldman Sachs Mortgage Pass-Through Trust, Series 2022-1, Class PT
|
1.4
|
%
|
|
Invesco Senior Loan ETF
|
1.0
|
%
|
|
First American Government Obligations Fund - Class U
|
1.0
|
%
|
|
Federal Home Loan Mortgage Corp., Pool SD8506
|
1.0
|
%
|
|
DSLA Mortgage Loan Trust, Series 2007-AR1, Class 1A1A
|
0.9
|
%
|
|
Federal National Mortgage Association, Pool DC4050
|
0.8
|
%
|
|
Federal National Mortgage Association, Pool MA5910
|
0.7
|
%
|
|
Federal National Mortgage Association, Pool MA5646
|
0.7
|
%
|
Credit Ratings Breakdown (% of net assets)*
|
AAA
|
3.7
|
%
|
|
AA
|
23.9
|
%
|
|
A
|
5.3
|
%
|
|
BBB
|
14.9
|
%
|
|
BB
|
20.7
|
%
|
|
B
|
6.6
|
%
|
|
CCC
|
2.1
|
%
|
|
CC
|
0.1
|
%
|
|
NR
|
22.7
|
%
|
https://angeloakcapital.com/resources/. You can also request this information by contacting us at 1-855-751-4324.
WHAT WERE THE FUND COSTS FOR THE LAST SIX MONTHS? (based on a hypothetical $10,000 investment)
|
Class Name
|
Costs of a $10,000 investment
|
Costs paid as a percentage of a $10,000 investment*
|
|
Class C
|
$110
|
2.21%
|
HOW DID THE FUND PERFORM DURING THE PERIOD?
The Fund’s Class C shares returned 1.33%, excluding sales charges, for the six-month period ended July 31, 2026. The Fund outperformed its benchmark, the Bloomberg U.S. Aggregate Bond Index, by 213 basis points. The benchmark returned -0.80% during the same period.
WHAT FACTORS INFLUENCED PERFORMANCE?
The Fund benefited from higher current income, shorter-duration positioning, lower exposure to corporate credit, and spread outperformance across its credit allocations, particularly in non-agency residential mortgage-backed securities (RMBS) and asset-backed securities (ABS). The Fund’s agency RMBS positions were the primary detractor from performance.
HOW WAS THE FUND POSITIONED DURING THE PERIOD?
The Fund increased its allocations to agency RMBS and collateralized loan obligations (CLOs) to capitalize on attractive market opportunities as CLO valuations became increasingly compelling. In addition, the Fund decreased its allocations to non-agency RMBS and agency commercial mortgage-backed securities to enhance overall portfolio diversification.
|
Top Contributors
|
|
|
↑
|
Non-Agency RMBS
|
|
↑
|
ABS
|
|
Top Detractors
|
|
|
↓
|
Agency RMBS
|
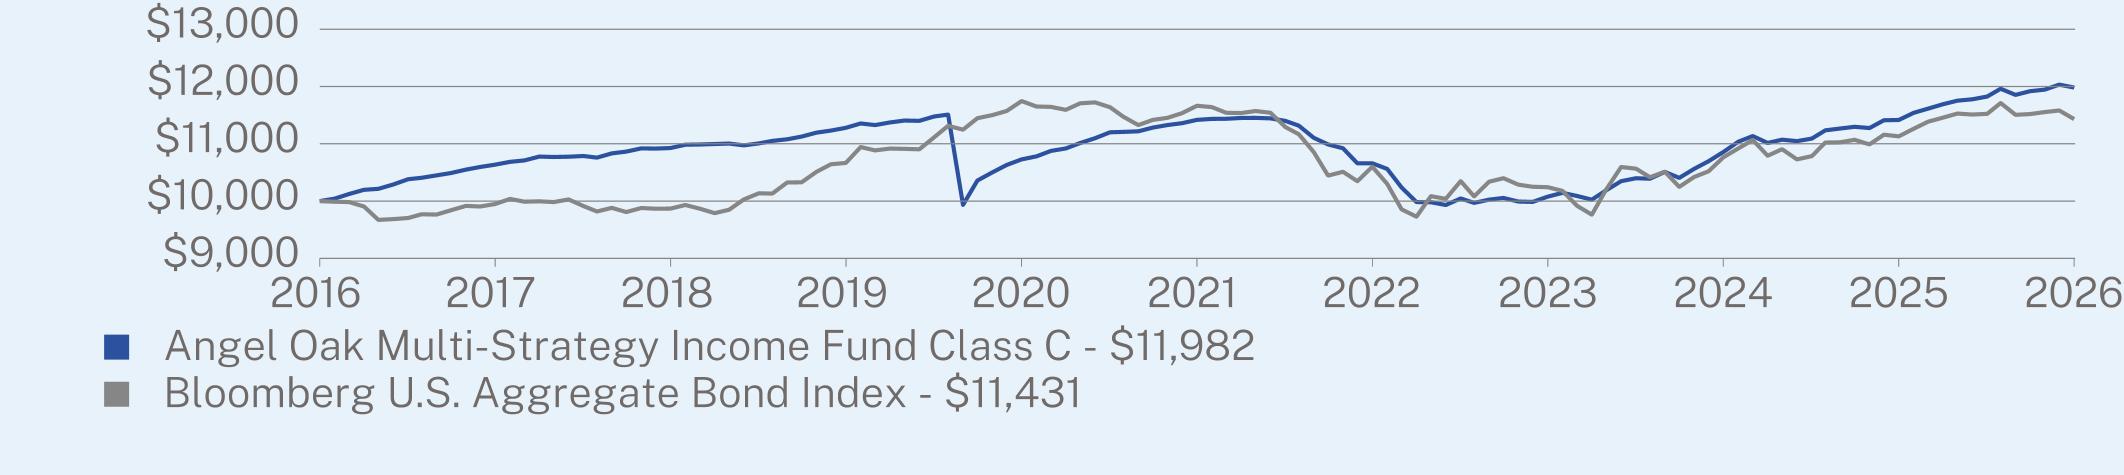
ANNUAL AVERAGE TOTAL RETURN (%)
|
|
1 Year
|
5 Year
|
10 Year
|
|
Class C (without sales charge)
|
4.96
|
0.97
|
1.82
|
|
Class C (with maximum 1.00% deferred sales charge)
|
3.96
|
0.97
|
1.82
|
|
Bloomberg U.S. Aggregate Bond Index
|
2.71
|
-0.40
|
1.35
|
https://angeloakcapital.com/investments/ for more recent performance information.
KEY FUND STATISTICS (as of July 31, 2026)
|
Net Assets
|
$2,501,155,649
|
Effective Duration
|
4.00 years
|
|
|
Number of Holdings
|
1,048
|
30-Day SEC Yield (Class C)
|
5.57%
|
|
|
Net Advisory Fee
|
$11,098,585
|
30-Day SEC Yield Unsubsidized (Class C)
|
5.56%
|
|
|
Portfolio Turnover
|
27%
|
Weighted Average Life
|
6.36 years
|
|
|
Average Credit Quality
|
BBB
|
Distribution Yield (Class C)
|
4.60%
|
WHAT DID THE FUND INVEST IN? (as of July 31, 2026)
Top Security Types (% of net assets)
|
Residential Mortgage-Backed Securities
|
38.3
|
%
|
|
Residential Mortgage-Backed Securities - U.S. Government Agency
|
16.8
|
%
|
|
Asset-Backed Securities
|
13.2
|
%
|
|
Corporate Obligations
|
12.4
|
%
|
|
Collateralized Loan Obligations
|
9.7
|
%
|
|
Commercial Mortgage-Backed Securities
|
3.7
|
%
|
|
Commercial Mortgage-Backed Securities - U.S. Government Agency
|
3.3
|
%
|
|
Residential Whole Loans
|
2.7
|
%
|
|
Exchange Traded Funds
|
1.2
|
%
|
|
Cash & Other
|
-1.3
|
%
|
Top 10 Holdings (% of net assets)
|
Saluda Grade Alternative Mortgage Trust, Series 2022-SEQ2, Class CERT
|
1.4
|
%
|
|
Federal Home Loan Mortgage Corp.
|
1.4
|
%
|
|
Goldman Sachs Mortgage Pass-Through Trust, Series 2022-1, Class PT
|
1.4
|
%
|
|
Invesco Senior Loan ETF
|
1.0
|
%
|
|
First American Government Obligations Fund - Class U
|
1.0
|
%
|
|
Federal Home Loan Mortgage Corp., Pool SD8506
|
1.0
|
%
|
|
DSLA Mortgage Loan Trust, Series 2007-AR1, Class 1A1A
|
0.9
|
%
|
|
Federal National Mortgage Association, Pool DC4050
|
0.8
|
%
|
|
Federal National Mortgage Association, Pool MA5910
|
0.7
|
%
|
|
Federal National Mortgage Association, Pool MA5646
|
0.7
|
%
|
Credit Ratings Breakdown (% of net assets)*
|
AAA
|
3.7
|
%
|
|
AA
|
23.9
|
%
|
|
A
|
5.3
|
%
|
|
BBB
|
14.9
|
%
|
|
BB
|
20.7
|
%
|
|
B
|
6.6
|
%
|
|
CCC
|
2.1
|
%
|
|
CC
|
0.1
|
%
|
|
NR
|
22.7
|
%
|
https://angeloakcapital.com/resources/. You can also request this information by contacting us at 1-855-751-4324.
WHAT WERE THE FUND COSTS FOR THE LAST SIX MONTHS? (based on a hypothetical $10,000 investment)
|
Class Name
|
Costs of a $10,000 investment
|
Costs paid as a percentage of a $10,000 investment*
|
|
Institutional Class
|
$61
|
1.21%
|
HOW DID THE FUND PERFORM DURING THE PERIOD?
The Fund’s Institutional Class shares returned 1.80% for the six-month period ended July 31, 2026. The Fund outperformed its benchmark, the Bloomberg U.S. Aggregate Bond Index, by 260 basis points. The benchmark returned -0.80% during the same period.
WHAT FACTORS INFLUENCED PERFORMANCE?
The Fund benefited from higher current income, shorter-duration positioning, lower exposure to corporate credit, and spread outperformance across its credit allocations, particularly in non-agency residential mortgage-backed securities (RMBS) and asset-backed securities (ABS). The Fund’s agency RMBS positions were the primary detractor from performance.
HOW WAS THE FUND POSITIONED DURING THE PERIOD?
The Fund increased its allocations to agency RMBS and collateralized loan obligations (CLOs) to capitalize on attractive market opportunities as CLO valuations became increasingly compelling. In addition, the Fund decreased its allocations to non-agency RMBS and agency commercial mortgage-backed securities to enhance overall portfolio diversification.
|
Top Contributors
|
|
|
↑
|
Non-Agency RMBS
|
|
↑
|
ABS
|
|
Top Detractors
|
|
|
↓
|
Agency RMBS
|
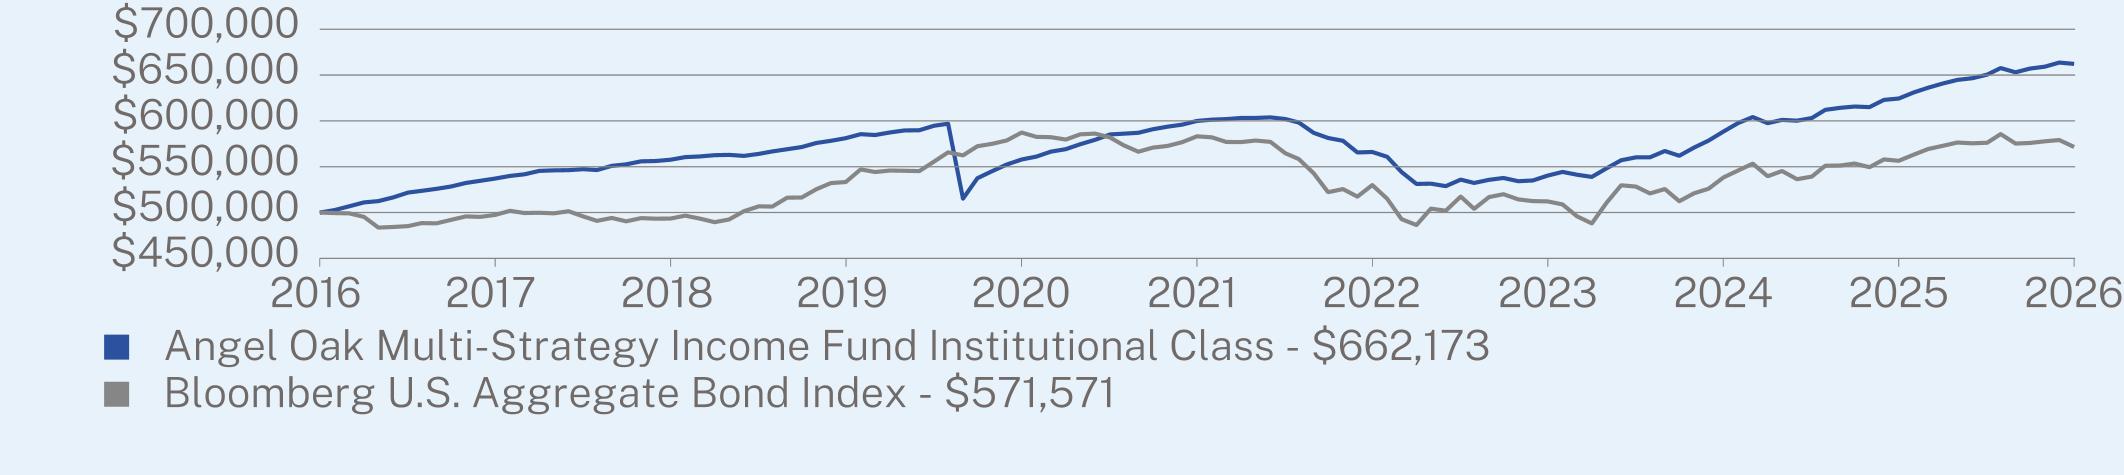
ANNUAL AVERAGE TOTAL RETURN (%)
|
|
1 Year
|
5 Year
|
10 Year
|
|
Institutional Class
|
6.05
|
1.99
|
2.85
|
|
Bloomberg U.S. Aggregate Bond Index
|
2.71
|
-0.40
|
1.35
|
https://angeloakcapital.com/investments/ for more recent performance information.
KEY FUND STATISTICS (as of July 31, 2026)
|
Net Assets
|
$2,501,155,649
|
Effective Duration
|
4.00 years
|
|
|
Number of Holdings
|
1,048
|
30-Day SEC Yield (Institutional Class)
|
6.58%
|
|
|
Net Advisory Fee
|
$11,098,585
|
30-Day SEC Yield Unsubsidized (Institutional Class)
|
6.58%
|
|
|
Portfolio Turnover
|
27%
|
Weighted Average Life
|
6.36 years
|
|
|
Average Credit Quality
|
BBB
|
Distribution Yield (Institutional Class)
|
5.54%
|
WHAT DID THE FUND INVEST IN? (as of July 31, 2026)
Top Security Types (% of net assets)
|
Residential Mortgage-Backed Securities
|
38.3
|
%
|
|
Residential Mortgage-Backed Securities - U.S. Government Agency
|
16.8
|
%
|
|
Asset-Backed Securities
|
13.2
|
%
|
|
Corporate Obligations
|
12.4
|
%
|
|
Collateralized Loan Obligations
|
9.7
|
%
|
|
Commercial Mortgage-Backed Securities
|
3.7
|
%
|
|
Commercial Mortgage-Backed Securities - U.S. Government Agency
|
3.3
|
%
|
|
Residential Whole Loans
|
2.7
|
%
|
|
Exchange Traded Funds
|
1.2
|
%
|
|
Cash & Other
|
-1.3
|
%
|
Top 10 Holdings (% of net assets)
|
Saluda Grade Alternative Mortgage Trust, Series 2022-SEQ2, Class CERT
|
1.4
|
%
|
|
Federal Home Loan Mortgage Corp.
|
1.4
|
%
|
|
Goldman Sachs Mortgage Pass-Through Trust, Series 2022-1, Class PT
|
1.4
|
%
|
|
Invesco Senior Loan ETF
|
1.0
|
%
|
|
First American Government Obligations Fund - Class U
|
1.0
|
%
|
|
Federal Home Loan Mortgage Corp., Pool SD8506
|
1.0
|
%
|
|
DSLA Mortgage Loan Trust, Series 2007-AR1, Class 1A1A
|
0.9
|
%
|
|
Federal National Mortgage Association, Pool DC4050
|
0.8
|
%
|
|
Federal National Mortgage Association, Pool MA5910
|
0.7
|
%
|
|
Federal National Mortgage Association, Pool MA5646
|
0.7
|
%
|
Credit Ratings Breakdown (% of net assets)*
|
AAA
|
3.7
|
%
|
|
AA
|
23.9
|
%
|
|
A
|
5.3
|
%
|
|
BBB
|
14.9
|
%
|
|
BB
|
20.7
|
%
|
|
B
|
6.6
|
%
|
|
CCC
|
2.1
|
%
|
|
CC
|
0.1
|
%
|
|
NR
|
22.7
|
%
|
https://angeloakcapital.com/resources/. You can also request this information by contacting us at 1-855-751-4324.
WHAT WERE THE FUND COSTS FOR THE LAST SIX MONTHS? (based on a hypothetical $10,000 investment)
|
Class Name
|
Costs of a $10,000 investment
|
Costs paid as a percentage of a $10,000 investment*
|
|
Class A
|
$30
|
0.60%
|
HOW DID THE FUND PERFORM DURING THE PERIOD?
The Fund’s Class A shares returned 1.81% for the six-month period ended July 31, 2026. The Fund outperformed its performance benchmarks, the Bloomberg Short Treasury: 9-12 Months Index and the Bloomberg Short-Term Government/Corporate Index, by 31 basis points (bps) and 9 bps, respectively. The performance benchmarks returned 1.50% and 1.72%, respectively, during the same period.
WHAT FACTORS INFLUENCED PERFORMANCE?
The Fund outperformed both performance benchmarks, driven by overweight allocations to investment-grade (IG) corporate bonds, asset-backed securities (ABS), non-agency residential mortgage-backed securities, and collateralized loan obligations (CLOs). Higher income, stronger yields, and credit rating upgrades across these sectors further supported relative performance. Duration positioning also contributed as short-term Treasury yields declined.
HOW WAS THE FUND POSITIONED DURING THE PERIOD?
The Fund maintained an overweight allocation to securitized credit, increasing allocations to IG corporate bonds, agency commercial mortgage-backed securities, and CLOs while reducing exposure to ABS. Overall, the Fund increased diversification, credit quality, and liquidity during the period.
|
Top Contributors
|
|
|
↑
|
High Income Relative to Performance Benchmarks
|
|
↑
|
IG Securitized Credit
|
|
Top Detractors
|
|
|
↓
|
Cash and Government Allocations with Lower Yield Relative to Credit Sectors
|
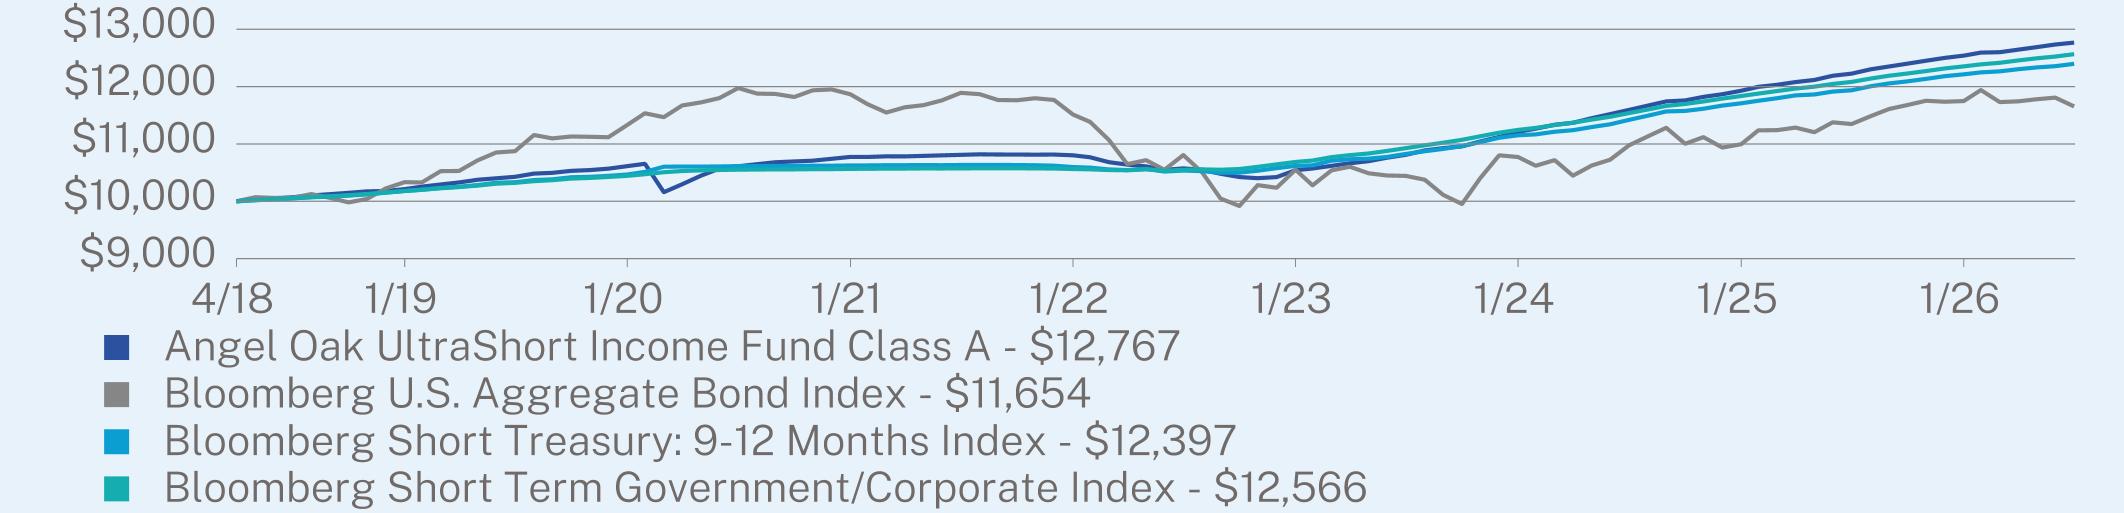
ANNUAL AVERAGE TOTAL RETURN (%)
|
|
1 Year
|
5 Year
|
Since Inception
(04/30/2018) |
|
Class A
|
4.42
|
3.38
|
3.00
|
|
Bloomberg U.S. Aggregate Bond Index
|
2.71
|
-0.40
|
1.87
|
|
Bloomberg Short Treasury: 9-12 Months Index
|
3.86
|
3.12
|
2.64
|
|
Bloomberg Short Term Government/Corporate Index
|
4.00
|
3.51
|
2.81
|
https://angeloakcapital.com/investments/ for more recent performance information.
KEY FUND STATISTICS (as of July 31, 2026)
|
Net Assets
|
$813,005,437
|
Effective Duration
|
0.87 years
|
|
|
Number of Holdings
|
450
|
30-Day SEC Yield (Class A)
|
4.22%
|
|
|
Net Advisory Fee
|
$1,015,284
|
30-Day SEC Yield Unsubsidized (Class A)
|
4.04%
|
|
|
Portfolio Turnover
|
37%
|
Weighted Average Life
|
1.60 years
|
|
|
Average Credit Quality
|
A
|
Distribution Yield (Class A)
|
4.31%
|
WHAT DID THE FUND INVEST IN? (as of July 31, 2026)
Top Security Types (% of net assets)
|
Corporate Obligations
|
23.0
|
%
|
|
Asset-Backed Securities
|
21.6
|
%
|
|
Commercial Mortgage-Backed Securities - U.S. Government Agency
|
21.1
|
%
|
|
Collateralized Loan Obligations
|
16.2
|
%
|
|
Residential Mortgage-Backed Securities
|
13.6
|
%
|
|
Money Market Funds
|
5.9
|
%
|
|
Commercial Mortgage-Backed Securities
|
2.1
|
%
|
|
Residential Mortgage-Backed Securities - U.S. Government Agency Credit Risk Transfer
|
0.5
|
%
|
|
Futures Contracts
|
0.1
|
%
|
|
Cash & Other
|
-4.1
|
%
|
Top 10 Holdings (% of net assets)
|
First American Government Obligations Fund - Class U
|
5.9
|
%
|
|
Federal Home Loan Mortgage Corp., Series KF173, Class AS
|
2.0
|
%
|
|
Bain Capital Credit CLO Ltd., Series 2020-5A, Class ARR
|
1.3
|
%
|
|
Federal Home Loan Mortgage Corp., Series KF99, Class AS
|
1.0
|
%
|
|
Federal Home Loan Mortgage Corp., Series K-F102, Class AS
|
1.0
|
%
|
|
Federal Home Loan Mortgage Corp., Series KF134, Class AS
|
1.0
|
%
|
|
Pretium Mortgage Credit Partners LLC, Series 2026-RN2, Class A1
|
0.8
|
%
|
|
BCRED MML CLO LLC, Series 2022-1A, Class A1
|
0.8
|
%
|
|
Golub Capital LLC, Series 2022-1A, Class BR
|
0.8
|
%
|
|
Federal Home Loan Mortgage Corp., Series K-F121, Class AS
|
0.8
|
%
|
Credit Ratings Breakdown (% of net assets)*
|
AAA
|
25.8
|
%
|
|
AA
|
31.8
|
%
|
|
A
|
10.3
|
%
|
|
BBB
|
21.3
|
%
|
|
BB
|
3.8
|
%
|
|
B
|
0.2
|
%
|
|
NR
|
6.8
|
%
|
https://angeloakcapital.com/resources/. You can also request this information by contacting us at 1-855-751-4324.
WHAT WERE THE FUND COSTS FOR THE LAST SIX MONTHS? (based on a hypothetical $10,000 investment)
|
Class Name
|
Costs of a $10,000 investment
|
Costs paid as a percentage of a $10,000 investment*
|
|
Class A1
|
$30
|
0.60%
|
HOW DID THE FUND PERFORM DURING THE PERIOD?
The Fund’s Class A1 shares returned 1.79%, excluding sales charges, for the six-month period ended July 31, 2026. The Fund outperformed its performance benchmarks, the Bloomberg Short Treasury: 9-12 Months Index and the Bloomberg Short-Term Government/Corporate Index, by 29 basis points (bps) and 7 bps, respectively. The performance benchmarks returned 1.50% and 1.72%, respectively, during the same period.
WHAT FACTORS INFLUENCED PERFORMANCE?
The Fund outperformed both performance benchmarks, driven by overweight allocations to investment-grade (IG) corporate bonds, asset-backed securities (ABS), non-agency residential mortgage-backed securities, and collateralized loan obligations (CLOs). Higher income, stronger yields, and credit rating upgrades across these sectors further supported relative performance. Duration positioning also contributed as short-term Treasury yields declined.
HOW WAS THE FUND POSITIONED DURING THE PERIOD?
The Fund maintained an overweight allocation to securitized credit, increasing allocations to IG corporate bonds, agency commercial mortgage-backed securities, and CLOs while reducing exposure to ABS. Overall, the Fund increased diversification, credit quality, and liquidity during the period.
|
Top Contributors
|
|
|
↑
|
High Income Relative to Performance Benchmarks
|
|
↑
|
IG Securitized Credit
|
|
Top Detractors
|
|
|
↓
|
Cash and Government Allocations with Lower Yield Relative to Credit Sectors
|
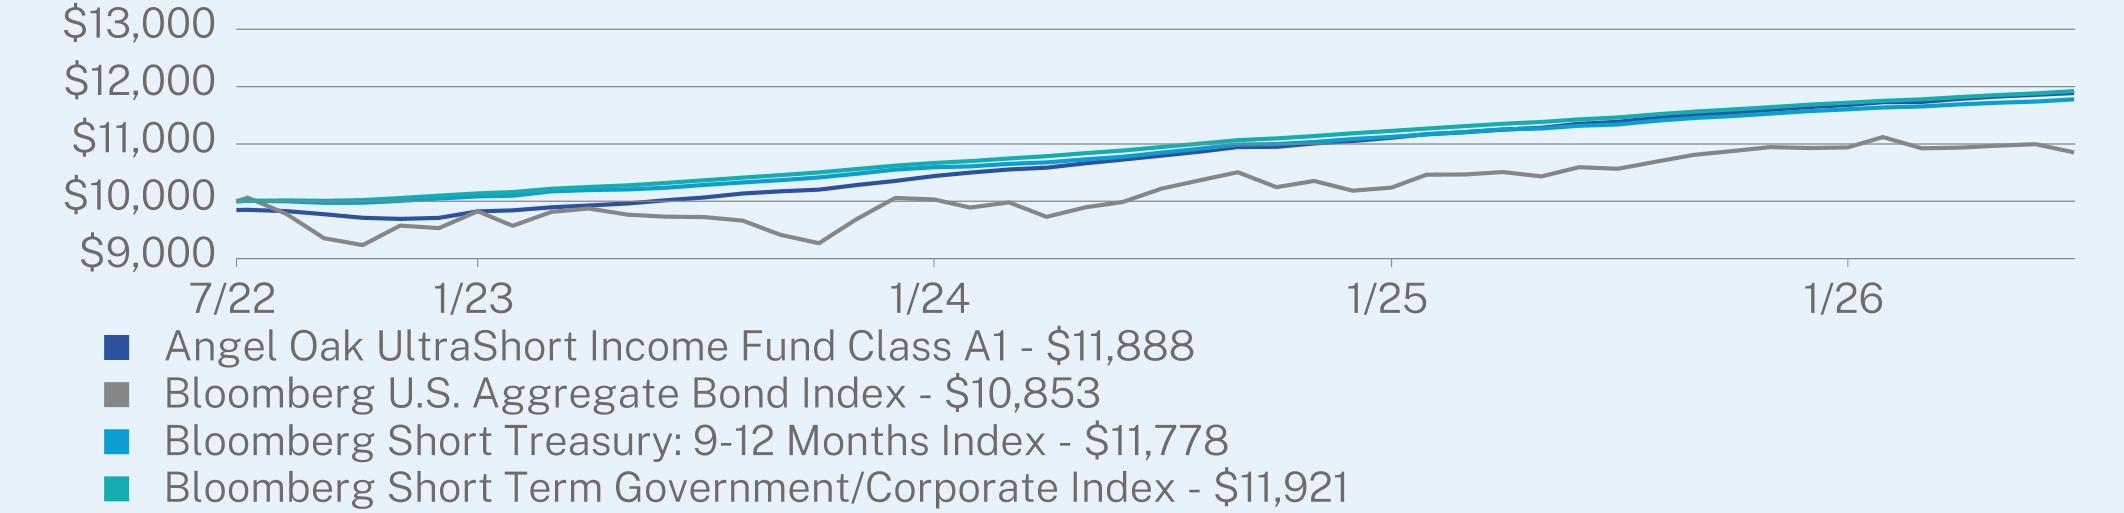
ANNUAL AVERAGE TOTAL RETURN (%)
|
|
1 Year
|
Since Inception
(07/22/2022) |
|
Class A1 (without sales charge)
|
4.41
|
4.79
|
|
Class A1 (with maximum 1.50% sales charge)
|
2.35
|
4.39
|
|
Bloomberg U.S. Aggregate Bond Index
|
2.71
|
2.05
|
|
Bloomberg Short Treasury: 9-12 Months Index
|
3.86
|
4.15
|
|
Bloomberg Short Term Government/Corporate Index
|
4.00
|
4.46
|
https://angeloakcapital.com/investments/ for more recent performance information.
KEY FUND STATISTICS (as of July 31, 2026)
|
Net Assets
|
$813,005,437
|
Effective Duration
|
0.87 years
|
|
|
Number of Holdings
|
450
|
30-Day SEC Yield (Class A1)
|
4.34%
|
|
|
Net Advisory Fee
|
$1,015,284
|
30-Day SEC Yield Unsubsidized (Class A1)
|
4.16%
|
|
|
Portfolio Turnover
|
37%
|
Weighted Average Life
|
1.60 years
|
|
|
Average Credit Quality
|
A
|
Distribution Yield (Class A1)
|
4.31%
|
WHAT DID THE FUND INVEST IN? (as of July 31, 2026)
Top Security Types (% of net assets)
|
Corporate Obligations
|
23.0
|
%
|
|
Asset-Backed Securities
|
21.6
|
%
|
|
Commercial Mortgage-Backed Securities - U.S. Government Agency
|
21.1
|
%
|
|
Collateralized Loan Obligations
|
16.2
|
%
|
|
Residential Mortgage-Backed Securities
|
13.6
|
%
|
|
Money Market Funds
|
5.9
|
%
|
|
Commercial Mortgage-Backed Securities
|
2.1
|
%
|
|
Residential Mortgage-Backed Securities - U.S. Government Agency Credit Risk Transfer
|
0.5
|
%
|
|
Futures Contracts
|
0.1
|
%
|
|
Cash & Other
|
-4.1
|
%
|
Top 10 Holdings (% of net assets)
|
First American Government Obligations Fund - Class U
|
5.9
|
%
|
|
Federal Home Loan Mortgage Corp., Series KF173, Class AS
|
2.0
|
%
|
|
Bain Capital Credit CLO Ltd., Series 2020-5A, Class ARR
|
1.3
|
%
|
|
Federal Home Loan Mortgage Corp., Series KF99, Class AS
|
1.0
|
%
|
|
Federal Home Loan Mortgage Corp., Series K-F102, Class AS
|
1.0
|
%
|
|
Federal Home Loan Mortgage Corp., Series KF134, Class AS
|
1.0
|
%
|
|
Pretium Mortgage Credit Partners LLC, Series 2026-RN2, Class A1
|
0.8
|
%
|
|
BCRED MML CLO LLC, Series 2022-1A, Class A1
|
0.8
|
%
|
|
Golub Capital LLC, Series 2022-1A, Class BR
|
0.8
|
%
|
|
Federal Home Loan Mortgage Corp., Series K-F121, Class AS
|
0.8
|
%
|
Credit Ratings Breakdown (% of net assets)*
|
AAA
|
25.8
|
%
|
|
AA
|
31.8
|
%
|
|
A
|
10.3
|
%
|
|
BBB
|
21.3
|
%
|
|
BB
|
3.8
|
%
|
|
B
|
0.2
|
%
|
|
NR
|
6.8
|
%
|
https://angeloakcapital.com/resources/. You can also request this information by contacting us at 1-855-751-4324.
WHAT WERE THE FUND COSTS FOR THE LAST SIX MONTHS? (based on a hypothetical $10,000 investment)
|
Class Name
|
Costs of a $10,000 investment
|
Costs paid as a percentage of a $10,000 investment*
|
|
Institutional Class
|
$18
|
0.35%
|
HOW DID THE FUND PERFORM DURING THE PERIOD?
The Fund’s Institutional Class shares returned 1.94% for the six-month period ended July 31, 2026. The Fund outperformed its performance benchmarks, the Bloomberg Short Treasury: 9-12 Months Index and the Bloomberg Short-Term Government/Corporate Index, by 44 basis points (bps) and 22 bps, respectively. The performance benchmarks returned 1.50% and 1.72%, respectively, during the same period.
WHAT FACTORS INFLUENCED PERFORMANCE?
The Fund outperformed both performance benchmarks, driven by overweight allocations to investment-grade (IG) corporate bonds, asset-backed securities (ABS), non-agency residential mortgage-backed securities, and collateralized loan obligations (CLOs). Higher income, stronger yields, and credit rating upgrades across these sectors further supported relative performance. Duration positioning also contributed as short-term Treasury yields declined.
HOW WAS THE FUND POSITIONED DURING THE PERIOD?
The Fund maintained an overweight allocation to securitized credit, increasing allocations to IG corporate bonds, agency commercial mortgage-backed securities, and CLOs while reducing exposure to ABS. Overall, the Fund increased diversification, credit quality, and liquidity during the period.
|
Top Contributors
|
|
|
↑
|
High Income Relative to Performance Benchmarks
|
|
↑
|
IG Securitized Credit
|
|
Top Detractors
|
|
|
↓
|
Cash and Government Allocations with Lower Yield Relative to Credit Sectors
|
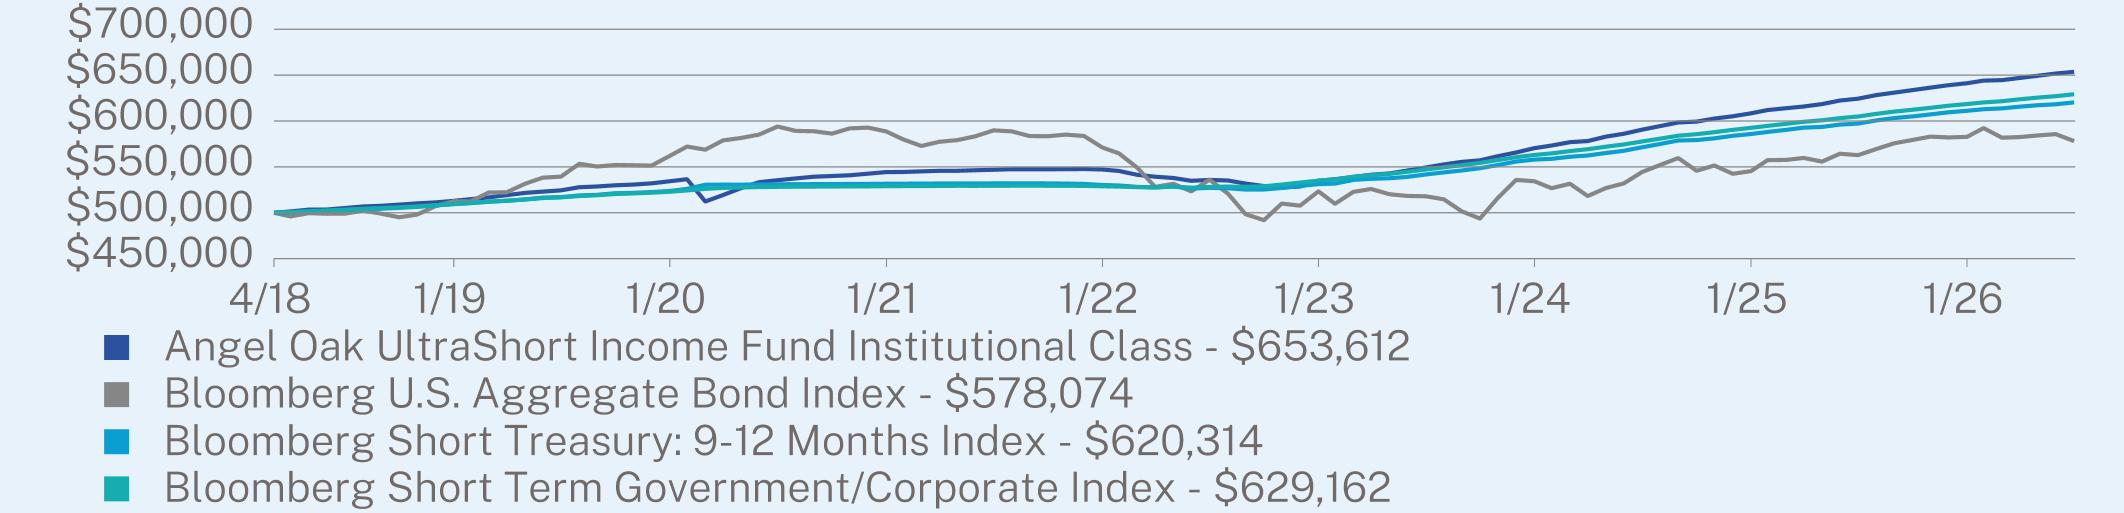
ANNUAL AVERAGE TOTAL RETURN (%)
|
|
1 Year
|
5 Year
|
Since Inception
(04/02/2018) |
|
Institutional Class
|
4.69
|
3.63
|
3.27
|
|
Bloomberg U.S. Aggregate Bond Index
|
2.71
|
-0.40
|
1.76
|
|
Bloomberg Short Treasury: 9-12 Months Index
|
3.86
|
3.12
|
2.62
|
|
Bloomberg Short Term Government/Corporate Index
|
4.00
|
3.51
|
2.80
|
https://angeloakcapital.com/investments/ for more recent performance information.
KEY FUND STATISTICS (as of July 31, 2026)
|
Net Assets
|
$813,005,437
|
Effective Duration
|
0.87 years
|
|
|
Number of Holdings
|
450
|
30-Day SEC Yield (Institutional Class)
|
4.57%
|
|
|
Net Advisory Fee
|
$1,015,284
|
30-Day SEC Yield Unsubsidized (Institutional Class)
|
4.38%
|
|
|
Portfolio Turnover
|
37%
|
Weighted Average Life
|
1.60 years
|
|
|
Average Credit Quality
|
A
|
Distribution Yield (Institutional Class)
|
4.55%
|
WHAT DID THE FUND INVEST IN? (as of July 31, 2026)
Top Security Types (% of net assets)
|
Corporate Obligations
|
23.0
|
%
|
|
Asset-Backed Securities
|
21.6
|
%
|
|
Commercial Mortgage-Backed Securities - U.S. Government Agency
|
21.1
|
%
|
|
Collateralized Loan Obligations
|
16.2
|
%
|
|
Residential Mortgage-Backed Securities
|
13.6
|
%
|
|
Money Market Funds
|
5.9
|
%
|
|
Commercial Mortgage-Backed Securities
|
2.1
|
%
|
|
Residential Mortgage-Backed Securities - U.S. Government Agency Credit Risk Transfer
|
0.5
|
%
|
|
Futures Contracts
|
0.1
|
%
|
|
Cash & Other
|
-4.1
|
%
|
Top 10 Holdings (% of net assets)
|
First American Government Obligations Fund - Class U
|
5.9
|
%
|
|
Federal Home Loan Mortgage Corp., Series KF173, Class AS
|
2.0
|
%
|
|
Bain Capital Credit CLO Ltd., Series 2020-5A, Class ARR
|
1.3
|
%
|
|
Federal Home Loan Mortgage Corp., Series KF99, Class AS
|
1.0
|
%
|
|
Federal Home Loan Mortgage Corp., Series K-F102, Class AS
|
1.0
|
%
|
|
Federal Home Loan Mortgage Corp., Series KF134, Class AS
|
1.0
|
%
|
|
Pretium Mortgage Credit Partners LLC, Series 2026-RN2, Class A1
|
0.8
|
%
|
|
BCRED MML CLO LLC, Series 2022-1A, Class A1
|
0.8
|
%
|
|
Golub Capital LLC, Series 2022-1A, Class BR
|
0.8
|
%
|
|
Federal Home Loan Mortgage Corp., Series K-F121, Class AS
|
0.8
|
%
|
Credit Ratings Breakdown (% of net assets)*
|
AAA
|
25.8
|
%
|
|
AA
|
31.8
|
%
|
|
A
|
10.3
|
%
|
|
BBB
|
21.3
|
%
|
|
BB
|
3.8
|
%
|
|
B
|
0.2
|
%
|
|
NR
|
6.8
|
%
|
https://angeloakcapital.com/resources/. You can also request this information by contacting us at 1-855-751-4324.
WHAT WERE THE FUND COSTS FOR THE LAST SIX MONTHS? (based on a hypothetical $10,000 investment)
|
Fund Name
|
Costs of a $10,000 investment
|
Costs paid as a percentage of a $10,000 investment*
|
|
Angel Oak High Yield Opportunities ETF
|
$28
|
0.55%
|
HOW DID THE FUND PERFORM DURING THE PERIOD?
The Fund returned 1.80% based on net asset value (NAV) for the six-month period ended July 31, 2026. The Fund outperformed its performance benchmark, the Bloomberg U.S. Corporate High Yield Index, by 61 basis points based on NAV. The performance benchmark returned 1.19% during the same period.
WHAT FACTORS INFLUENCED PERFORMANCE?
Both the Fund’s high-yield (HY) corporate bond allocation and securitized credit allocation contributed to its outperformance relative to the benchmark. The HY corporate bond allocation returned 1.87%, compared with 1.19% for the benchmark. Within the Fund’s securitized credit allocation, which represents an out-of-index exposure, both the asset-backed securities (ABS) and non-agency residential mortgage-backed securities (RMBS) allocations made positive contributions to performance.
HOW WAS THE FUND POSITIONED DURING THE PERIOD?
The Fund modestly reduced its allocation to securitized credit during the period, decreasing exposure to both ABS and RMBS following their outperformance relative to HY corporate credit. Within the HY corporate bond allocation, exposure to the energy sector was increased, while allocations to consumer cyclical and finance companies were reduced.
|
Top Contributors
|
|
|
↑
|
Overweight to HY Securitized Credit, ABS, and Non-Agency RMBS
|
|
↑
|
Issue Selection within the Energy Allocation
|
|
↑
|
Underweight to Communications
|
|
Top Detractors
|
|
|
↓
|
Overweight to Finance Companies
|
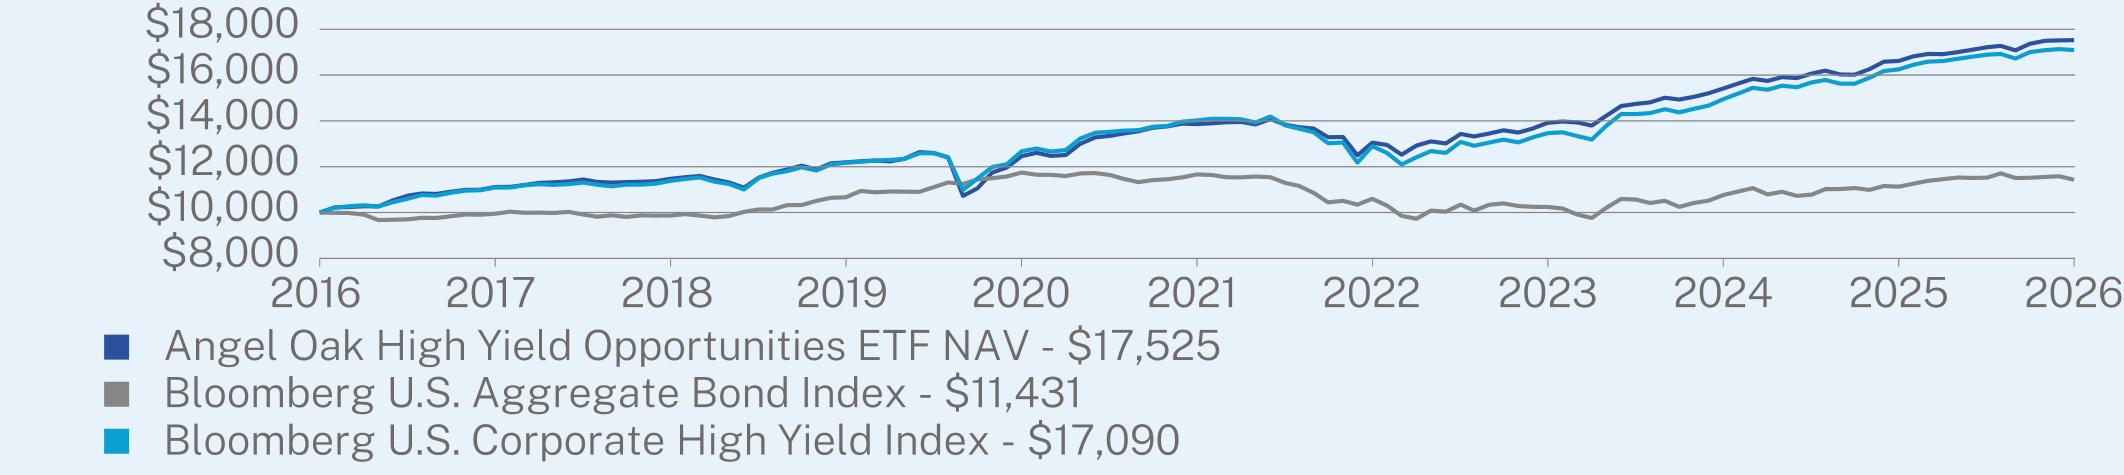
ANNUAL AVERAGE TOTAL RETURN (%)
|
|
1 Year
|
5 Year
|
10 Year
|
|
Angel Oak High Yield Opportunities ETF NAV
|
5.46
|
4.80
|
5.77
|
|
Bloomberg U.S. Aggregate Bond Index
|
2.71
|
-0.40
|
1.35
|
|
Bloomberg U.S. Corporate High Yield Index
|
5.17
|
4.04
|
5.51
|
https://angeloakcapital.com/investments/ for more recent performance information.
KEY FUND STATISTICS (as of July 31, 2026)
|
Net Assets
|
$124,373,653
|
Effective Duration
|
3.16 years
|
|
|
Number of Holdings
|
187
|
30-Day SEC Yield
|
6.88%
|
|
|
Net Advisory Fee
|
$335,820
|
30-Day SEC Yield Unsubsidized
|
6.88%
|
|
|
Portfolio Turnover
|
29%
|
Weighted Average Life
|
3.91 years
|
|
|
Average Credit Quality
|
BB
|
Distribution Yield
|
6.71%
|
WHAT DID THE FUND INVEST IN? (as of July 31, 2026)
Top Sectors (% of net assets)
|
Financial
|
20.7
|
%
|
|
Energy
|
15.2
|
%
|
|
Consumer, Non-cyclical
|
13.1
|
%
|
|
Industrial
|
10.8
|
%
|
|
Consumer, Cyclical
|
9.8
|
%
|
|
Basic Materials
|
7.9
|
%
|
|
Communications
|
6.1
|
%
|
|
Asset-Backed Securities
|
3.5
|
%
|
|
Mortgage Securities
|
3.3
|
%
|
|
Cash & Other
|
9.6
|
%
|
Top 10 Holdings (% of net assets)
|
First American Government Obligations Fund - Class U
|
2.6
|
%
|
|
Venture Global LNG, Inc.
|
2.0
|
%
|
|
Freedom Mortgage Holdings LLC
|
1.7
|
%
|
|
Phoenix Aviation Capital Ltd.
|
1.4
|
%
|
|
Directv Financing LLC / Directv Financing Co-Obligor, Inc.
|
1.4
|
%
|
|
First Quantum Minerals Ltd.
|
1.4
|
%
|
|
Gray Media, Inc.
|
1.0
|
%
|
|
CVR Energy, Inc.
|
0.9
|
%
|
|
Calumet Specialty Products Partners LP / Calumet Finance Corp.
|
0.9
|
%
|
|
CRC Insurance Group LLC
|
0.9
|
%
|
Credit Ratings Breakdown (% of net assets)*
|
AA
|
2.6
|
%
|
|
A
|
0.4
|
%
|
|
BBB
|
5.2
|
%
|
|
BB
|
50.5
|
%
|
|
B
|
34.3
|
%
|
|
CCC
|
5.0
|
%
|
|
NR
|
2.0
|
%
|
https://angeloakcapital.com/resources/. You can also request this information by contacting us at 1-855-751-4324.
WHAT WERE THE FUND COSTS FOR THE LAST SIX MONTHS? (based on a hypothetical $10,000 investment)
|
Fund Name
|
Costs of a $10,000 investment
|
Costs paid as a percentage of a $10,000 investment*
|
|
Angel Oak Mortgage-Backed Securities ETF
|
$24
|
0.49%
|
HOW DID THE FUND PERFORM DURING THE PERIOD?
The Fund returned -0.15% based on net asset value (NAV) for the six-month period ended July 31, 2026. The Fund outperformed its performance benchmark, the Bloomberg U.S. Mortgage-Backed Securities Index, by 70 basis points (bps) based on NAV. The performance benchmark returned -0.85% during the same period.
WHAT FACTORS INFLUENCED PERFORMANCE?
The Fund’s non-agency residential mortgage-backed securities (RMBS) allocation outperformed the benchmark and was a key contributor to performance, returning 0.58% and contributing 42 bps to total return during the period. Performance was led by reperforming loans (RPLs), which returned 2.60% and contributed 25 bps. Within agency RMBS, the Fund’s barbell positioning across lower- and higher-coupon cohorts also supported results, benefiting from favorable carry and wider option-adjusted spreads.
HOW WAS THE FUND POSITIONED DURING THE PERIOD?
The Fund increased its exposure to non-agency RMBS during the period, adding positions in RPLs and second liens. Within agency RMBS, the Fund continued its shift away from intermediate coupon pools, reallocating toward lower and higher coupon cohorts to establish a more pronounced barbell positioning. Relative to the benchmark, the Fund maintained its largest overweight allocation in the 6.0% to 6.5% coupon sectors while remaining underweight in the 3.0% to 4.5% coupon range.
|
Top Contributors
|
|
|
↑
|
Non-Agency RMBS: RPLs, Second Liens, and Reverse Mortgages
|
|
Top Detractors
|
|
|
↓
|
Agency RMBS
|
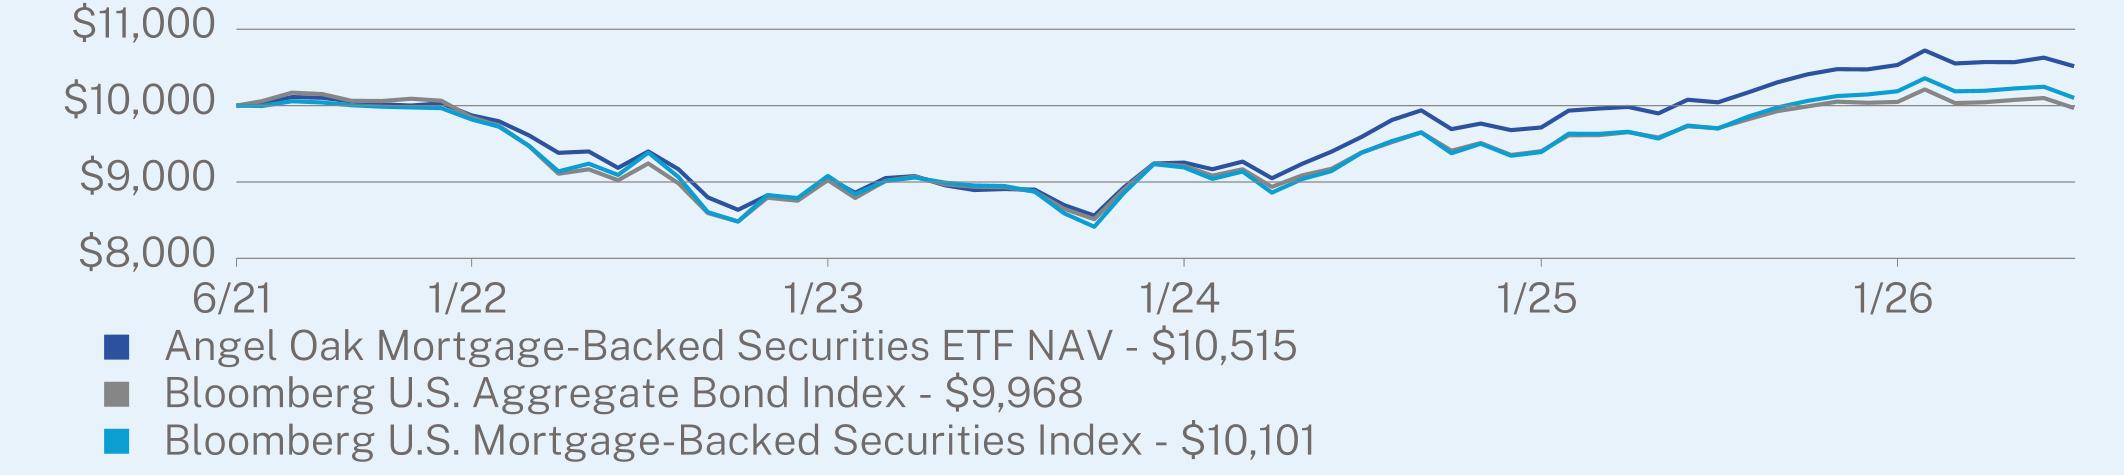
ANNUAL AVERAGE TOTAL RETURN (%)
|
|
1 Year
|
5 Year
|
Since Inception
(06/04/2021) |
|
Angel Oak Mortgage-Backed Securities ETF NAV
|
4.70
|
0.79
|
0.98
|
|
Bloomberg U.S. Aggregate Bond Index
|
2.71
|
-0.40
|
-0.06
|
|
Bloomberg U.S. Mortgage-Backed Securities Index
|
4.13
|
0.09
|
0.19
|
https://angeloakcapital.com/investments/ for more recent performance information.
KEY FUND STATISTICS (as of July 31, 2026)
|
Net Assets
|
$146,099,553
|
Effective Duration
|
5.85 years
|
|
|
Number of Holdings
|
130
|
30-Day SEC Yield
|
4.56%
|
|
|
Net Advisory Fee
|
$374,348
|
30-Day SEC Yield Unsubsidized
|
4.25%
|
|
|
Portfolio Turnover
|
46%
|
Weighted Average Life
|
7.39 years
|
|
|
Average Credit Quality
|
AA
|
Distribution Yield
|
5.58%
|
WHAT DID THE FUND INVEST IN? (as of July 31, 2026)
Top Security Types (% of net assets)
|
Residential Mortgage-Backed Securities
|
71.0
|
%
|
|
Residential Mortgage-Backed Securities - U.S. Government Agency
|
40.1
|
%
|
|
Money Market Funds
|
0.6
|
%
|
|
Cash & Other
|
-11.7
|
%
|
Top 10 Holdings (% of net assets)
|
Federal Home Loan Mortgage Corp., Pool 000TBA
|
6.8
|
%
|
|
Federal Home Loan Mortgage Corp.
|
4.2
|
%
|
|
Sequoia Mortgage Trust, Series 2023-4, Class B2
|
2.7
|
%
|
|
COLT Funding LLC, Series 2026-2, Class A1B
|
2.7
|
%
|
|
Federal Home Loan Mortgage Corp., Pool RB5146
|
2.3
|
%
|
|
Federal Home Loan Mortgage Corp., Pool RA3515
|
2.1
|
%
|
|
RCKT Mortgage Trust, Series 2021-5, Class A1
|
2.1
|
%
|
|
GS Mortgage-Backed Securities Trust, Series 2024-RPL2, Class M1
|
2.0
|
%
|
|
Federal National Mortgage Association, Pool MA4422
|
1.9
|
%
|
|
Federal National Mortgage Association, Pool MA4474
|
1.6
|
%
|
Credit Ratings Breakdown (% of net assets)*
|
AAA
|
22.8
|
%
|
|
AA
|
49.6
|
%
|
|
A
|
11.3
|
%
|
|
BBB
|
9.6
|
%
|
|
BB
|
3.8
|
%
|
|
NR
|
2.9
|
%
|
https://angeloakcapital.com/resources/. You can also request this information by contacting us at 1-855-751-4324.
WHAT WERE THE FUND COSTS FOR THE LAST SIX MONTHS? (based on a hypothetical $10,000 investment)
|
Fund Name
|
Costs of a $10,000 investment
|
Costs paid as a percentage of a $10,000 investment*
|
|
Angel Oak UltraShort Income ETF
|
$17
|
0.34%
|
HOW DID THE FUND PERFORM DURING THE PERIOD?
The Fund returned 1.89% based on net asset value (NAV) for the six-month period ended July 31, 2026. The Fund outperformed the Bloomberg U.S. Treasury Bills Index, one of its performance benchmarks, by 7 basis points (bps) based on NAV. The performance benchmark returned 1.82% during the same period. The Fund also outperformed the Bloomberg Short-Term Government/Corporate Index, its other performance benchmark, by 17 bps based on NAV. That performance benchmark returned 1.72% during the same period.
WHAT FACTORS INFLUENCED PERFORMANCE?
The Fund outperformed both performance benchmarks, supported by overweight allocations to asset-backed securities (ABS), collateralized loan obligations (CLOs), and agency commercial mortgage-backed securities (CMBS). Broad credit strength and elevated carry across these sectors contributed meaningfully during the period. Agency CMBS contributed 50 bps, returning 2.14%, supported by floating-rate structures that benefited price stability.
HOW WAS THE FUND POSITIONED DURING THE PERIOD?
The Fund maintained an overweight allocation to securitized credit throughout the period, increasing allocations to high-yield (HY) corporate bonds, agency CMBS, and ABS to enhance carry, liquidity, and diversification. At the same time, the Fund reduced its exposure to non-agency RMBS.
|
Top Contributors
|
|
|
↑
|
ABS
|
|
↑
|
Agency CMBS
|
|
↑
|
CLOs
|
|
Top Detractors
|
|
|
↓
|
Corporate Bonds
|
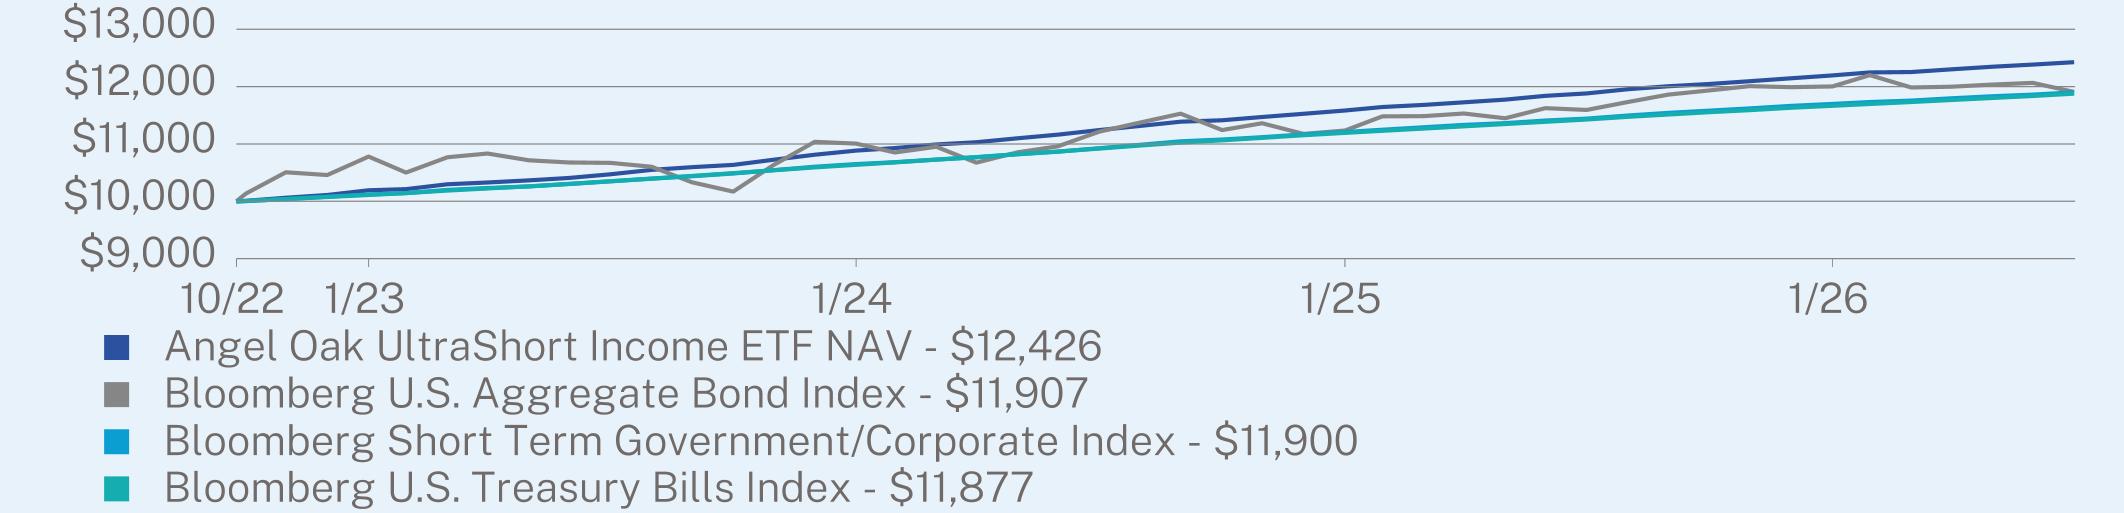
ANNUAL AVERAGE TOTAL RETURN (%)
|
|
1 Year
|
Since Inception
(10/24/2022) |
|
Angel Oak UltraShort Income ETF NAV
|
4.58
|
5.93
|
|
Bloomberg U.S. Aggregate Bond Index
|
2.71
|
4.74
|
|
Bloomberg Short Term Government/Corporate Index
|
4.00
|
4.73
|
|
Bloomberg U.S. Treasury Bills Index
|
3.95
|
4.67
|
https://angeloakcapital.com/investments/ for more recent performance information.
KEY FUND STATISTICS (as of July 31, 2026)
|
Net Assets
|
$1,570,702,009
|
Effective Duration
|
0.81 years
|
|
|
Number of Holdings
|
518
|
30-Day SEC Yield
|
4.63%
|
|
|
Net Advisory Fee
|
$2,457,702
|
30-Day SEC Yield Unsubsidized
|
4.42%
|
|
|
Portfolio Turnover
|
34%
|
Weighted Average Life
|
1.66 years
|
|
|
Average Credit Quality
|
A
|
Distribution Yield
|
4.48%
|
WHAT DID THE FUND INVEST IN? (as of July 31, 2026)
Top Security Types (% of net assets)
|
Commercial Mortgage-Backed Securities - U.S. Government Agency
|
24.4
|
%
|
|
Corporate Obligations
|
23.4
|
%
|
|
Asset-Backed Securities
|
21.4
|
%
|
|
Collateralized Loan Obligations
|
14.4
|
%
|
|
Residential Mortgage-Backed Securities
|
13.0
|
%
|
|
Money Market Funds
|
4.1
|
%
|
|
Commercial Mortgage-Backed Securities
|
0.9
|
%
|
|
Residential Mortgage-Backed Securities - U.S. Government Agency Credit Risk Transfer
|
0.6
|
%
|
|
Cash & Other
|
-2.2
|
%
|
Top 10 Holdings (% of net assets)
|
First American Government Obligations Fund - Class U
|
4.1
|
%
|
|
Federal Home Loan Mortgage Corp., Series KF173, Class AS
|
1.7
|
%
|
|
Federal Home Loan Mortgage Corp., Series K-F102, Class AS
|
1.6
|
%
|
|
Federal Home Loan Mortgage Corp., Series KF99, Class AS
|
1.4
|
%
|
|
Federal Home Loan Mortgage Corp., Series K-F120, Class AS
|
1.4
|
%
|
|
Federal Home Loan Mortgage Corp., Series KF172, Class AS
|
1.3
|
%
|
|
Federal Home Loan Mortgage Corp., Series KF170, Class AS
|
1.3
|
%
|
|
Federal Home Loan Mortgage Corp., Series KF-127, Class AS
|
1.2
|
%
|
|
Federal Home Loan Mortgage Corp., Series KF134, Class AS
|
1.1
|
%
|
|
Steele Creek CLO Ltd., Series 2019-1A, Class BRR
|
1.0
|
%
|
Credit Ratings Breakdown (% of net assets)*
|
AAA
|
27.0
|
%
|
|
AA
|
34.2
|
%
|
|
A
|
9.2
|
%
|
|
BBB
|
22.3
|
%
|
|
BB
|
2.4
|
%
|
|
B
|
0.1
|
%
|
|
NR
|
4.8
|
%
|
https://angeloakcapital.com/resources/. You can also request this information by contacting us at 1-855-751-4324.
WHAT WERE THE FUND COSTS FOR THE LAST SIX MONTHS? (based on a hypothetical $10,000 investment)
|
Fund Name
|
Costs of a $10,000 investment
|
Costs paid as a percentage of a $10,000 investment*
|
|
Angel Oak Income ETF
|
$39
|
0.79%
|
HOW DID THE FUND PERFORM DURING THE PERIOD?
The Fund returned 1.22% based on net asset value (NAV) for the six-month period ended July 31, 2026. The Fund outperformed its benchmark, the Bloomberg U.S. Aggregate Bond Index, by 202 basis points based on NAV. The benchmark returned -0.80% during the same period.
WHAT FACTORS INFLUENCED PERFORMANCE?
The Fund benefited from higher current income, shorter-duration positioning, lower exposure to corporate credit, and spread outperformance across its credit allocations, particularly in non-agency residential mortgage-backed securities (RMBS), asset-backed securities (ABS), and collateralized loan obligations (CLOs). The Fund’s agency RMBS positions were the primary detractor from performance.
HOW WAS THE FUND POSITIONED DURING THE PERIOD?
The Fund reduced its exposure to non-agency RMBS and agency commercial mortgage-backed securities and reallocated assets to agency RMBS, ABS, and CLOs. In addition, the Fund tactically increased its allocation to high-yield corporate bonds before reallocating back to securitized credit, highlighting its dynamic asset allocation approach.
|
Top Contributors
|
|
|
↑
|
Non-agency RMBS
|
|
↑
|
ABS
|
|
↑
|
CLOs
|
|
Top Detractors
|
|
|
↓
|
Agency RMBS
|
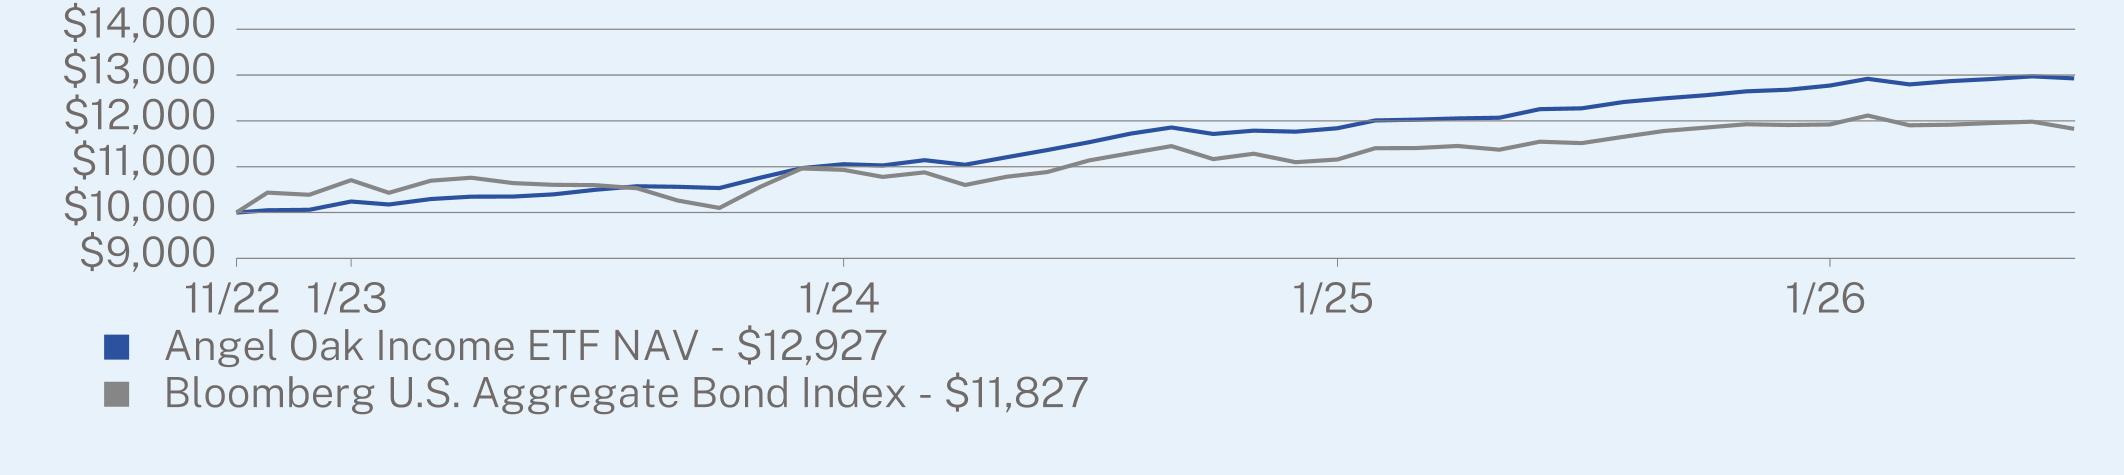
ANNUAL AVERAGE TOTAL RETURN (%)
|
|
1 Year
|
Since Inception
(11/07/2022) |
|
Angel Oak Income ETF NAV
|
5.32
|
7.13
|
|
Bloomberg U.S. Aggregate Bond Index
|
2.71
|
4.60
|
https://angeloakcapital.com/investments/ for more recent performance information.
KEY FUND STATISTICS (as of July 31, 2026)
|
Net Assets
|
$1,382,283,071
|
Effective Duration
|
3.95 years
|
|
|
Number of Holdings
|
801
|
30-Day SEC Yield
|
5.70%
|
|
|
Net Advisory Fee
|
$4,348,323
|
30-Day SEC Yield Unsubsidized
|
5.50%
|
|
|
Portfolio Turnover
|
35%
|
Weighted Average Life
|
5.72 years
|
|
|
Average Credit Quality
|
BBB
|
Distribution Yield
|
5.72%
|
WHAT DID THE FUND INVEST IN? (as of July 31, 2026)
Top Security Types (% of net assets)
|
Residential Mortgage-Backed Securities
|
24.4
|
%
|
|
Residential Mortgage-Backed Securities - U.S. Government Agency
|
18.5
|
%
|
|
Asset-Backed Securities
|
17.7
|
%
|
|
Corporate Obligations
|
15.2
|
%
|
|
Collateralized Loan Obligations
|
12.9
|
%
|
|
Commercial Mortgage-Backed Securities - U.S. Government Agency
|
5.5
|
%
|
|
Commercial Mortgage-Backed Securities
|
3.1
|
%
|
|
Money Market Funds
|
2.3
|
%
|
|
Exchange Traded Funds
|
1.8
|
%
|
|
Cash & Other
|
-1.4
|
%
|
Top 10 Holdings (% of net assets)
|
First American Government Obligations Fund - Class U
|
2.3
|
%
|
|
Federal Home Loan Mortgage Corp.
|
1.4
|
%
|
|
United States Treasury Note
|
1.3
|
%
|
|
Federal Home Loan Mortgage Corp., Series KF170, Class AS
|
1.1
|
%
|
|
Federal Home Loan Mortgage Corp., Pool RQ0094
|
1.1
|
%
|
|
Invesco Senior Loan ETF
|
1.0
|
%
|
|
Federal Home Loan Mortgage Corp., Series K-176, Class A1
|
0.9
|
%
|
|
Federal Home Loan Mortgage Corp., Pool SD8506
|
0.8
|
%
|
|
Federal Home Loan Mortgage Corp., Series KF169, Class AS
|
0.7
|
%
|
|
Federal Home Loan Mortgage Corp., Series KF172, Class AS
|
0.7
|
%
|
Credit Ratings Breakdown (% of net assets)*
|
AAA
|
2.6
|
%
|
|
AA
|
31.7
|
%
|
|
A
|
6.3
|
%
|
|
BBB
|
16.8
|
%
|
|
BB
|
24.2
|
%
|
|
B
|
9.9
|
%
|
|
CCC
|
0.5
|
%
|
|
NR
|
8.0
|
%
|
WHAT WERE THE FUND COSTS FOR THE LAST SIX MONTHS? (based on a hypothetical $10,000 investment)
|
Fund Name
|
Costs of a $10,000 investment
|
Costs paid as a percentage of a $10,000 investment*
|
|
Angel Oak Total Return ETF
|
$22
|
0.44%
|
HOW DID THE FUND PERFORM DURING THE PERIOD?
The Fund returned -0.55% based on net asset value (NAV) for the six-month period ended July 31, 2026. The Fund outperformed its benchmark, the Bloomberg U.S. Aggregate Bond Index, by 25 basis points (bps) based on NAV. The performance benchmark returned -0.80% during the same period.
WHAT FACTORS INFLUENCED PERFORMANCE?
The Fund benefited from an overweight allocation to securitized credit and agency mortgage backed securities (MBS). Non agency residential mortgage-backed securities (RMBS) and asset-backed securities (ABS) were the strongest contributors, adding 49 bps and 23 bps to total return and generating returns of 4.24% and 6.08%, respectively. Performance in non agency RMBS was supported by broad spread tightening across subsectors. While the investment-grade corporate allocation underperformed, security selection within the sector contributed positively to results. Overall, performance was driven by higher income generation, a strategic overweight to agency MBS relative to Treasuries, and a continued overweight allocation to securitized credit.
HOW WAS THE FUND POSITIONED DURING THE PERIOD?
The Fund increased its exposure to agency RMBS while maintaining an underweight allocation to Treasuries relative to the benchmark. Portfolio positioning continued to emphasize shorter duration credit and an overweight to securitized credit.
|
Top Contributors
|
|
|
↑
|
ABS
|
|
↑
|
Non-Agency RMBS
|
|
↑
|
CLOs
|
|
Top Detractors
|
|
|
↓
|
IG Corporate Bond Security Selection
|
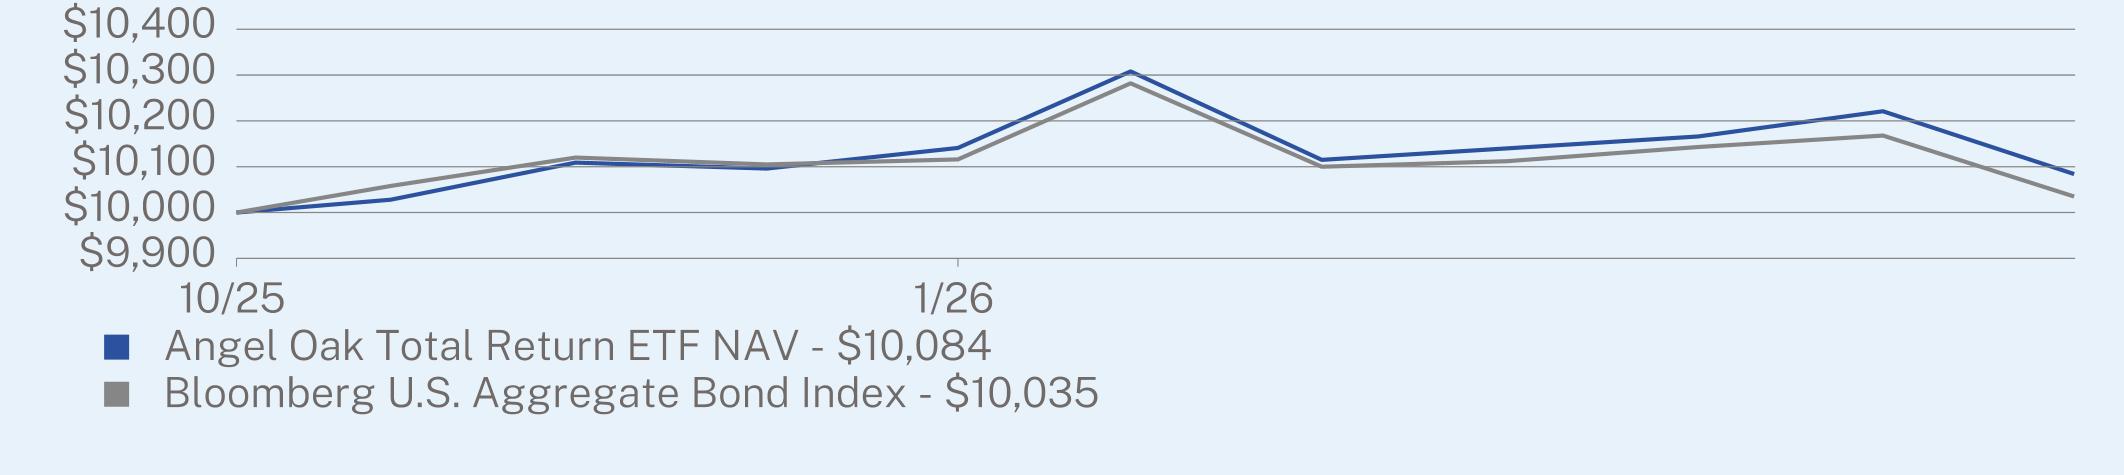
ANNUAL AVERAGE TOTAL RETURN (%)
|
|
Since Inception
(10/06/2025) |
|
Angel Oak Total Return ETF NAV
|
0.84
|
|
Bloomberg U.S. Aggregate Bond Index
|
0.35
|
https://angeloakcapital.com/investments/ for more recent performance information.
KEY FUND STATISTICS (as of July 31, 2026)
|
Net Assets
|
$36,844,651
|
Effective Duration
|
6.21 years
|
|
|
Number of Holdings
|
303
|
30-Day SEC Yield
|
4.77%
|
|
|
Net Advisory Fee
|
$58,836
|
30-Day SEC Yield Unsubsidized
|
4.62%
|
|
|
Portfolio Turnover
|
107%
|
Weighted Average Life
|
7.39 years
|
|
|
Average Credit Quality
|
A
|
Distribution Yield
|
4.70%
|
WHAT DID THE FUND INVEST IN? (as of July 31, 2026)
Top Security Types (% of net assets)
|
Residential Mortgage-Backed Securities - U.S. Government Agency
|
44.8
|
%
|
|
Corporate Obligations
|
26.5
|
%
|
|
Residential Mortgage-Backed Securities
|
11.4
|
%
|
|
Asset-Backed Securities
|
9.9
|
%
|
|
Money Market Funds
|
5.9
|
%
|
|
Collateralized Loan Obligations
|
2.7
|
%
|
|
Exchange Traded Funds
|
1.6
|
%
|
|
Commercial Mortgage-Backed Securities - U.S. Government Agency
|
1.5
|
%
|
|
Futures Contracts
|
-0.1
|
%
|
|
Cash & Other
|
-4.2
|
%
|
Top 10 Holdings (% of net assets)
|
First American Government Obligations Fund - Class U
|
5.9
|
%
|
|
Willow Tree CLO Ltd., Series 2024-1A, Class B
|
2.7
|
%
|
|
Federal National Mortgage Association, Pool FA5000
|
2.3
|
%
|
|
Upstart Securitization Trust, Series 2023-2, Class C
|
2.3
|
%
|
|
Federal Home Loan Mortgage Corp., Pool SD1937
|
2.2
|
%
|
|
Federal National Mortgage Association, Pool MA5320
|
2.1
|
%
|
|
Federal National Mortgage Association, Pool CB3164
|
2.0
|
%
|
|
Federal National Mortgage Association, Pool CA8256
|
2.0
|
%
|
|
Federal Home Loan Mortgage Corp., Pool SL1232
|
1.9
|
%
|
|
Federal National Mortgage Association, Pool CB2806
|
1.7
|
%
|
Credit Ratings Breakdown (% of net assets)*
|
AAA
|
3.8
|
%
|
|
AA
|
57.7
|
%
|
|
A
|
10.2
|
%
|
|
BBB
|
12.1
|
%
|
|
BB
|
13.5
|
%
|
|
B
|
1.1
|
%
|
|
NR
|
1.6
|
%
|
MATERIAL FUND CHANGES:
On April 24, 2026, Brookfield Public Securities Group LLC began to serve as sub-adviser to a portion of the Fund’s portfolio that is allocated to corporate debt.
This is a summary of certain changes to the Fund since February 1, 2026. For more complete information, you may review the Fund’s current prospectus, dated April 18, 2026, as supplemented to date, which is available at
https://angeloakcapital.com/resources/ or upon request at 1-855-751-4324.
https://angeloakcapital.com/resources/ or upon request at 1-855-751-4324.
| [1] |
|
||
| [2] |
|
||
| [3] |
|
||
| [4] |
|
||
| [5] |
|
||
| [6] |
|
||
| [7] |
|
||
| [8] |
|
||
| [9] |
|
||
| [10] |
|
||
| [11] |
|
||
| [12] |
|
||
| [13] |
|
||
| [14] |
|
||
| [15] |
|
||
| [16] |
|
||
| [17] |
|
||
| [18] |
|
||
| [19] |
|
||
| [20] |
|
||
| [21] |
|
||
| [22] |
|