Exhibit 99.5
31 July 2026, 07H00 CEST Press Release Regulated information Participate in the Analyst and investor video call Friday, 31 July 2026 10H00 CEST
WDP in the first half of 2026
#BLEND2030: building towards the platform of tomorrow
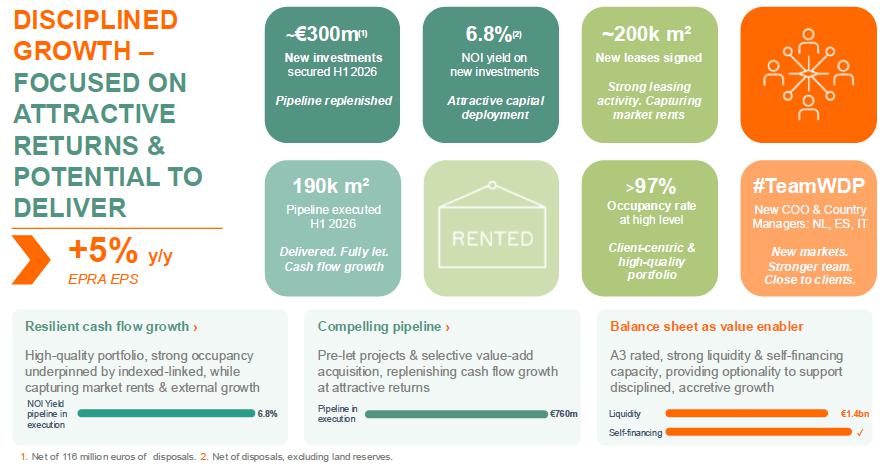
| ● | Robust earnings per share growth: EPRA Earnings per share of 0.79 euros up 5% y/y, with full-year guidance of 1.60 euros and dividend per share of 1.29 euros confirmed. |
| ● | Broad-based leasing activity continues: WDP’s commercial platform continues to capture market demand on all fronts: (i) occupancy high at 97.2%, (ii) out of the 10% leases due for renewal in 2026, 75% is already secured, and (iii) circa 200,000 m² of new leases signed during H1 2026. |
| ● | #BLEND&EXTEND2030 – building blocks for the European platform: beyond the proposed merger with ARGAN, WDP added the next layer of its European platform: 300 million euros of new investments (net of 116 million euros disposals) secured at a 6.8% NOI yield over H1 2026, including 820,000 m² of land positions for future development-led growth. In addition, selective capital recycling is added as a new driver of value creation, while execution capabilities were reinforced. |
Creating a core European logistics REIT of €13bn+
On 23 July 2026, WDP proposed an all-share friendly merger with ARGAN, which will combine two complementary platforms with the same entrepreneurial DNA into a €13bn+ European logistics real estate leader across eight countries. With over 700 million euros of annualised rental income, holding #1 position in France, the Benelux and leading position in Romania, the transaction is a defining step within #BLEND&EXTEND2030.
| ● | Value creation: EPS and NAV accretive, with long-term growth levers. Leverage broadly stable. |  |
|
| ● | Fully supported: by management, Boards of Directors and key reference shareholders. | ||
| ● | Subject to vote on EGM: scheduled for both WDP and ARGAN in November 2026. | ||
| ● | Completion expected in Q1 2027: subject to limited and customary approvals. |
“Building the platform of tomorrow – the ambition of our 2030 growth plan is a journey already in full motion, and our intention to join forces with ARGAN accelerates it: an industrial project bringing two leading platforms with the same DNA to European scale in one step. That scale answers a need: for our clients, a partner across Europe’s supply chains, for our investors, a liquid, listed platform of reference for core European logistics real estate – and the proposed merger delivers both, with an unchanged focus on above-average growth at a below-average risk profile.
Alongside an industrial project of this scale, #TeamWDP also made substantial progress by building additional layers of growth in our operations: solid leasing activity, a strong investment volume, land reserves for future development-led growth – and capital recycling proven as a new driver of value creation. Supported by these layers and renewed confidence among our clients and our industrial merger project, we look ahead with confidence to the second half of the year: broad-based, across all our markets. Halfway through 2026, WDP is exactly where it should be. Joost Uwents – CEO WDP
Participate in the
Analyst and investor video call
31 July 2026 – 10:00 a.m. CEST
| Press release – 31 July 2026 | 2 |
| ● | Robust earnings growth from effective multi-driver approach: EPRA Earnings per share rose by +5% y/y to 0.79 euros per share in H1 2026. This earnings growth is driven by a combination of internal and external growth supported by a continued high operating margin and sharp financing cost. |
| ● | Broad-based leasing activity continues: WDP’s commercial platform converts demand into leases on all fronts over H1 2026: (i) occupancy is high at 97.2%, with the year-to-date change reflecting the usual tenant movement, (ii) of the 10% leases due for renewal in 2026, 75% have already been secured, and (iii) circa 200,000 m² new leases were signed, excluding renewals. At the same time 190,000 m² pre-let developments and acquisitions have been delivered at a 6.7% NOI yield1. |
| ● | Stable portfolio revaluations: +9.4 million euros or +0.1% throughout H1 2026, based on an EPRA Net Initial Yield of 5.5%. The net reversionary yield amounts to 6.1%, based on a fully occupied portfolio at market rent. Reversionary potential on the portfolio amounts to +7% compared to 9% at year-end 2025, reflecting the captured rent indexation and rent reversion, with estimated rental values remaining stable quarter-on-quarter. The diversified, high-quality portfolio continues to offer embedded growth through reversion and fully CPI-linked lease agreements. |
| ● | A3-rated balance sheet as structural advantage: net debt / EBITDA (adj.) of 7.6x, loan-to-value of 41.6% and Interest Coverage Ratio of 4.9x (respectively 7.6x, 40.1%, and 5.0x as of 31 December 2025). Strong liquidity of 1.4 billion euros and annual self-financing capacity2 of approx. 500 million euros, with debt kept within leverage targets, underpin disciplined growth with a clear focus: above-average growth with a below-average risk profile. Credit ratings affirmed after proposed merger.3 |
| ● | Creating a core European logistics REIT through proposed friendly merger with ARGAN4: with unanimous support of both Boards of Directors and key reference shareholders, the proposed merger will combine two unique, complementary platforms with the same DNA into a €13bn+ core European leader, with completion foreseen in Q1 2027, subject to customary conditions and approvals. |
| ● | #BLEND&EXTEND2030 – building blocks for the European platform: beyond the proposed merger, WDP continued to add the next layer of its European platform: over H1 2026, around 300 million euros of new investments (net of 116 million euros disposals at attractive terms) were secured at a 6.8% NOI yield over H1 2026, comprising pre-let developments, acquisitions and land positions. |
This brings the pipeline in execution to 760 million euros (cost to come: 588 million euros) at 6.8% NOI yield, supporting near-term earnings growth through continued execution and the leasing of limited space. This growth is underpinned by decisive operational steps taken towards its 2030 ambitions: strengthening execution power, and preparing a disciplined entry into two new markets, Spain and Italy, reinforcing WDP’s platform for the next phase of growth.
Looking ahead, WDP sees a supportive environment across all growth drivers and markets – allowing it to further extend its pipeline visibility. Projected capex remains phased over the coming years, fully in line with WDP’s annual self-financing capacity.
| ● | Outlook 2026 confirmed: expected EPRA Earnings per share for 2026 of 1.60 euros, an increase of +5% y/y and a synchronous increase of the dividend per share to 1.29 euros (payable in 2027). |
| 1 | The NOI Yield is defined as the annualised net operating result (gross rental income minus the non-recoverable operating costs for property) compared to the total investment. |
| 2 | Of which 250-300 million euros in equity via retained earnings, stock dividend and contributions in kind, and the remainder in debt raised within WDP’s leverage targets |
| 3 | Fitch and Moody’s affirmed WDP’s existing issuer and senior credit ratings (stable outlook) following the proposed merger with ARGAN. |
| 4 | See the press release of 23 July 2026. |
| Press release – 31 July 2026 | 3 |
These forecasts are based on the current knowledge and situation and are barring unforeseen circumstances within the context of a volatile macroeconomic and geopolitical climate.
#HY 2026 achievements | Continuation of leasing activity & strong pipeline replenishment
Annual rental potential as an indicator of future earnings growth(1,2)
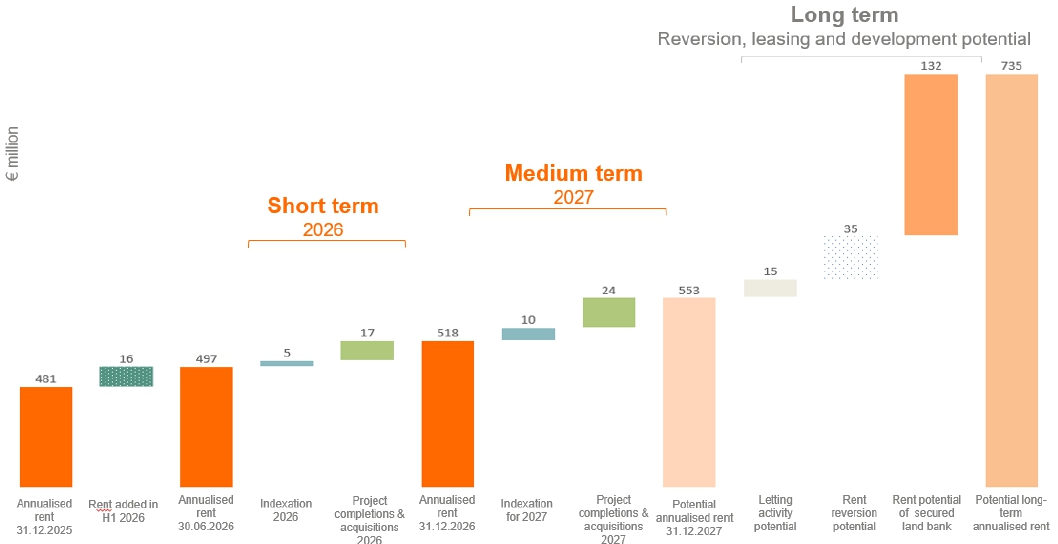
| (1) | The information in this chart is not construed as an earnings forecast or guidance of any kind and should thus not be read as such and is thus solely intended for illustrative purposes. It depicts the short- and medium-term impact of indexation based on economic forecasts and the impact of the already committed development pipeline, the potential of further lettings and the theoretical potential of rental growth and rent from buildable surface of uncommitted projects on the land bank. |
| (2) | Assumption based on 5y inflation swap of 2%. |
| Press release – 31 July 2026 | 4 |
ARGAN and WDP join forces to create a €13 billion European logistics champion through a friendly all-share merger
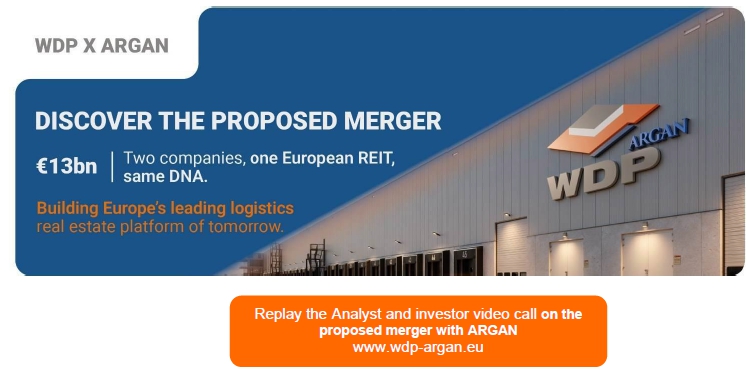
On 23 July 2026, ARGAN and WDP signed a merger agreement to combine into a €13 billion+ European logistics champion through a friendly all-share merger, with ARGAN merging into WDP via an all-share cross-border transaction.5 The proposed combination unites France’s leading logistics REIT with its European counterpart, unlocking a platform spanning eight countries and delivering immediate value for both shareholder groups. The merger carries unanimous support from both boards, together with voting commitments representing ~52% of ARGAN’s and ~19% of WDP’s voting rights from the Le Lan family, the Jos De Pauw family and Crédit Agricole Assurances (through its subsidiary Predica).
“For more than 25 years, each of us has built a market-leading platform. Today, ARGAN and WDP announce their intention to become one company, with the same DNA: client-centric entrepreneurship, disciplined growth and a focus on sustainable earnings growth and attractive total returns – anchored by family shareholders with long-term vision. This industrial project takes both stories to European scale: one integrated platform, stronger for clients and shareholders alike. The foundation for the next 25 years.”
Jean-Claude Le Lan - ARGAN Founder & Chairman of the Supervisory Board & Joost Uwents - CEO WDP
Together, ARGAN and WDP bring together two highly complementary logistics real estate platforms, creating a leading core European logistics real estate portfolio exceeding a €13 billion platform with more than €700 million of annualised rental income, ~13 million m² of high-quality logistics space and a committed pipeline of around 1 billion euros. Every ARGAN client – existing and new – will benefit from integration with the WDP platform from day one. The enlarged group will hold #1 market positions in France, Belgium, Luxembourg, the Netherlands and a leading position in Romania, jointly creating a stronger platform that supports clients across Europe’s most important logistics corridors in eight countries.
The friendly merger aims to combine two companies with shared entrepreneurial DNA. Founded and developed by the Le Lan and Jos De Pauw families respectively, ARGAN and WDP share a long-term vision, a client-centric focus and a disciplined approach to profitable growth and capital allocation. These shared values have enabled both companies to build highly successful logistics platforms in their respective markets and form the foundation of the proposed combination.
| 5 | See the press release of 23 July 2026. |
| Press release – 31 July 2026 | 5 |
I. Performance
| 1. Operational activities | SUSTAINABLE GROWTH |
1.1. Occupancy rate and leasing activity
Leasing activity in H1 2026 remains broad-based and robust. WDP’s commercial platform signed circa 200,000 m² (100,000 m² in Q2 2026) of new leases at market rental levels: across the existing portfolio (excluding renewals) as well as for ongoing and new pre-let development projects. The pre-letting rate for projects under development increased further to 83% (Q4 2025: 81%), even after 112,000 m² of fully let projects completions in H1 2026. Over the same period, five pre-let development projects were launched adding over 73,500 m² to the development pipeline. This underlines the commercial power of the WDP platform to convert new demand into leasing.
Per 30 June 2026, the portfolio occupancy rate remains strong at 97.2% (97.7% per 31 December 2025), with the year-to-date change reflecting usual tenant movements. Of the 10% lease agreements reaching their next break in 2026, 75% have already been extended. WDP expects occupancy to stay strong, above 97% for full-year 2026 - in line with the multi-decade-average - based on a normalised retention rate of around 90% and current rental market conditions.
Logistics real estate has become critical infrastructure. In a world of omnipresent volatility, as reflected by today’s geopolitical events, Europe’s need for supply chain independence, energy resilience and strategic stock is a structural driver of regionalisation and de-globalisation.
Market demand for logistics real estate continues to stabilise from an exceptional peak during pandemic years towards the pre-pandemic average, a healthy baseline. Tenants continue to optimise inventory and operations, while new construction starts remain at low levels, keeping supply constrained. The pace of further market demand continues to depend on consumer spending and business confidence.
Within this context, the demand picture continues to broaden: activity remains robust for smaller units up to 10,000 m², while demand clearly expanded into larger-sized units, driven by tenants making strategic, long-term supply chain decisions. Strong-performing end-users, retailers and resilient sectors including food, e-commerce and pharma are leading this trend, alongside sectors strengthening their market position in sectors underpinned by resilient, non-discretionary demand. Building on the first signs observed in Q1 2026, WDP has seen a further increase in requests and tender activity for larger-scale projects, confirming renewed confidence in decision making for long-term supply chain investments. While short-term, more cyclical demand, particularly from traditional large-volume 3PL operators, remains more selective and closely linked to the broader economic climate, demand across the remainder of the market continues to strengthen.
The medium- to long-term fundamentals for logistics and industrial real estate remain firmly supportive: limited land availability, zoning restrictions, constrained supply and the structural need for more resilient, regionally diversified supply chains. These trends align directly with WDP’s client base: predominantly exposed to European consumption-driven activity in stable, resilient sectors, supporting predictable and sustainable cash flow generation across the portfolio, over the cycle.
Against this backdrop, WDP remains well-positioned to capture demand: a high-quality portfolio with integrated energy and supply chain solutions, deep-rooted local network, and the flexibility to adapt buildings to evolving client needs.
| Press release – 31 July 2026 | 6 |
1.2. Approximately 300 million euros in new investments signed in the first half of 2026
During the first half of 2026, WDP secured a total net investment volume of approximately 300 million euros (net of 116 million euros of disposals), with an expected NOI yield of 6.8%6. These investments comprise pre-let development projects, selective acquisitions and strategic land reserves. These projects have either been completed or form part of the ongoing 1.6. Investment pipeline in execution of around 760 million euros.
WDP further expanded its European platform through pre-let developments for existing clients, complemented by the expansion of a unique landbank across Western Europe and selective acquisitions in prime logistics locations. Together, these investments strengthen WDP’s future development pipeline, demonstrate the strength of its repeat business by deepening long-term partnerships, and support the disciplined execution of the #BLEND&EXTEND2030 growth strategy.
New pre-let development projects, acquisitions and divestment
Location |
Tenant | (Planned) delivery date | Lettable area (in m²) | Investment budget (in € m) | NOI yield | Pre-leased | ||||||||||||||||||
| BE | Antwerp | Fully let | 1Q28 | 22,600 | ||||||||||||||||||||
| NL | Veghel | Kuehne + Nagel | 4Q27 | 12,500 | ||||||||||||||||||||
| RO | Sibiu | Siemens | 4Q27 | 14,950 | ||||||||||||||||||||
| RO | Deva - Calan | Auchan | 4Q26 | 9,442 | ||||||||||||||||||||
| RO | Bucharest - Stefanestii | Auchan | 2Q27 | 14,180 | ||||||||||||||||||||
| New pre-let projects under development | 73,672 | 106 | 7.4 | % | 100 | % | ||||||||||||||||||
| BE | Gent | Increase in JV stake | 3Q26 | n.r. | ||||||||||||||||||||
| FR | Alzonne | DHL | 3Q26 | 23,328 | ||||||||||||||||||||
| FR | Vendargues | Fully let | 3Q26 | 26,829 | ||||||||||||||||||||
| FR | Le Havre | Seafrigo Group | 1Q26 | 16,000 | ||||||||||||||||||||
| LU | Dudelange / Contern* | Various tenants | 1Q26 | 62,000 | ||||||||||||||||||||
| Acquisitions | 128,157 | 186 | 6.5 | % | 100 | % | ||||||||||||||||||
| Total new investments | 201,829 | 292 | 6.8 | % | 100 | % | ||||||||||||||||||
| LU | Foetz* | n.r. | 1Q26 | -17,500 | ||||||||||||||||||||
| NL | Duiven | n.r. | 2Q26 | -27,556 | ||||||||||||||||||||
| RO | Romania | n.r. | 3Q26 | -33,455 | ||||||||||||||||||||
| Divestment | -78,511 | -116 | ||||||||||||||||||||||
| Total, net of disposal | 123,318 | 176 | ||||||||||||||||||||||
| * | The investment/divestment presented for the Luxembourg transactions reflect the property values of the underlying share swaps.7 |
| 6 | Net of disposals. |
| 7 | See the press release of 31 March 2026. |
| Press release – 31 July 2026 | 7 |
Land reserve
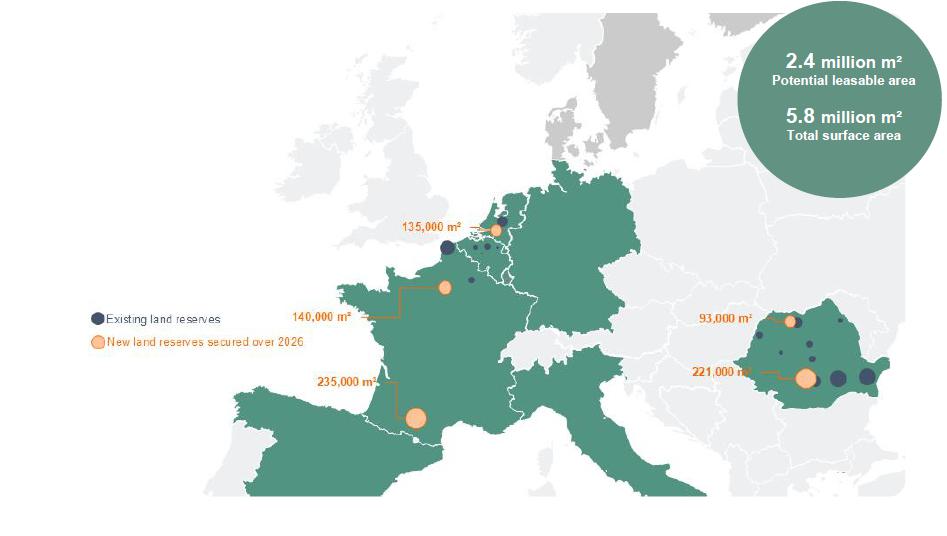
WDP continues to replenish its future development pipeline through selective landbank acquisitions in strategically located logistics markets. Building on the addition of more than 500,000 m² of land reserves in 2025, WDP added over 820,000 m² of land reserves in the first half of 2026, with 90% in core, Western European markets.
Together, these scarce, prime-located land positions reinforce WDP’s long-term development potential and support sustainable long-term value creation.
| Location | Acquisition date | Area (in m²) | Investment budget (in € m) | |||||||||||
| FR | Le Mesnil-Amelot | land reserve | 2Q28 | 140,000 | 50 | |||||||||
| FR | Saint-Jory | land reserve | 3Q26 | 235,000 | 17 | |||||||||
| NL | Zuidwest-Nederland | land reserve | 3Q26 | 135,000 | 41 | |||||||||
| RO | Bucharest - Dragomiresti | land reserve | 2Q26 | 92,912 | 5 | |||||||||
| RO | Bucharest - Stefanestii | land reserve | 1Q26 | 220,735 | 8 | |||||||||
| Total new land reserves | 823,647 | 121 | ||||||||||||
| Press release – 31 July 2026 | 8 |
1.2.1. New pre-let development projects in the first half of 2026
During the first half of 2026, WDP secured approximately 106 million euros in new fully pre-let development projects, all for existing clients, with a projected NOI yield of 7.4%8. The projects underline the strength of WDP’s long-term client partnerships and continued repeat business.
Belgium
Antwerp
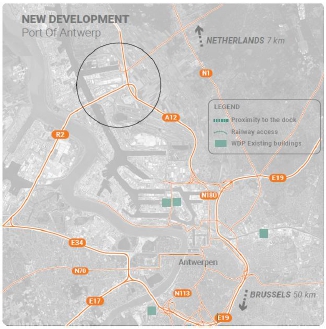
WDP will develop a 25-metre cold storage high bay in the Port of Antwerp, fully pre-let to a cold-chain logistics player. The facility will feature approximately 22,500m² lettable area complemented by 4,000 m² of outdoor container yard on a 62,000 m² site and will provide capacity for 60,000 pallet spaces at a constant temperature of -22°C.
Located adjacent to a container terminal, the site benefits from strong multimodal connectivity within a prime European port hub. The project will be developed according to high sustainability standards, including BREEAM certification and solar panels. The total investment amounts to approximately 55 million euros, with construction starting in September 2026 and delivery expected by early 2028. Upon completion, the site will be leased under a 25-year triple net lease agreement. |
 |
Romania
In Romania, WDP will launch a total of approximately 40,000 m² of new projects on land already owned by WDP. These developments demonstrate WDP’s ability to unlock value from its existing landbank while reflecting continued strong repeat business with existing clients. The remaining strategic land reserves provide additional development potential for future extensions, supporting WDP’s long-term growth strategy.
Bucharest – Ștefănești
In Bucharest – Ștefănești, WDP will develop an approximately 14,000 m² extension to an existing building for Auchan, further strengthening its long-term partnership with the retailer. The project, currently under construction on WDP’s existing landbank, will primarily comprise ambient warehouse space. The development targets EDGE certification and will be leased to Auchan under a long-term fixed lease agreement of 10 years. The total investment amounts to approximately 9.1 million euros, with delivery scheduled for Q2 2027.
| 8 | This represents approximately 7.2% in Western Europe and 7.9% in Romania. |
| Press release – 31 July 2026 | 9 |
Deva
In Deva, WDP will develop an approximately 9,400 m² extension to an existing building for Auchan. The project will comprise a mix of ambient and temperature-controlled storage space. The development targets EDGE certification. The total investment amounts to approximately 7.6 million euros, with delivery scheduled for Q4 2026. The facility will be leased under a long-term fixed 10-year lease agreement.
Sibiu
WDP will start the development of a new industrial site in Sibiu. The project will comprise approximately 15,000 m² of lettable area and will be developed on land owned by WDP. The total investment budget amounts to approximately 14 million euros, with delivery scheduled for Q4 2027. The facility will be leased to Siemens under a long-term lease agreement of 15 years. Siemens will establish a data-driven and highly automated production environment, built on advanced technologies and optimised through digital solutions. The facility will support a smart, flexible and AI-driven manufacturing process. By integrating automation and robotics and enabling seamless data-driven coordination across all stages of production, the site will deliver efficient and future-ready operations.
The Netherlands
Veghel
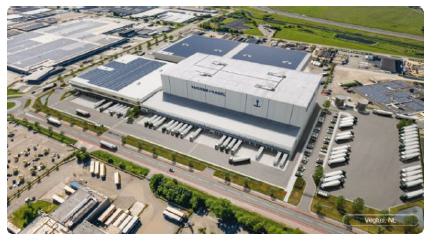
WDP and Kuehne+Nagel are taking the next step in their long-term partnership through the redevelopment of an existing logistics site in Veghel into a state-of-the-art 12,500 m² warehouse and truckyard, forming part of Kuehne+Nagel’s existing logistics campus comprising over 100,000 m² of logistics space. The project is fully pre-let under a fixed 10-year lease agreement and represents a total investment of approximately 21 million euros, with completion expected by the end of 2027. Upon completion, the facility will be integrated with Kuehne+Nagel’s existing automated high-bay warehouse serving its existing consumer business, further strengthening one of the Netherlands’ key logistics hubs. The development targets BREEAM Excellent certification and is EU Taxonomy-aligned, aiming for a 28% improvement in environmental performance and a 31% reduction in carbon footprint.9 |
 |
| 9 | See press release of 7 July 2026. |
| Press release – 31 July 2026 | 10 |
1.2.2. Acquisitions in the first half of 2026
During the first half of 2026, WDP secured approximately 190 million euros of new acquisitions (including approximately 121 million euros of land reserves, net of approximately 116 million euros disposals), further strengthening its portfolio in prime logistics locations across Europe. These transactions reinforce existing logistics clusters, strengthen long-term client partnerships and further enhance the quality of WDP’s European logistics platform through high-quality, income-generating assets. Acquisitions not previously disclosed via press release are marked with a ♦.
France
Le Havre
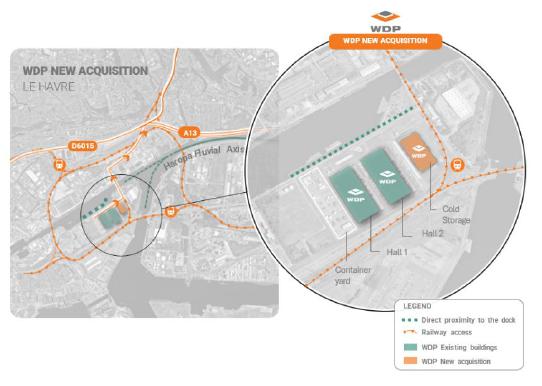
Following the acquisition of two Grade A logistics buildings from AG Real Estate in Le Havre at the end of 2025, leased to Seafrigo on a long-term basis, WDP further strengthens its partnership with Seafrigo.10
WDP completed a sale-and-leaseback transaction in the Port of Le Havre, further strengthening its logistics cluster within France’s largest container port. The transaction concerns a fully let cold storage warehouse of approximately 16,000 m², with an additional 2,000 m² of expansion potential. The Grade A facility, developed in 2017, is used for the storage and handling of chilled and frozen products for maritime transport. The total investment amounts to approximately 23 million euros. The building is leased to Seafrigo under a 27-year triple net lease agreement. The site is located adjacent to two logistics buildings acquired by WDP at the end of 2025, further reinforcing WDP’s logistics cluster within this strategic port location.
|
 | ||
Alzonne
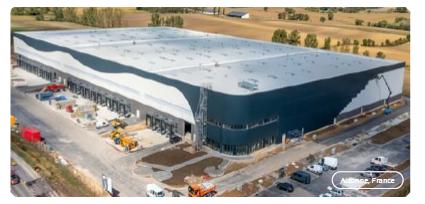
WDP completed a 27 million euros sale-and-leaseback transaction with longstanding WDP client DHL for a newly built 23,300 m² cold-chain logistics facility near Toulouse, with 8,000 m² development potential. Fully leased under a fixed 9-year triple net lease agreement, the facility is operated by DHL as a European distribution hub for a major crop science company. The building was designed to meet the requirements of BREEAM Excellent and WELL Core Gold (designed for offices), while aligning with the EU Taxonomy and CRREM pathways, and features solar panels, EV charging infrastructure and a fully electric climate control system.11 |
 |
| 10 | See press release of 6 January 2026. |
| 11 | See the press release of 2 July 2026. |
| Press release – 31 July 2026 | 11 |
Vendargues
WDP completed the acquisition of a fully leased logistics facility for an investment of approximately 25 million euros in Vendargues, near Montpellier, along the A9 corridor connecting France and Spain. The asset comprises approximately 27,000 m² of GLA and serves as the headquarters and operational hub for Southern Europe of a longstanding international WDP client.12
Luxembourg
Dudelange and Contern
Following an asset swap with the Luxembourg State, WDP acquired the Luxembourg State’s 45% stake in WDP Luxembourg SA, becoming the full owner of the former joint venture. The joint venture, established in 2016, has developed logistics infrastructure in the Eurohub Sud (Bettembourg-Dudelange) and Eurohub Centre (Contern) parks and has evolved into a multimodal logistics hub of approximately 175 million euros, comprising five logistics assets totalling around 140,000 m² of leasable space. Following the achievement of the joint venture’s initial objectives, WDP Luxembourg SA is now fully integrated into the WDP Group, simplifying the Group structure and reinforcing WDP’s strategic footprint in Luxembourg. 13 |
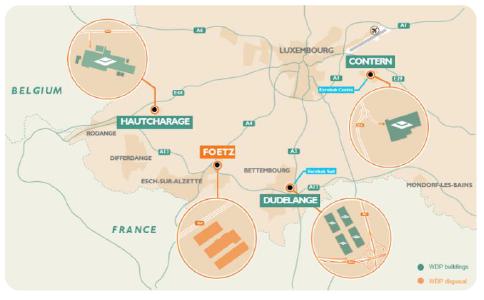 |
Belgium
Ghent ♦
WDP has increased its participation in WDPort of Ghent Big Box NV from 50% to 80% through the acquisition of an existing shareholder’s interest. The transaction is carried out under normal market conditions and in accordance with the provisions of the joint venture agreement. The transaction increases WDP’s economic interest in the WDPort of Ghent multimodal logistics platform and is fully aligned with WDP’s long-term investment strategy.
| 12 | See the press release of 2 July 2026. |
| 13 | See the press release of 31 March 2026. |
| Press release – 31 July 2026 | 12 |
1.2.3. Landbank acquisitions in the first half of 2026
During the first half of 2026, WDP further replenished its European landbank through new prime land positions in France, the Netherlands and Romania. Together, these transactions represent approximately 824,000 m² land area, for a total investment of around 121 million euros (90% Western Europe). WDP intends to develop these land positions over time with incremental development capex of around 230 million euros, mostly from 2027 onwards – enabling gradual, development-led growth as this capex converts into pre-let projects.
Acquisitions not previously announced by press release are marked with a ♦.
France
Le Mesnil-Amelot
WDP entered into an agreement to acquire a 14-hectare land position at Le Mesnil-Amelot, adjacent to Paris Charles de Gaulle Airport, for an investment of approximately 50 million euros. The site offers the potential to develop a state-of-the-art logistics campus of approximately 70,000 m² GLA, representing a total planned investment of approximately 100 million euros and reinforcing WDP’s French development pipeline.14
Saint-Jory
WDP entered into an agreement to acquire a 23.5-hectare land position at Saint-Jory, north of Toulouse, for an investment of approximately 17 million euros. Strategically located along the A62 motorway, the site offers the potential to develop approximately 62,000 m² GLA of a mixed-use logistics campus in a market characterised by strong occupier demand and limited availability of modern logistics space.15
The Netherlands
WDP acquired a 13.5-hectare brownfield site in South-West Netherlands. Strategically located between the ports of Rotterdam and Antwerp, the site offers the potential to develop approximately 40,000 m² GLA of logistics space and 60,000 m² of Industrial Outdoor Storage (IOS), securing a scarce development opportunity in a well-established logistics market and strengthening WDP’s long-term development pipeline.16
Romania
Bucharest - Ștefănești
WDP acquired a strategic land position of approximately 220,000 m² in Ștefănești, north-east of Bucharest and directly adjacent to WDP Park Bucharest – Ștefănești. Strategically located in the Bucharest logistics market, the site further strengthens WDP’s development pipeline in a market characterised by sustained demand.17
| 14 | See the press release of 11 May 2026. |
| 15 | See the press release of 11 May 2026. |
| 16 | See the press release of 7 July 2026. |
| 17 | See the press release of 24 April 2026. |
| Press release – 31 July 2026 | 13 |
Bucharest – Dragomirești ♦
WDP acquired a strategic land position of approximately 93,000 m² in Dragomirești, west of Bucharest and directly adjacent to WDP Park Bucharest – Dragomiresti. Located in one of Romania’s key logistics hubs, the site secures additional future development opportunities and further strengthens WDP’s long-term development pipeline.
1.2.4. Divestments in the first half of 2026
During the first half of 2026, WDP signed approximately 116 million euros of disposals. In addition to the strategic asset swap with the Luxembourg state, and allowing further structural streamlining of the Group structure, WDP crystallised strong value creation on approximately 60 million euros of disposals in the Netherlands and Romania, at an average sale price of 30% above the latest fair value and an unlevered IRR exceeding 20%.
Going forward, selective capital recycling forms a structural driver to unlock value. Instances where the value creation is fully built up and limited further portfolio potential remains over the long run, capital can be selectively redeployed into new opportunities at attractive risk-adjusted returns. On a portfolio approaching 10 billion euros, the platform provides a continuous source of value creation to selectively rotate capital, while preserving our focus on consistent earnings per share growth and delivering attractive total returns.
Luxembourg
Foetz
WDP sold the Foetz logistics site to the Luxembourg State. The site comprises a logistics property of approximately 17,000 m², adjacent to facilities where the Luxembourg State operates incubator activities.18
The Netherlands
Duiven
WDP completed the disposal of a logistics site in Duiven, the Netherlands, to end-user FedEx, supporting the expansion of its adjacent European road hub. Together with the disposal in Romania described below, the transactions involved approximately 61,000 m² of lettable area, reflecting WDP’s active portfolio management and its disciplined approach to capital recycling.19
Romania
WDP signed an agreement to dispose of a logistics site in Romania to an end-user, who will integrate the asset into its growing regional operations. The transaction forms part of the disposals described above, reflecting strong value creation through active portfolio management.20
| 18 | See the press release of 31 March 2026. |
| 19 | See the press release of 18 June 2026. |
| 20 | See the press release of 18 June 2026. |
| Press release – 31 July 2026 | 14 |
| Press release – 31 July 2026 | 15 |
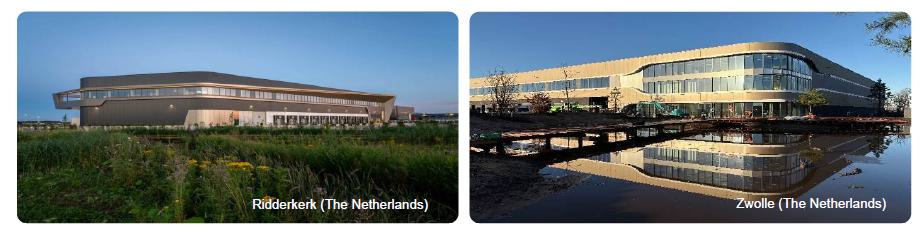
1.3. 128 million euros of fully pre-let development projects completed in the first half of 2026
WDP delivered a total lettable area of around 111,000 m² of fully pre-let projects in the first half of 2026. The NOI yield for the total of these projects, with an investment amount of 128 million euros, is 7.0%21. The average lease term is 14 years.
1.4. 113 million euros in acquisitions completed in the first half of 2026
WDP completed acquisitions with a total lettable area of around 78,000 m² in the first half of 2026. The NOI yield for the total of these acquisitions, with an investment amount of approximately 113 million euros, is 6.4%. The average lease term is around 11 years. Moreover, this includes land reserve in Romania which were further expanded by over 310,000 m², accounting for an investment of around 13 million euros.
1.5. Two battery energy storage systems brought into operation in the first half of 2026
WDP deployed two battery energy storage systems (BESS) in Belgium during the first half of 2026, adding 5.25 MW of power capacity and 14.5 MWh of energy storage capacity. The projects support grid balancing, optimise on-site energy use and facilitate client electrification, further strengthening WDP’s integrated energy platform. Further details on these projects are provided in section 1.8.3 Battery energy storage.
| 21 | This represents approximately 6.6% in Western Europe and 8.1% in Romania. |
| Press release – 31 July 2026 | 16 |
1.6. Investment pipeline in execution of around 760 million euros
As of 30 June 2026, WDP has a total investment pipeline in execution of 756 million euros with an expected NOI yield of 6.8%22. The cost to come is 588 million euros.
| Location | Tenant |
Planned delivery date |
Lettable area |
Investment budget (in € m) |
Cost to date (in € m) | Cost to
come | NOI yield
|
Pre-leased (in %) | ||||||||||||||||||||||
| BE | Gent | Beerselect | 3Q26 | 3,955 | 3 | |||||||||||||||||||||||||
| BE | Lokeren | KDL | 4Q27 | 17,924 | 20 | |||||||||||||||||||||||||
| BE | Various | WWRS * | 4Q26 | 7,179 | 2 | |||||||||||||||||||||||||
| BE | Grimbergen | In commercialisation | 4Q27 | 53,500 | 25 | |||||||||||||||||||||||||
| BE | Asse - Mollem | Lactalis | 2Q27 | 1,524 | 4 | |||||||||||||||||||||||||
| BE | Antwerpen | Fully let | 1Q28 | 22,600 | 54 | |||||||||||||||||||||||||
| FR | Vendin-le-Vieil | In commercialisation | 4Q26 | 14,779 | 10 | |||||||||||||||||||||||||
| NL | Kerkrade | In commercialisation | 4Q27 | 13,735 | 14 | |||||||||||||||||||||||||
| NL | Veghel | Kuehne + Nagel | 4Q27 | 12,500 | 21 | |||||||||||||||||||||||||
| NL | Zwolle | Scania | 3Q27 | 39,000 | 45 | |||||||||||||||||||||||||
| NL | Schiphol | Partially let | 4Q27 | 22,507 | 21 | |||||||||||||||||||||||||
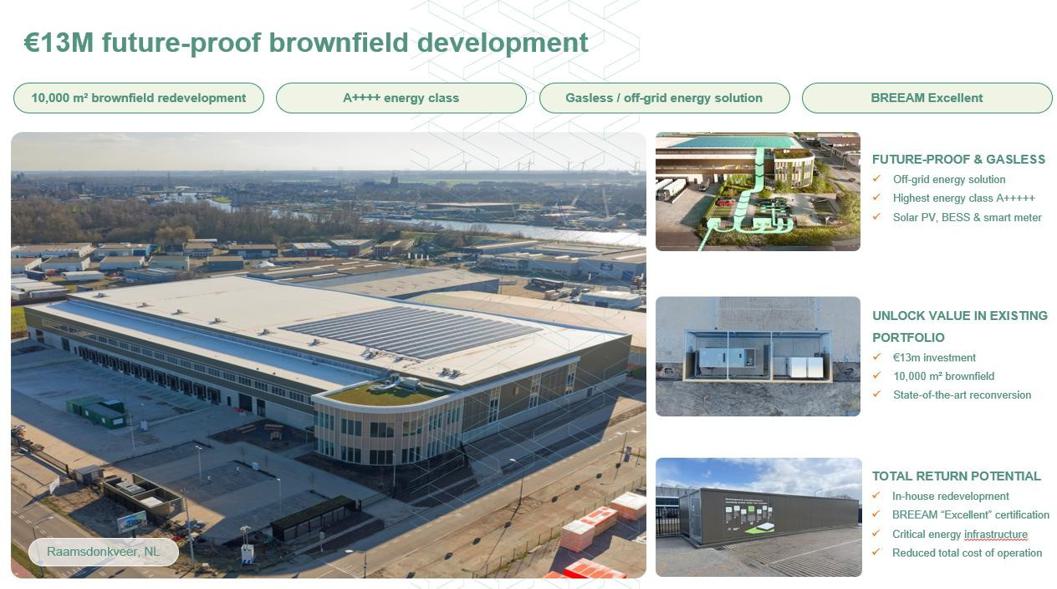
| NL | Raamsdonkveer | Partially let | 3Q26 | 10,300 | 13 | |||||||||||||||||||||||||
| RO | Sibiu | Siemens | 4Q27 | 14,950 | 14 | |||||||||||||||||||||||||
| RO | Bucharest - Dragomiresti | Aquila | 1Q27 | 47,231 | 44 | |||||||||||||||||||||||||
| RO | Deva | HAVI | 1Q27 | 5,924 | 4 | |||||||||||||||||||||||||
| RO | Deva | Auchan | 4Q26 | 9,442 | 8 | |||||||||||||||||||||||||
| RO | Cluj-Apahida | Dr. Max | 2Q27 | 10,827 | 9 | |||||||||||||||||||||||||
| RO | Bucharest - Stefanestii | Action | 4Q26 | 54,000 | 40 | |||||||||||||||||||||||||
| RO | Bucharest - Stefanestii | Auchan | 2Q27 | 14,180 | 9 | |||||||||||||||||||||||||
| RO | Bucharest - Stefanestii | Aggreko | 4Q27 | 1,200 | 2 | |||||||||||||||||||||||||
| RO | Bucharest - Stefanestii | FAN Courier Group | 3Q27 | 32,000 | 23 | |||||||||||||||||||||||||
| Projects under development | 409,257 | 383 | 98 | 285 | 7.4 | % | 83 | % | ||||||||||||||||||||||
| BE | Gent | Increase in JV stake | 3Q26 | N.R. | 33 | |||||||||||||||||||||||||
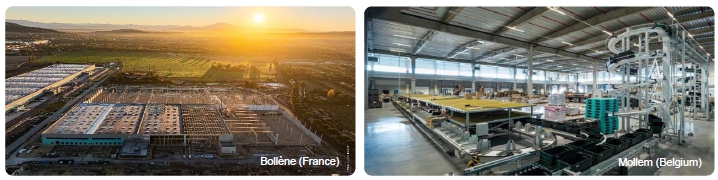
| FR | Bollène | Boulanger | 4Q26 | 76,077 | 96 | |||||||||||||||||||||||||
| FR | Vendargues | Fully let | 3Q26 | 26,829 | 25 | |||||||||||||||||||||||||
| FR | Alzonne | DHL | 3Q26 | 23,328 | 27 | |||||||||||||||||||||||||
| NL | Zwolle | Fully let | 4Q27 | 18,700 | 24 | |||||||||||||||||||||||||
| NL | Zwolle | Scania Production | 4Q26 | 14,300 | 23 | |||||||||||||||||||||||||
| NL | Nijverdal | Ten Cate | 2Q27 | 41,000 | 43 | |||||||||||||||||||||||||
| Acquisition of real estate | 159,234 | 272 | 52 | 220 | 6.0 | % | 100 | % | ||||||||||||||||||||||
| Group | Various | Battery park | 4Q29 | 40 | ~10-15 | %IRR | ||||||||||||||||||||||||
| Group | Various | Solar panels | 1Q27 | 57 | ~8 | %IRR | ||||||||||||||||||||||||
| Group | Various | Charging hubs | 3Q26 | 4 | ~10 | %IRR | ||||||||||||||||||||||||
| Energy investments | N.R. | 101 | 18 | 83 | ~10 | %IRR | ||||||||||||||||||||||||
| Total pipeline in execution | 568,491 | 756 | 168 | 588 | 6.8 | % | 90 | % | ||||||||||||||||||||||
| * | Joint venture |
| 22 | Excludes projects in energy and land reserves. |
| Press release – 31 July 2026 | 17 |
Development projects currently in execution represent an investment of 383 million euros and a lettable area of about 410,000 m². As of 30 June 2026, the pre-let rate further increases to 83%, even after the completion of approximately 112,000 m² of fully pre-let development projects.
WDP remains committed to its policy of pre-leasing before the start of development, while remaining flexible for a limited number of exceptions such as cluster expansion, remediation-linked projects and multi-tenant development projects for smaller units in specific locations. With supply still scarce and market development activity declining, WDP remains confident in the successful commercialisation of these projects upon delivery. This disciplined approach is reflected in WDP’s total pipeline in execution, which is 90% pre-let.
1.7. Further development potential
WDP currently holds land reserves with the potential to develop approximately 2.4 million m² of lettable area across its core logistics markets. This includes over 820,000 m² of additional land reserves which were secured during H1 2026, predominantly in Western Europe, creating scarce future pre-let development opportunities in prime logistics locations. Together, these land reserves reinforce WDP’s long-term development potential and support the continued build-out of its integrated European logistics platform.
| Press release – 31 July 2026 | 18 |
1.8. WDP Energy
Integrated energy solutions for future logistics
Electrification and the decarbonisation of the supply chain are reshaping the energy profile of transport, logistics and industrial real estate. As consumption patterns change and e-transport becomes more widespread, demand for reliable, sustainable energy as well as for more advanced solutions and supporting infrastructures is increasingly growing.
Geopolitical tensions and persistent volatility in energy markets (notably in oil prices) continue to reshape how logistics operators think about energy, with a growing focus on energy independence, resilience and cost control. Against this backdrop, WDP’s Energy business is directly positioned to respond to client energy needs, helping improve self-sufficiency and decarbonise their supply chain by increasing the use of green energy production and technology.
More than a warehouse: the logistics powerhouse
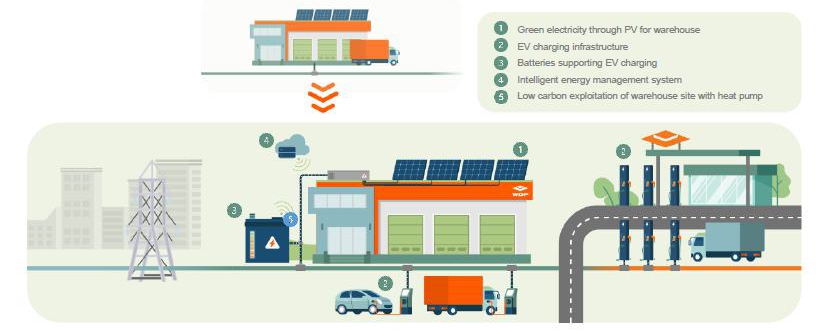
As a real estate partner, WDP plays a crucial role in building efficient, future-proof and cost-effective supply chains. WDP’s approach combines different pillars:
| ● | on-site energy production (solar PV), |
| ● | on-site efficiency solutions (e.g., LED lightning, electric heat pumps and intelligent energy management systems), |
| ● | mobility solutions (e.g., smart EV charging facilities) and |
| ● | energy storage (behind-the-meter batteries and front-of-the-meter grid-support storage). |
By upgrading existing warehouses into energy hubs and embedding the required infrastructure across its portfolio, WDP helps its clients bring down emissions, optimise energy use, reduce grid dependence and ensure operational continuity as electrification accelerates.
WDP ENERGY expects revenues to double towards 50 million euros by 2030.23 Earnings contribution will be gradual and non-linear, reflecting the high project complexity and external factors such as permitting, grid-connection lead times as well as lower energy prices.
| 23 | Includes annual revenue of 7 million euros from green energy certificates for projects in Belgium delivered before 2013, which will gradually expire in the period 2028-2032. |
| Press release – 31 July 2026 | 19 |
1.8.1. Solar energy: scaling renewable energy production across the portfolio
WDP currently has a total installed solar energy production capacity of 274 MWp. As of 30 June 2026, 82 MWp is under development, representing an investment budget of 65 million euros. WDP targets an IRR of ~8% and a yield on cost of around 10–15%. WDP aims to reach a total capacity of 350 MWp by end-2027 and subsequently grow in line with the pace of new development projects.
1.8.2. Green Mobility Solutions
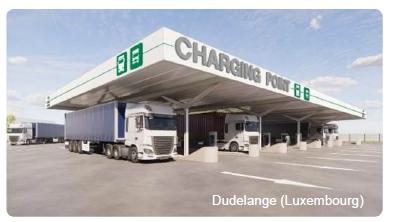
WDP expands its Green Mobility solutions by integrating on-site energy, storage and charging infrastructure to optimise clients’ energy profiles and support the electrification of transport. In Dudelange, Luxembourg, construction of a charging hub with eight truck charging points and four passenger vehicle charging points, providing 1,600 kW of installed charging capacity, will commence in 2026. |
 |
In Bleiswijk, the Netherlands, a truck charging hub with six high-power charging points, providing 600 kW of installed charging capacity, will become operational by the end of 2026.
1.8.3. Battery energy storage
Grid-support storage: front-of-the-meter (FTM) battery energy storage system (BESS)
WDP installed a FTM BESS in Vilvoorde (Belgium), with a total capacity of 3 MW and an energy storage capacity of 10 MWh. Paired with a 3.8 MWp photovoltaic installation, the battery supports grid balancing by storing surplus solar energy and shifting it to periods of high demand and limited renewable energy supply. The project also represents a strategic investment that supports the future electrification of WDP’s customer portfolio.
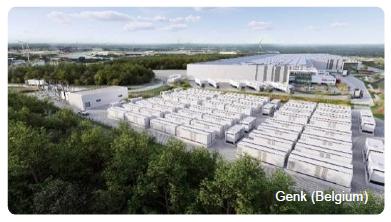
WDP will develop a FTM BESS in Genk (Belgium). The battery park will support grid balancing by storing surplus electricity and reserving capacity during peaks or shortages, thereby strengthening grid stability and flexibility, and helping manage price volatility. The battery park has a total capacity of 60 MW and up to 240 MWh energy storage capacity. Therefore, at full output, the battery can operate for four hours. |
 |
The investment budget amounts to 40 million euros. WDP will develop and invest in the project and work with a specialised partner for operations. The project was also selected in the auction for the Capacity Remuneration Mechanism, through which a guaranteed base return can be obtained. The installation is expected to become operational by end-2029.
| Press release – 31 July 2026 | 20 |
Behind-the-meter (BTM) BESS project
In parallel, WDP is rolling out BTM battery systems at selected high-energy sites with PV installations, including e-mobility hubs. These on-site projects maximise local consumption of solar power, reduce grid reliance and support operational continuity. WDP sees battery storage as an important enabler, but the execution will depend on securing grid connections, an increasingly challenging process as the grid becomes saturated.
| As part of this rollout, WDP installed a BTM BESS in Bornem (Belgium), with a total capacity of 2.25 MW and an energy storage capacity of 4.5 MWh. The battery complements the site’s 3 MWp photovoltaic installation and enables a higher share of locally generated solar energy to be consumed on site. It helps reduce peak electricity demand, optimise energy costs for the tenant and support more efficient use of the existing grid connection. The investment also supports the site’s ongoing electrification. | 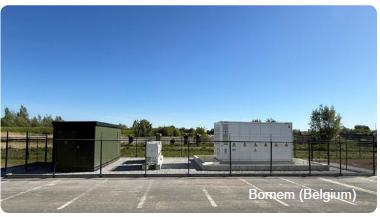 |
1.8.4. Green retrofit: Logistics campus in Belgium
At a 120,000 m² logistics campus in Belgium, WDP is executing a 3 million euros green retrofit, replacing conventional gas-based heating with an electric heat pump solution. Powered by on-site solar energy and supported by battery storage, the integrated solution enhances energy efficiency, reduces operating costs and supports further electrification. Completion is expected by Q3 2026.
| Press release – 31 July 2026 | 21 |
| 2. Corporate governance | SUSTAINABLE GROWTH |
2.1. WDP strengthens European leadership through local and Group-level capabilities
WDP further strengthened its European platform through a series of key appointments, combining deep local market expertise with enhanced Group-level operational capabilities. These appointments contribute to the continued expansion of WDP’s fully integrated European platform in line with its #BLEND&EXTEND2030 growth plan and ambition to scale to a core €10bn+ logistics real estate platform, supporting disciplined execution and consistent earnings per share growth.
Local leadership across European markets
During the first half of 2026, WDP continued to build its local presence across its European markets with the appointment of Jurgen Bevelander as Country Manager the Netherlands, Joan Lacosta as country Manager Spain and Benjamin Khafi Grynfas as Country Manager Italy.24,25
These appointments reinforce WDP’s integrated European platform by combining strong local market expertise with the scale and capabilities of a European organisation, enabling WDP to capture growth opportunities and execute consistently across both established and new markets.
Enhancing operational capabilities at Group level
WDP appointed William Lerinckx26, as Chief Operating Officer to support disciplined execution and the continued development of its European logistics platform. With more than 25 years of international real estate experience and in-depth expertise across the full real estate value chain, he joins WDP’s Executive Committee alongside CEO Joost Uwents and CFO Mickaël Van den Hauwe.
Robert Woerdeman appointed as Group European Investment Manager
In May 2026, WDP appointed Robert Woerdeman as Group European Investment Manager. The creation of this Group-level role reflects the continued development of WDP’s European platform and its growing presence across key logistics markets. In this role, Robert supports the Executive Committee in identifying and evaluating growth opportunities across WDP’s existing and target European markets, ensuring alignment with WDP’s return criteria and long-term EPS growth ambitions. He brings more than 20 years of experience in European real estate across investment and capital markets.
“As WDP continues to expand its integrated European platform, we are further strengthening our organisation through local leadership across European markets, combined with enhanced Group-level operational capabilities.
This enables us to execute with consistency and discipline across both new and established markets, supporting consistent earnings per share growth while remaining focused on delivering above-average growth with a below-average risk profile, fully in line with our #BLEND&EXTEND2030 ambitions. Joost Uwents – CEO WDP
| 24 | See press release of 12 February 2026. |
| 25 | See press release of 15 April 2026. |
| 26 | Through Lerinvestimmo CommV. |
| Press release – 31 July 2026 | 22 |
| 3. #TeamWDP | VITALLY ENGAGED |
3.1. Third consecutive Great Place To Work® certification
In 2026, WDP was certified as a Great Place To Work® for the third consecutive year. This recognition reflects WDP’s continued commitment to fostering a high-trust workplace culture where employees can thrive, develop and contribute to the company’s long-term success.
Great Place To Work® is the global authority on workplace culture. Its certification is based on a comprehensive employee survey assessing trust, workplace experience and opportunities for personal and professional development, benchmarked against global standards. |
 |
3.2. International #TeamWDP event in The Hague
WDP’s annual international #TeamWDP event brought together 150 colleagues from seven countries in The Hague for three days of collaboration, knowledge sharing team building. Through workshops, keynote sessions and interactive activities, colleagues exchanged best practices, strengthened cross-border collaboration and reinforced alignment across WDP’s integrated European platform. The event reflects WDP’s commitment to fostering a strong, connected organisation built on teamwork, knowledge sharing and a shared purpose.

| Press release – 31 July 2026 | 23 |
| 4. ESG benchmark and performance | SUSTAINABLE GROWTH |
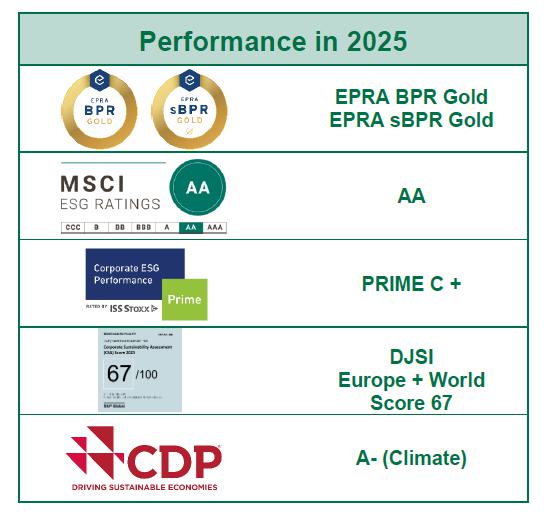
4.1. ESG benchmark and performance
WDP’s active participation in assessments, ratings and reporting according to recognised international standards underlines its ambition to take a prominent role in sustainability.
| Press release – 31 July 2026 | 24 |
II. The share
1. Share performance
Figures per share
| 30.06.2026 | 31.12.2025 | 31.12.2024 | ||||||||||
| Number of shares in circulation on closing date | 240,543,824 | 235,139,589 | 225,534,676 | |||||||||
| Free float | 81 | % | 81 | % | 79 | % | ||||||
| Market capitalisation (in euros) | 5,306,396,757 | 5,201,287,709 | 4,285,158,844 | |||||||||
| Traded volume in shares | 52,352,272 | 108,313,659 | 70,073,859 | |||||||||
| Average daily volume (in euros) | 9,699,423 | 8,944,656 | 6,597,492 | |||||||||
| Free float velocity¹ | 53.8 | % | 57.0 | % | 39.2 | % | ||||||
| Stock exchange price | ||||||||||||
| highest | 26.0 | 23.1 | 28.2 | |||||||||
| lowest | 21.3 | 18.2 | 18.8 | |||||||||
| closing | 22.1 | 22.1 | 19.0 | |||||||||
| IFRS NAV² (in euros) | 20.9 | 21.3 | 21.0 | |||||||||
| EPRA NTA (in euros)♦ | 21.4 | 21.9 | 21.1 | |||||||||
| Dividend payout ratio | n.r. | 82 | % | 81 | % | |||||||
| EPRA Earnings/share³ (in euros) | 0.79 | 1.53 | 1.50 | |||||||||
| EPRA Earnings/share⁴ (in euros) | 0.78 | 1.50 | 1.48 | |||||||||
| Gross dividend/share (in euros) | n.r. | 1.23 | 1.20 | |||||||||
| Net dividend/share (in euros)⁵ | n.r. | 0.86 | 0.84 | |||||||||
| The Alternative Performance Measures (APM), used by WDP, are accompanied by a symbol (♦). The definition and reconciliation can be consulted in the Annexes of this document. |
| 1 | The number of shares traded per half-year divided by the total number of free float shares at the end of term and then extrapolated to a term of twelve months. |
| 2 | IFRS NAV: the IFRS NAV is calculated as shareholder equity as per IFRS divided by the number of dividend-entitled shares on the balance sheet date. It pertains to the net value per share of the public GVV/SIR according to GVV/SIR legislation. |
| 3 | On the basis of the pro-rata-temporis basis for the weighted average number of shares over the period. |
| 4 | On the basis of the number of shares entitled to dividend at the end of each period. |
| 5 | On the basis of the standard withholding tax rate of 30%. |
EURONEXT
Brussels and Amsterdam Listing: continuous ISIN code: BE0003763779 Liquidity provider: Van Lanschot Kempen and KBC Securities |
 |
| Press release – 31 July 2026 | 25 |
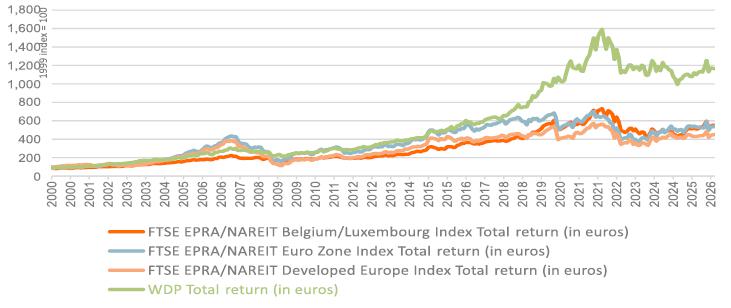
WDP share return versus EPRA indices
Share price versus EPRA NTA
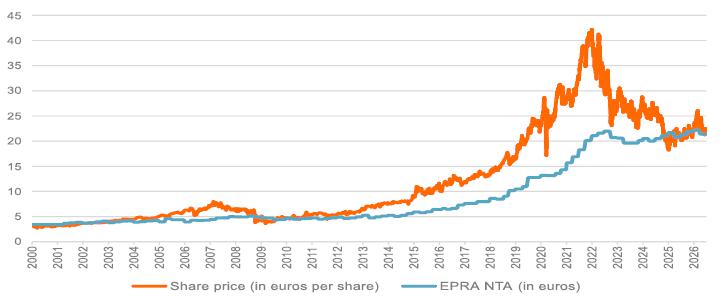
Value creation at every stage of the market cycle
Thanks to its integrated model as both developer and long-term end investor, WDP is able to remain active as a net investor over the full value curve through market cycles. Almost two thirds of the portfolio has been created through in-house developments, complemented by selective value-add acquisitions, landbank and strategic platform expansion. This provides the flexibility to allocate capital where the best risk-adjusted opportunities emerge across the risk spectrum aligned with market cycles and price evolutions while maintaining disciplined underwriting and a below-average risk profile.
With #BLEND&EXTEND2030, the five-year growth plan for 2026-2030, WDP builds on its proven multi-driver growth model to further scale its European platform beyond 10 billion euros. Earnings per share growth is driven by a blend of drivers, including pre-let developments, selective acquisitions, internal growth through indexation and rent reversion, energy infrastructure, and gradual expansion into Spain and Italy. The strategy is underpinned by strong self-financing capacity, an A3-rated balance sheet and disciplined capital allocation.
| Press release – 31 July 2026 | 26 |
Stable growth with a focus on long-term value creation
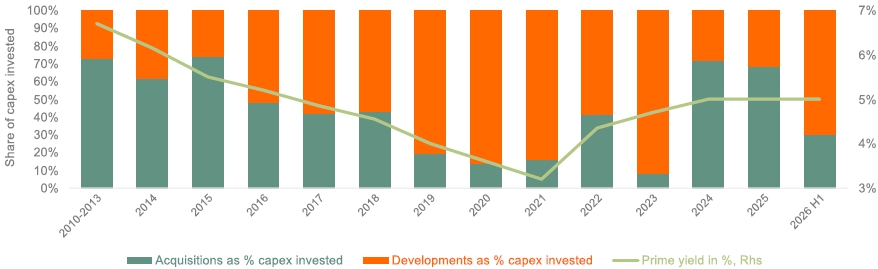

Following the recovery in the capital market cycle since 2024 and demand gradually picking up since 2025, WDP expects balanced growth between high-quality pre-let developments with selective acquisitions and strategic land expansion for future growth. At the same time, its extensive landbank and integrated development platform provide substantial visibility on future cash flow growth.
While geopolitical and macroeconomic uncertainty remains elevated, the structural fundamentals for logistics real estate continue to strengthen. Europe’s growing focus on supply chain resilience, energy security, regionalisation and strategic inventories reinforces the role of logistics real estate as critical infrastructure. Supported by its local market expertise, strong client relationships and scalable European platform, WDP is well positioned to continue capturing attractive investment opportunities while delivering sustainable earnings growth and long-term shareholder value.
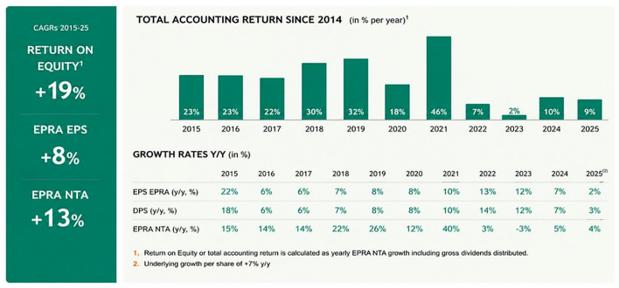
Superior total return by navigating the capital cycle
| Press release – 31 July 2026 | 27 |
2. Shareholding
| Number of shares (declared) | Date of the statement | (In %) | ||||||||||
| Free float | 194,557,356 | 80.9 | % | |||||||||
| BlackRock-related companies¹ | 11,731,900 | 06.05.2026 | 4.9 | % | ||||||||
| BNP Paribas Asset Management Holding¹ | 7,110,412 | 25.03.2026 | 3.0 | % | ||||||||
| Norges Bank¹ | 11,693,570 | 13.05.2026 | 4.9 | % | ||||||||
| Other shareholders under the statutory treshold² | 164,021,474 | 20.05.2026 | 68.2 | % | ||||||||
| Family Jos De Pauw (reference shareholder)³ | 45,986,468 | 20.05.2026 | 19.1 | % | ||||||||
| Total | 240,543,824 | 100 | % | |||||||||
| 1 | The percentage is determined under the assumption that the number of shares has not changed since the most recent declaration of transparency, and taking into account the total number of outstanding shares in WDP. |
| 2 | The number of publicly held shares was determined under the assumption that since the declarations of transparency, nothing has changed with regard to the composition of the share portfolio of the shareholders obligated to report major holdings by virtue of the Belgian Law of 2 May 2007 on disclosure of major holdings in issuers whose shares are admitted for trading on a regulated market and with various provisions. |
| 3 | On 26 October 2012, the Reference Shareholder, the Jos De Pauw family, assigned all of its shares, held in mutual concert, in joint ownership under the family company structure RTKA, which institutionalised the existing mutual concert. The holders of voting rights are the members of the management body RTKA, to the exclusion of all other right holders in respect to the participation. |
3. Financial calendar
| 31 July 2026 | Publication of HY 2026 results | |
| 23 October 2026 | Publication of Q3 2026 results | |
| 29 January 2027 | Publication of 2026 annual results | |
| 30 July 2027 | Publication of HY 2027 results | |
| 22 October 2027 | Publication of Q3 2027 results | |
| 29 January 2028 | Publication of 2027 annual results |
For any changes, reference is made to the financial agenda on the WDP website.
| Press release – 31 July 2026 | 28 |
III. Financial results
EPRA key performance indicators
| 30.06.2026 | 31.12.2025 | |||||||
| EPRA NTA (in euros per share) | 21.4 | 21.9 | ||||||
| EPRA NRV (in euros per share) | 23.4 | 23.9 | ||||||
| EPRA NDV (in euros per share) | 21.3 | 21.8 | ||||||
| EPRA LTV (in %) | 42.8 | 41.9 | ||||||
| EPRA Net Initial Yield (in %) | 5.5 | 5.4 | ||||||
| EPRA Topped-up Net Initial Yield (in %) | 5.5 | 5.4 | ||||||
| EPRA vacancy rate (in %) | 2.8 | 2.3 | ||||||
| EPRA Cost Ratio (incl. direct vacancy costs) (in %) | 11.2 | 10.9 | ||||||
| EPRA Cost Ratio (excl. direct vacancy costs) (in %) | 10.5 | 10.4 | ||||||
The definition and reconciliation of the Alternative Performance Measures (APM), for example the EPRA key performance measures, used by WDP, are to be consulted in the Annexes of this document.
| Press release – 31 July 2026 | 29 |
Consolidated key figures
| Operational | 30.06.2026 | 31.12.2025 | ||||||
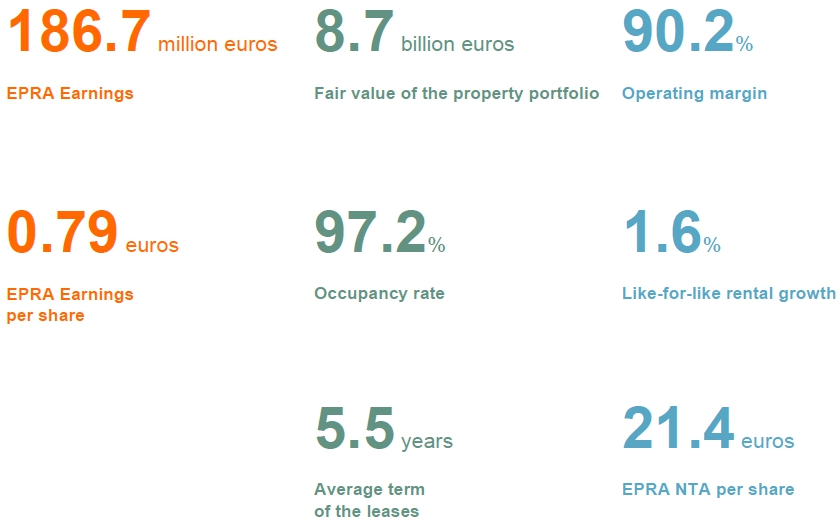
| Fair value of property portfolio (including solar panels) (in million euros) | 8,748.4 | 8,584.0 | ||||||
| Gross initial yield (including vacancies)¹ (in %) | 6.3 | 6.2 | ||||||
| Net initial yield (EPRA) (in %) | 5.5 | 5.4 | ||||||
| Average lease term (until first break) (in years) | 5.5 | 5.6 | ||||||
| Occupancy rate² (in %) | 97.2 | 97.7 | ||||||
| Like-for-like rental growth (in %)♦ | 1.6 | 2.3 | ||||||
| Operating margin³ (in %)♦ | 90.2 | 90.3 | ||||||
| Financial | 30.06.2026 | 31.12.2025 | ||||||
| Loan-to-value (in %)♦ | 41.6 | 40.1 | ||||||
| Gearing ratio (proportionate) (in line with the GVV/SIR Royal Decree) (in %) | 43.5 | 42.2 | ||||||
| Net debt / EBITDA (adjusted) (in x)♦ | 7.6 | 7.5 | ||||||
| Interest Coverage Ratio⁴ (in x) | 4.9 | 5.0 | ||||||
| Average cost of debt (in %)♦ | 2.4 | 2.4 | ||||||
| Average remaining duration of outstanding debt (in years) | 4.2 | 4.3 | ||||||
| Weighted average maturity of all drawn and undrawn credit lines | 4.2 | 4.6 | ||||||
| Hedge ratio (in %)♦ | 82 | 89 | ||||||
| Average remaining term of hedges⁵ (in years) | 3.8 | 4.2 | ||||||
| Result (in million euros) | 30.06.2026 | 30.06.2025 | ||||||
| Property result | 250.4 | 228.3 | ||||||
| Operating result (before the result on the portfolio) | 225.9 | 206.1 | ||||||
| Financial result (excluding change in the fair value of financial instruments)♦ | -42.4 | -36.9 | ||||||
| EPRA Earnings♦ | 186.7 | 171.2 | ||||||
| Result on the portfolio - Group share♦ | 5.0 | -12.3 | ||||||
| Change in the fair value of financial instruments - Group share | -1.4 | -13.4 | ||||||
| Depreciation and write-down on solar panels - Group share | -3.7 | -6.3 | ||||||
| Net result (IFRS) - Group share | 186.6 | 139.2 | ||||||
| Details per share (in euros) | 30.06.2026 | 30.06.2025 | ||||||
| EPRA Earnings♦ | 0.79 | 0.75 | ||||||
| Result on the portfolio - Group share♦ | 0.02 | -0.05 | ||||||
| Change in fair value of the financial instruments - Group share | -0.01 | -0.06 | ||||||
| Depreciation and write-down on solar panels - Group share | -0.02 | -0.03 | ||||||
| Net result (IFRS) - Group share | 0.79 | 0.61 | ||||||
| IFRS NAV⁶ | 20.9 | 20.4 | ||||||
| EPRA NTA♦ | 21.4 | 20.8 | ||||||
| EPRA NRV♦ | 23.4 | 22.8 | ||||||
| EPRA NDV♦ | 21.3 | 20.7 | ||||||
The Alternative Performance Measures (APM), for example the EPRA key performance measures, used by WDP, are accompanied by a symbol (♦). Their definition and reconciliation can be consulted in the Annexes of this document.
| 1 | Calculated by dividing annualised contractual gross (cash) rents by fair value. The fair value is the value of the property investments after deduction of transaction costs (mainly transfer tax). |
| 2 | Calculated based on the rental values for the leased properties and the non-leased surfaces. Ongoing projects and/or renovations are not considered. |
| 3 | Based on the comparison between H1 2026 and H1 2025. |
| 4 | Defined as operating result (before the result on the portfolio) divided by interest charges less interest and dividends collected less the fee for financial leasing and other. |
| 5 | The remaining duration of debt at fixed rate and interest rate hedges entered into to hedge the debt against interest rate fluctuations. |
| 6 | IFRS NAV: Net asset value before profit distribution of the current year in accordance with the IFRS balance sheet. The IFRS NAV is calculated as the shareholders’ equity as per IFRS divided by the number of shares entitled to dividend on the balance sheet date. |
| Press release – 31 July 2026 | 30 |
1. Notes to the earnings statement
Consolidated results (analytical scheme)
| (in euros x 1,000) | H1 2026 | H1 2025 | ∆ y/y (abs.) | ∆ y/y (%) | ||||||||||||
| Rental income, net of rental-related expenses | 238,669 | 220,831 | 17,839 | 8.1 | % | |||||||||||
| Indemnification related to early lease terminations | 2,569 | 0 | 2,569 | n.r. | ||||||||||||
| Income from energy investments | 14,010 | 13,280 | 730 | 5.5 | % | |||||||||||
| Other operating income/costs | -4,873 | -5,815 | 942 | n.r. | ||||||||||||
| Property result | 250,375 | 228,295 | 22,080 | 9.7 | % | |||||||||||
| Property charges | -11,820 | -10,486 | -1,334 | 12.7 | % | |||||||||||
| General company expenses | -12,694 | -11,726 | -969 | 8.3 | % | |||||||||||
| Operating result (before the result on the portfolio) | 225,861 | 206,084 | 19,778 | 9.6 | % | |||||||||||
| Financial result (excluding change in the fair value of the financial instruments) | -42,440 | -36,884 | -5,557 | 15.1 | % | |||||||||||
| Taxes on EPRA Earnings | -6,451 | -8,380 | 1,928 | n.r. | ||||||||||||
| Deferred taxes on EPRA Earnings | 0 | 0 | 0 | n.r. | ||||||||||||
| Share in the result of associated companies and joint ventures | 9,711 | 10,377 | -666 | n.r. | ||||||||||||
| Minority interests | 0 | 0 | 0 | n.r. | ||||||||||||
| EPRA Earnings | 186,681 | 171,197 | 15,484 | 9.0 | % | |||||||||||
| Variations in the fair value of investment properties (+/-) | 10,492 | 19,787 | -9,296 | n.r. | ||||||||||||
| Result on disposal of investment property (+/-) | 11,130 | 135 | 10,995 | n.r. | ||||||||||||
| Deferred taxes on the result on the portfolio (+/-) | -20,331 | -32,230 | 11,898 | n.r. | ||||||||||||
| Share in the result of associated companies and joint ventures | 3,738 | 55 | 3,684 | n.r. | ||||||||||||
| Result on the portfolio | 5,029 | -12,252 | 17,282 | n.r. | ||||||||||||
| Minority interests | 0 | 0 | 0 | n.r. | ||||||||||||
| Result on the portfolio - Group share | 5,029 | -12,252 | 17,282 | n.r. | ||||||||||||
| Change in the fair value of financial instruments | -1,420 | -12,995 | 11,575 | n.r. | ||||||||||||
| Share in the result of associated companies and joint ventures | 44 | -428 | 472 | n.r. | ||||||||||||
| Change in the fair value of financial instruments | -1,375 | -13,423 | 12,047 | n.r. | ||||||||||||
| Minority interests | 0 | 0 | 0 | n.r. | ||||||||||||
| Change in the fair value of financial instruments - Group share | -1,375 | -13,423 | 12,047 | n.r. | ||||||||||||
| Depreciation and write-down on solar panels | -3,346 | -5,713 | 2,366 | n.r. | ||||||||||||
| Share in the result of associated companies and joint ventures | -353 | -622 | 270 | n.r. | ||||||||||||
| Depreciation and write-down on solar panels | -3,699 | -6,335 | 2,636 | n.r. | ||||||||||||
| Minority interests | 0 | 0 | 0 | n.r. | ||||||||||||
| Depreciation and write-down on solar panels - Group share | -3,699 | -6,335 | 2,636 | n.r. | ||||||||||||
| Net result (IFRS) | 186,636 | 139,187 | 47,449 | n.r. | ||||||||||||
| Minority interests | 0 | 0 | 0 | n.r. | ||||||||||||
| Net result (IFRS) - Group share | 186,636 | 139,187 | 47,449 | n.r. | ||||||||||||
Key ratios
| (in euros per share) | H1 2026 | H1 2025 | ∆ y/y (abs.) | ∆ y/y (%) | ||||||||||||
| EPRA Earnings¹ | 0.79 | 0.75 | 0.04 | 4.8 | % | |||||||||||
| Result on the portfolio - Group share¹ | 0.02 | -0.05 | 0.08 | n.r. | ||||||||||||
| Change in the fair value of financial instruments - Group share¹ | -0.01 | -0.06 | 0.05 | n.r. | ||||||||||||
| Depreciation and write-down on solar panels - Group share¹ | -0.02 | -0.03 | 0.01 | n.r. | ||||||||||||
| Net result (IFRS) - Group share¹ | 0.79 | 0.61 | 0.18 | n.r. | ||||||||||||
| EPRA Earnings² | 0.78 | 0.74 | 0.04 | 5.5 | % | |||||||||||
| Weighted average number of shares | 236,363,753 | 227,092,339 | 9,271,414 | 4.1 | % | |||||||||||
| Number of shares entitled to dividend | 240,543,824 | 232,653,901 | 7,889,923 | 3.4 | % | |||||||||||
| 1 | Calculation based on the weighted average number of shares. |
| 2 | Calculation based on the number of shares entitled to dividend. |
| Press release – 31 July 2026 | 31 |
Consolidated results
| (in euros x 1,000) | Q2 2026 | Q2 2025 | ∆ y/y (abs.) | ∆ y/y (%) | ||||||||||||
| Rental income, net of rental-related expenses | 120,350 | 110,727 | 9,622 | 8.7 | % | |||||||||||
| Indemnification related to early lease terminations | 0 | 0 | 0 | n.r. | ||||||||||||
| Income from energy investments | 9,476 | 8,733 | 743 | 8.5 | % | |||||||||||
| Other operating income/costs | 1,415 | 658 | 757 | n.r. | ||||||||||||
| Property result | 131,240 | 120,118 | 11,122 | 9.3 | % | |||||||||||
| Property charges | -5,910 | -5,207 | -703 | 13.5 | % | |||||||||||
| General company expenses | -6,633 | -6,235 | -397 | 6.4 | % | |||||||||||
| Operating result (before the result on the portfolio) | 118,698 | 108,676 | 10,021 | 9.2 | % | |||||||||||
| Financial result (excluding change in the fair value of the financial instruments) | -22,047 | -19,079 | -2,969 | 15.6 | % | |||||||||||
| Taxes on EPRA Earnings | -4,162 | -4,380 | 218 | n.r. | ||||||||||||
| Deferred taxes on EPRA Earnings | 0 | 0 | 0 | n.r. | ||||||||||||
| Share in the result of associated companies and joint ventures | 5,321 | 5,372 | -51 | n.r. | ||||||||||||
| Minority interests | 0 | 0 | 0 | n.r. | ||||||||||||
| EPRA Earnings | 97,809 | 90,590 | 7,219 | 8.0 | % | |||||||||||
| Variations in the fair value of investment properties (+/-) | -2,897 | 8,582 | -11,480 | n.r. | ||||||||||||
| Result on disposal of investment property (+/-) | 11,251 | -69 | 11,321 | n.r. | ||||||||||||
| Deferred taxes on the result on the portfolio (+/-) | -7,353 | -12,180 | 4,827 | n.r. | ||||||||||||
| Share in the result of associated companies and joint ventures | 1,977 | -348 | 2,325 | n.r. | ||||||||||||
| Result on the portfolio | 2,978 | -4,015 | 6,993 | n.r. | ||||||||||||
| Minority interests | 0 | 0 | 0 | n.r. | ||||||||||||
| Result on the portfolio - Group share | 2,978 | -4,015 | 6,993 | n.r. | ||||||||||||
| Change in the fair value of financial instruments | -7,660 | -11,553 | 3,893 | n.r. | ||||||||||||
| Share in the result of associated companies and joint ventures | -389 | -1,163 | 773 | n.r. | ||||||||||||
| Change in the fair value of financial instruments | -8,049 | -12,716 | 4,667 | n.r. | ||||||||||||
| Minority interests | 0 | 0 | 0 | n.r. | ||||||||||||
| Change in the fair value of financial instruments - Group share | -8,049 | -12,716 | 4,667 | n.r. | ||||||||||||
| Depreciation and write-down on solar panels | -1,205 | -2,237 | 1,032 | n.r. | ||||||||||||
| Share in the result of associated companies and joint ventures | -350 | -584 | 234 | n.r. | ||||||||||||
| Depreciation and write-down on solar panels | -1,555 | -2,821 | 1,266 | n.r. | ||||||||||||
| Minority interests | 0 | 0 | 0 | n.r. | ||||||||||||
| Depreciation and write-down on solar panels - Group share | -1,555 | -2,821 | 1,266 | n.r. | ||||||||||||
| Net result (IFRS) | 91,183 | 71,039 | 20,145 | n.r. | ||||||||||||
| Minority interests | 0 | 0 | 0 | n.r. | ||||||||||||
| Net result (IFRS) - Group share | 91,183 | 71,039 | 20,145 | n.r. | ||||||||||||
Key ratios
| (in euros per share) | Q2 2026 | Q2 2025 | ∆ y/y (abs.) | ∆ y/y (%) | ||||||||||||
| EPRA Earnings¹ | 0.41 | 0.40 | 0.02 | 3.8 | % | |||||||||||
| Result on the portfolio - Group share¹ | 0.01 | -0.02 | 0.03 | n.r. | ||||||||||||
| Change in the fair value of financial instruments - Group share¹ | -0.03 | -0.06 | 0.02 | n.r. | ||||||||||||
| Depreciation and write-down on solar panels - Group share¹ | -0.01 | -0.01 | 0.01 | n.r. | ||||||||||||
| Net result (IFRS) - Group share¹ | 0.38 | 0.31 | 0.07 | n.r. | ||||||||||||
| EPRA Earnings² | 0.41 | 0.39 | 0.02 | 4.4 | % | |||||||||||
| Weighted average number of shares | 237,574,464 | 228,496,053 | 9,078,411 | 4.0 | % | |||||||||||
| Number of shares entitled to dividend | 240,543,824 | 232,653,901 | 7,889,923 | 3.4 | % | |||||||||||
| 1 | Calculation based on the weighted average number of shares. |
| 2 | Calculation based on the number of shares entitled to dividend. |
| Press release – 31 July 2026 | 32 |
1.1. Property result
The property result amounts to 250.4 million euros over the first half of 2026, an increase of +9.7% compared to last year (228.3 million euros). This strong increase stems from pre-let new development projects and acquisitions combined with organic rental growth. The like-for-like rental growth amounts to +1.6% (+2.3% over 2025), mainly driven by indexation and rent reversion and partially offset by some frictional vacancy, reflecting the usual tenant movement.
Gross rental income by country
| (in euros x 1,000) | Belgium | The Netherlands | France | Germany | Luxembourg | Romania | Total IFRS | Joint ventures¹ | ||||||||||||||||||||||||
| I. Rental income | 66,271 | 93,122 | 16,937 | 4,158 | 7,205 | 53,715 | 241,409 | 2,310 | ||||||||||||||||||||||||
| III. Expenses related to leases² | 127 | 154 | 446 | 0 | -164 | -733 | -170 | 0 | ||||||||||||||||||||||||
| Rental income, net of rental-related expenses | 66,398 | 93,275 | 17,383 | 4,158 | 7,041 | 52,982 | 241,238 | 2,310 | ||||||||||||||||||||||||
| 1 | Taking into account the proportional share in WDP’s rental income for joint ventures. |
| 2 | The heading Expenses related to leases consists of Provisions for trade receivables and Rent to be paid for leased premises. |
The property result also includes 14.0 million euros in solar panel income, compared to 13.3 million euros last year, driven by increased solar capacity. The solar production capacity will be further expanded. Contribution to the income statement, however, will be gradual, due to external factors such as increased complexity and longer lead time of these projects (e.g. grid connection challenges) and the impact of lower energy prices.
1.2. Operating result (before the result on the portfolio)
The operating result (before the result on the portfolio) amounts to 225.9 million euros over H1 2026, up by +9.6% compared to the same period last year (206.1 million euros). Property and other general expenses amount to 24.5 million euros in the first half of 2026 (22.2 million euros in H1 2025). At +10%, these items increase in line with the evolution of the property result, such that the operating margin remains high at 90.2%, compared to 90.3% in H1 2025. WDP expects to maintain its high annualised operating margin of above 90%.
1.3. Financial result (excluding the changes in fair value of financial instruments)
The financial result (excluding changes in the fair value of financial instruments) increased to - 42.4 million euros in H1 2026 compared to -36.9 million euros in H1 2025. This increase was predominantly driven by the cost of incremental debt drawn to finance growth opportunities and is in line with budget – with the total financial debt (as per IFRS) increasing to 3,724.3 million euros per H1 2026, compared to 3,504.7 million euros as at 31 December 2025.
WDP’s proactive financial management ensures the average all-in interest rate remains low and unchanged at 2.4% over H1 2026 and is still based on a high hedge ratio of 82%.
This result takes into account a limited amount of 4.4 million euros of capitalised interest on development projects (and therefore not the land bank). This financial result also includes the recurring interest rate cost for land under concession of 2.8 million euros, which is recognised via the Financial result in accordance with IFRS 16.
Together with the increase in the operating result (before the result on the portfolio), the Interest Coverage Ratio remains high at 4.9x (5.0x as of 31 December 2025).
| Press release – 31 July 2026 | 33 |
1.4. Share in the result of associated companies and joint ventures
The result of 9.7 million euros over H1 2026 mainly involves the contribution following the participation in Catena. In addition, during Q1 2026, WDP acquired the remaining 45% stake in WDP Luxembourg SA, bringing WDP’s ownership to 100%.27 As a result, WDP Luxembourg SA is now fully consolidated, and its results are no longer recognised under the equity method but are included line-by-line in the consolidated income statement.
1.5. Taxes
Taxes on EPRA Earnings (-6.5 million euros) mainly relate to the Netherlands and Romania, where no REIT regime applies. As a reminder, as of 1 January 2025, the Dutch REIT regime or FBI status no longer applies to WDP’s Dutch operations because of a change in legislation that excludes real estate investments from the FBI regime. This impact is already included in the earnings target of the growth plan.28
Deferred taxes on the portfolio result (-20.3 million euros) reflect the tax effect on unrealised revaluations and fiscal depreciation (see below 1.7. Result on the portfolio), and has no impact on cash flows or EPRA Earnings.
1.6. EPRA Earnings
WDP’s EPRA Earnings for H1 2026 amount to 186.7 million euros, up +9% over 171.2 million euros in H1 2025. This strong growth was driven by investment activity and organic rental growth of +1.6%, combined with persistently strong operating efficiency (90%+ operating margin) and a competitive cost of debt of 2.4%.
EPRA Earnings per share rose +4.8% to 0.79 euros compared to 0.75 in H1 2025, including a +4% increase in the weighted average number of shares outstanding, due to the strengthening of capital in 2025 and H1 2026.
1.7. Result on the portfolio (including the share of joint ventures) – Group share
The portfolio revaluation (excluding deferred taxes on the portfolio result and the result on sales of investment properties) is +9.4 million euros (Q1 2026: +15.2 million euros), a marginal increase of +0.1% year-to-date based on a 5.5% EPRA Net Initial Yield. This breaks down by country as follows: Belgium (+0.6 million euros), the Netherlands (+16.0 million euros), France (-8.2 million euros, predominantly reflecting a tenant leaving at a single building in the French portfolio, for which re-letting is ongoing based on commercial leads), Romania (+6.1million euros), Germany (-2.7 million euros), and Luxembourg (-2.4 million euros).
The result on the portfolio (including the share of joint ventures and after deferred taxes) – Group share for H1 2026 is 5.0 million euros or 0.02 euros per share. For the same period last year, this result amounted to -12.3 million euros or -0.05 euros per share. The deferred taxes reflect the tax impact of unrealised revaluations of the property portfolio and fiscal depreciation, with variations across the different markets.
| 27 | See the press release of 31 March 2026. |
| 28 | See VI. Outlook. |
| Press release – 31 July 2026 | 34 |
1.8. Change in the fair value of financial instruments – Group share
Changes in fair value of financial assets and liabilities – Group share29 amount to -1.4 million euros over H1 2026 or -0.01 euros per share (versus -13.4 million euros or -0.06 euros per share over H1 2025).
The fair value variation has no impact on cash and is an unrealised item, hence is excluded from the financial result in the analytical presentation of results and presented separately in the earnings statement.
1.9. Depreciation and write-down on solar panels (including share joint ventures) – Group share
The solar panels are valued on the balance sheet at fair value based on the revaluation model per IAS 16 Tangible fixed assets. In compliance with IAS 16, WDP must include a depreciation component in its IFRS accounts according to the residual service life of the solar panel parks. The depreciation is calculated based on the fair value from the previous balance sheet date. This newly calculated net book value is subsequently revalued at the fair value. This revaluation is booked directly in the equity capital insofar that it still exceeds the historical cost price, plus accumulated depreciations. If it does not, it is then accounted for in the earnings statement. The depreciation component and write-down is -3.7 million euros. Since this impact of the depreciation and amortisation of solar panels involves a non-cash and unrealised item, it is excluded from the operating result in the analytical presentation of the results and is shown separately in the earnings statement.
1.10. Net result (IFRS) – Group share
The EPRA Earnings, along with the result on the portfolio, changes in the fair value of financial instruments and the depreciation and write-down on solar panels result in a net result (IFRS) – Group share for H1 2026 of 186.6 million euros (compared to the same period last year, when it amounted to 139.2 million euros).
The marginal difference between net result (IFRS) – Group share of 186.6 million euros and the EPRA Earnings of 186.7 million euros is mainly due to the slight positive result on portfolio, offset by the limited negative variation of interest rate hedging instruments, and the deferred taxes and the depreciation of the solar panels.
| 29 | Changes in the fair value of financial assets and liabilities – Group share (a non-cash item) is calculated based on the mark-to-market (M-t-M) value of interest rate hedges concluded. |
| Press release – 31 July 2026 | 35 |
2. Notes to the balance sheet
Consolidated balance sheet
| (in euros x 1,000) | 30.06.2026 | 31.12.2025 | ∆ (abs.) | ∆ (%) | ||||||||||||
| Intangible fixed assets | 1,297 | 1,408 | -112 | n.r. | ||||||||||||
| Investment property | 8,436,827 | 8,207,921 | 228,907 | 2.8 | % | |||||||||||
| Other tangible fixed assets (energy assets inclusive) | 202,819 | 186,941 | 15,877 | 8.5 | % | |||||||||||
| Financial fixed assets | 43,084 | 40,262 | 2,822 | 7.0 | % | |||||||||||
| Trade receivables and other fixed assets | 2,821 | 237 | 2,584 | 1088.1 | % | |||||||||||
| Participations in associated companies and joint ventures | 353,405 | 390,777 | -37,372 | -9.6 | % | |||||||||||
| Fixed assets | 9,040,252 | 8,827,546 | 212,706 | 2.4 | % | |||||||||||
| Assets held for sale | 21,647 | 0 | 21,647 | n.r. | ||||||||||||
| Trade receivables | 46,672 | 40,746 | 5,926 | n.r. | ||||||||||||
| Tax receivables and other current assets | 25,459 | 17,252 | 8,207 | n.r. | ||||||||||||
| Cash and cash equivalents | 19,634 | 14,786 | 4,848 | n.r. | ||||||||||||
| Accruals and deferrals | 22,647 | 14,069 | 8,578 | n.r. | ||||||||||||
| Current assets | 136,057 | 86,852 | 49,205 | n.r. | ||||||||||||
| Total assets | 9,176,309 | 8,914,399 | 261,911 | 2.9 | % | |||||||||||
(in euros x 1,000) | 30.06.2026 | 31.12.2025 | ∆(abs.) | ∆(%) | ||||||||||||
| Capital | 250,132 | 244,047 | 6,085 | 2.5 | % | |||||||||||
| Issue premiums | 2,453,512 | 2,343,351 | 110,161 | 4.7 | % | |||||||||||
| Reserves | 2,125,673 | 2,076,885 | 48,788 | 2.3 | % | |||||||||||
| Net result for the financial year | 186,636 | 353,918 | -167,282 | -47.3 | % | |||||||||||
| Shareholders’ equity attributable to Group shareholders | 5,015,954 | 5,018,201 | -2,248 | 0.0 | % | |||||||||||
| Minority interests | 0 | 0 | 0 | n.r. | ||||||||||||
| Shareholders’ equity | 5,015,954 | 5,018,201 | -2,248 | 0.0 | % | |||||||||||
| Non-current financial debt | 3,444,576 | 3,242,454 | 202,122 | 6.2 | % | |||||||||||
| Other non-current liabilities | 282,954 | 237,197 | 45,757 | 19.3 | % | |||||||||||
| Non-current liabilities | 3,727,530 | 3,479,651 | 247,879 | 7.1 | % | |||||||||||
| Current financial debt | 279,753 | 262,232 | 17,521 | 6.7 | % | |||||||||||
| Other current liabilities | 153,073 | 154,314 | -1,241 | -0.8 | % | |||||||||||
| Current liabilities | 432,826 | 416,546 | 16,280 | 3.9 | % | |||||||||||
| Liabilities | 4,160,356 | 3,896,197 | 264,158 | 6.8 | % | |||||||||||
| Total liabilities | 9,176,309 | 8,914,399 | 261,911 | 2.9 | % | |||||||||||
| Press release – 31 July 2026 | 36 |
Key ratios
| (in euros per share) | 30.06.2026 | 31.12.2025 | ∆ (abs.) | ∆ (%) | ||||||||||||
| IFRS NAV | 20.9 | 21.3 | -0.5 | -2.3 | % | |||||||||||
| EPRA NTA♦ | 21.4 | 21.9 | -0.4 | -2.0 | % | |||||||||||
| Share price | 22.1 | 22.1 | -0.1 | -0.3 | % | |||||||||||
| Premium/Discount with respect to EPRA NTA | 3.1 | % | 1.2 | % | n.r. | n.r. | ||||||||||
| (in euros x million) | ||||||||||||||||
| Fair value of the portfolio (including solar panels)¹ | 8,748.4 | 8,584.0 | 164.4 | 1.9 | % | |||||||||||
| Loan-to-value♦ | 41.6 | % | 40.1 | % | 1.4 | % | n.r. | |||||||||
| Gearing ratio (proportional)²♦ | 43.5 | % | 42.2 | % | 1.3 | % | n.r. | |||||||||
| Net debt / EBITDA (adjusted)♦ | 7.6 | x | 7.5 | x | 0.1 | x | n.r. |
The Alternative Performance Measures (APM), for example the EPRA key performance measures, used by WDP, are accompanied by a symbol (♦). Their definition and reconciliation can be consulted in the Annexes of this document.
| 1 | Based on 100% of the fair value for the fully consolidated entities and the proportionate share for the joint ventures (i.e. 50% for WDPort of Ghent Big Box and 29% for Gosselin-WDP). |
| 2 | For the method used to calculate the gearing ratio, please refer to the Belgian Royal Decree on GVVs/SIRs. |
| Press release – 31 July 2026 | 37 |
2.1. Property portfolio
The total portfolio value evolved to 8,748.4 million euros compared to 8,584.0 million euros at the end of 2025.
| ● | Property portfolio fair value30,31: 8,547.4 million euros per 30 June 2026 (8,395.0 million euros at the end of 2025). |
| > | Standing portfolio: 8,082.5 million euros32 |
| > | Projects under development: 239.8 million euros |
| > | Land reserves: 225.2 million euros |
| ● | Investments in energy assets33: 201.0 million euros |
Overall, the portfolio is valued at a gross rental yield of 6.3%34. Currently, the portfolio is valued at an EPRA Net Initial Yield of 5.5%. The current contractual rent is approximately 7% below market rent (compared to 9% at year-end 2025), reflecting the capture of rent indexation and rent reversion, while estimated rental values (ERVs) remained stable quarter-on-quarter. The net reversionary yield is 6.1% based on full letting at market rent.35
Portfolio statistics by country
| Belgium | The Netherlands | France | Germany | Luxembourg | Romania | Total | ||||||||||||||||||||||
| Number of lettable sites | 116 | 114 | 22 | 3 | 6 | 83 | 344 | |||||||||||||||||||||
| Gross lettable area (in m²) | 2,843,898 | 3,056,926 | 708,045 | 121,207 | 179,028 | 2,005,572 | 8,914,676 | |||||||||||||||||||||
| Land (in m²) | 5,190,379 | 5,111,502 | 1,821,046 | 204,309 | 313,805 | 9,422,157 | 22,063,198 | |||||||||||||||||||||
| Fair value (in million euros) | 2,614 | 3,159 | 717 | 158 | 240 | 1,660 | 8,547 | |||||||||||||||||||||
| % of total fair value | 31 | % | 37 | % | 8 | % | 2 | % | 3 | % | 19 | % | 100 | % | ||||||||||||||
| % change in fair value (YTD) | 0.0 | % | 0.5 | % | -1.1 | % | -1.7 | % | -1.0 | % | 0.4 | % | 0.2 | % | ||||||||||||||
| Vacancy rate (EPRA)¹′² | 4.9 | % | 0.1 | % | 6.0 | % | 0.0 | % | 0.5 | % | 4.4 | % | 2.8 | % | ||||||||||||||
| Average lease length till break (in y)² | 5.5 | 5.6 | 7.0 | 3.8 | 4.1 | 5.4 | 5.5 | |||||||||||||||||||||
| WDP gross initial yield³ | 5.7 | % | 6.2 | % | 5.3 | % | 5.3 | % | 6.7 | % | 8.3 | % | 6.3 | % | ||||||||||||||
| Effect of vacancies | -0.3 | % | 0.0 | % | -0.3 | % | 0.0 | % | 0.0 | % | -0.4 | % | -0.2 | % | ||||||||||||||
| Adjustment gross to net rental income (EPRA) | -0.3 | % | -0.4 | % | -0.2 | % | -0.1 | % | -0.6 | % | -0.6 | % | -0.4 | % | ||||||||||||||
| Adjustments for transfer taxes | -0.1 | % | -0.6 | % | -0.2 | % | -0.4 | % | -0.4 | % | -0.1 | % | -0.3 | % | ||||||||||||||
| EPRA net initial yield¹ | 5.0 | % | 5.2 | % | 4.6 | % | 4.8 | % | 5.7 | % | 7.3 | % | 5.5 | % | ||||||||||||||
| 30 | Valuations determined by independent real estate experts (Stadim, JLL, CBRE and BNP Paribas Real Estate), in accordance with IAS 40. For the exact valuation method, we refer to the BE-REIT press release of 9 July 2025. |
| 31 | Including assets held for sale. |
| 32 | Including a right of use of 117 million euros, related to the land held through a concession in accordance with IFRS 16. |
| 33 | Predominantly solar panels measured at fair value under the revaluation model in accordance with IAS 16. |
| 34 | Calculated by dividing the annualised contractual gross (cash) rents and the rental value of the unlet parts by the fair value. The fair value is the value of the investment properties after deducting transaction costs (mainly transfer tax). |
| 35 | The reversionary yield is calculated by dividing the estimated market rent value – less non-recoverable property operating costs – by the market value of the property, including (estimated) acquisition costs. The reversionary yield relates to the expected return to which the net yield will rise (or fall) once rent reaches the full estimated rental value. |
| Press release – 31 July 2026 | 38 |
2.2. NAV per share
The EPRA NTA per share amounted to 21.4 euros as of 30 June 2026. This represents a decrease of -0.4 euros (-2.0%) versus an EPRA NTA per share of 21.9 euros on 31 December 2025. This evolution was mainly driven by EPRA Earnings generation (+0.79 euros), which was more than offset by the payment of the 2025 dividend in Q2 2026 (-1.23 euros). IFRS NAV per share36 is 20.9 euros as of 30 June 2026 compared to 21.3 euros as of 31 December 2025.
| 36 | The IFRS NAV is calculated as the equity capital as per IFRS divided by the total number of shares entitled to dividend on the balance sheet date. This is the net value according to Belgian GVV/SIR legislation. |
| Press release – 31 July 2026 | 39 |
IV. Management of financial resources
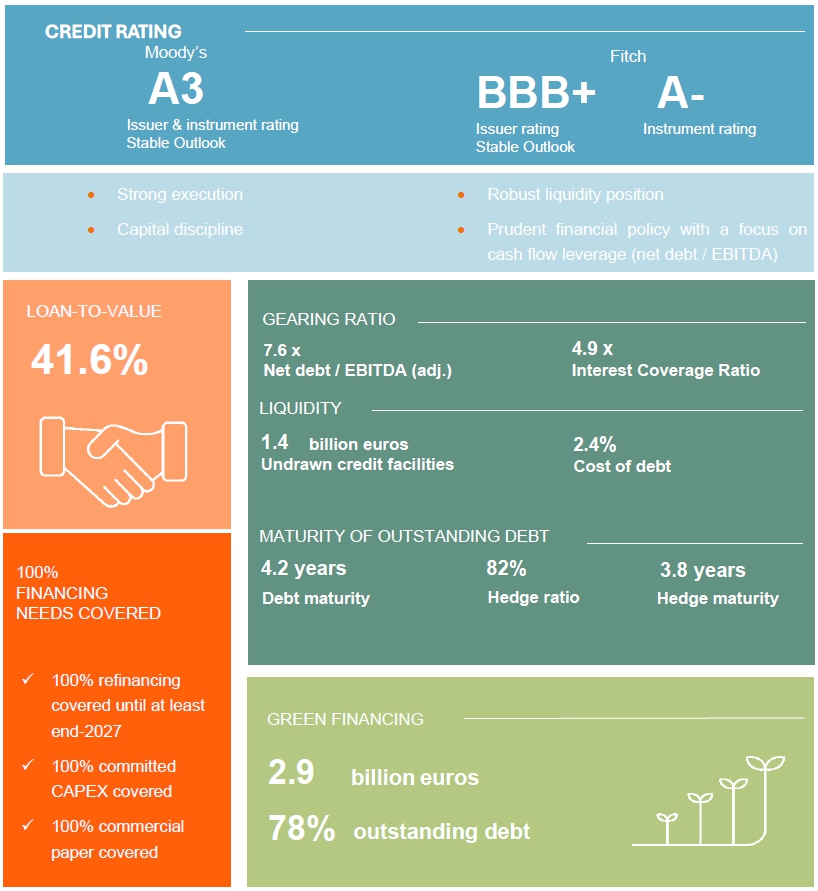
| Press release – 31 July 2026 | 40 |
Financial key figures
| 30.06.2026 | 31.12.2025 | |||||||
| Loan-to-value♦ | 41.6 | 40.1 | ||||||
| Gearing ratio (proportional) (in line with the GVV/SIR Royal Decree) (in %) | 43.5 | 42.2 | ||||||
| Net debt / EBITDA (adjusted) (in x)♦ | 7.6 | 7.5 | ||||||
| Interest Coverage Ratio (in x)¹ | 4.9 | 5.0 | ||||||
| Average cost of debt (in %)♦ | 2.4 | 2.4 | ||||||
| Average remaining term of outstanding debts (in years) | 4.2 | 4.3 | ||||||
| Hedge ratio (in %)♦ | 82 | 89 | ||||||
| Average remaining term of interest rate hedges (in years)² | 3.8 | 4.2 | ||||||
The Alternative Performance Measures (APM) used by WDP, are accompanied by a symbol (♦). Their definition and reconciliation can be consulted in the Annexes of this document.
| 1 | Defined as operating result (before the result on the portfolio) divided by interest charges less interest and dividends collected less the fee for financial leasing and other. |
| 2 | Remaining term of debt at fixed rate and interest rate hedges entered into to hedge the debt against interest rate fluctuations. |
| Press release – 31 July 2026 | 41 |
1. Financial position
1.1. Credit rating and balance sheet
WDP holds an A3 issuer and instrument rating from Moody’s and a BBB+ issuer rating and A-instrument rating from Fitch (both agencies with Stable Outlook), placing it among a select group of A-rated listed real estate companies in Europe. These ratings reflect the strength of WDP’s balance sheet and robust liquidity positing, consistent execution of long-term financial policies, and capital discipline with a relentless focus on cash generation.
On 28 July 2026 and 30 July 2026, respectively, Fitch and Moody’s affirmed WDP’s existing ratings (Stable outlook) following the announcement of the proposed friendly all-share merger with ARGAN.
1.2. Capital structure and liquidity
Total financial debt increased to 3,724.3 million euros as of 30 June 2026, compared to 3,504.7 million euros as of 31 December 2025. As a result, loan-to-value – which balances net financial debt against portfolio value37– stands at 41.6% as of 30 June 2026 compared to 40.1% as of 31 December 2025. Moreover, the key capital structure metric, net debt / EBITDA (adj.), which measures the actual debt repayment capacity, is very strong at 7.6x (7.5x as of 31 December 2025). This evolution is as anticipated, reflecting the seasonal effect following the payment of the dividend (May 2026), and will be followed by a gradual decrease in the second half of the year due to the strong cash flow generation.
The weighted average duration of the outstanding financial debt as of 30 June 2026 is 4.2 years38, stable compared to 4.3 years as of the end of 2025. WDP proactive financial management keeps interest costs particularly competitive with an all in cost of debt at 2.4% over the first half of 2026. As of 30 June 2026, the hedge ratio is 82%, with an average maturity of hedges of 3.8 years. Together with the increase in the Operating Result (before the result on the portfolio), this implies a continued high interest Coverage Ratio of 4.9x (5.0x as of 31 December 2025).
As of 30 June 2026, the total undrawn and confirmed long-term credit lines are 1.4 billion euros39. This provides WDP with ample liquidity to execute at least the investment pipeline in execution of approximately 760 million euros (with cost to come: 588 million euros), and funding the debt maturities until the end of 2027 (627 million euros), whilst maintaining a buffer to act on interesting investment opportunities. Furthermore, this excludes the expected self-financing capacity, alongside potential refinancing of credit facilities.
Strong cash flow generation underpins WDP’s capacity to finance and execute its new extended growth plan, which is expected to stay capital structure neutral40. To this end, WDP expects to self-finance CAPEX of approximately 500 million euros per year (of which 250-300 million euros in equity via retained earnings, stock dividend and contributions in kind, and the remainder in debt raised within WDP’s leverage targets) while maintaining a loan-to-value of ~40% (based on the current portfolio valuation) and a net debt / EBITDA (adj.) of ~8x. In fact, the impact of equity via retained earnings, scrip-dividend and contributions in kind of approximately 250-300 million euros per year is equal to around -3% on loan-to-value and around -0.5x on net debt / EBITDA (adj.).
| 37 | Based on IFRS accounts, including solar panels and investments in joint ventures and associates. |
| 38 | Including short-term debt. |
| 39 | Excluding the credit facilities to cover the commercial paper programme. |
| 40 | See IV. Outlook. |
| Press release – 31 July 2026 | 42 |
Consolidated financial debt outstanding as of 30 June 2026
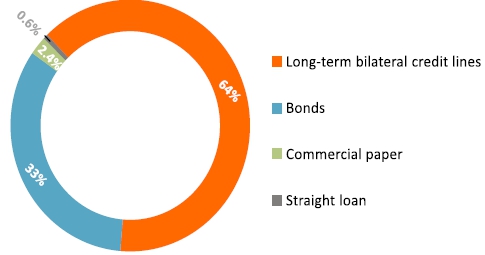
1.3. Maturity dates
The majority of the debt instruments are bullet type instruments, which implies that, over the term, interest is due on the principal sum and that full repayment of the capital is due on the final maturity date.
The maturity dates are evenly distributed over time. The current financial debt of 279.8 million euros includes the commercial paper programme (90.2 million euros), short-term straight loans (22.1 million euros) and long-term financing maturing within the year (167.5 million euros).
The weighted average term of WDP’s outstanding financial debt as of 30 June 2026 was 4.2 years41 compared to 4.3 years at the end of 2025.
| 41 | Including short-term debt. |
| Press release – 31 July 2026 | 43 |
Maturity of credit facilities
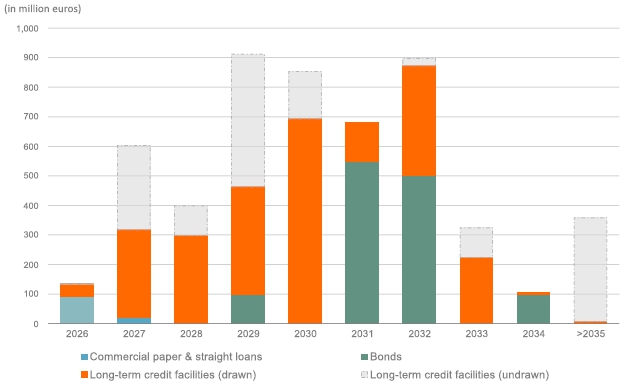
1.4. Cost of debt and hedges
The average cost of debt was 2.4% in the first half of 2026 (compared with 1.9% for the full financial year 2025). WDP’s proactive financial management keeps interest costs particularly sharp with an all-in cost of debt expected at 2.5% over 2026.
The hedge ratio, which measures the percentage of financial debt at a fixed or floating interest rate and then hedged via Interest Rate Swaps (IRSs) is 82% with a weighted average hedging term of 3.8 years and no major maturities until 2027. Together with the increase in the Operating Result (before the result on the portfolio), this implies a continued high Interest Coverage Ratio of 4.9x (compared to 5.0x as of 31 December 2025).
Evolution of hedge ratio at a constant debt position
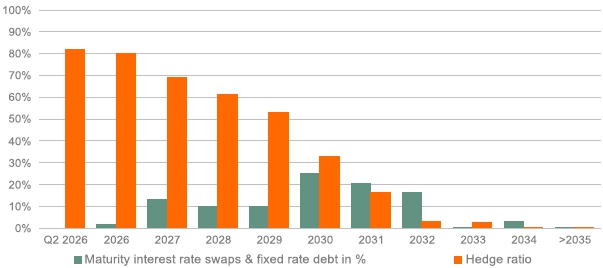
| Press release – 31 July 2026 | 44 |
1.5. Financing strategy during 2026
1.5.1. New financial resources in 2026
Optional dividend amounting to 116 million euros42
The WDP shareholders chose for over 57% of their shares for a contribution of their dividend rights in consideration for new shares instead of cash dividend payments. This result led to a capital increase of around 116 million euros for WDP by way of the creation of 5,404,235 new shares, at an issue price of 21.53 euros per share.
1.5.2. Credit rating update
Both credit agencies Moody’s and Fitch have affirmed WDP’s rating following the announcement of ARGAN and WDP to join forces through a friendly all-share merger. The affirmation of issuer and debt ratings with a stable outlook reflects the improved business profile of the combined group and the expectation that leverage will remain in line for the requirements for the current rating category.
Fitch Ratings has affirmed on July 28, 2026, WDP’s Long-Term Issuer Default Rating (IDR) at ‘BBB+’ and affirmed senior unsecured debt at ‘A-’. The Outlook on the IDR is Stable. On July 30th 2026, Moody’s Ratings affirmed the A3 long-term issuer and senior unsecured debt ratings of WDP. The outlook remains stable.
1.6. Financial risks
In 2026, WDP has again continuously monitored the potential impact of financial risks and has taken the necessary measures to manage these risks. For a detailed overview of the financial and other risks, see VII. Risk factors.
| 42 | See the press release of 20 May 2026. |
| Press release – 31 July 2026 | 45 |
V. Property report
1. Review of the consolidated property portfolio
1.1. Overview
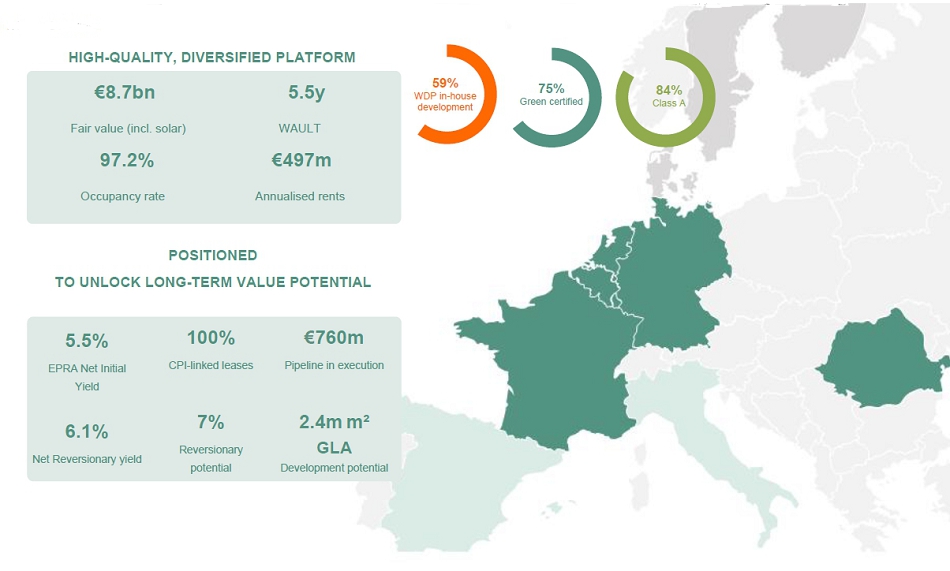
| Press release – 31 July 2026 | 46 |
1.2. Condition of the portfolio as of 30 June 2026
The independent property experts Stadim, JLL, CBRE, and BNP Paribas Real Estate value WDP’s property portfolio (including Assets held for sale and excluding solar panels) as of 30 June 2026 at a fair value43 of 8,547.4 million euros per IAS 40. The fair value at the end of 2025 amounted to 8,395.0 million euros.
The portfolio breaks down as follows:
Fair value
| (in million euros) | Belgium | The Netherlands | France | Germany | Luxembourg | Romania | Total | |||||||||||||||||||||
| Existing buildings | 2,527.4 | 3,051.2 | 702.6 | 158.0 | 239.6 | 1,382.1 | 8,060.8 | |||||||||||||||||||||
| Projects under development | 48.7 | 87.6 | 10.5 | 0.0 | 0.0 | 92.9 | 239.8 | |||||||||||||||||||||
| Land reserves | 38.2 | 19.9 | 4.1 | 0.0 | 0.0 | 163.0 | 225.2 | |||||||||||||||||||||
| Assets held for sale | 0.0 | 0.0 | 0.0 | 0.0 | 0.0 | 21.6 | 21.6 | |||||||||||||||||||||
| Total | 2,614.3 | 3,158.7 | 717.2 | 158.0 | 239.6 | 1,659.6 | 8,547.4 | |||||||||||||||||||||
Portfolio statistics by country
| Belgium | The Netherlands | France | Germany | Luxembourg | Romania | Total | ||||||||||||||||||||||
| Number of lettable sites | 116 | 114 | 22 | 3 | 6 | 83 | 344 | |||||||||||||||||||||
| Gross lettable area (in m²) | 2,843,898 | 3,056,926 | 708,045 | 121,207 | 179,028 | 2,005,572 | 8,914,676 | |||||||||||||||||||||
| Land (in m²) | 5,190,379 | 5,111,502 | 1,821,046 | 204,309 | 313,805 | 9,422,157 | 22,063,198 | |||||||||||||||||||||
| Fair value (in million euros) | 2,614 | 3,159 | 717 | 158 | 240 | 1,660 | 8,547 | |||||||||||||||||||||
| % of total fair value | 31 | % | 37 | % | 8 | % | 2 | % | 3 | % | 19 | % | 100 | % | ||||||||||||||
| % change in fair value (YTD) | 0.0 | % | 0.5 | % | -1.1 | % | -1.7 | % | -1.0 | % | 0.4 | % | 0.2 | % | ||||||||||||||
| Vacancy rate (EPRA)¹′² | 4.9 | % | 0.1 | % | 6.0 | % | 0.0 | % | 0.5 | % | 4.4 | % | 2.8 | % | ||||||||||||||
| Average lease length till break (in y)² | 5.5 | 5.6 | 7.0 | 3.8 | 4.1 | 5.4 | 5.5 | |||||||||||||||||||||
| WDP gross initial yield³ | 5.7 | % | 6.2 | % | 5.3 | % | 5.3 | % | 6.7 | % | 8.3 | % | 6.3 | % | ||||||||||||||
| Effect of vacancies | -0.3 | % | 0.0 | % | -0.3 | % | 0.0 | % | 0.0 | % | -0.4 | % | -0.2 | % | ||||||||||||||
| Adjustment gross to net rental income (EPRA) | -0.3 | % | -0.4 | % | -0.2 | % | -0.1 | % | -0.6 | % | -0.6 | % | -0.4 | % | ||||||||||||||
| Adjustments for transfer taxes | -0.1 | % | -0.6 | % | -0.2 | % | -0.4 | % | -0.4 | % | -0.1 | % | -0.3 | % | ||||||||||||||
| EPRA net initial yield¹ | 5.0 | % | 5.2 | % | 4.6 | % | 4.8 | % | 5.7 | % | 7.3 | % | 5.5 | % | ||||||||||||||
| 1 | Financial performance indicator calculated according to EPRA’s (European Public Real Estate Association) Best Practices Recommendations. Please see www.epra.com. |
| 2 | Excluding solar panels. |
| 3 | Calculated by dividing the annualised contractual gross (cash) rents and the rental value of the unlet properties by fair value. The fair value is the value of the property investments after deduction of transaction costs (mainly transfer tax). |
| 43 | The fair value at which the investment properties are measured consists of the investment value less transaction costs. The average theoretical local transaction costs deducted from the investment value are as follows, by country: Belgium: 2.5%, the Netherlands: 10.6%, France: 4.2%, Luxembourg: 7.0%, Germany: 7.8% and Romania: 1.0%. Note 1.5. Segmented information - Assets provides an update on the 2.5% theoretical transaction costs applied in Belgium. |
| Press release – 31 July 2026 | 47 |
Breakdown of the fair value of the portfolio per property expert
| Property expert | Country | Fair value in euros (x 1,000) | Share of the portfolio | |||||||
| Stadim | Belgium¹ | 1,419,446 | 17 | % | ||||||
| Jones Lang LaSalle Belgium | Belgium¹ | 1,194,867 | 14 | % | ||||||
| Jones Lang LaSalle Netherlands | The Netherlands | 1,626,241 | 19 | % | ||||||
| CBRE Netherlands | The Netherlands | 1,532,499 | 18 | % | ||||||
| BNP Paribas Real Estate | France | 689,094 | 8 | % | ||||||
| Jones Lang LaSalle France | France | 28,154 | 0 | % | ||||||
| CBRE Romania | Romania | 1,659,553 | 19 | % | ||||||
| CBRE Germany | Germany | 157,952 | 2 | % | ||||||
| Jones Lang LaSalle Luxembourg | Luxembourg | 239,630 | 3 | % | ||||||
| Total | 8,547,437 | 100 | % | |||||||
| 1 | Including the proportionate share of the portfolio in I Love Hungaria NV, WDPort of Ghent Big Box NV and Gosselin-WDP NV. |
1.3. Changes in fair value during the first half of 2026
The variation in the valuation of investment properties amounted to 9.4 million euros (+0.1%) during the first half of 2026, based on a stable EPRA Net Initial Yield of 5.5%. The gross rental yield based on the contractual rent, after the addition of the estimated market rent value for the unlet parts, amounts to 6.3% as of 30 June 2026, compared to 6.2% at the end of 2025. The net reversion yield stood at 6.1% as of 30 June 2026. The property portfolio was valued at 960 euro per m² as of 30 June 2026.
Historic gross rental yield of the WDP portfolio
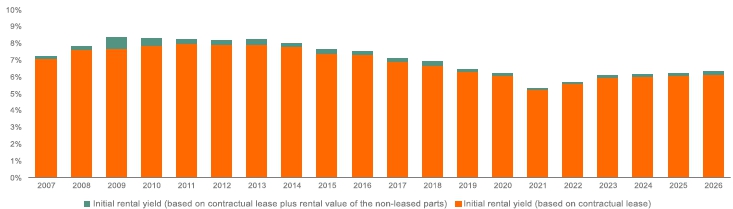
1.4. Value and composition of the rental portfolio
The total surface area comprises 2,206.3 hectares, including 181.4 ha granted in concession. The average land value is 120 euros per m², excluding transaction costs. This area also includes land reserves, particularly in Belgium, the Netherlands and Romania.
| Press release – 31 July 2026 | 48 |
Designated use as of 30 June 2026
| Built surface (in m²) | Estimated rental value (in million euros) | Estimated average rental value per
m² | % of total rental value | |||||||||||||
| Warehouses | 7,990,909 | 464.3 | 58.1 | 87 | % | |||||||||||
| Offices at warehouses | 568,731 | 58.6 | 103.1 | 11 | % | |||||||||||
| Miscellaneous | 355,036 | 13.1 | 36.9 | 2 | % | |||||||||||
| Total | 8,914,676 | 536.0 | 60.1 | 100 | % | |||||||||||
| Press release – 31 July 2026 | 49 |
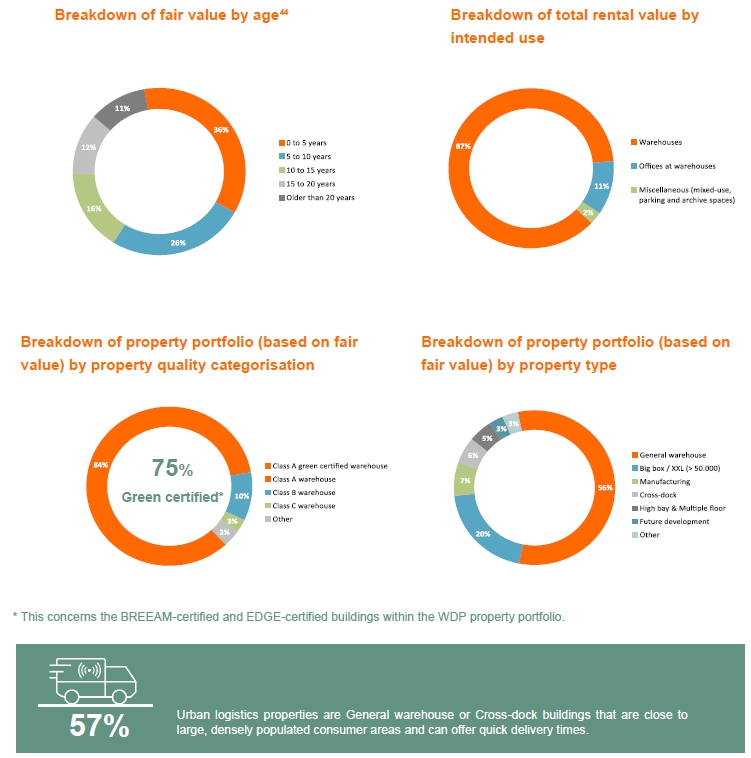
1.5. Rental situation of the available buildings
The occupancy rate of the WDP portfolio remains strong at 97.2% as of 30 June 2026. WDP expects occupancy to remain above 97% for full-year 2026, supported by current rental market conditions and a normalised retention rate of around 90%. Positive trends, such as limited land availability and scarcity, support the gradual improvement in demand and emphasise the long-term structurally sound foundation of the sector.
| 44 | Buildings that have undergone significant renovations are considered new once their renovations are complete. |
| Press release – 31 July 2026 | 50 |
WDP’s commercial strategy is focused on building long-term relationships with clients and supporting the company’s performance through a high operating margin. This long-term approach is reflected in an average remaining lease term of 6.6 years and out the 10% leases coming to a break in 2026, 75% have already been secured. Assuming the first option of termination, the average remaining duration is 5.5 years.
Historical occupancy rate of the WDP portfolio
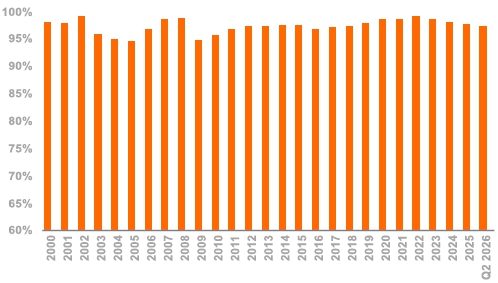
Rental income expiry dates (until the first option of termination)
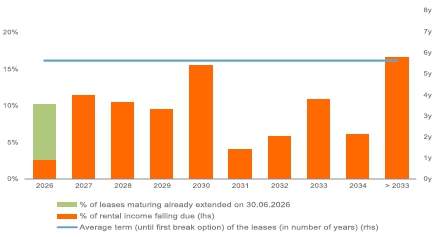
| Press release – 31 July 2026 | 51 |
Top 10 tenants (~22%)
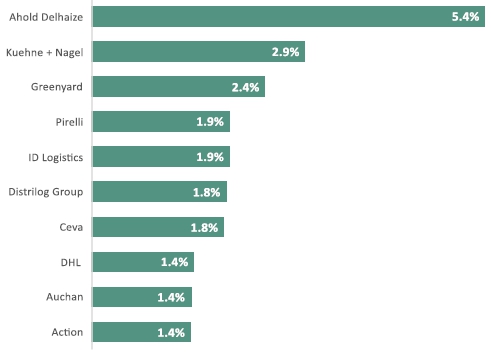
Rental income 2026 by category of end user
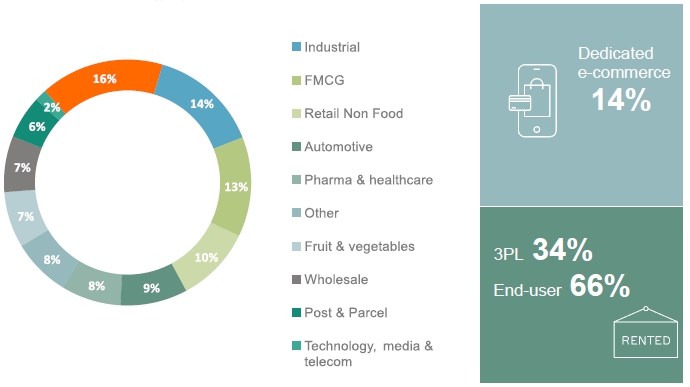
1.6. Overview of investment pipeline in execution of 760 million euros
For a complete overview of the investment pipeline in execution as of 30 June 2026, refer to 1.6. Investment pipeline in execution of approximately 760 million euros in I. Performance.
| Press release – 31 July 2026 | 52 |
1.7. Review of the logistics property market45
1.7.1. Logistics real estate remains resilient in a normalising market
European logistics real estate is underpinned by structural long-term demand drivers such as e-commerce, regionalisation of supply chains, strategic inventory building and urban distribution. In an omnipresent geopolitical and macroeconomic environment, Europe’s need for supply chain independence and resilient supply chains has made well-located logistics infrastructure critical infrastructure.
Following the rebalancing of the European logistics markets during 2025, the market for logistics space have stabilised around a healthy long-term baseline at around pre-pandemic average with European vacancy at approximately 5.5%. Demand remains resilient and is broadening while users of logistics space continue to take a disciplined approach to decision-making. Demand is broadening: activity remains solid for small and mid-sized units, while requirements for larger units are re-emerging as users of space take long-term supply chain decisions, led by food, e-commerce and pharma. Demand from more cyclical users, notably large-volume 3PLs, remains selective and tied to consumer spending and business confidence. Performance is strongest among markets with prime locations and low availability. Overall, current market conditions reflect a healthy balance between demand and supply.
Development activity has adjusted to changing market conditions. More cautious development starts focusing on pre-letting activity, together with permitting constraints, land scarcity and higher financing and construction costs, has resulted in a more disciplined development pipeline across Europe. These structural supply constraints continue to support rental resilience and limited availability for prime Grade A logistics assets, while contributing to a disciplined supply outlook over the medium term, underpinning the outlook for mid to long-term rental growth.
Logistics real estate remains among Europe’s preferred real estate sectors. Institutional investor interest continues to focus on high-quality, sustainable assets in strategic logistics corridors, offering resilient income streams and favourable long-term growth prospects. Although capital deployment has become more selective, favourable sector fundamentals continue to support investor appetite for the logistics real estate.
Against this backdrop, WDP remains well positioned to capture structural demand through its high-quality portfolio, client-centric platform and disciplined approach to pre-let developments. Its A3 rating (Moody’s) and strong liquidity position provide the financial firepower to invest through the cycle, supported by its strong self-financing capacity.
| 45 | Source: broker reports and macro research. |
| Press release – 31 July 2026 | 53 |
1.7.2. Belgium and Luxembourg
WDP holds a unique position in Belgium and Luxembourg, with a 2.9 billion-euros portfolio spread across 122 sites in the key logistics regions. These strategically located assets along key logistics corridors translate in a market share of 16%.
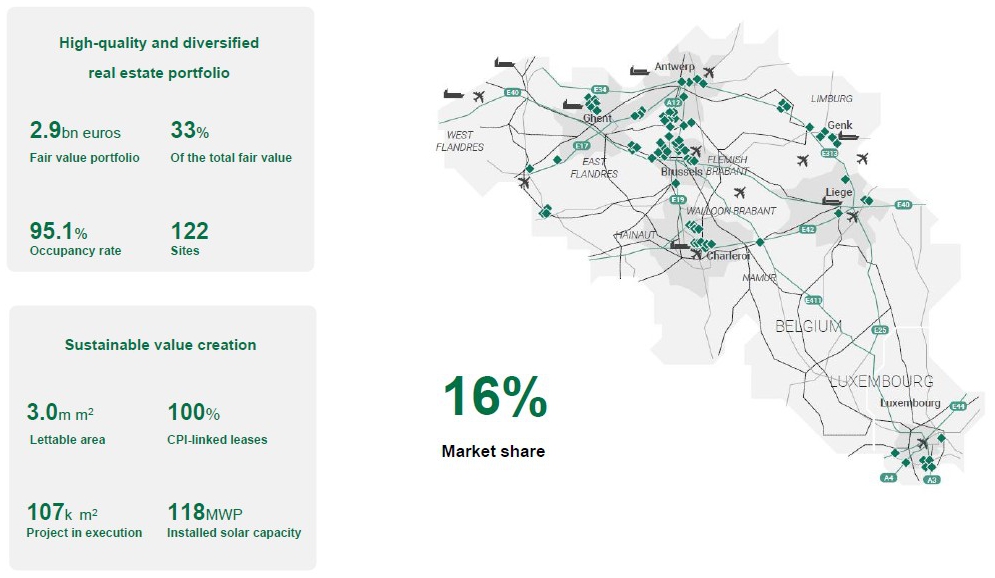
| Press release – 31 July 2026 | 54 |
1.7.3. The Netherlands
WDP The Netherlands is a core market with strong infrastructure and serves as a key gateway to Europe, where WDP has established a leading position with a high-quality real estate portfolio of 3.2 billion euros. This portfolio accounts for a market share of 6%.
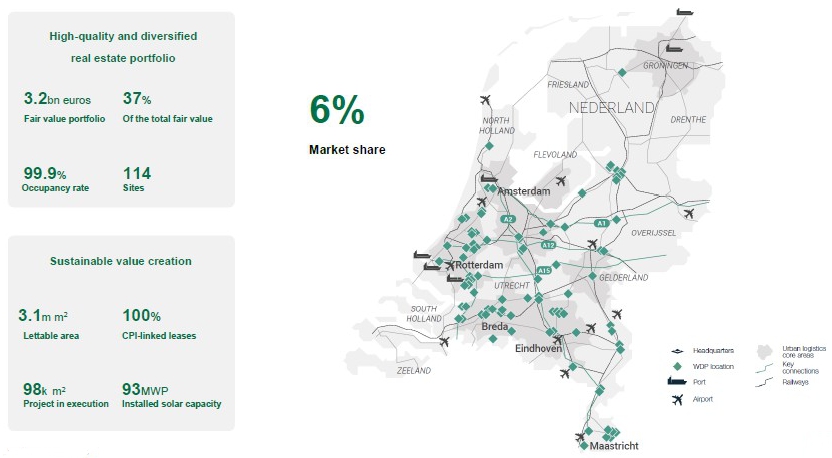
| Press release – 31 July 2026 | 55 |
1.7.4. France
In just two years, WDP expanded its French platform from €150 million to €720 million. Today, the portfolio comprises 22 sites and has an occupancy rate of 94.0%. In 2026, WDP further strengthened its footprint through targeted acquisitions and new development opportunities in key logistics locations across France. From its Paris office, a dedicated local team continues to strengthen WDP’s long-term presence and drive further growth in this market.
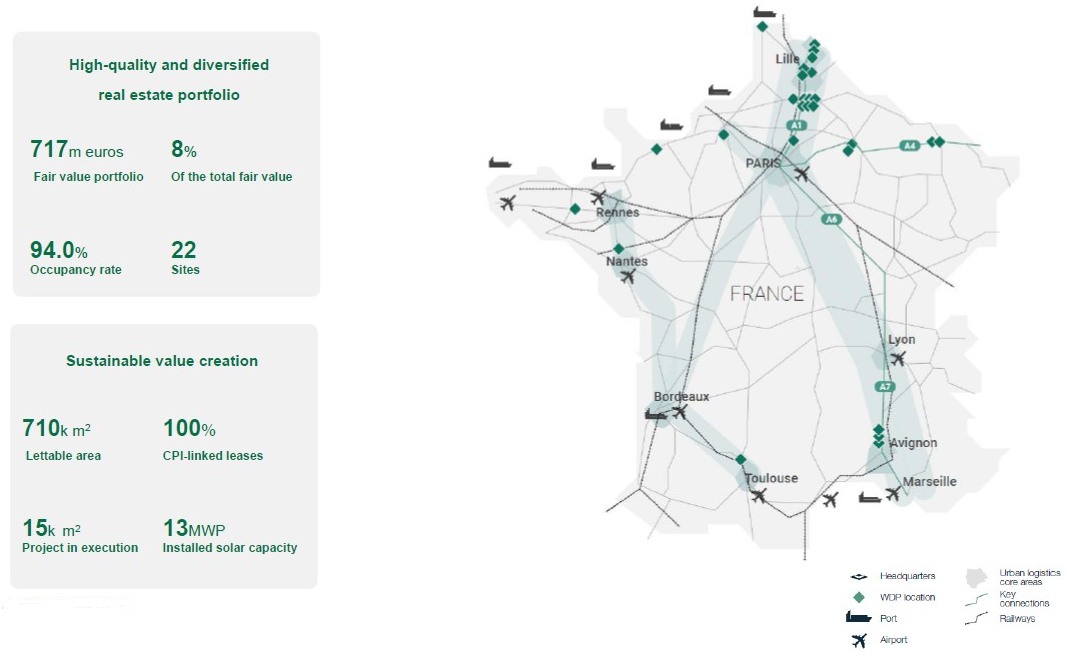
| Press release – 31 July 2026 | 56 |
1.7.5. Germany
WDP strengthened its presence in Germany through the further development of its local platform, supported by the appointment of a Country Manager for Germany. With a portfolio of 160 million euros across 3 sites and an occupancy rate of 100%, WDP is establishing a focused platform in this market.
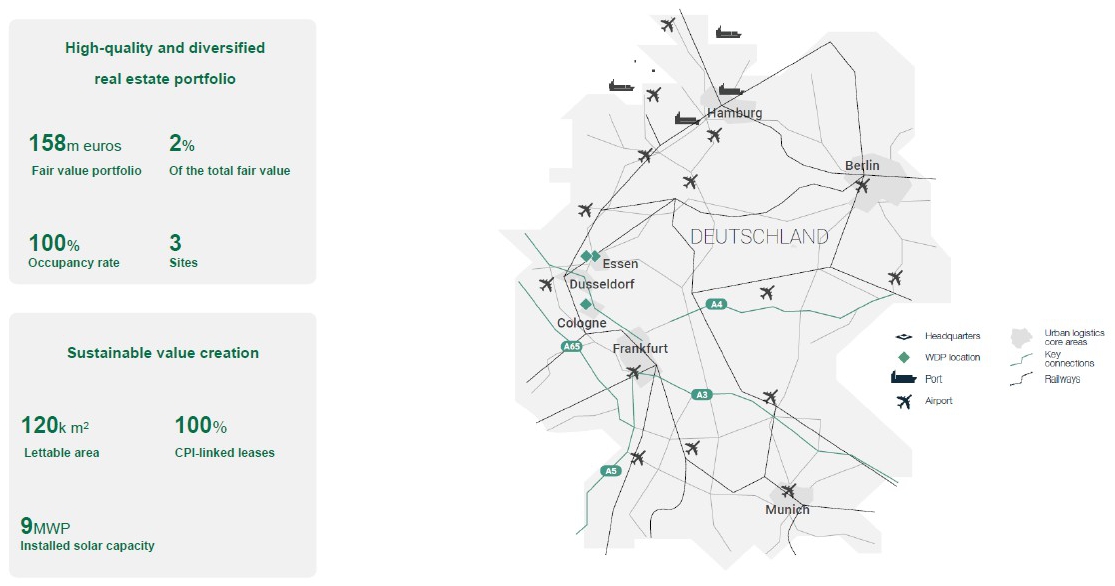
| Press release – 31 July 2026 | 57 |
1.7.6. Romania
WDP has a well-diversified presence in Romania, with a 1.7 billion euros portfolio and a total lettable area of 2.0 million m². The portfolio comprises 83 strategically located sites across key logistics regions. With a market share of 24%, WDP confirms its strong position in this growth market.
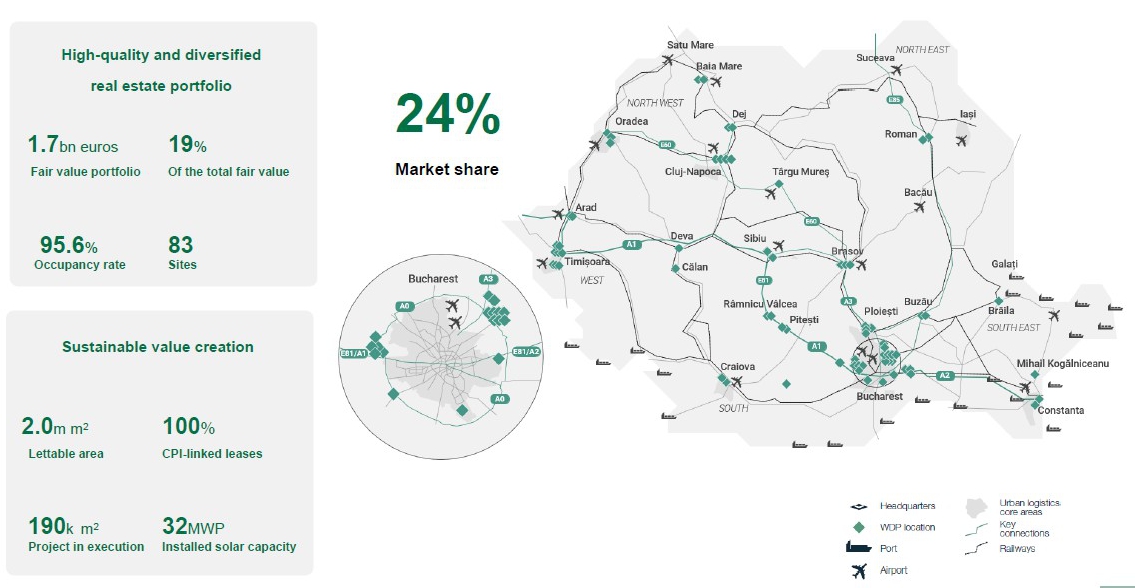
| Press release – 31 July 2026 | 58 |
1.7.7. Spain & Italy
As part of its #BLEND&EXTEND2030 growth plan, WDP expanded its European footprint by establishing a local presence in Spain and Italy in 2026. The appointment of dedicated Country Managers in both markets marks an important step in supporting WDP’s gradual expansion, identifying growth opportunities and building long-term customer partnership.
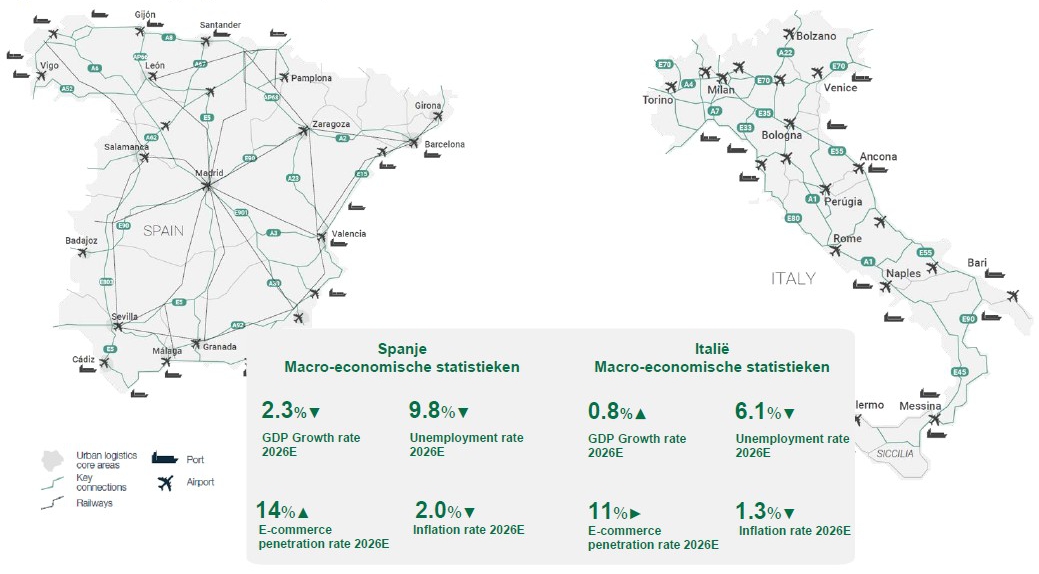
| Press release – 31 July 2026 | 59 |
VI. Outlook: delivering today, with a vision for tomorrow
1. Outlook 2026
For 2026, WDP confirms its expected EPRA Earnings per share of 1.60 euros, an increase of +5% y/y.
Based on this outlook, and taking into account a payout ratio of 80%, a dividend per share of 1.29 euros gross is projected for 2026 (payable in 2027), following the growth rhythm in earnings per share.
Underlying assumptions
| ● | Impact from the execution of the investment pipeline in 2025-2026 |
| ● | Like-for-like rental growth of around 2% |
| ● | A stable and strong occupancy rate of minimum 97%, in line with the long-term average |
| ● | A loan-to-value of around 40% (based on stable portfolio values), a net debt / EBITDA (adj.) of around 8x and an average cost of debt of 2.5% |
These forecasts are based on the current knowledge and situation and are barring unforeseen circumstances within the context of a volatile macroeconomic and geopolitical climate.
| Press release – 31 July 2026 | 60 |
2. #BLEND&EXTEND2030
Building the platform of tomorrow, based on the proven multi-driver approach
Early 2026, WDP extended its horizon to 2030 with new growth ambitions and with a clear goal: to further scale WDP into an integrated European €10bn+ platform and provide total supply chain infrastructure solutions to existing and new clients. The focus remains: above-average growth with a below-average risk profile. With growth defined as EPRA Earnings per share growth combined with strong total returns.
With #BLEND&EXTEND2030, the five-year growth plan spanning from 2026 to 2030, WDP builds on its proven multi-driver #BLEND model across multiple (geographical) markets. In this context, WDP looks beyond its existing core markets and intends to enter two new countries: Spain and Italy. This ambition is already being supported by the recent appointment of dedicated Country Managers in both markets.
Long-term targets, underpinned by self-financing capacity, credit strength & growth drivers
As part of #BLEND&EXTEND2030, WDP sets minimum targets per share for 2030 (vs base year 2025):
| ● | EPRA Earnings per share: min. 2.00 euros, implying a CAGR of min. +6% |
| ● | Dividend per share: min. 1.60 euros, implying a CAGR of min. +6% |
| ● | Total return46: min. 50% cumulatively, implying double digit returns of min. 10% |
These targets are based on:
| ● | Strong self-financing capacity: internally funded CAPEX of ~500 million euros per year (of which 250-300 million euros in equity via retained earnings, stock dividend and contributions in kind, and the remainder in debt raised within WDP’s leverage targets) at attractive risk-adjusted returns |
| ● | Top-tier credit strength: with net debt/EBITDA (adj.) of ~8x and a loan-to-value of ~40%, underpinned by A3 credit rating (Moody’s) and 1.6 billion euros in unused credit lines |
| ● | Stacked growth drivers embedded in the #BLEND model: pre-let development projects, selective acquisitions, internal growth and energy solutions across existing (geographical) markets, complemented by gradual expansion into Spain and Italy |
| 46 | Total accounting return (TAR) is calculated as yearly EPRA NTA growth including gross dividends distributed. |
| Press release – 31 July 2026 | 61 |
The drivers of the extended #BLEND plan
BUILD | The continued structurally positive trends within the logistics and industrial real estate market provide opportunities to continue helping clients expand critical logistics infrastructure for various industries (both on the inbound and outbound side of the supply chain).
LOAD | This plan is based on an investment volume of 500 million euros per year at return hurdles aligned with cost of capital. Investments involve a combination of pre-let development projects and acquisitions in existing markets (<20% in Romania), and a gradual entrance in new markets Spain and Italy.
EXTRACT | Creation of added value within the existing portfolio through indexation, capturing rent reversion, optimisations involving innovation, energy and decarbonisation as well as further expansion of the client-centric approach by further unburdening clients. Supplemented by selective asset rotation.
NEUTRALISE | Investments in energy solutions, decarbonising the supply chain: with a targeted doubling of revenues towards 50 million euros by 2030. These investments encompass the development of energy infrastructure on sites, such as solar, batteries and e-truck charging, thereby offering total supply chain infrastructure solutions to the clients.
DISCIPLINED | Continued strict capital allocation focusing on returns. WDP’s robust financial position ensures sufficient means to finance intended investments (via current unused credit lines and self-financing capacity). This includes a manageable and gradual cost of debt reset: an organic impact (i.e. calculated at constant debt level) of cumulatively +85bps in cost of debt towards 2030 due to hedge maturities, partly offset by the positive effect of A3-rating credit spread optimisation with half of the impact only effective as from 2030.47
Underlying assumptions and hypotheses for achieving the 2030 targets
| ● | Short-term gradual recovery in demand, long-term structural demand drivers sustained |
| ● | Stable operational metrics (high occupancy, long lease terms and high client retention) |
| ● | Maintenance of high operating margin of >90% through cost discipline |
These forecasts are based on the current knowledge and situation and are barring unforeseen circumstances within the context of a volatile macroeconomic and geopolitical climate.
| 47 | Based on the forward interest rate curve per 31.12.2025 and A3 Moody’s credit rating. |
| Press release – 31 July 2026 | 62 |
VII. Risk factors
WDP’s management and Board of Directors confirm the validity of the risks the Company may face and their potential impact, as described in the WDP Annual Report 2025.

| Press release – 31 July 2026 | 63 |
VIII. Interim financial statements
1. Condensed consolidated financial statements for the first half of 2026
Condensed consolidated earnings statement
| in euros (x 1,000) | Note | H1 2026 | FY 2025 | H1 2025 | |||||||||||
| Rental income | 7 | 241,409 | 451,759 | 221,539 | |||||||||||
| Costs related to leases | -170 | -1,638 | -708 | ||||||||||||
| Net rental result | 4 | 241,238 | 450,121 | 220,831 | |||||||||||
| Recovery of property costs | 0 | 0 | 0 | ||||||||||||
| Recovery of rental charges and taxes normally paid by the tenant on let properties | 23,851 | 45,035 | 27,203 | ||||||||||||
| Costs payable by tenants and paid out by the owner for rental damage and refurbishment at end of lease | 0 | 0 | 0 | ||||||||||||
| Rental charges and taxes normally paid by the tenant on let properties | -31,830 | -51,738 | -34,989 | ||||||||||||
| Other income and charges related to leases | 17,116 | 26,976 | 15,251 | ||||||||||||
| Property result | 4 | 250,375 | 470,393 | 228,295 | |||||||||||
| Technical costs | -6,652 | -11,371 | -6,106 | ||||||||||||
| Commercial costs | -1,122 | -2,037 | -1,058 | ||||||||||||
| Property management costs | -4,045 | -6,811 | -3,322 | ||||||||||||
| Property charges | 4 | -11,820 | -20,219 | -10,486 | |||||||||||
| Property operating results | 4 | 238,556 | 450,175 | 217,809 | |||||||||||
| General company expenses | -12,694 | -25,207 | -11,726 | ||||||||||||
| Other operating income and expenses (depreciation and write-down on solar panels) | -3,346 | -11,449 | -5,713 | ||||||||||||
| Operating result (before the result on the portfolio) | 222,515 | 413,518 | 200,371 | ||||||||||||
| Result on disposals of investment properties | 11,130 | 5,611 | 135 | ||||||||||||
| Variations in the fair value of investment properties | 8 | 10,492 | 68,614 | 19,787 | |||||||||||
| Operating result | 4 | 244,137 | 487,743 | 220,294 | |||||||||||
| Financial income | 339 | 778 | 424 | ||||||||||||
| Net interest charges | -40,877 | -74,062 | -35,264 | ||||||||||||
| Other financial charges | -1,903 | -4,052 | -2,043 | ||||||||||||
| Change in the fair value of financial instruments | -1,420 | -12,415 | -12,995 | ||||||||||||
| Financial result | -43,860 | -89,752 | -49,878 | ||||||||||||
| Share in the result of associated companies and joint ventures | 13,141 | 22,048 | 9,381 | ||||||||||||
| Result before taxes | 213,419 | 420,040 | 179,797 | ||||||||||||
| Taxes | -26,783 | -66,122 | -40,609 | ||||||||||||
| Net result | 186,636 | 353,918 | 139,187 | ||||||||||||
| Attributable to: | |||||||||||||||
| Minority interests | 0 | 0 | 0 | ||||||||||||
| Shareholders of the Group | 186,636 | 353,918 | 139,187 | ||||||||||||
| Weighted average number of shares | 236,363,753 | 230,529,703 | 227,092,339 | ||||||||||||
| Net result per share (in euros) | 0.79 | 1.54 | 0.61 | ||||||||||||
| Diluted net result per share (in euros) | 0.79 | 1.54 | 0.61 | ||||||||||||
| Press release – 31 July 2026 | 64 |
Condensed consolidated statement of overall result
| in euros (x 1,000) | H1 2026 | H1 2025 | ||||||
| I. Net result | 186,636 | 139,187 | ||||||
| II. Other elements of the comprehensive result | -15,711 | -10,276 | ||||||
| G. Other elements of the comprehensive result, after tax | -15,711 | -10,276 | ||||||
| Revaluation on solar panels | 1,624 | -9,742 | ||||||
| Currency translation differences linked to conversion of foreign activities | -13,221 | 6,731 | ||||||
| Reserve for the balance of changes in fair value of authorised hedging instruments subject to hedge accounting as defined by IFRS (+/-) | -4,114 | -7,266 | ||||||
| Comprehensive result | 170,926 | 128,911 | ||||||
| Attributable to: | ||||||||
| - Minority interests | 0 | 0 | ||||||
| - Shareholders of the Group | 170,926 | 128,911 | ||||||
Components of the net result
| in euros (x 1,000) | H1 2026 | H1 2025 | ||||||
| EPRA Earnings | 186,681 | 171,197 | ||||||
| Result on the portfolio (including share joint ventures) - Group share¹ | 5,029 | -12,252 | ||||||
| Change in the fair value of financial instruments – Group share | -1,375 | -13,423 | ||||||
| Depreciation and write-down on solar panels (including share joint ventures) - Group share | -3,699 | -6,335 | ||||||
| Net result (IFRS) - Group share | 186,636 | 139,187 | ||||||
in euros (per share)² | H1 2026 | H1 2025 | ||||||
| EPRA Earnings | 0.79 | 0.75 | ||||||
| Result on the portfolio (including share joint ventures) - Group share¹ | 0.02 | -0.05 | ||||||
| Change in the fair value of financial instruments – Group share | -0.01 | -0.06 | ||||||
| Depreciation and write-down on solar panels (including share joint ventures) - Group share | -0.02 | -0.03 | ||||||
| Net result (IFRS) - Group share | 0.79 | 0.61 | ||||||
| in euros (per share) (diluted)² | H1 2026 | H1 2025 | ||||||
| EPRA Earnings | 0.79 | 0.75 | ||||||
| Result on the portfolio (including share joint ventures) - Group share¹ | 0.02 | -0.05 | ||||||
| Change in the fair value of financial instruments – Group share | -0.01 | -0.06 | ||||||
| Depreciation and write-down on solar panels (including share joint ventures) - Group share | -0.02 | -0.03 | ||||||
| Net result (IFRS) - Group share | 0.79 | 0.61 | ||||||
| 1 | Including deferred taxes on portfolio result. |
| 2 | Calculated on the weighted average number of shares. |
| Press release – 31 July 2026 | 65 |
Balance sheet
| (in euros x 1,000) | Note | 30.06.2026 | 31.12.2025 | 30.06.2025 | |||||||||||
| Fixed assets | 9,040,252 | 8,827,546 | 8,488,510 | ||||||||||||
| Intangible fixed assets | 1,297 | 1,408 | 1,426 | ||||||||||||
| Investment property | 8 | 8,436,827 | 8,207,921 | 7,898,946 | |||||||||||
| Other tangible fixed assets (energy assets inclusive) | 202,819 | 186,941 | 178,824 | ||||||||||||
| Financial fixed assets | 10 | 43,084 | 40,262 | 39,757 | |||||||||||
| Trade receivables and other fixed assets | 10 | 2,821 | 237 | 418 | |||||||||||
| Participations in associated companies and joint ventures | 353,405 | 390,777 | 369,139 | ||||||||||||
| Current assets | 136,057 | 86,852 | 93,558 | ||||||||||||
| Assets held for sale | 21,647 | 0 | 0 | ||||||||||||
| Trade receivables | 10 | 46,672 | 40,746 | 37,162 | |||||||||||
| Tax receivables and other current assets | 10 | 25,459 | 17,252 | 23,660 | |||||||||||
| Cash and cash equivalents | 10 | 19,634 | 14,786 | 14,834 | |||||||||||
| Accruals and deferrals | 10 | 22,647 | 14,069 | 17,902 | |||||||||||
| Total assets | 9,176,309 | 8,914,399 | 8,582,068 | ||||||||||||
| (in euros x 1,000) | Note | 30.06.2026 | 31.12.2025 | 30.06.2025 | |||||||||||
| Shareholders’ equity | 5,015,954 | 5,018,201 | 4,747,563 | ||||||||||||
| I. Shareholders’ equity attributable to the parent company shareholders | 5,015,954 | 5,018,201 | 4,747,563 | ||||||||||||
| Capital | 250,132 | 244,047 | 241,280 | ||||||||||||
| Issue premiums | 2,453,512 | 2,343,351 | 2,295,208 | ||||||||||||
| Reserves | 2,125,673 | 2,076,885 | 2,071,887 | ||||||||||||
| Net result for the financial year | 186,636 | 353,918 | 139,187 | ||||||||||||
| II. Minority interests | 0 | 0 | 0 | ||||||||||||
| Liabilities | 4,160,356 | 3,896,197 | 3,834,505 | ||||||||||||
| I. Non-current liabilities | 3,727,530 | 3,479,651 | 3,196,200 | ||||||||||||
| Provisions | 172 | 174 | 236 | ||||||||||||
| Non-current financial debt | 9, 10 | 3,444,576 | 3,242,454 | 2,981,129 | |||||||||||
| Other non-current financial liabilities | 10 | 102,417 | 91,231 | 85,493 | |||||||||||
| Trade payables and other non-current liabilities | 11,605 | 9,999 | 9,578 | ||||||||||||
| Deferred taxes - liabilities | 11 | 168,760 | 135,793 | 119,765 | |||||||||||
| II. Current liabilities | 432,826 | 416,546 | 638,305 | ||||||||||||
| Current financial debt | 9 | 279,753 | 262,232 | 489,070 | |||||||||||
| Other current financial liabilities | 10 | 203 | 203 | 206 | |||||||||||
| Trade payables and other current debts | 10 | 90,594 | 86,848 | 102,207 | |||||||||||
| Other current liabilities | 11,420 | 9,978 | 10,626 | ||||||||||||
| Accrued charges and deferred income | 10 | 50,856 | 57,286 | 36,197 | |||||||||||
| Total liabilities | 9,176,309 | 8,914,399 | 8,582,068 | ||||||||||||
| Press release – 31 July 2026 | 66 |
Cash flow statement
| in euros (x 1,000) | H1 2026 | H1 2025 | ||||||
| Cash and cash equivalents, opening balance | 14,786 | 10,374 | ||||||
| Net cash flows concerning operating activities | 218,009 | 217,739 | ||||||
| Net result | 186,636 | 139,187 | ||||||
| Taxes¹ | 26,783 | 40,609 | ||||||
| Net interest charges | 40,877 | 35,264 | ||||||
| Financial income | -339 | -424 | ||||||
| Gain(-)/loss (+) on disposals | -11,130 | -135 | ||||||
| Cash flows from operating activities before adjustment of non-monetary items, taxes effectively paid and working capital | 242,826 | 214,502 | ||||||
| Change in the fair value of financial instruments | 1,420 | 12,995 | ||||||
| Variations in the fair value of investment properties | -10,492 | -19,787 | ||||||
| Depreciations and write-downs (addition/reversal) on fixed assets | 4,042 | 6,550 | ||||||
| Share in the result of associated companies and joint ventures | -13,141 | -9,381 | ||||||
| Other adjustments for non-monetary items and taxes effectively paid | 574 | -4,399 | ||||||
| Adjustments for non-monetary items and taxes effectively paid | -17,598 | -14,023 | ||||||
| Increase (-)/decrease (+) in working capital | -7,218 | 17,260 | ||||||
| Net cash flows concerning investment activities | -150,840 | -296,465 | ||||||
| Investments | -162,113 | -298,208 | ||||||
| Payments regarding acquisitions of real estate investments | -152,153 | -153,043 | ||||||
| Payments for acquisitions of shares in real estate companies minus net cash acquired² | -3,933 | -130,777 | ||||||
| Purchase of other tangible and intangible fixed assets | -6,028 | -14,387 | ||||||
| Disposals | 34,296 | 66 | ||||||
| Receipts from the disposal of investment properties | 34,296 | 66 | ||||||
| Receipts from the disposal of real estate companies | 0 | 0 | ||||||
| Investments in and financing provided to associated companies and joint ventures | -25,932 | -823 | ||||||
| Investments in and financing provided to associated companies and joint ventures³ | -26,165 | -2,950 | ||||||
| Repayment of financing provided to associated companies and joint ventures | 233 | 2,127 | ||||||
| Dividends received | 2,909 | 2,500 | ||||||
| Net cash flows concerning financing activities | -62,322 | 83,186 | ||||||
| Loans issued | 536,326 | 505,327 | ||||||
| Loans repaid | -381,620 | -125,567 | ||||||
| Dividends paid4 | -172,975 | -163,466 | ||||||
| Capital increase | 0 | 0 | ||||||
| Interest paid | -44,052 | -41,461 | ||||||
| Payments for acquisitions of minority interests | 0 | -91,647 | ||||||
| Net increase (+)/decrease (-) in cash and cash equivalents | 4,848 | 4,460 | ||||||
| Cash and cash equivalents, closing balance | 19,634 | 14,834 | ||||||
| 1 | Including the deferred taxes on the investment portfolio as well as the corporate income tax. |
| 2 | This is the net cash-out of the asset swap with the Luxembourg State. See press release of 31 March 2026. |
| 3 | WDP subscribed to Catena’s share capital increase, which was carried out through an accelerated private placement. On 23 January 2026, a total of 604,204 shares were allocated to WDP Invest NV for an amount of approximately SEK 276 million (approximately 26 million euros), thereby maintaining its 10% shareholding. |
| 4 | This is only the cash-out: after all, in 2026 and 2025 an optional dividend was offered, with 57% and 57% of the shareholders, respectively, opting for payout of the dividend in shares instead of cash. |
| Press release – 31 July 2026 | 67 |
Consolidated statement of changes in the shareholders’ equity
| in euros (x 1.000) | 01.01.2026 | Allocation
of result from the 2025 financial year | Net
result for the first half year | Changes
in the fair value of solar panels | Capital increases | Capital increase as a result of optional dividend | Dividends distributed | Impact
of (pre-) hedging instruments | Minority interests¹ | Other | 30.06.2026 | |||||||||||||||||||||||||||||||||
| Total shareholders’ equity | 5,018,201 | 0 | 186,636 | 1,624 | 0 | 116,246 | -289,222 | -4,114 | 0 | -13,419 | 5,015,954 | |||||||||||||||||||||||||||||||||
| Minority interests | 0 | 0 | ||||||||||||||||||||||||||||||||||||||||||
| Total shareholders’ equity attributable to shareholders of the Group | 5,018,201 | 0 | 186,636 | 1,624 | 0 | 116,246 | -289,222 | -4,114 | 0 | -13,419 | 5,015,954 | |||||||||||||||||||||||||||||||||
| Subscribed capital | 244,047 | 6,085 | 250,132 | |||||||||||||||||||||||||||||||||||||||||
| Issue premiums | 2,343,351 | 110,161 | 2,453,512 | |||||||||||||||||||||||||||||||||||||||||
| Reserves | 2,076,885 | 353,918 | 1,624 | -289,222 | -4,114 | -13,419 | 2,125,673 | |||||||||||||||||||||||||||||||||||||
| Net result for the period | 353,918 | -353,918 | 186,636 | 186,636 | ||||||||||||||||||||||||||||||||||||||||
| 194 | ||||||||||||||||||||||||||||||||||||||||||||
| in euros (x 1.000) | 01.01.2025 | Allocation of result from the 2024 financial year | Net result for the first half year | Changes in the fair value of solar panels | Capital increases | Capital increase as a result of optional dividend | Dividends distributed | Impact of (pre-) hedging instruments | Minority interests¹ | Other | 30.06.2025 | |||||||||||||||||||||||||||||||||
| Total shareholders’ equity | 4,837,558 | 0 | 139,187 | -9,742 | 0 | 107,549 | -271,015 | -7,266 | -91,647 | 6,608 | 4,747,563 | |||||||||||||||||||||||||||||||||
| Minority interests | 91,647 | -91,647 | 0 | |||||||||||||||||||||||||||||||||||||||||
| Total shareholders’ equity attributable to shareholders of the Group | 4,745,911 | 0 | 139,187 | -9,742 | 36,329 | 107,549 | -271,015 | -7,266 | 0 | 6,608 | 4,747,563 | |||||||||||||||||||||||||||||||||
| Subscribed capital | 233,356 | 1,902 | 6,021 | 241,280 | ||||||||||||||||||||||||||||||||||||||||
| Issue premiums | 2,159,254 | 34,426 | 101,528 | 2,295,208 | ||||||||||||||||||||||||||||||||||||||||
| Reserves | 1,917,802 | 435,499 | -9,742 | -271,015 | -7,266 | 6,608 | 2,071,887 | |||||||||||||||||||||||||||||||||||||
| Net result for the period | 435,499 | -435,499 | 139,187 | 139,187 | ||||||||||||||||||||||||||||||||||||||||
| 1 | At the beginning of 2025, WDP acquired the remaining 15% shares in WDP Romania, which resulted in the elimination of the minority interests item from equity. See the press release dated 30 January 2025. |
| Press release – 31 July 2026 | 68 |
2. Notes
2.1. General information on the Company
WDP is a publicly regulated real estate company and has the form of a public regulated real estate company under Belgian law. Its registered office is at Blakebergen 15, 1861, Wolvertem (Belgium). The phone number is +32 (0)52 338 400.
The interim condensed financial statements of the Company as of 30 June 2026 include the Company and its subsidiaries.
WDP is listed on Euronext Brussels and Amsterdam.
2.2. Basis of presentation
The condensed interim financial statements are drawn up in accordance with the International Financial Reporting Standards (IFRS) and in accordance with the international standard IAS 34 Interim Financial Reporting as adopted by the European Union and with the legal and regulatory requirements applicable in Belgium. A number of new standards and amendments to standards are effective for financial years commencing after 1 January 2026. The Group is not an early adopter of any of the forthcoming new or amended standards for preparing these condensed consolidated interim financial statements.
The condensed interim financial statements are presented in thousands of euros, rounded to the nearest thousand. The 2026 and 2025 periods are shown in this document. For historical financial information for the 2024 period, please refer to the annual reports for 2025 and 2024.
Accounting methods were consistently applied to the financial years shown.
The standards have no or only immaterial impact on the consolidated financial statements, except for IFRS 18. WDP is assessing the attendant impact.
Standards and interpretations applicable for the financial year beginning on or after 1 January 2026
| ● | Amendments to the Classification and Measurement of Financial Instruments—Amendments to IFRS 9 and IFRS 7, issued on 30 May 2024, will address diversity in accounting practice by making the requirements more understandable and consistent. The amendments include: |
| - | Clarifications on the classification of financial assets with environmental, social and corporate governance (ESG) and similar features—ESG-linked features in loans could affect whether the loans are measured at amortized cost or fair value. To resolve any potential diversity in practice, the amendments clarify how the contractual cash flows on such loans should be assessed. |
| - | Clarifications on the date on which a financial asset or financial liability is derecognized. The IASB also decided to develop an accounting policy option to allow a company to derecognize a financial liability before it delivers cash on the settlement date if specified criteria are met. |
The International Accounting Standards Board has also introduced additional disclosure requirements to enhance transparency for investors regarding investments in equity instruments designated at fair value through other comprehensive income and financial instruments with contingent features, for example features tied to ESG-linked targets.
| Press release – 31 July 2026 | 69 |
| ● | Contracts Referencing Nature-dependent Electricity - Amendments to IFRS 9 and IFRS 7, issued on 18 December 2024, will help entities better report on the financial effects of nature-dependent electricity contracts, which are often structured as Power Purchase Agreements (PPAs). Nature-dependent electricity contracts help companies to secure their electricity supply from sources such as wind and solar power. The amount of electricity generated under these contracts can vary based on uncontrollable factors such as weather conditions. Current accounting requirements may not adequately capture how these contracts affect a company’s performance. The amendments include: |
| - | clarifying the application of the ‘own use’ requirements; |
| - | permitting hedge accounting if these contracts are used as hedging instruments; and |
| - | adding new disclosure requirements to enable investors to understand the effect of these contracts on a company’s financial performance and cash flows. |
| ● | Annual Improvements Volume 11, issued on 18 July 2024, include clarifications, simplifications, corrections and changes aimed at improving the consistency of several IFRS Accounting Standards. |
The amended Standards are:
| - | IFRS 1 First-time Adoption of International Financial Reporting Standards; |
| - | IFRS 7 Financial instruments: Disclosures and its accompanying Guidance on implementing IFRS 7; |
| - | IFRS 9 Financial instruments: |
| - | IFRS 10 Consolidated financial statements; and |
| - | IAS 7 Statement of Cash Flows. |
Standards and interpretations published, but not yet applicable
| ● | IFRS 18 Presentation and Disclosure in Financial Statements, issued on 9 April 2024, will replace IAS 1 Presentation of Financial Statements. The new standard introduces the following key new requirements: |
| - | Entities are required to classify all income and expenses into five categories in the earnings statement, namely the operating, investing, financing, discontinued operations and income tax categories. Entities are also required to present newly defined operating profit subtotal. Entities’ net result will not change. |
| - | Management-defined performance measures (MPMs) are disclosed in a single note in the financial statements. |
| - | Enhanced guidance is provided on how to group information in the financial statements. |
In addition, all entities are required to use the operating profit subtotal as the starting point for the statement of cash flows when presenting operating cash flows under the indirect method.
The standard is effective for annual reporting periods beginning on or after 1 January 2027 with early adoption permitted. The standard has been endorsed by the EU.
| Press release – 31 July 2026 | 70 |
| ● | IFRS 19 Subsidiaries without Public Accountability: Disclosures, issued on 9 May 2024, will allow eligible subsidiaries to apply IFRS Accounting Standards with reduced disclosure requirements. A subsidiary will be to apply the new standard in its consolidated, separate or individual financial statements provided that, at the reporting date: |
| - | it does not have public accountability; and |
| - | its parent produces consolidated financial statements under IFRS Accounting Standards. |
The standard is effective for annual reporting periods beginning on or after 1 January 2027 with early adoption permitted. The standard has not yet been endorsed by the EU.
| ● | Translation to a hyperinflationary presentation currency - Amendments to IAS 21, issued on 13 November 2025, clarify how entities should translate financial statements from a non-hyperinflationary currency into a hyperinflationary one. To reduce diversity in practice and improve the usefulness of information for investors, the amendments clarify that: |
| - | an entity with a non-hyperinflationary functional currency uses the closing rate at the latest reporting date when translating all the financial statement amounts (including comparatives) into its presentation currency; and |
| - | an entity uses the closing rate at the latest reporting date when translating all amounts (except comparatives) of a foreign operation with a non-hyperinflationary functional currency and applies the general price index to restate the comparatives. |
The amendments are effective for annual reporting periods beginning on or after 1 January 2027 with early adoption permitted. The amendments have not yet been endorsed by the EU.
| ● | IFRS 20 Regulatory Assets and Regulatory Liabilities, issued on 27 May 2026, is a new standard for companies subject to a specific type of rate regulation and aims to help investors better understand how that rate regulation affects a company’s financial performance, financial position and its prospects for future cash flows. The standard determines how much a company can charge customers and when it can charge them and replaces IFRS 14 Regulatory Deferral Accounts (which has not been endorsed by the EU). |
IFRS 20 is expected to reduce diversity in accounting practices and improve comparability between companies in regulated industries. Companies that supply vital services such as electricity, water and gas are often subject to this type of regulation.
The standard is effective for annual reporting periods beginning on or after 1 January 2029 with early adoption permitted. The standard has not yet been endorsed by the EU.
2.3. Significant accounting estimates and key uncertainties affecting estimates
WDP’s management and Board of Directors confirm that the significant accounting estimates and key uncertainties, as described in the WDP Annual Report 2025, are still up-to-date.
| Press release – 31 July 2026 | 71 |
2.4. Segmented information – Operating result
| H1 2026 | ||||||||||||||||||||||||||||||||||||||||||
| in euros (x 1,000) | Belgium | The Netherlands | France | Germany | Luxembourg² | Romania | Unallocated amounts | Total IFRS | Luxembourg³ | Other joint ventures³ | ||||||||||||||||||||||||||||||||
| I. | Rental income | 66,271 | 93,122 | 16,937 | 4,158 | 7,205 | 53,715 | 0 | 241,409 | 0 | 2,310 | |||||||||||||||||||||||||||||||
| III. | Costs related to leases | 127 | 154 | 446 | 0 | -164 | -733 | 0 | -170 | 0 | 0 | |||||||||||||||||||||||||||||||
| Net rental result | 66,398 | 93,275 | 17,383 | 4,158 | 7,041 | 52,982 | 0 | 241,238 | 0 | 2,310 | ||||||||||||||||||||||||||||||||
| IV. | Recovery of property costs | 0 | 0 | 0 | 0 | 0 | 0 | 0 | 0 | 0 | 0 | |||||||||||||||||||||||||||||||
| V. | Recovery of rental charges normally paid by the tenant on let properties | 11,406 | 2,971 | 2,478 | 439 | 460 | 6,097 | 0 | 23,851 | 0 | 108 | |||||||||||||||||||||||||||||||
| VI. | Costs payable by tenants and paid out by the owner for rental damage and refurbishment at end of lease | 0 | 0 | 0 | 0 | 0 | 0 | 0 | 0 | 0 | 0 | |||||||||||||||||||||||||||||||
| VII. | Rental charges and taxes normally paid by the tenant on let properties | -12,602 | -8,554 | -2,765 | -439 | -489 | -6,982 | 0 | -31,830 | 0 | -109 | |||||||||||||||||||||||||||||||
| VIII. | Other income and charges related to leases¹ | 8,257 | 6,093 | 119 | 164 | 570 | 1,914 | 0 | 17,116 | 0 | 406 | |||||||||||||||||||||||||||||||
| Property result | 73,459 | 93,785 | 17,214 | 4,323 | 7,583 | 54,012 | 0 | 250,375 | 0 | 2,716 | ||||||||||||||||||||||||||||||||
| IX. | Technical costs | -1,579 | -2,123 | -725 | -18 | -80 | -2,127 | 0 | -6,652 | 0 | 101 | |||||||||||||||||||||||||||||||
| X. | Commercial costs | -677 | -9 | -25 | 6 | 82 | -500 | 0 | -1,122 | 0 | -1 | |||||||||||||||||||||||||||||||
| XII. | Property management costs | -1,863 | -644 | -107 | 39 | -193 | -1,277 | 0 | -4,045 | 0 | 0 | |||||||||||||||||||||||||||||||
| Property charges | -4,119 | -2,776 | -857 | 27 | -190 | -3,904 | 0 | -11,820 | 0 | 100 | ||||||||||||||||||||||||||||||||
| Property operating results | 69,340 | 91,008 | 16,357 | 4,350 | 7,393 | 50,108 | 0 | 238,556 | 0 | 2,815 | ||||||||||||||||||||||||||||||||
| XIV. | General company expenses | 0 | 0 | 0 | 0 | 0 | 0 | -12,694 | -12,694 | 0 | -222 | |||||||||||||||||||||||||||||||
| XV. | Other operating income and expenses (depreciation and write-down on solar panels) | -1,167 | -1,546 | 0 | 0 | -215 | -418 | 0 | -3,346 | 0 | -353 | |||||||||||||||||||||||||||||||
| Operating result (before result on the portfolio) | 68,173 | 89,463 | 16,357 | 4,350 | 7,178 | 49,689 | -12,694 | 222,515 | 0 | 2,240 | ||||||||||||||||||||||||||||||||
| XVI. | Result on disposals of investment properties | -257 | 11,710 | 0 | 0 | -320 | -3 | 0 | 11,130 | 0 | -80 | |||||||||||||||||||||||||||||||
| XVIII. | Variations in the fair value of investment properties | 1,646 | 15,998 | -8,187 | -2,690 | -2,425 | 6,150 | 0 | 10,492 | 0 | -1,081 | |||||||||||||||||||||||||||||||
| Operating result | 69,562 | 117,172 | 8,170 | 1,660 | 4,433 | 55,836 | -12,694 | 244,137 | 0 | 1,080 | ||||||||||||||||||||||||||||||||
| Press release – 31 July 2026 | 72 |
| H1 2025 | ||||||||||||||||||||||||||||||||||||||||||
| in euros (x 1,000) | Belgium | The Netherlands | France | Germany | Luxembourg² | Romania | Unallocated amounts | Total IFRS | Luxembourg³ | Other joint ventures³ | ||||||||||||||||||||||||||||||||
| I. | Rental income | 59,725 | 87,493 | 13,013 | 4,038 | 3,808 | 53,462 | 0 | 221,539 | 2,707 | 1,903 | |||||||||||||||||||||||||||||||
| III. | Costs related to leases | 13 | 220 | 64 | 0 | 22 | -1,027 | 0 | -708 | 0 | 0 | |||||||||||||||||||||||||||||||
| Net rental result | 59,738 | 87,713 | 13,077 | 4,038 | 3,829 | 52,436 | 0 | 220,831 | 2,707 | 1,903 | ||||||||||||||||||||||||||||||||
| IV. | Recovery of property costs | 0 | 0 | 0 | 0 | 0 | 0 | 0 | 0 | 0 | 0 | |||||||||||||||||||||||||||||||
| V. | Recovery of rental charges normally paid by the tenant on let properties | 11,113 | 2,434 | 1,181 | 371 | 0 | 12,104 | 0 | 27,203 | 255 | 104 | |||||||||||||||||||||||||||||||
| VI. | Costs payable by tenants and paid out by the owner for rental damage and refurbishment at end of lease | 0 | 0 | 0 | 0 | 0 | 0 | 0 | 0 | 0 | 0 | |||||||||||||||||||||||||||||||
| VII. | Rental charges and taxes normally paid by the tenant on let properties | -12,820 | -7,548 | -1,261 | -371 | -27 | -12,963 | 0 | -34,989 | -261 | -106 | |||||||||||||||||||||||||||||||
| VIII. | Other income and charges related to leases¹ | 6,900 | 6,248 | 114 | 49 | 189 | 1,753 | 0 | 15,251 | 254 | 328 | |||||||||||||||||||||||||||||||
| Property result | 64,931 | 88,846 | 13,111 | 4,087 | 3,991 | 53,329 | 0 | 228,295 | 2,956 | 2,229 | ||||||||||||||||||||||||||||||||
| IX. | Technical costs | -1,596 | -2,173 | -83 | -17 | -67 | -2,170 | 0 | -6,106 | -65 | 115 | |||||||||||||||||||||||||||||||
| X. | Commercial costs | -664 | -129 | -20 | -40 | 80 | -286 | 0 | -1,058 | 0 | -2 | |||||||||||||||||||||||||||||||
| XII. | Property management costs | -1,614 | -318 | -14 | -5 | -272 | -1,099 | 0 | -3,322 | -6 | -6 | |||||||||||||||||||||||||||||||
| Property charges | -3,874 | -2,621 | -117 | -61 | -259 | -3,555 | 0 | -10,486 | -71 | 107 | ||||||||||||||||||||||||||||||||
| Property operating results | 61,057 | 86,225 | 12,994 | 4,026 | 3,732 | 49,775 | 0 | 217,809 | 2,885 | 2,336 | ||||||||||||||||||||||||||||||||
| XIV. | General company expenses | 0 | 0 | 0 | 0 | -454 | 0 | -11,726 | -11,726 | -123 | -197 | |||||||||||||||||||||||||||||||
| XV. | Other operating income and expenses (depreciation and write-down on solar panels) | -3,945 | -1,345 | 0 | 0 | -87 | -336 | 0 | -5,713 | -77 | -545 | |||||||||||||||||||||||||||||||
| Operating result (before result on the portfolio) | 57,112 | 84,881 | 12,994 | 4,026 | 3,191 | 49,438 | -11,726 | 200,371 | 2,685 | 1,593 | ||||||||||||||||||||||||||||||||
| XVI. | Result on disposals of investment properties | 136 | 0 | 0 | 0 | 0 | 0 | 0 | 135 | 0 | 0 | |||||||||||||||||||||||||||||||
| XVIII. | Variations in the fair value of investment properties | -12,358 | 22,408 | 7,599 | 1,740 | 987 | -588 | 0 | 19,787 | -122 | -759 | |||||||||||||||||||||||||||||||
| Operating result | 44,890 | 107,289 | 20,593 | 5,766 | 4,178 | 48,850 | -11,726 | 220,294 | 2,563 | 834 | ||||||||||||||||||||||||||||||||
| 1 | In the first half year 2026, income from investments in energy totalled 14.010 million euros against 13.280 million euros in the first half year 2025. This income was generated in Belgium (6.092 million euros), the Netherlands (5.508 million euros), France (0.001 million euros), Germany (0.113 million euros), Luxembourg (0.438 millions euro) and Romania (1.857 million euros). The joint ventures WDPort of Ghent Big Box and Gosselin-WDP generated 0.348 million euros and 0.030 million euros in the first half year 2026. In addition to the income from investments in energy, the property management fees and other operating income/costs are part of the Other income and charges related to leases. |
| Press release – 31 July 2026 | 73 |
| 2 | At the beginning of 2025, WDP Invest acquired 100% of the shares in the Luxembourg companies Site Industriel SA (owner of the site in Hautcharage), Sisa Foetz SA (owner of the site in Foetz) and SISA Energy SA. In early 2026, WDP completed an asset swap with the Luxembourg government, resulting in 100% ownership of WDP Luxembourg SA. WDP subsequently sold the logistics site to the Luxembourg State. See press release dated 31 March 2026. |
| 3 | The joint ventures are incorporated using the equity accounting method, as per IFRS 11 Joint arrangements. The table shows the operating result based on the proportionate share of WDP and then gives the reconciliation with the proportionate share in the results of these entities, as reported under the equity accounting method as per IFRS. |
The basis for reporting per segment is the geographical region. This segmentation basis reflects the geographical markets in Europe in which WDP is active. WDP’s activity is divided into six regions. More information about which subsidiaries are located within the geographical regions can be found in the group structure; see explanatory note 2.6. Information on subsidiaries.
This segmentation is important for WDP given that the nature of its business, its clients, etc. represents similar economic characteristics within these segments. Business decisions are taken at this level and different key performance indicators (such as rental income, occupancy rates, etc.) are monitored in this manner.
A second segmenting basis is not considered relevant by WDP, as the business mainly focuses on the leasing of logistics sites.
2.5. Segmented information – Assets
| 30.06.2026 | ||||||||||||||||||||||||||||||||||||
| in euros (x 1,000) | Belgium | The Netherlands | France | Germany | Luxembourg | Romania | Total IFRS | Luxembourg | Other joint ventures | |||||||||||||||||||||||||||
| Investment properties | 2,525,351 | 3,158,740 | 717,248 | 157,952 | 239,630 | 1,637,907 | 8,436,827 | 0 | 88,963 | |||||||||||||||||||||||||||
| Existing buildings | 2,439,300 | 3,051,192 | 702,630 | 157,952 | 239,630 | 1,382,054 | 7,972,758 | 0 | 88,077 | |||||||||||||||||||||||||||
| Projects under development for own account | 47,850 | 87,622 | 10,525 | 0 | 0 | 92,882 | 238,878 | 0 | 886 | |||||||||||||||||||||||||||
| Land reserves | 38,201 | 19,926 | 4,093 | 0 | 0 | 162,970 | 225,191 | 0 | 0 | |||||||||||||||||||||||||||
| Assets held for sale | 0 | 0 | 0 | 0 | 0 | 21,647 | 21,647 | 0 | 0 | |||||||||||||||||||||||||||
| Other tangible fixed assets | 69,453 | 74,705 | 55 | 4,480 | 8,890 | 45,235 | 202,819 | 0 | 7,249 | |||||||||||||||||||||||||||
| Tangible fixed assets for own use | 5,563 | 160 | 55 | 4 | 0 | 1,936 | 7,718 | 0 | 1,367 | |||||||||||||||||||||||||||
| Other: energy assets | 63,891 | 74,545 | 0 | 4,476 | 8,890 | 43,299 | 195,101 | 0 | 5,882 | |||||||||||||||||||||||||||
| 31.12.2025 | ||||||||||||||||||||||||||||||||||||
| in euros (x 1,000) | Belgium | The Netherlands | France | Germany | Luxembourg | Romania | Total IFRS | Luxembourg | Other joint ventures | |||||||||||||||||||||||||||
| Investment properties | 2,512,872 | 3,125,248 | 695,228 | 160,588 | 113,659 | 1,600,325 | 8,207,921 | 99,612 | 87,495 | |||||||||||||||||||||||||||
| Existing buildings | 2,430,678 | 2,955,968 | 682,015 | 160,588 | 113,659 | 1,378,359 | 7,721,268 | 99,612 | 81,936 | |||||||||||||||||||||||||||
| Projects under development for own account | 44,026 | 149,354 | 9,119 | 0 | 0 | 72,075 | 274,573 | 0 | 5,560 | |||||||||||||||||||||||||||
| Land reserves | 38,168 | 19,926 | 4,093 | 0 | 0 | 149,891 | 212,079 | 0 | 0 | |||||||||||||||||||||||||||
| Assets held for sale | 0 | 0 | 0 | 0 | 0 | 0 | 0 | 0 | 0 | |||||||||||||||||||||||||||
| Other tangible fixed assets | 67,211 | 75,630 | 0 | 0 | 991 | 43,109 | 186,941 | 3,479 | 7,341 | |||||||||||||||||||||||||||
| Tangible fixed assets for own use | 5,389 | 164 | 0 | 0 | 0 | 1,941 | 7,494 | 0 | 1,255 | |||||||||||||||||||||||||||
| Other: energy assets | 61,822 | 75,467 | 0 | 0 | 991 | 41,168 | 179,447 | 3,479 | 6,085 | |||||||||||||||||||||||||||
| Press release – 31 July 2026 | 74 |
Fair value (as determined by IFRS 13) is defined as the price that would be received to sell an asset or paid to transfer a liability in an orderly transaction between market participants at the measurement date, in the principal market for the asset or liability. From the seller’s perspective, this is the investment property value net of transfer taxes. In Belgium, the effective amount of this tax depends on the transfer method, the status of the buyer and the geographical location of the asset. The first two elements, and hence the full amount of the taxes due, are therefore only known when the transfer of ownership has been completed.
In 2006, 2016 and 2025 a panel of independent property appraisers analysed a representative number of transactions to determine the average impact of transfer taxes within the Belgian market. The panel found that there were no material differences by subsector and that the average transaction costs for properties above 2.5 million euros were approximately 2.5% in line with previous exercises. Below this threshold, it could be observed that the standard rate of registration duties was applied.
WDP’s independent property appraisers have deducted 2.5% transfer charges from the value of the Belgian properties with an investment value above 2.5 million euros in arriving at the fair value. For individual properties with an investment value less than 2.5 million euros (three properties), a deduction of 12.5% transfer taxes is applied.
| Press release – 31 July 2026 | 75 |
2.6. Information on subsidiaries
| 30.06.2026 | 31.12.2025 | |||||||||
| Name | % Ownership / Voting rights | Method of consolidation | % Ownership / Voting rights | |||||||
| WDP NV | Parent company | Parent company | ||||||||
| WDP France SARL | 100 | % | Full Consolidation | 100 | % | |||||
| WDP Nederland N.V. | 100 | % | Full Consolidation | 100 | % | |||||
| WDP Development NL N.V.¹ | 100 | % | Full Consolidation | 100 | % | |||||
| Eurologistik 1 Freehold BV² | 100 | % | Full Consolidation | 100 | % | |||||
| WDP Invest NV³ | 100 | % | Full Consolidation | 100 | % | |||||
| Warehouses De Pauw Romania SRL³ | 100 | % | Full Consolidation | 100 | % | |||||
| I Love Hungaria NV⁴ | 50 | % | Equity method | 50 | % | |||||
| WDPort of Ghent Big Box NV⁵ | 50 | % | Equity method | 50 | % | |||||
| Gosselin-WDP NV⁶ | 29 | % | Equity method | 29 | % | |||||
| nanoGrid BV⁷ | 25%+1 | Equity method | 25%+1 | |||||||
| WDP Luxembourg SA⁸ | 100 | % | Full Consolidation | 55 | % | |||||
| WDP Deutschland GmbH⁹ | 100 | % | Full Consolidation | 100 | % | |||||
| Catena AB¹⁰ | 10 | % | Equity method | 10 | % | |||||
| Expo Market Doraly SRL¹¹ | 100 | % | Full Consolidation | 100 | % | |||||
| WDP Deutschland Services GmbH¹² | 100 | % | Full Consolidation | 100 | % | |||||
| Matemco NV¹³ | 100 | % | Full Consolidation | 100 | % | |||||
| Alcovil NV¹³ | 100 | % | Full Consolidation | 100 | % | |||||
| Pielon BV¹⁴ | 100 | % | ||||||||
| Site Industriel SA¹⁵ | 100 | % | Full Consolidation | 100 | % | |||||
| Sisa Foetz SA¹⁵ | 100 | % | ||||||||
| Sisa-Energy SA¹⁵ | 100 | % | Full Consolidation | 100 | % | |||||
| WDPBrownfieldlaan BV¹⁶ | 100 | % | Full Consolidation | 100 | % | |||||
| 1 | WDP Development NL N.V. was founded in August 2011 as a permanent development company for own account of WDP Nederland N.V. |
| 2 | On 7 June 2013 WDP acquired 100% of the shares in Eurologistik 1 Freehold BVBA, holding the rights to an existing logistic site in Vilvoorde. |
| 3 | As part of the streamlining of the Group and its foreign non-REIT participations, the shares of Warehouses De Pauw Romania SRL and WDP Luxembourg SA held by WDP NV/SA were contributed to WDP Invest NV/SA on 22 December 2020 by way of capital increase by contribution in kind. WDP Invest acts as an autonomous investment and financing vehicle for the international activities of the Group as from the aforementioned date. At the beginning of 2025, WDP Invest NV became 100% owner of Warehouses De Pauw Romania SRL. |
| 4 | This is a joint venture founded in May of 2015 between WDP NV/SA and project developer L.I.F.E. NV/SA with a view to redevelopment of the Hungaria building in Leuven. By notarial deed dated 30 January 2026, the company was dissolved and placed into liquidation, as all residential units had been sold and the company’s purpose had therefore been completed. |
| 5 | The joint venture was set up in December 2020 between WDP NV/SA and the co-shareholders Sakolaki and Vendis Capital (shareholders of Exterioo, Juntoo and X²O Badkamers), with regard to the realization of a site in the Port of Ghent that is leased by two of these retailers. In 2023, WDP acquired 21% of the shares from Sakolaki NV, bringing its total ownership to 50%. The company WDPort of Ghent Big Box is jointly controlled. At the beginning of July 2026, the shareholding was increased from 50% to 80%. |
| 6 | The joint venture was set up in June 2023 between WDP NV/SA and the co-shareholder Warehousing & Warehouse Related Services Belgium NV/SA in the context of real estate transactions. Based on the decision-making rules within the Board of Directors, this company is managed under joint control. |
| 7 | In the last quarter of 2021, WDP took a 25%+1 stake in the energy proptech company nanoGrid (founded by Joost Desmedt). The consolidated result before tax of nanoGrid BV amounts to -0.02% of the consolidated result before tax of WDP NV. The consolidated assets of nanoGrid BV amounts to 0.02% of the consolidated assets of WDP NV. |
| Press release – 31 July 2026 | 76 |
| 8 | This is a joint venture, of which the Luxembourg government owns 45% and of which WDP acquired 55% of the shares on 13 October 2017. Based on the decision-making rules within the Board of Directors, this company is managed under joint control. In early 2026, WDP completed an asset swap with the Luxembourg government, resulting in 100% ownership of WDP Luxembourg SA. WDP subsequently sold the logistics site of Foetz to the Luxembourg State. As from 2026, the company WDP Luxembourg SA is fully consolidated. See press release dated 31 March 2026. |
| 9 | On the 18th of December 2019 WDP NV/SA bought, through its fully subsidiary WDP Invest NV/SA, a participation in of 50% in WVI Gmbh, a joint venture with VIB Vermögen. From July 2022, WVI GmbH is a 100% subsidiary of WDP Invest NV, forming WDP Deutschland GmbH. This transaction is not deemed to be a business combination. |
| 10 | At the beginning of April 2022, WDP and Catena AB realized a stategic partnership. Joost Uwents was appointed as a director on Catena’s Board of Directors at Catena’s annual General Meeting. |
| 11 | At the end of March 2024, Warehouses De Pauw Romania acquired 100% of the shares in the company Expo Market Doraly SRL, which owns a high-yield urban logistics cluster in Bucharest. This transaction is not considered as a business combination. In addition to the real estate, 4 million euros in current assets and 55 million euros in liabilities were acquired. |
| 12 | WDP Deutschland Services GmbH was created in November 2024 and is a 100% subsidiary of WDP Invest NV. |
| 13 | In January 2025, WDP NV acquired 100% of the shares of the companies Matemco NV and Alcovil NV, which own the iconic Renault site in Vilvoorde. In addition to the real estate, 9 million euros in cash and cash equivalents and 19 million euros in liabilities were acquired. This transaction is not considerd to be a business combination. |
| 14 | On 19 February 2025, WDP NV acquired the company Pielon BV by means of a contribution in kind of shares. This company owns a logistics site in the Londerzeel business park. In addition to the real estate, 1 million euros in liabilities were acquired. This transaction is not considerd to be a business combination. The company merged with WDP NV on 1 April 2026. |
| 15 | Early 2025, WDP Invest acquired 100% of the shares of the companies Site Industriel SA, Sisa Foetz SA and Sisa Energy SA. As a result, WDP became the owner of an innovative multi-tenant hub in Hautcharage and three buildings in Foetz. In addition to the real estate, 44 million euros in debt was assumed, 10 million euros in deferred taxes on the real estate, and 27 million euros in working capital. This transaction is not considerd to be a business combination. As part of the asset swap with the Luxembourg government, the company Sisa Foetz SA was sold to the Luxembourg government in early 2026. |
| 16 | In the last quarter of 2025, WDP NV acquired 100% of the shares in the company WDPBrownfieldlaan BV. As a result, WDP became the owner of a strategically located plot of land in Willebroek. The purchase price consisted mainly of the real estate. This transaction is not considerd to be a business combination. |
The full address of the registered office of the subsidiaries is available at the website.
2.7. Overview of future rental income
| in euros (x 1,000) | 30.06.2026 | 31.12.2025 | ||||||
| Future rental income | ||||||||
| less than one year | 468,687 | 448,918 | ||||||
| one to two years | 415,000 | 397,099 | ||||||
| two to three years | 359,931 | 341,096 | ||||||
| three to four years | 297,494 | 295,397 | ||||||
| four to five years | 227,599 | 234,608 | ||||||
| more than five years | 901,852 | 885,691 | ||||||
| Total | 2,670,563 | 2,602,809 | ||||||
This table contains an overview of the future rental income under the current agreements. It is based on the non-indexed rents received up to and including the first due date, as set out in the leases.
| Press release – 31 July 2026 | 77 |
2.8. Investment property48
| 30.06.2026 | ||||||||||||||||||||||||||||||||||||
| in euros (x 1,000) | Belgium | Netherlands | France | Germany | Luxembourg | Romania | Total IFRS | Luxembourg | Other joint ventures | |||||||||||||||||||||||||||
| Level according to IFRS | 3 | 3 | 3 | 3 | 3 | 3 | 3 | 3 | ||||||||||||||||||||||||||||
| Fair value as at previous financial year-end | 2,512,872 | 3,125,248 | 695,228 | 160,588 | 113,659 | 1,600,325 | 8,207,921 | 99,612 | 87,495 | |||||||||||||||||||||||||||
| Investments | 10,833 | 20,374 | 2,487 | 53 | 758 | 27,733 | 62,237 | 0 | 2,548 | |||||||||||||||||||||||||||
| New acquisitions | 0 | 16,970 | 27,721 | 0 | 0 | 25,346 | 70,036 | 0 | 0 | |||||||||||||||||||||||||||
| Acquisition of investment properties by means of share- based payment transactions (contribution in kind) | 0 | 0 | 0 | 0 | 0 | 0 | 0 | 0 | 0 | |||||||||||||||||||||||||||
| Investment properties from associated companies and joint ventures that became a wholly owned subsidiary during the financial year | 0 | 0 | 0 | 0 | 183,285 | 0 | 183,285 | -99,612 | 0 | |||||||||||||||||||||||||||
| Transfers to fixed assets held for sale | 0 | 0 | 0 | 0 | 0 | -21,647 | -21,647 | 0 | 0 | |||||||||||||||||||||||||||
| Disposals | 0 | -19,850 | 0 | 0 | -55,647 | 0 | -75,497 | 0 | 0 | |||||||||||||||||||||||||||
| Changes in the fair value | 1,646 | 15,998 | -8,187 | -2,690 | -2,425 | 6,150 | 10,492 | 0 | -1,081 | |||||||||||||||||||||||||||
| Fair value as at 30.06.2026 | 2,525,351 | 3,158,740 | 717,248 | 157,952 | 239,630 | 1,637,907 | 8,436,827 | 0 | 88,963 | |||||||||||||||||||||||||||
| Acquisition price | 1,748,519 | 2,509,705 | 609,857 | 131,139 | 191,523 | 1,473,977 | 6,664,720 | 0 | 78,110 | |||||||||||||||||||||||||||
| Insured value¹ | 1,608,658 | 2,358,092 | 519,385 | 81,163 | 197,356 | 1,206,726 | 5,971,379 | 0 | 73,934 | |||||||||||||||||||||||||||
| Rental income during 2026 | 63,754 | 93,122 | 16,937 | 4,158 | 7,205 | 53,664 | 238,840 | 0 | 2,310 | |||||||||||||||||||||||||||
| Press release – 31 July 2026 | 78 |
| 31.12.2025 | ||||||||||||||||||||||||||||||||||||
| in euros (x 1,000) | Belgium | Netherlands | France | Germany | Luxembourg | Romania | Total IFRS | Luxembourg | Other joint ventures | |||||||||||||||||||||||||||
| Level according to IFRS | 3 | 3 | 3 | 3 | 3 | 3 | 3 | 3 | ||||||||||||||||||||||||||||
| Fair value as at previous financial year-end | 2,303,142 | 2,985,017 | 561,335 | 158,428 | 0 | 1,505,567 | 7,513,487 | 98,389 | 73,190 | |||||||||||||||||||||||||||
| Investments | 41,159 | 68,552 | 3,128 | 321 | 961 | 71,858 | 185,979 | 1,603 | 11,724 | |||||||||||||||||||||||||||
| New acquisitions | 121,524 | 23,038 | 116,825 | 0 | 109,811 | 29,252 | 400,450 | 0 | 0 | |||||||||||||||||||||||||||
| Acquisition of investment properties by means of share-based payment transactions (contribution in kind) | 87,991 | 0 | 0 | 0 | 0 | 0 | 87,991 | 0 | 0 | |||||||||||||||||||||||||||
| Investment properties from associated companies and joint ventures that became a wholly owned subsidiary during the financial year | 0 | 0 | 0 | 0 | 0 | 0 | 0 | 0 | 0 | |||||||||||||||||||||||||||
| Transfers to fixed assets held for sale | 0 | 0 | 0 | 0 | 0 | 0 | 0 | 0 | -306 | |||||||||||||||||||||||||||
| Disposals | -33,623 | 0 | 0 | 0 | 0 | -14,979 | -48,602 | 0 | 0 | |||||||||||||||||||||||||||
| Changes in the fair value | -7,321 | 48,641 | 13,939 | 1,840 | 2,888 | 8,627 | 68,614 | -380 | 2,887 | |||||||||||||||||||||||||||
| Fair value as at 31.12.2025 | 2,512,872 | 3,125,248 | 695,228 | 160,588 | 113,659 | 1,600,325 | 8,207,921 | 99,612 | 87,495 | |||||||||||||||||||||||||||
| Acquisition price | 1,723,743 | 2,487,861 | 579,237 | 131,085 | 110,522 | 1,432,902 | 6,465,350 | 71,233 | 72,717 | |||||||||||||||||||||||||||
| Insured value¹ | 1,639,336 | 2,273,879 | 441,207 | 81,163 | 98,505 | 1,204,489 | 5,738,579 | 81,153 | 57,229 | |||||||||||||||||||||||||||
| Rental income during 2025 | 122,608 | 176,514 | 27,950 | 8,145 | 7,516 | 108,049 | 450,782 | 5,366 | 4,010 | |||||||||||||||||||||||||||
| 1 | Land is not included. |
| 48 | Including project developments in accordance with IAS 40. |
| Press release – 31 July 2026 | 79 |
Investments and new acquisitions total 132 million euros in the first half of 2026. In the cash flow statement, the section Payments regarding acquisitions of real estate investments amounts to 152 million euros. The difference of 20 million euros is primarily explained by the 16 million euros of investments and acquisitions made in 2025, for which the related cash outflows occurred in the first half of 2026.
The acquisitions were realised at fair value prices as per valuation reports prepared by the independent property experts.
During the first half of 2026, WDP completed the disposal of a logistics site in Duiven, the Netherlands. The transaction also included solar panels, which are presented separately from investment property. Furthermore, WDP signed an agreement for the disposal of a logistics site in Romania to an end-user. As of 30 June 2026, the asset was transferred to fixed assets held for sale. Further details on those divestments are provided in 1.2.4. Divestments in the first half of 2026.
2.9. Statement of financial debt
| Included as of | < 1 year | 1-5 years | > 5 years | |||||||||||||||||||||||||||||
| in euros (x 1,000) | 30.06.2026 | 31.12.2025 | 30.06.2026 | 31.12.2025 | 30.06.2026 | 31.12.2025 | 30.06.2026 | 31.12.2025 | ||||||||||||||||||||||||
| Commercial paper | 90,150 | 112,450 | 90,150 | 112,450 | ||||||||||||||||||||||||||||
| Straight loans | 22,142 | 29,193 | 22,142 | 29,193 | ||||||||||||||||||||||||||||
| Roll over loans | 167,290 | 60,355 | 167,290 | 60,355 | ||||||||||||||||||||||||||||
| Bond loan | 0 | 60,000 | 0 | 60,000 | ||||||||||||||||||||||||||||
| Other | 170 | 234 | 170 | 234 | ||||||||||||||||||||||||||||
| Current financial liabilities | 279,753 | 262,232 | 279,753 | 262,232 | ||||||||||||||||||||||||||||
| Roll over loans | 2,199,002 | 1,997,229 | 1,818,199 | 1,571,439 | 380,802 | 425,789 | ||||||||||||||||||||||||||
| Bond loan | 1,244,661 | 1,244,236 | 646,387 | 99,850 | 598,274 | 1,144,386 | ||||||||||||||||||||||||||
| Other | 914 | 989 | 639 | 631 | 275 | 358 | ||||||||||||||||||||||||||
| Non-current financial liabilities | 3,444,576 | 3,242,454 | 2,465,225 | 1,671,920 | 979,351 | 1,570,534 | ||||||||||||||||||||||||||
| Total | 3,724,329 | 3,504,686 | 279,753 | 262,232 | 2,465,225 | 1,671,920 | 979,351 | 1,570,534 | ||||||||||||||||||||||||
Following the purchase of the 45% stake of the State of the Grand Duchy of Luxembourg in WDP Luxembourg early 2026,WDP Luxembourg is fully consolidated from financial year 2026 onwards, and the company Sisa Foetz was sold. As a result of this transaction, net financial debt increased by 58.8 million euros. This largely explains the difference with the sum of the loans issued and loans repaid in the cash flow statement.
For more information, see IV. Management of financial resources.
| Press release – 31 July 2026 | 80 |
2.10. Financial instruments
| 30.06.2026 | |||||||||||||||||||||
| in euros (x 1,000) | IFRS balance sheet section | Level (IFRS) | Financial fair value | Financial cost | Book value | Fair value | |||||||||||||||
| Financial assets | |||||||||||||||||||||
| Assets at fair value through result – Permitted hedging instruments | |||||||||||||||||||||
| Interest Rate Swap | I. E. | 2 | 37,954 | 37,954 | 37,954 | ||||||||||||||||
| Financial assets at amortised costs | I. E. | 2 | 5,130 | 5,130 | 5,130 | ||||||||||||||||
| Long-term receivables | |||||||||||||||||||||
| Trade receivables and other fixed assets | I. G. | 2 | 2,821 | 2,821 | 2,821 | ||||||||||||||||
| Short-term receivables | |||||||||||||||||||||
| Trade receivables | II. D. | 2 | 46,672 | 46,672 | 46,672 | ||||||||||||||||
| Interest Rate Swap | II. E. | 2 | 1,489 | 1,489 | 1,489 | ||||||||||||||||
| Cash and cash equivalents | II. F. | 2 | 19,634 | 19,634 | 19,634 | ||||||||||||||||
| Accruals and deferrals on the assets: interest charges on loans and permitted hedging instruments | |||||||||||||||||||||
| Interest on loans | II. G. | 2 | 445 | 445 | 445 | ||||||||||||||||
| Interest on permitted hedging instruments | II. G. | 2 | 333 | 333 | 333 | ||||||||||||||||
| Total | 39,776 | 74,701 | 114,477 | 114,477 | |||||||||||||||||
| Financial liabilities | |||||||||||||||||||||
| Non-current financial debt | |||||||||||||||||||||
| Bond loan: private placement | I. B. | 2 | 1,244,661 | 1,244,661 | 1,156,263 | ||||||||||||||||
| Bank debt | I. B. | 2 | 2,199,002 | 2,199,002 | 2,173,204 | ||||||||||||||||
| Other non-current financial debt | I. B. | 2 | 914 | 914 | 914 | ||||||||||||||||
| Other non-current financial liabilities | |||||||||||||||||||||
| Permitted hedging instruments: Interest Rate Swaps | I. C. | 2 | 9 | 9 | 9 | ||||||||||||||||
| Other non-current financial liabilities | I. C. | 3 | 102,382 | 102,382 | 102,382 | ||||||||||||||||
| Current financial debt | |||||||||||||||||||||
| Bond loan: private placement | II. B. | 0 | 0 | 0 | |||||||||||||||||
| Commercial paper | II. B. | 2 | 90,150 | 90,150 | 90,150 | ||||||||||||||||
| Bank debt | II. B. | 2 | 189,433 | 189,433 | 189,433 | ||||||||||||||||
| Other current financial debt | II. B. | 2 | 170 | 170 | 170 | ||||||||||||||||
| Other current financial liabilities | |||||||||||||||||||||
| Other current financial liabilities | II. C. | 3 | 203 | 203 | 203 | ||||||||||||||||
| Trade payables and other current debts | II. D. | 2 | 90,594 | 90,594 | 90,594 | ||||||||||||||||
| Accruals and deferrals on the liabilities: interest charges on loans and permitted hedging instruments | |||||||||||||||||||||
| Interest on loans | II. F. | 2 | 23,551 | 23,551 | 23,551 | ||||||||||||||||
| Interest on permitted hedging instruments | II. F. | 2 | 1,072 | 1,072 | 1,072 | ||||||||||||||||
| Total | 1,080 | 3,941,058 | 3,942,139 | 3,827,943 | |||||||||||||||||
| Press release – 31 July 2026 | 81 |
| 31.12.2025 | |||||||||||||||||||||
| in euros (x 1,000) | IFRS balance sheet section | Level (IFRS) | Financial assets/ liabilities valuated at fair value | Financial assets/ liabilities at amortised cost | Book value | Fair value | |||||||||||||||
| Financial assets | |||||||||||||||||||||
| Assets at fair value through result – Permitted hedging instruments | |||||||||||||||||||||
| Interest Rate Swap | I. E. | 2 | 35,480 | 35,480 | 35,480 | ||||||||||||||||
| Financial assets at amortised costs | I. E. | 2 | 4,782 | 4,782 | 4,782 | ||||||||||||||||
| Long-term receivables | |||||||||||||||||||||
| Trade receivables and other fixed assets | I. G. | 2 | 237 | 237 | 237 | ||||||||||||||||
| Short-term receivables | |||||||||||||||||||||
| Trade receivables | II. D. | 2 | 40,746 | 40,746 | 40,746 | ||||||||||||||||
| Interest Rate Swap | II. E. | 2 | 829 | 829 | 829 | ||||||||||||||||
| Cash and cash equivalents | II. F. | 2 | 14,786 | 14,786 | 14,786 | ||||||||||||||||
| Accruals and deferrals on the assets: interest charges on loans and permitted hedging instruments | |||||||||||||||||||||
| Interest on loans | II. G. | 2 | 576 | 576 | 576 | ||||||||||||||||
| Interest on permitted hedging instruments | II. G. | 2 | 347 | 347 | 347 | ||||||||||||||||
| Total | 36,656 | 61,127 | 97,783 | 97,783 | |||||||||||||||||
| Financial liabilities | |||||||||||||||||||||
| Non-current financial debt | |||||||||||||||||||||
| Bond loan: private placement | I. B. | 2 | 1,244,236 | 1,244,236 | 1,158,598 | ||||||||||||||||
| Bank debt | I. B. | 2 | 1,997,229 | 1,997,229 | 1,972,380 | ||||||||||||||||
| Other non-current financial debt | I. B. | 2 | 989 | 989 | 989 | ||||||||||||||||
| Other non-current financial liabilities | |||||||||||||||||||||
| Permitted hedging instruments: Interest Rate Swaps | I.C. | 2 | 3,423 | 3,423 | 3,423 | ||||||||||||||||
| Other non-current financial liabilities | I.C. | 3 | 87,745 | 87,745 | 87,745 | ||||||||||||||||
| Current financial debt | |||||||||||||||||||||
| Bond loan: private placement | I. B. | 2 | 60,000 | 60,000 | 59,768 | ||||||||||||||||
| Commercial paper | II. B. | 2 | 112,450 | 112,450 | 112,450 | ||||||||||||||||
| Bank debt | II. B. | 2 | 89,548 | 89,548 | 89,548 | ||||||||||||||||
| Other current financial debt | II. B. | 2 | 234 | 234 | 234 | ||||||||||||||||
| Other current financial liabilities | |||||||||||||||||||||
| Other current financial liabilities | II.C. | 3 | 203 | 203 | 203 | ||||||||||||||||
| Trade payables and other current debts | II.D. | 2 | 86,848 | 86,848 | 86,848 | ||||||||||||||||
| Accruals and deferrals on the liabilities: interest charges on loans and permitted hedging instruments | |||||||||||||||||||||
| Interest on loans | II. F. | 2 | 23,552 | 23,552 | 23,552 | ||||||||||||||||
| Interest on permitted hedging instruments | II. F. | 2 | 0 | 0 | 0 | ||||||||||||||||
| Total | 3,423 | 3,703,034 | 3,706,458 | 3,595,739 | |||||||||||||||||
| Press release – 31 July 2026 | 82 |
Valuation of financial instruments
The entirety of the financial instruments of the Group corresponds to levels 1, 2 and 3 in the hierarchy of the fair values. Valuation against fair value occurs regularly.
In the event of bankruptcy of one of both contracting parties, the net position of the derivatives will be considered for the counterparty.
Level 1 in the hierarchy of fair values excludes money investments, funds and cash equivalents regarding which the fair value is based on the share price.
Level 2 in the hierarchy of fair values concerns the other financial assets and liabilities of which the fair value is based on observable inputs and other data that can be determined, directly or indirectly, for the assets or liabilities concerned. The valuation techniques concerning the fair value of the financial instruments at level 2 are as follows: the fair value of the above financial assets and liabilities is valued at the book value, except for bond loans, where fair value is determined under a discounted cash flow model based on market interest rates, since they are not traded frequently (level 2). Because the other financial debt is incurred at a floating interest rate, the fair value is very close to the book value.
Level 3 in the fair value hierarchy retains the financial liabilities recognised in accordance with IFRS 16, whose fair value is determined using non-observable inputs.
Financial instruments at fair value (as per IFRS 9)
The Group uses derivative financial instruments to hedge the interest rate risk on its financial debt to reduce the volatility of EPRA Earnings (which forms the basis for the dividend) while minimising the cost of debt. These hedges are managed centrally through a macro-hedging policy. The Group does not use derivative financial instruments for speculative purposes and does not hold derivatives for trading purposes.
Changes in the fair value of derivatives that do not qualify as hedges are recognised immediately in profit or loss. Changes in the fair value of derivatives allocated specifically to hedge the variability of cash flows of a recognised asset or liability or a forecast transaction are recognised in the section Other components in the overall result.
In January 2022, the Group entered into two pre-hedges (interest rate swaps) for a total nominal amount of 500 million euros each, which enable the Group to convert the variable interest rate for its expected future debt issues into a fixed interest rate. When the debt was issued (the placement of 500 million euros of green bonds through US private placement49 and the syndicated loan of 440 million euros50, the pre-hedges were settled, and their fair value was settled in cash at that time.
The group has determined that these financial instruments meet the conditions for hedge accounting. These instruments are initially recognised at fair value on the date the derivatives hedging interest rate risk are entered into and then measured at their fair value on subsequent closing dates. The pre-hedges were viewed as hedging instruments in a cash flow hedge relationship of a highly probable expected future transaction (issuance of debt). Changes in the fair value of the pre-hedges are recognised under Other Components of the overall result for the period until the settlement of the pre-hedges. This positive value will be distributed over the profit and loss over the life of the loans issued. Since the terms of these pre-hedges are consistent with the characteristics of the debt issued and the pre-hedges were settled on or around the date of issuance of the debt, these hedges are considered effective.
| 49 | See the press release of 14 April 2022. |
| 50 | See the press release of 28 November 2022. |
| Press release – 31 July 2026 | 83 |
The contracts are valued at fair value as per IFRS 9 on the balance sheet date. This information is received from the various financial institutions and verified by WDP by discounting the future contractual cash flows based on the corresponding interest rate curves.
Fair value is based on observable inputs, and as such, the IRS contracts fall under level 2 in the fair value hierarchy as defined in IFRS. The fair value is calculated based on a discounted cash flow model using the relevant market interest rates indicated in the forward interest curve on the balance sheet date.
No changes in the fair value hierarchy level took place in first half of 2026. During this period, no hedging instruments were arranged prior to the maturity date.
| 30.06.2026 | ||||||||||||||||
| Classification according to IFRS | Level (IFRS) | Notional amount in euros (x 1,000) | Interest
rate | Duration (in year) | ||||||||||||
| Interest Rate Swap | 2 | 1,542,425 | 0.65 | 2.9 | ||||||||||||
| Total | 1,542,425 | 0.65 | 2.9 | |||||||||||||
| 31.12.2025 | ||||||||||||||||
| Classification according to IFRS | Level (IFRS) | Notional amount in euros (x 1,000) | Interest
rate | Duration (in year) | ||||||||||||
| Interest Rate Swap | 2 | 1,592,425 | 0.64 | 3.3 | ||||||||||||
| Total | 1,592,425 | 0.64 | 3.3 | |||||||||||||
| Press release – 31 July 2026 | 84 |
2.11. Rights and obligations not recognised in the balance sheet
WDP has entered into various commitments as a part of its ongoing investment programme related to projects and acquisitions, as indicated in 1.6. Investment pipeline in execution of approximately 760 million euros in I. Performance.
Parent company WDP NV/SA has extended the following sureties for its various subsidiaries:
| ● | A security for the commitments of WDP Nederland S.A. amounting to 25 million euros for ABN AMRO (for the short-term amounts financed through a straight loan of max. 25 million euros, 14.4 million euros of which has been drawn). |
| ● | A surety agreement for WDP Luxembourg SA’s commitments of 44.1 million euros in favour of Banque et Caisse d’Epargne de l’Etat. |
| ● | A guarantee as security for the commitments of Gosselin-WDP NV/SA for 15.4 million euros in favour of KBC Bank NV. |
The WDP financing agreements include the following covenants:
| ● | An Interest Coverage of at least 1.5x. For the first half of 2026, this is 4.9x. |
| ● | A statutory and consolidated gearing ratio below 65% aligns with the GVV/SIR Act. As of 30 June 2026, these are 42.8% and 43.5% respectively. |
| ● | Limitation on projects that have still not been pre-let (development property ratio) to 15% of the book value of the portfolio (excluding land reserves). As of 30 June 2026, this ratio is 0.2%. |
| ● | A maximum of 30% of the financial debt with the subsidiaries compared to the financial debt of the group. As of 30 June 2026, this subsidiary financial debt ratio is 1.6%. |
WDP has entered into the following commitments with financiers51:
| ● | Commitment not to burden the assets with collateral, such as mortgages (negative pledge). WDP confirms that as of 30 June 2026, no mortgages or other collateral securities are outstanding in the property portfolio or other assets. |
| ● | A commitment that it will continue to qualify as a GVV/SIR. For the conditions on this, please see the Belgian Act of 12 May 2014 and the Royal Decree of 13 July 2014. For more information, see the WDP Annual Report 2025. |
| ● | For some financiers, WDP has agreed to repay the credit if a change of control occurs and the financier consequently asks for repayment. |
As of 30 June 2026, all covenants with financiers and commitments entered into by WDP have been complied with.
| 51 | The term ‘financiers’ means the credit institutions as well as financiers through debt capital markets, such as bondholders or investors in the commercial paper programme. |
| Press release – 31 July 2026 | 85 |
2.12. Significant events after the balance sheet date
| ● | On 23 July 2026, WDP and ARGAN announced the signing of a merger agreement and the common draft terms relating to a proposed friendly cross-border all-share merger, pursuant to which ARGAN would merge into WDP. The proposed transaction remains subject to shareholder approval, regulatory approvals and the fulfilment of other customary conditions precedent. Further information is provided in section Creating a core European logistics real estate REIT in Europe (page 5), the press release published on 23 July 2026 and on www.wdp-argan.eu. |
| ● | WDP has increased its participation in WDPort of Ghent Big Box NV from 50% to 80% through the acquisition of an existing shareholder’s interest. The transaction is carried out under normal market conditions and in accordance with the provisions of the joint venture agreement. The transaction increases WDP’s economic interest in the WDPort of Ghent multimodal logistics platform and is fully aligned with WDP’s long-term investment strategy. |
| ● | WDP announced additional secured acquisitions and development projects in line with its #BLEND&EXTEND2030 strategy. These transactions are not all reflected in the condensed consolidated interim financial statements as at the reporting date. Further information is provided in the chapter Performance, under the section Investment pipeline in execution of around 760 million euros. |
| Press release – 31 July 2026 | 86 |
IX. Appendices
1. External assurance
1.1. Conclusions of the property experts
WDP NV/SA has appointed nine different independent property experts (as defined in Article 26 of the GVV/SIR Act) to determine the fair value of the properties in its property portfolio. The estimates take into account both the assumptions, observations and definitions mentioned in the reports and the guidelines of the International Valuation Standards issued by IVSC.
Fair value is defined by the International Accounting Standards Board (IASB) in IFRS 13 as the price that would be received to sell an asset or paid to transfer a liability in a regular transaction between market participants at the valuation date. IVSC considers these conditions fulfilled when the aforementioned definition of fair value is respected. Moreover, the fair value should reflect current leases, reasonable assumptions about potential rental income and expected costs.
Each independent property expert confirms that they have relevant and recognised references for the properties assigned to them and also have current experience with properties of a type and location similar to those of the properties in WDP’s property portfolio.
In giving an estimate of the properties, we took into account both the current rental agreements and all rights and obligations arising from these agreements. Each property is estimated separately using comparable recent market transactions at arm’s-length terms. The estimates do not take into account any potential upside or downside that might occur by offering the portfolio in its entirety on the market. Our estimates also do not account for marketing costs specific to a transaction, such as estate agents’ fees or publicity costs. In addition to an annual inspection of these immovable property, our estimates are also based on the information provided by WDP regarding the rental situation, surface areas, sketches or plans, rental charges and taxes associated with each property concerned, compliance and environmental pollution. The information provided was deemed accurate and complete. Our estimates assume that undisclosed items are not such that they would affect the value of the property.
Each independent property expert values a part of WDP’s property portfolio and thus is only responsible for valuing that part of the portfolio that is contractually assigned to them. So, the real estate expert only confirms the accuracy of the figures of the properties that they value. No further liability is accepted for other valuations.
Based on the above statements and on the estimates of each individual property expert, we can confirm that the fair value of the property portfolio of WDP (excluding solar panels but including assets held for sale), as set out in the table below, amounted to 8,547,436,559 euros (eight billion five hundred and forty-seven million four hundred and thirty-six thousand five hundred and fifty-nine euros).
| Press release – 31 July 2026 | 87 |
| Country | Property Expert (represented by) | Fair value of as of | ||||
| Belgium | Stadim (Céline Janssens) | 1,419,446 | ||||
| Belgium | Jones Lang LaSalle Belgium (Greet Hex) | 1,194,867 | ||||
| The Netherlands | Jones Lang LaSalle Netherlands (Justin Stortelers) | 1,626,241 | ||||
| The Netherlands | CBRE Netherlands (Devin Ummels) | 1,532,499 | ||||
| France | BNP Paribas Real Estate (Caroline Hussenot) | 689,094 | ||||
| France | Jones Lang LaSalle France (Eyup Dag) | 28,154 | ||||
| Romania | CBRE Romania (Ovidiu Ion) | 1,659,553 | ||||
| Germany | CBRE Germany (Kristine Kühn) | 157,952 | ||||
| Luxembourg | Jones Lang LaSalle Luxembourg (Greet Hex) | 239,630 | ||||
| Total | 8,547,437 | |||||
| Press release – 31 July 2026 | 88 |
1.2. Statutory auditor’s report
Statutory auditor’s report to the board of directors of Warehouses De Pauw NV on the review of the condensed consolidated interim financial information as at 30 June 2026 and for the 6-month period then ended
Introduction
We have reviewed the accompanying condensed consolidated balance sheet of Warehouses De Pauw NV as at 30 June 2026, the condensed consolidated earnings statement, the condensed consolidated statement of the overall result, the condensed consolidated statement of changes in equity and the condensed consolidated statement of cash flows for the 6-month period then ended, and notes to the interim financial information (“the condensed consolidated interim financial information”). The board of directors is responsible for the preparation and presentation of this condensed consolidated interim financial information in accordance with IAS 34, “Interim Financial Reporting” as adopted by the European Union. Our responsibility is to express a conclusion on this condensed consolidated interim financial information based on our review.
Scope of Review
We conducted our review in accordance with the International Standard on Review Engagements 2410, “Review of Interim Financial Information Performed by the Independent Auditor of the Entity”. A review of interim financial information consists of making inquiries, primarily of persons responsible for financial and accounting matters, and applying analytical and other review procedures. A review is substantially less in scope than an audit conducted in accordance with International Standards on Auditing and consequently does not enable us to obtain assurance that we would become aware of all significant matters that might be identified in an audit. Accordingly, we do not express an audit opinion.
Conclusion
Based on our review, nothing has come to our attention that causes us to believe that the accompanying condensed consolidated interim financial information as at 30 June 2026 and for the 6-month period then ended is not prepared, in all material respects, in accordance with IAS 34, “Interim Financial Reporting” as adopted by the European Union.
Zaventem, 30 July 2026
KPMG Bedrijfsrevisoren
Statutory auditor
represented by
Filip De Bock
Company auditor
| Press release – 31 July 2026 | 89 |
2. EPRA Performance measures
EPRA Earnings
Recurring earnings from the core operational activities. This figure is to be considered a key measure of a company’s underlying operating results from its property rental business and an indicator of the extent to which current dividend payments are supported by earnings.
All zero-line items have been removed from the table below for clarity.
| in euros (x 1,000) | H1 2026 | H1 2025 | ||||||||
| Earnings per IFRS income statement | 186,636 | 139,187 | ||||||||
| Adjustments to calculate the EPRA Earnings, exclude: | ||||||||||
| I. | Changes in value of investment properties, development properties held for investment and other investment interests | -7,146 | -14,075 | |||||||
| - Changes in the value of the real estate portfolio | -10,492 | -19,787 | ||||||||
| - Depreciation and write-down on solar panels | 3,346 | 5,713 | ||||||||
| II. | Profits or losses on disposal of investment properties, development properties held for investment and other investment interests | -11,130 | -135 | |||||||
| VI. | Changes in fair value of financial instruments and associated close-out costs | 1,420 | 12,995 | |||||||
| X. | Deferred tax in respect of EPRA adjustments | 20,331 | 32,230 | |||||||
| XI. | Adjustments (I.) to (X.) to the above in respect of joint ventures | -3,430 | 996 | |||||||
| XII. | Non-controlling interests in respect of the above | 0 | 0 | |||||||
| EPRA Earnings | 186,681 | 171,197 | ||||||||
| Weighted average number of shares | 236,363,753 | 227,092,339 | ||||||||
| EPRA Earnings per share (EPS) (in euros) | 0.79 | 0.75 | ||||||||
| Press release – 31 July 2026 | 90 |
EPRA NAV indicators
The EPRA NAV metrics make adjustments to the IFRS NAV in order to provide stakeholders with the most relevant information on the fair value of the assets and liabilities. The three different EPRA NAV metrics are calculated based on the following rationales:
| - | EPRA NRV: the aim of the metric is to also reflect what would be needed to recreate the company through the investment markets based on its current capital and financing structure, including real estate transfer taxes. |
| - | EPRA NTA: this is the NAV adjusted to include properties and other investments at their fair value and exclude certain line items that are not expected to take shape in a business model with investment properties over the long term. |
| - | EPRA NDV: the EPRA Net Disposal Value provides the reader with a scenario of the disposal of the company’s assets resulting in the settlement of deferred taxes and the liquidition of debt and financial instruments. |
All zero-line items have been removed from the table below for clarity.
| 30.06.2026 | 31.12.2025 | |||||||||||||||||||||||
| in euros (x 1,000) | EPRA NRV | EPRA NTA | EPRA NDV | EPRA NRV | EPRA NTA | EPRA NDV | ||||||||||||||||||
| IFRS NAV | 5,015,954 | 5,015,954 | 5,015,954 | 5,018,201 | 5,018,201 | 5,018,201 | ||||||||||||||||||
| IFRS NAV/share (in euros) | 20.9 | 20.9 | 20.9 | 21.3 | 21.3 | 21.3 | ||||||||||||||||||
| Diluted NAV at fair value (after the exercise of options, convertibles and other equity interests) | 5,015,954 | 5,015,954 | 5,015,954 | 5,018,201 | 5,018,201 | 5,018,201 | ||||||||||||||||||
| Exclude: | ||||||||||||||||||||||||
| (V) Deferred tax in relation to fair value gains of investments properties | 174,104 | 174,104 | 154,042 | 154,042 | ||||||||||||||||||||
| (VI) Fair value of financial instruments | -39,434 | -39,434 | -32,886 | -32,886 | ||||||||||||||||||||
| (VIII.b) Intangibles as per the IFRS balance sheet | -1,297 | -1,408 | ||||||||||||||||||||||
| Subtotal | 5,150,624 | 5,149,327 | 5,015,954 | 5,139,358 | 5,137,950 | 5,018,201 | ||||||||||||||||||
| Include: | ||||||||||||||||||||||||
| (IX) Fair value of fixed interest rate debt | 114,196 | 110,719 | ||||||||||||||||||||||
| (XI) Real estate transfer tax | 477,561 | 470,174 | ||||||||||||||||||||||
| NAV | 5,628,185 | 5,149,327 | 5,130,149 | 5,609,532 | 5,137,950 | 5,128,920 | ||||||||||||||||||
| Number of shares | 240,543,824 | 240,543,824 | 240,543,824 | 235,139,589 | 235,139,589 | 235,139,589 | ||||||||||||||||||
| NAV/share (in euros) | 23.4 | 21.4 | 21.3 | 23.9 | 21.9 | 21.8 | ||||||||||||||||||
| Press release – 31 July 2026 | 91 |
EPRA cost ratio
Administrative/operating costs including or minus the direct vacancy costs, divided by gross rental income. This figure is to be considered a key indicator to enable meaningful measurement of the changes in operating costs of a real estate company.
All zero-line items have been removed from the table below for clarity.
| in euros (x 1,000) | H1 2026 | FY 2025 | ||||||||
| Include: | ||||||||||
| I. Administrative/operating expenses (IFRS) | -29,585 | -54,271 | ||||||||
| I-1. Impairments of trade receivables | -903 | -2,142 | ||||||||
| I-2. Recovery of property charges | 0 | 0 | ||||||||
| I-3. Recovery of rental charges and taxes normally paid by the tenant on let properties | -4,204 | -6,703 | ||||||||
| I-4. Costs payable by tenants and paid out by the owner for rental damage and refurbishment at end of lease | 0 | 0 | ||||||||
| I-5. Property charges | -11,783 | -20,219 | ||||||||
| I-6. General company expenses | -12,694 | -25,207 | ||||||||
| III. Management fees less actual/estimated profit element | 1,025 | 1,710 | ||||||||
| V. Administrative/operating expenses of joint ventures expense | -95 | -446 | ||||||||
| Exclude (if part of the above): | ||||||||||
| VI. Investment property depreciation | 0 | 265 | ||||||||
| Administrative/operating expenses related to solar panels | 1,819 | 3,087 | ||||||||
| EPRA costs (including direct vacancy costs) | A | -26,836 | -49,654 | |||||||
| IX. Direct vacancy costs | 1,824 | 2,192 | ||||||||
| EPRA costs (excluding direct vacancy costs) | B | -25,013 | -47,462 | |||||||
| X. Gross rental income (IFRS) | 238,840 | 450,781 | ||||||||
| Less net ground rent costs | -2,183 | -3,506 | ||||||||
| XII. Gross rental income of joint ventures | 2,310 | 9,376 | ||||||||
| Less net ground rent costs | 285 | -437 | ||||||||
| Gross rental income | C | 239,251 | 456,214 | |||||||
| EPRA Cost Ratio (including direct vacancy costs) | A/C | 11.2 | % | 10.9 | % | |||||
| EPRA Cost Ratio (excluding direct vacancy costs) | B/C | 10.5 | % | 10.4 | % | |||||
| Press release – 31 July 2026 | 92 |
EPRA NIY and EPRA Topped-up NIY
The EPRA NIY relates to an annualised rental income based on the cash rents passing at the balance sheet date, less non-recoverable property operating expenses, divided by the market value of the property, increased with (estimated) purchasers’ costs. It is a comparable measure around Europe for portfolio valuations. In the past, there has been debate about portfolio valuations across Europe. This measure should make it easier for investors to judge themselves, how the valuation of portfolio X compares with portfolio Y.
The EPRA TOPPED-UP NIY is a measure that incorporates an adjustment to the EPRA NIY in respect of the expiration of rentfree periods (or other unexpired lease incentives such as discounted rent periods and step rents) and provides detail on the calculation of the measure and reconciliation between the EPRA NIY and EPRA TOPPED-UP NIY.
| in euros (x 1,000) | 30.06.2026 | 31.12.2025 | ||||||||
| Investment property - wholly owned | 8,436,827 | 8,207,921 | ||||||||
| Investment property - share of joint ventures | 88,963 | 187,107 | ||||||||
| Less developments, land reserves and the right of use of consessions | -629,378 | -647,862 | ||||||||
| Completed property portfolio | 7,896,412 | 7,747,166 | ||||||||
| Allowance for estimated purchasers’ costs | 452,050 | 438,951 | ||||||||
| Gross up completed property portfolio valuations | A | 8,348,462 | 8,186,117 | |||||||
| Annualised cash passing rental income | 485,528 | 469,131 | ||||||||
| Property outgoings | -30,302 | -27,855 | ||||||||
| Annualised net rent | B | 455,227 | 441,276 | |||||||
| Notional rent expiration of rent free period or other lease incentives | 0 | 0 | ||||||||
| Topped-up net annualised rent | C | 455,227 | 441,276 | |||||||
| EPRA NIY | B/A | 5.5 | % | 5.4 | % | |||||
| EPRA TOPPED-UP NIY | C/A | 5.5 | % | 5.4 | % | |||||
| Press release – 31 July 2026 | 93 |
EPRA LTV
A key (shareholder-gearing) metric to determine the percentage of debt comparing to the appraised value of the properties. The EPRA LTV is obtained by dividing debt by the sum of the fair value of the property portfolio and the fair value of the solar panels.
| 30.06.2026 | 31.12.2025 | |||||||||||||||||||||||||||||||||||||||||
| Proportionate consolidation | Proportionate consolidation | |||||||||||||||||||||||||||||||||||||||||
| in euros (x 1,000) | Group As reported |
Share of Joint Ventures |
Share of Material Associates |
Non controlling interests (NCI) |
Combined | Group As reported |
Share of Joint Ventures |
Share of Material Associates |
Non controlling interests (NCI) |
Combined | ||||||||||||||||||||||||||||||||
| Include: | ||||||||||||||||||||||||||||||||||||||||||
| Borrowings from Financial Institutions | 2,389,518 | 48,613 | 2,438,131 | 2,088,000 | 75,380 | 2,163,381 | ||||||||||||||||||||||||||||||||||||
| Commercial paper | 90,150 | 90,150 | 112,450 | 112,450 | ||||||||||||||||||||||||||||||||||||||
| Hybrids (including convertibles, preference shares, debt, options, perpetuals) | 0 | 0 | 0 | 0 | ||||||||||||||||||||||||||||||||||||||
| Bond loans | 1,244,661 | 1,244,661 | 1,304,236 | 1,304,236 | ||||||||||||||||||||||||||||||||||||||
| Foreign currency derivatives | 7,000 | 7,000 | 11,254 | 11,254 | ||||||||||||||||||||||||||||||||||||||
| Net (trade) payables | 68,366 | 2,105 | 70,471 | 92,635 | 3,592 | 96,227 | ||||||||||||||||||||||||||||||||||||
| Owner-occupied property (debt) | 0 | 0 | 0 | 0 | ||||||||||||||||||||||||||||||||||||||
| Current accounts (equity characteristics) | 0 | 0 | 0 | 0 | ||||||||||||||||||||||||||||||||||||||
| Exclude: | ||||||||||||||||||||||||||||||||||||||||||
| Cash and cash equivalents | -19,634 | -175 | -19,809 | -14,786 | -641 | -15,427 | ||||||||||||||||||||||||||||||||||||
| Investments in non-material associates x Loan-to-value | -133,542 | -133,542 | -118,577 | -118,577 | ||||||||||||||||||||||||||||||||||||||
| Net Debt | A | 3,646,519 | 50,543 | 0 | 0 | 3,697,062 | 3,475,213 | 78,331 | 0 | 0 | 3,553,544 | |||||||||||||||||||||||||||||||
| Include: | ||||||||||||||||||||||||||||||||||||||||||
| Owner-occupied property | 0 | 0 | 0 | 0 | ||||||||||||||||||||||||||||||||||||||
| Investment properties at fair value | 8,074,829 | 72,879 | 8,147,708 | 7,843,978 | 162,696 | 8,006,674 | ||||||||||||||||||||||||||||||||||||
| Properties held for sale | 21,647 | 0 | 21,647 | 0 | 0 | 0 | ||||||||||||||||||||||||||||||||||||
| Properties under development | 260,525 | 886 | 261,410 | 274,573 | 5,560 | 280,133 | ||||||||||||||||||||||||||||||||||||
| Intangibles | 1,297 | 3,521 | 4,818 | 1,408 | 3,520 | 4,928 | ||||||||||||||||||||||||||||||||||||
| Net (trade) receivables | 0 | 0 | 0 | 0 | ||||||||||||||||||||||||||||||||||||||
| Financial assets | 3,010 | 3,010 | 2,763 | 2,763 | ||||||||||||||||||||||||||||||||||||||
| Energy assets | 195,101 | 5,882 | 200,982 | 179,447 | 9,564 | 189,012 | ||||||||||||||||||||||||||||||||||||
| Total Property Value | B | 8,556,408 | 83,167 | 0 | 0 | 8,639,575 | 8,302,170 | 181,340 | 0 | 0 | 8,483,509 | |||||||||||||||||||||||||||||||
| Loan-to-value | A/B | 42.6 | % | 42.8 | % | 41.9 | % | 41.9 | % | |||||||||||||||||||||||||||||||||
| Press release – 31 July 2026 | 94 |
3. Alternative Performance Measures52
Result on the portfolio (including the share of joint ventures) – Group share
This relates to the realised and unrealised capital gains/losses with respect to the latest valuation by the property expert, taking into account the effective or deferred capital gains tax due, including WDP’s proportionate share in the portfolio of associated companies and joint ventures and excluding the minority interests.
| in euros (x 1,000) | H1 2026 | H1 2025 | ||||||
| Movement in the fair value of investment property | 10,492 | 19,787 | ||||||
| Result on disposal of investment property | 11,130 | 135 | ||||||
| Deferred taxation on result on the portfolio | -20,331 | -32,230 | ||||||
| Participation in the result of associated companies and joint ventures | 3,738 | 55 | ||||||
| Result on the portfolio | 5,029 | -12,252 | ||||||
| Minority interests | 0 | 0 | ||||||
| Result on the portfolio - Group share | 5,029 | -12,252 | ||||||
Changes in gross rental income with an unchanged portfolio
This is the organic growth of the gross rental income year-on-year on the basis of an unchanged portfolio, excluding development projects, acquisitions and disposals during both periods of this comparison.
| in euros (x 1,000) | H1 2026 | H1 2025 | ∆ y/y (%) | |||||||||
| Properties owned throughout the two years | 217,500 | 214,158 | 1.6 | % | ||||||||
| Development projects | 11,614 | 10,207 | n.r. | |||||||||
| Acquisitions | 12,036 | 1,092 | n.r. | |||||||||
| Disposals | 0 | 691 | n.r. | |||||||||
| Total | 241,150 | 226,147 | n.r. | |||||||||
| To be excluded: | ||||||||||||
| Rental income of joint ventures | -2,310 | -4,610 | n.r. | |||||||||
| Indemnification related to early lease terminations | 2,569 | 0 | n.r. | |||||||||
| Rental income (IFRS) | 241,409 | 221,537 | n.r. | |||||||||
| 52 | Excluding EPRA metrics, some of which are considered APM and are reconciled under the 2. EPRA Performance measures. |
| Press release – 31 July 2026 | 95 |
Average cost of debt
This refers to the weighted average yearly interest rate for the reporting period, taking into account the average outstanding debt and the hedging instruments during that same period.
| in euros (x 1,000) | H1 2026 | FY 2025 | ||||||||
| Financial result (IFRS) | -43,860 | -89,752 | ||||||||
| To be excluded: | ||||||||||
| Changes in fair value of financial assets and liabilities | 1,420 | 12,415 | ||||||||
| Interest capitalised during construction | -4,391 | -7,823 | ||||||||
| Interest cost related to leasing debts booked in accordance with IFRS 16 | 2,830 | 4,304 | ||||||||
| Other financial costs and revenues | -65 | -65 | ||||||||
| To be included: | ||||||||||
| Interest expenses of joint ventures | -588 | -1,977 | ||||||||
| Effective financial expenses (proportional) | A | -44,654 | -82,898 | |||||||
| Average outstanding financial debt (IFRS) | 3,609,251 | 3,396,389 | ||||||||
| Average outstanding financial debt of joint ventures | 55,616 | 73,120 | ||||||||
| Average outstanding financial debt (proportional) | B | 3,664,867 | 3,469,509 | |||||||
| Annualised average cost of debt | A/B | 2.4 | % | 2.4 | % | |||||
Financial result (excluding changes in the fair value of financial instruments)
This is the financial result according to IFRS exclusive of the change in fair value of financial assets and liabilities, and reflects the actual financial expenses of the company.
| in euros (x 1,000) | H1 2026 | H1 2025 | ||||||
| Financial result | -43,860 | -49,878 | ||||||
| To be excluded: | ||||||||
| Changes in fair value of financial instruments | 1,420 | 12,995 | ||||||
| Financial result (excluding the changes in fair value of financial instruments) | -42,440 | -36,884 | ||||||
| Press release – 31 July 2026 | 96 |
Operating margin
The operating margin, obtained by dividing the operating result (before the result on the portfolio) by the property result. Operating margin is a measure of profitability that can indicate how well the company is managing its operating property operations.
| in euros (x 1,000) | H1 2026 | H1 2025 | ||||||
| Property result (IFRS) | 250,375 | 228,295 | ||||||
| Operating result (before the portfolio result) (excluding depreciation and write-downs on solar panels) | 225,861 | 206,084 | ||||||
| Operating margin | 90.2 | % | 90.3 | % | ||||
Hedge ratio
Percentage of fixed-rate and floating-rate debts hedged against interest rate fluctuations by means of derivatives. This economic parameter is not an obligatory parameter under the Belgian regulated real-estate investment companies Law (Wet betreffende de gereglementeerde vastgoedvennootschappen or ‘GVV-Wet’).
| in euros (x 1,000) | 30.06.2026 | 31.12.2025 | ||||||||
| Notional amount of Interest Rate Swaps | 1,542,425 | 1,592,425 | ||||||||
| Fixed rate financial debt | 1,547,416 | 1,586,257 | ||||||||
| Fixed-interest financial debt at balance sheet date and hedging instruments | A | 3,089,840 | 3,178,681 | |||||||
| Current and non-current financial debt (IFRS) | 3,724,329 | 3,504,686 | ||||||||
| Proportional share in joint ventures in current and non-current financial debt | 48,613 | 75,380 | ||||||||
| Financial debt at balance sheet date | B | 3,772,942 | 3,580,067 | |||||||
| Hedge ratio | A/B | 81.9 | % | 88.8 | % | |||||
| Press release – 31 July 2026 | 97 |
Gearing ratio
| 30.06.2026 | 30.06.2026 | 31.12.2025 | 31.12.2025 | |||||||||||||||
| in euros (x 1,000) | IFRS | Proportionate¹ | IFRS | Proportionate¹ | ||||||||||||||
| Non-current and current liabilities | 4,160,356 | 4,237,232 | 3,896,197 | 4,017,502 | ||||||||||||||
| To be excluded: | ||||||||||||||||||
| - | I. Non-current liabilities A. Provisions | 172 | 172 | 174 | 174 | |||||||||||||
| - | I. Non-current liabilities C. Other non-current financial liabilities - Permitted hedging instruments | 9 | 9 | 3,423 | 3,423 | |||||||||||||
| - | I. Non-current liabilities F. Deferred taxes - Liabilities | 168,760 | 174,104 | 135,793 | 154,042 | |||||||||||||
| - | II. Current liabilities A. Provisions | 0 | 0 | 0 | 0 | |||||||||||||
| - | II. Current liabilities E. Other current liabilities Other: Hedging instruments | 0 | 0 | 0 | 0 | |||||||||||||
| - | II. Current liabilities F. Accruals and deferred income | 50,856 | 52,265 | 57,286 | 58,647 | |||||||||||||
| Total debt | A | 3,940,559 | 4,010,683 | 3,699,521 | 3,801,216 | |||||||||||||
| Total assets | 9,176,309 | 9,253,186 | 8,914,399 | 9,035,704 | ||||||||||||||
| To be excluded: | ||||||||||||||||||
| - | E. Financial fixed assets - Financial instruments at fair value through profit and loss - Permitted hedging instruments | 39,443 | 39,443 | 36,309 | 36,309 | |||||||||||||
| Total assets taken into account for the calculation of the gearing ratio | B | 9,136,867 | 9,213,743 | 8,878,090 | 8,999,395 | |||||||||||||
| Gearing ratio | A/B | 43.1 | % | 43.5 | % | 41.7 | % | 42.2 | % | |||||||||
| Press release – 31 July 2026 | 98 |
Loan-to-value
The loan-to-value is obtained from the IFRS statements by dividing the net financial liabilities by the sum of the fair value of the property portfolio, the fair value of the solar panels and financing to and holdings in associated companies and joint ventures.
| 30.06.2026 | 31.12.2025 | |||||||||
| in euros (x 1,000) | IFRS | IFRS | ||||||||
| Non-current and current financial debt | 3,724,329 | 3,504,686 | ||||||||
| Cash and cash equivalents | -19,634 | -14,786 | ||||||||
| Net financial debt | A | 3,704,695 | 3,489,900 | |||||||
| Fair value of the real estate portfolio (excluding right of use concessions) | 8,357,001 | 8,118,551 | ||||||||
| Energy assets | 195,101 | 179,447 | ||||||||
| Financing of and participations in associated companies and joint ventures | 358,535 | 395,559 | ||||||||
| Total portfolio | B | 8,910,636 | 8,693,557 | |||||||
| Loan-to-value | A/B | 41.6 | % | 40.1 | % | |||||
| Press release – 31 July 2026 | 99 |
Net debt / EBITDA (adjusted)
The net debt / EBITDA (adjusted) is calculated starting from the proportional accounts (WDP’s joint ventures are included for their proportionate share): in the denominator taking into account the trailing-twelve-months normalized EBITDA and adjusted to reflect the annualized impact of external growth; in the numerator taking into consideration the net financial indebtedness adjusted for the projects under development multiplied by the loan-to-value of the group (as these projects are not yet income contributing but already (partially) financed on the balance sheet). For associated companies only the dividends are taken into account.
| in euros (x 1,000) | 30.06.2026 | 31.12.2025 | ||||||||
| Non-current and current financial debt (IFRS) | 3,724,329 | 3,504,686 | ||||||||
| - Cash and cash equivalents (IFRS) | -19,634 | -14,786 | ||||||||
| Net debt (IFRS) | A | 3,704,695 | 3,489,900 | |||||||
| Operating result (before the result on the portfolio) (IFRS) (TTM)¹ | B | 435,662 | 413,518 | |||||||
| + Depreciation and write-down on solar panels | 9,083 | 11,449 | ||||||||
| + Share in the EPRA Earnings of joint ventures | 5,313 | 6,995 | ||||||||
| + Dividends received from associated companies | 5,385 | 4,976 | ||||||||
| EBITDA (IFRS) | C | 455,443 | 436,939 | |||||||
| Net debt / EBITDA | A/C | 8.1 | x | 8.0 | x | |||||
| in euros (x 1,000) | 30.06.2026 | 31.12.2025 | ||||||||
| Non-current and current financial debt (proportionate) | 3,772,942 | 3,580,067 | ||||||||
| - Cash and cash equivalents (proportionate) | -19,809 | -15,427 | ||||||||
| Net debt (proportional) | A | 3,753,133 | 3,564,640 | |||||||
| - Projects under development x Loan-to-value | -100,365 | -113,594 | ||||||||
| - Financing to joint ventures x Loan-to-value | -1,260 | -1,120 | ||||||||
| Net debt (proportional) (adjusted) | B | 3,651,508 | 3,449,926 | |||||||
| Operating result (before the result on the portfolio) (IFRS) (TTM)¹ | C | 435,662 | 413,518 | |||||||
| + Depreciation and write-down on solar panels | 9,083 | 11,449 | ||||||||
| + Operating result (before the result on the portfolio) of joint ventures (TTM)¹ | 7,951 | 10,260 | ||||||||
| + Dividends received from associated companies (TTM)¹ | 5,385 | 4,976 | ||||||||
| Operating result (before the result on the portfolio) (proportionate) (TTM)¹ | D | 458,081 | 440,203 | |||||||
| Adjustment for normalized EBITDA² | 18,145 | 17,536 | ||||||||
| EBITDA (proportionate) (adjusted) | E | 476,226 | 457,739 | |||||||
| Net debt / EBITDA (adjusted) | B/E | 7.7 | x | 7.5 | x | |||||
| 1 | For the calculation of this APM, it is assumed that the operating result (before the result on the portfolio) is a proxy for EBITDA. TTM stands for trailing 12 months and means that the calculation is based on financial figures for the past 12 months. |
| 2 | On a normalized basis and including the annualized impact of organic growth (such as indexation) and external growth (in function of realised disposals, acquisitions and projects). |
| Press release – 31 July 2026 | 100 |
4. Declarations
Joost Uwents, managing director and CEO, hereby declares on behalf of the Board of Directors, having taken all measures to ensure such, and to the best of his knowledge, that:
| ● | the condensed interim financial statements, drawn up as per the applicable standards for annual accounts, give a true and fair view of the group’s equity, financial position and the results of WDP, and of the companies included in the consolidation and that |
| ● | the interim report gives a faithful overview of the important events during the first six months of the current financial year, their effect on the condensed financial statements, the main risk factors and uncertainties for the remaining months of the financial year, and the main transactions between the related parties and their possible effect on the condensed financial statements should these transactions have or could have had material consequences for WDP’s financial position or results in the first six months of the current financial year. |
| Press release – 31 July 2026 | 101 |
X. Disclaimer
Warehouses De Pauw NV/SA, abbreviated WDP, having its registered office at Blakebergen 15, 1861 Wolvertem (Belgium), is a public regulated real estate company under Belgian law, incorporated under Belgian law and listed on Euronext.
This press release contains forward-looking information, forecasts, beliefs, opinions and estimates prepared by WDP, relating to the currently expected future performance of WDP and the market in which WDP operates (“forward-looking statements”). By their very nature, forward-looking statements involve inherent risks, uncertainties and assumptions, both general and specific, and risks exist that the forward-looking statements will not prove accurate. Investors should be aware that a number of important factors could cause actual results to differ materially from the plans, objectives, expectations, estimates and intentions expressed in, or implied by, such forward-looking statements. Such forward-looking statements are based on various hypotheses and assessments of known and unknown risks, uncertainties and other factors which seemed sound at the time they were made, but which may or may not prove to be accurate. Some events are difficult to predict and can depend on factors on which WDP has no control. Statements contained in this press release regarding past trends or activities should not be taken as a representation that such trends or activities will continue in the future.
This uncertainty is further increased due to financial, operational and regulatory risks and risks related to the economic outlook, which reduces the predictability of any declaration, forecast or estimate made by WDP. Consequently, the reality of earnings, financial situation, performance or achievements of WDP may prove substantially different from the guidance regarding the future earnings, financial situation, performance or achievements set out in, or implied by, such forward-looking statements. Given these uncertainties, investors are advised not to place undue reliance on these forward-looking statements. Additionally, the forward-looking statements only apply on the date of this press release. WDP expressly disclaims any obligation or undertaking, unless if required by applicable law, it must release any update or revision in respect of any forward-looking statement, to reflect any changes in its expectations or any change in the events, conditions, assumptions, or circumstances on which such forward-looking statements are based. Neither WDP, nor its representatives, officers, or advisors, guarantee that the assumptions underlying the forward-looking statements are free from errors, and neither do they make any representation, warranty, or prediction that the results anticipated by such forward-looking statements will be achieved.
| Press release – 31 July 2026 | 102 |
More information
| WDP SA | Joost Uwents – CEO |
| Blakebergen 15 | Mickael Van den Hauwe – CFO |
| B 1861 Wolvertem | Alexander Makar – Head of IR & Capital markets |
| www.wdp.eu | investorrelations@wdp.eu |
WDP develops and invests in logistics real estate (warehouses and offices). WDP’s property portfolio comprises circa 9 million m². This international portfolio of semi-industrial and logistics buildings is spread over around 350 sites at prime logistics locations for storage and distribution in Belgium, the Netherlands, France, Luxembourg, Germany and Romania.
WDP NV/SA – BE-REIT (public regulated real estate company under Belgian law) Company number 0417.199.869 (RPR Brussels, Dutch-speaking section)
WDP is listed on Euronext Brussels (BEL 20) and Amsterdam (AEX) and is, among other things, part of the European Real Estate Association (EPRA), MSCI, STOXX, and the Dow Jones Sustainability Index (DJSI).

FOLLOW US

| Press release – 31 July 2026 | 103 |