Exhibit 99.8
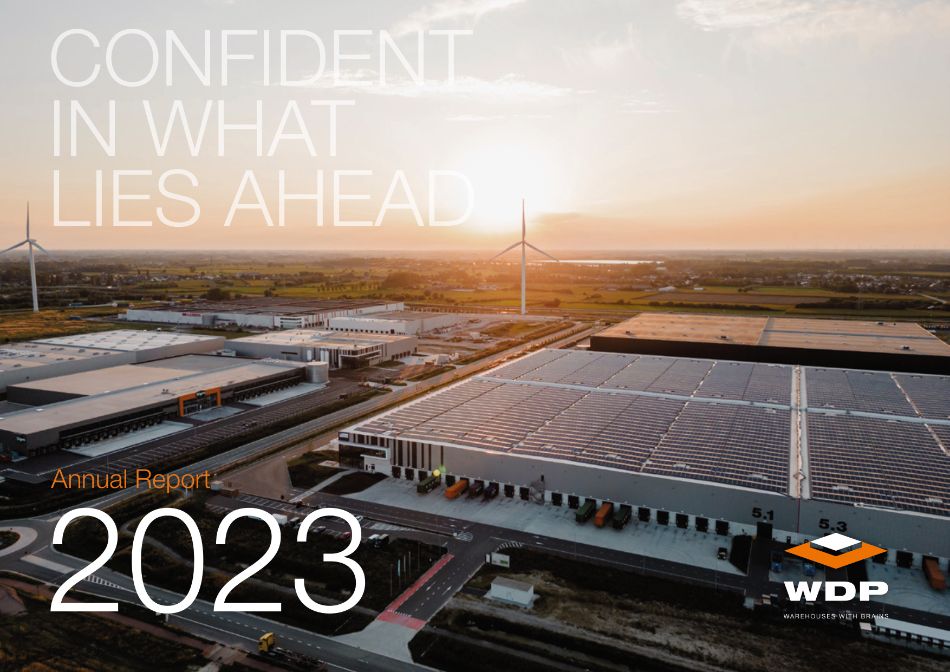
CONFIDENT IN WHAT LIES AHEAD 2023 Annual Report

WDP is a leading real-estate specialist operating in core locations along key logistics axes in six European regions. WDP follows a pure player strategy and relies on in-house expertise and local presence to acquire, develop and lease a wide range of sustainable logistics properties that accommodate its client's supply chain activities. WDP is listed on Euronext Brussels (BEL 20) and Amsterdam (AMX) and is part of the European Real Estate Association (EPRA) and the Dow Jones Sustainability Index (DJSI). WDP NV/SA has REIT status and is subject to the prudential supervision of the FSMA.
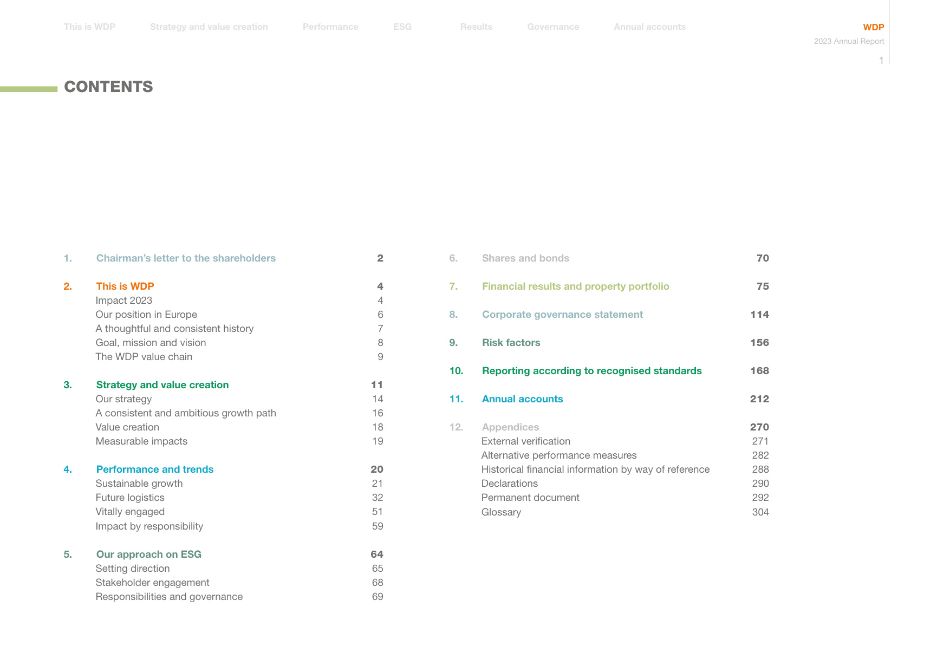
1. Chairman's letter to the shareholders 2 2. This is WDP 4 Impact 2023 4 Our position in Europe 6 A thoughtful and consistent history 7 Goal, mission and vision 8 The WDP value chain 9 3. Strategy and value creation 11 Our strategy 14 A consistent and ambitious growth path 16 Value creation 18 Measurable impacts 19 4. Performance and trends 20 Sustainable growth 21 Future logistics 32 Vitally engaged 51 Impact by responsibility 59 5. Our approach on ESG 64 Setting direction 65 Stakeholder engagement 68 Responsibilities and governance 69 6. Shares and bonds 70 7. Financial results and property portfolio 75 8. Corporate governance statement 114 9. Risk factors 156 10. Reporting according to recognised standards 168 11. Annual accounts 212 12. Appendices 270 External verification 271 Alternative performance measures 282 Historical financial information by way of reference 288 Declarations 290 Permanent document 292 Glossary 304 CONTENTS Annual accounts Governance Results Performance Strategy and value creation This is WDP ESG WDP 2023 Annual Report 1
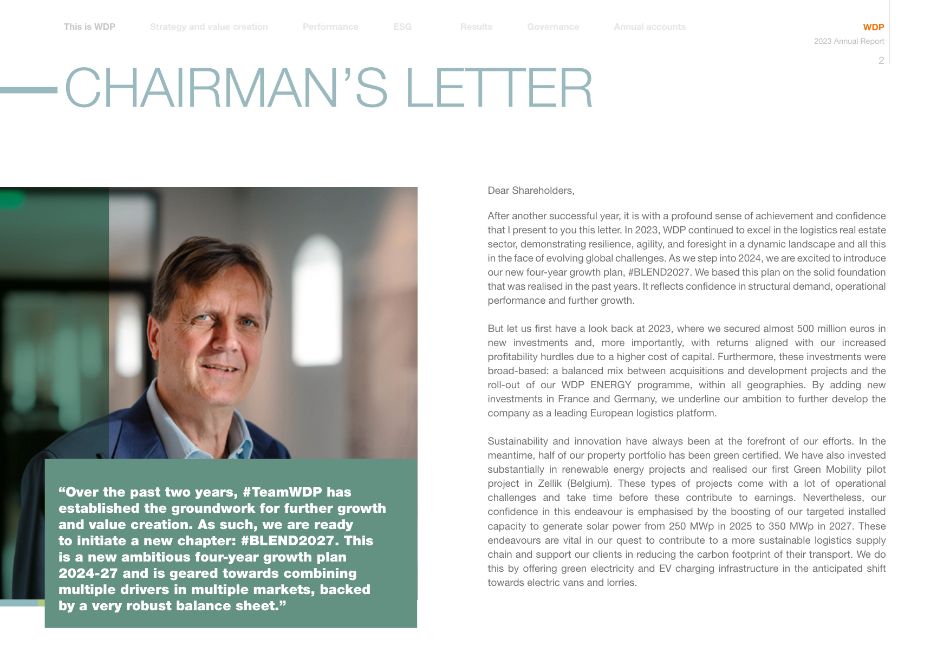
Dear Shareholders, After another successful year, it is with a profound sense of achievement and confidence that I present to you this letter. In 2023, WDP continued to excel in the logistics real estate sector, demonstrating resilience, agility, and foresight in a dynamic landscape and all this in the face of evolving global challenges. As we step into 2024, we are excited to introduce our new four-year growth plan, #BLEND2027. We based this plan on the solid foundation that was realised in the past years. It reflects confidence in structural demand, operational performance and further growth. But let us first have a look back at 2023, where we secured almost 500 million euros in new investments and, more importantly, with returns aligned with our increased profitability hurdles due to a higher cost of capital. Furthermore, these investments were broad-based: a balanced mix between acquisitions and development projects and the roll-out of our WDP ENERGY programme, within all geographies. By adding new investments in France and Germany, we underline our ambition to further develop the company as a leading European logistics platform. Sustainability and innovation have always been at the forefront of our efforts. In the meantime, half of our property portfolio has been green certified. We have also invested substantially in renewable energy projects and realised our first Green Mobility pilot project in Zellik (Belgium). These types of projects come with a lot of operational challenges and take time before these contribute to earnings. Nevertheless, our confidence in this endeavour is emphasised by the boosting of our targeted installed capacity to generate solar power from 250 MWp in 2025 to 350 MWp in 2027. These endeavours are vital in our quest to contribute to a more sustainable logistics supply chain and support our clients in reducing the carbon footprint of their transport. We do this by offering green electricity and EV charging infrastructure in the anticipated shift towards electric vans and lorries. "Over the past two years, #TeamWDP has established the groundwork for further growth and value creation. As such, we are ready to initiate a new chapter: #BLEND2027. This is a new ambitious four-year growth plan 2024-27 and is geared towards combining multiple drivers in multiple markets, backed by a very robust balance sheet." Annual accounts Governance Results Performance Strategy and value creation This is WDP ESG WDP 2023 Annual Report 2 CHAIRMAN'S LETTER
The year 2023 showcased solid performance in financial metrics, yet again. Our EPRA Earnings have seen a solid increase with +12% on a per share basis. This reflects the strength of our operational model with a high occupancy rate, inflation-linked revenues, and a fully hedged debt book. This combination will play a pivotal role in the delivery of continuous growth in earnings per share. The trust and confidence of our investors have been paramount in safeguarding a robust balance sheet. This was highlighted by the 300 million euros through the ABB (accelerated book build) that we realised in November 2023, and which was five times oversubscribed. Our strong balance sheet will allow us to navigate through the complex and volatile economic environment effectively and to continue investing in our future. In the new economic cycle of the last two years, WDP has been challenged in its growth targets by a higher cost of capital, high inflation, elevated construction costs, increased complexity, and lead time for development projects. Nevertheless, with our target EPRA Earnings per share of 1.47 euros in 2024, we managed to get our ambitious long-term earnings target of 1.50 euros per share in 2025 in sight one year ahead of target thanks to our agile profile and our permanent focus on financial discipline combined with strict capital allocation and profitability. Our persistent performance, combined with the robust structural long-term drivers that steer demand within the logistics sector, forms the ideal basis for future value creation and supports our confidence in what lies ahead, despite today's challenging environment. So, it is the ideal opportunity to introduce a new four-year growth plan, #BLEND2027. WDP formulated this multi-year plan to harmoniously blend multiple drivers to achieve earnings growth across all dimensions of our operations and geographical presence: developments, acquisitions, internal growth and energy solutions within our existing core markets and further deployment of operations in France and Germany. This plan is a blueprint for continued excellence. We aim to increase our EPRA Earnings per share by +6% on an underlying basis, targeting 1.70 euros by 2027. This ambitious plan is built on the strong foundation of an industry-leading balance sheet and strong liquidity and cash flow making the plan fully funded in advance. The partnership with our clients and shareholders, and the unwavering support of our team, form the cornerstone of our success. Our DNA that puts entrepreneurship and client centricity at the heart of our business will continue to make a difference. We are dedicated to supporting our clients by further building the critical infrastructure for their supply chain. And to deliver shareholder value through consistent growth in earnings per share. All this while maintaining a robust financial position. I thank you for your continued trust and support in WDP. Together, we are shaping a future that is focused on our client needs, profitable, responsible, and aligned with our sustainable values. Rik Vandenberghe Chairman of the Board of Directors " I am very proud of our teams that navigate the WDP ship so well through these turbulent times, achieving great results, further growing our company and maintaining financial discipline. By decisively acting on what we can control rather than hoping for what may (or may not) occur, we are in an excellent position to further create value in different macroeconomic scenarios. Annual accounts Governance Results Performance Strategy and value creation This is WDP ESG WDP 2023 Annual Report 3
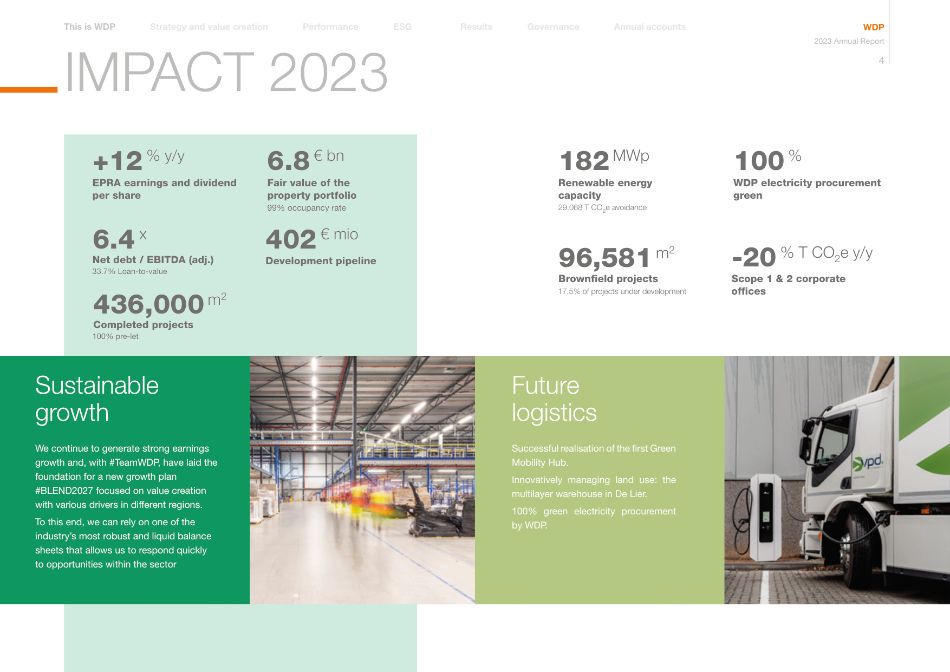
29,068 T CO2e avoidance 182 MWp Renewable energy capacity 17.5% of projects under development 96,581 m2 Brownfield projects IMPACT 2023 We continue to generate strong earnings growth and, with #TeamWDP, have laid the foundation for a new growth plan #BLEND2027 focused on value creation with various drivers in different regions. To this end, we can rely on one of the industry's most robust and liquid balance sheets that allows us to respond quickly to opportunities within the sector Successful realisation of the first Green Mobility Hub. Innovatively managing land use: the multilayer warehouse in De Lier. 100% green electricity procurement by WDP. Sustainable growth Future logistics 100 % WDP electricity procurement green -20 % T CO2e y/y Scope 1 & 2 corporate offices +12 % y/y EPRA earnings and dividend per share 402 € mio Development pipeline 6.8 € bn Fair value of the property portfolio 99% occupancy rate 6.4 x Net debt / EBITDA (adj.) 33.7% Loan-to-value 436,000 m2 Completed projects 100% pre-let Annual accounts Governance Results Performance Strategy and value creation This is WDP ESG WDP 2023 Annual Report 4
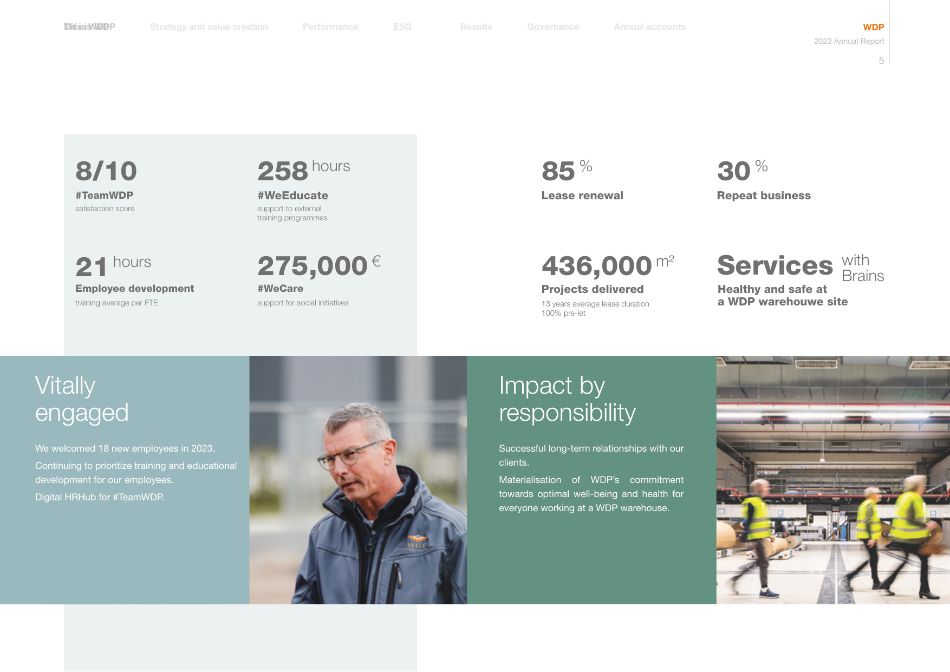
satisfaction score 8/10 85 % #TeamWDP Lease renewal support to external training programmes 258 hours #WeEducate 30 % Repeat business 21 hours Employee development training average per FTE 436,000 m² Projects delivered 275,000 € #WeCare support for social initiatives 13 years average lease duration 100% pre-let We welcomed 18 new employees in 2023. Continuing to prioritize training and educational development for our employees. Digital HRHub for #TeamWDP. Successful long-term relationships with our clients. Materialisation of WDP's commitment towards optimal well-being and health for everyone working at a WDP warehouse. Vitally engaged Impact by responsibility Healthy and safe at a WDP warehouwe site Services with Brains Annual accounts Governance Results Performance Strategy and value creation This is WDP ESG WDP 2023 Annual Report 5 Dit is WDP
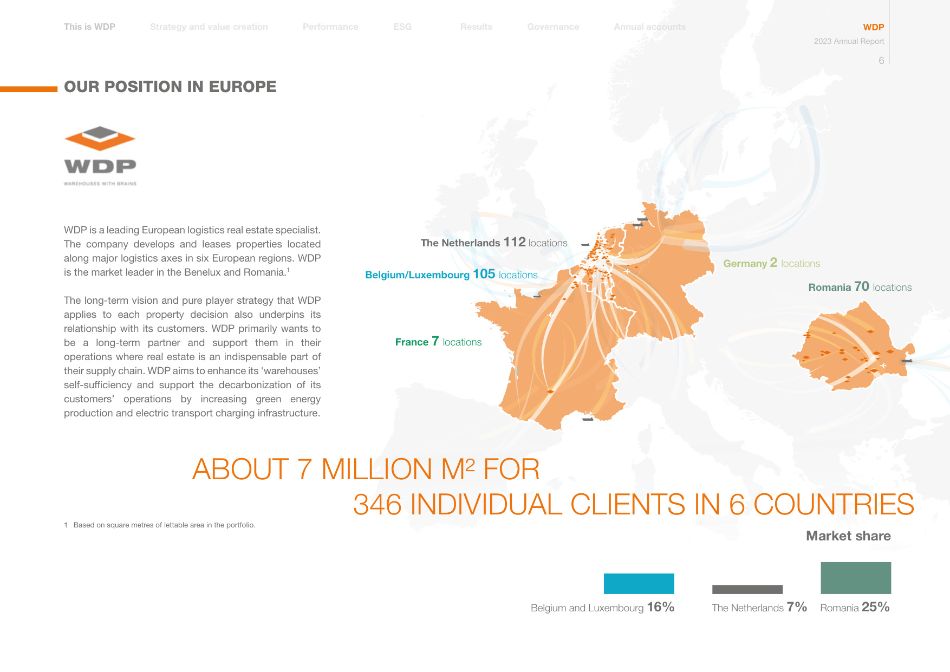
WDP is a leading European logistics real estate specialist. The company develops and leases properties located along major logistics axes in six European regions. WDP is the market leader in the Benelux and Romania.1 The long-term vision and pure player strategy that WDP applies to each property decision also underpins its relationship with its customers. WDP primarily wants to be a long-term partner and support them in their operations where real estate is an indispensable part of their supply chain. WDP aims to enhance its 'warehouses' self-sufficiency and support the decarbonization of its customers' operations by increasing green energy production and electric transport charging infrastructure. 1 Based on square metres of lettable area in the portfolio. ABOUT 7 MILLION M² FOR 346 INDIVIDUAL CLIENTS IN 6 COUNTRIES The Netherlands 112 locations Belgium/Luxembourg 105 locations Germany 2 locations Romania 70 locations France 7 locations Belgium and Luxembourg 16% Market share The Netherlands 7% Romania 25% OUR POSITION IN EUROPE Annual accounts Governance Results Performance Strategy and value creation This is WDP ESG WDP 2023 Annual Report 6
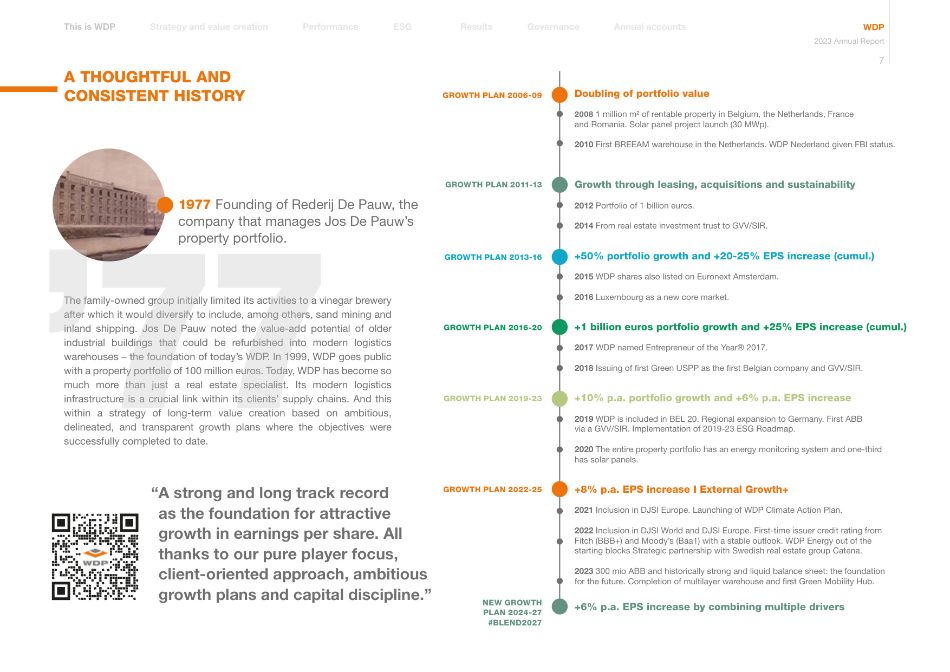
A THOUGHTFUL AND CONSISTENT HISTORY 1977 Founding of Rederij De Pauw, the company that manages Jos De Pauw's property portfolio. Doubling of portfolio value 2008 1 million m² of rentable property in Belgium, the Netherlands, France and Romania. Solar panel project launch (30 MWp). 2010 First BREEAM warehouse in the Netherlands. WDP Nederland given FBI status. Growth through leasing, acquisitions and sustainability 2012 Portfolio of 1 billion euros. 2014 From real estate investment trust to GVV/SIR. +50% portfolio growth and +20-25% EPS increase (cumul.) 2015 WDP shares also listed on Euronext Amsterdam. 2016 Luxembourg as a new core market. +1 billion euros portfolio growth and +25% EPS increase (cumul.) 2017 WDP named Entrepreneur of the Year® 2017. 2018 Issuing of first Green USPP as the first Belgian company and GVV/SIR. +10% p.a. portfolio growth and +6% p.a. EPS increase 2019 WDP is included in BEL 20. Regional expansion to Germany. First ABB via a GVV/SIR. Implementation of 2019-23 ESG Roadmap. 2020 The entire property portfolio has an energy monitoring system and one-third has solar panels. +8% p.a. EPS increase I External Growth+ 2021 Inclusion in DJSI Europe. Launching of WDP Climate Action Plan. 2022 Inclusion in DJSI World and DJSI Europe. First-time issuer credit rating from Fitch (BBB+) and Moody's (Baa1) with a stable outlook. WDP Energy out of the starting blocks Strategic partnership with Swedish real estate group Catena. 2023 300 mio ABB and historically strong and liquid balance sheet: the foundation for the future. Completion of multilayer warehouse and first Green Mobility Hub. +6% p.a. EPS increase by combining multiple drivers GROWTH PLAN 2006-09 GROWTH PLAN 2011-13 GROWTH PLAN 2013-16 GROWTH PLAN 2016-20 GROWTH PLAN 2019-23 GROWTH PLAN 2022-25 The family-owned group initially limited its activities to a vinegar brewery after which it would diversify to include, among others, sand mining and inland shipping. Jos De Pauw noted the value-add potential of older industrial buildings that could be refurbished into modern logistics warehouses – the foundation of today's WDP. In 1999, WDP goes public with a property portfolio of 100 million euros. Today, WDP has become so much more than just a real estate specialist. Its modern logistics infrastructure is a crucial link within its clients' supply chains. And this within a strategy of long-term value creation based on ambitious, delineated, and transparent growth plans where the objectives were successfully completed to date. "A strong and long track record as the foundation for attractive growth in earnings per share. All thanks to our pure player focus, client-oriented approach, ambitious growth plans and capital discipline." NEW GROWTH PLAN 2024-27 #BLEND2027 Annual accounts Governance Results Performance Strategy and value creation This is WDP ESG WDP 2023 Annual Report 7
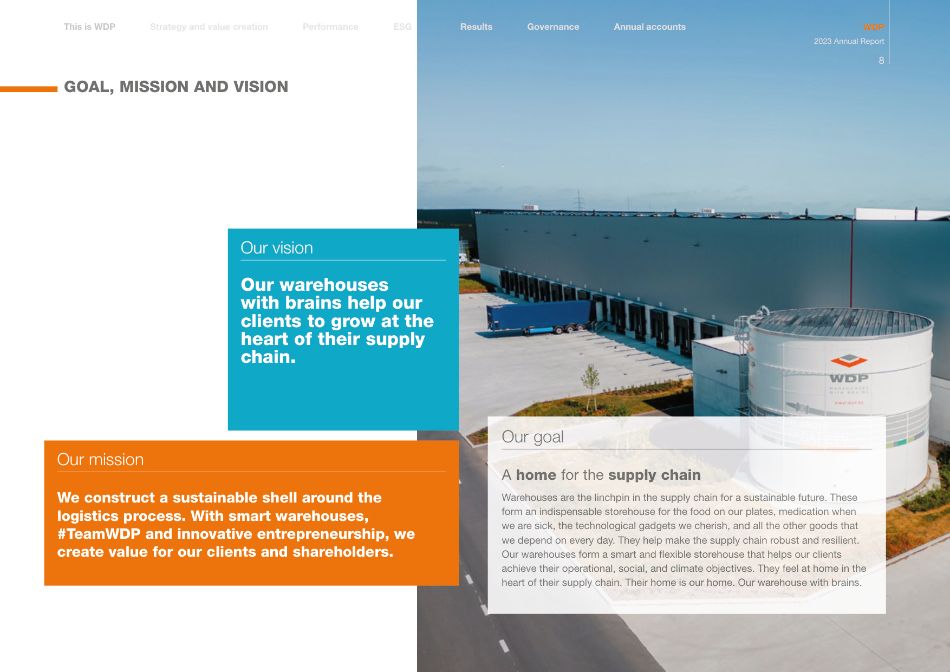
Our vision Our warehouses with brains help our clients to grow at the heart of their supply chain. Our mission We construct a sustainable shell around the logistics process. With smart warehouses, #TeamWDP and innovative entrepreneurship, we create value for our clients and shareholders. Our goal A home for the supply chain Warehouses are the linchpin in the supply chain for a sustainable future. These form an indispensable storehouse for the food on our plates, medication when we are sick, the technological gadgets we cherish, and all the other goods that we depend on every day. They help make the supply chain robust and resilient. Our warehouses form a smart and flexible storehouse that helps our clients achieve their operational, social, and climate objectives. They feel at home in the heart of their supply chain. Their home is our home. Our warehouse with brains. GOAL, MISSION AND VISION Performance Strategy and value creation This is WDP ESG Annual accounts Governance Results WDP 2023 Annual Report 8
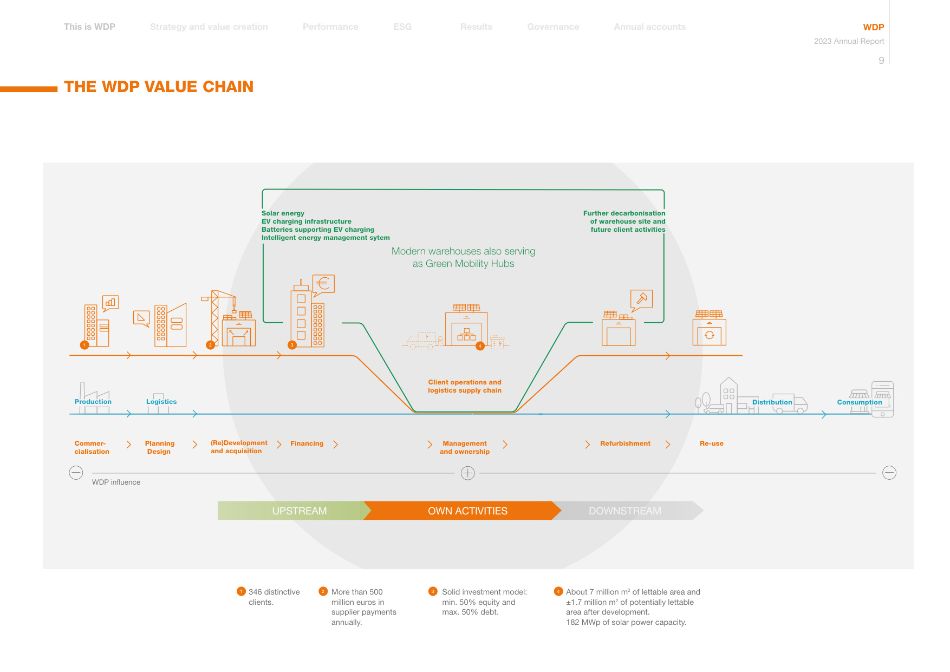
THE WDP VALUE CHAIN WDP influence Client operations and logistics supply chain Planning Design Management and ownership Refurbishment Re-use Production Logistics Financing (Re)Development and acquisition Commer- cialisation 4 Modern warehouses also serving as Green Mobility Hubs 1 2 3 DOWNSTREAM OWN ACTIVITIES UPSTREAM 346 distinctive clients. More than 500 million euros in supplier payments annually. Solid investment model: min. 50% equity and max. 50% debt. About 7 million m2 of lettable area and ±1.7 million m2 of potentially lettable area after development. 182 MWp of solar power capacity. 1 2 3 4 Distribution Consumption Solar energy EV charging infrastructure Batteries supporting EV charging Intelligent energy management sytem Further decarbonisation of warehouse site and future client activities Annual accounts Governance Results Performance Strategy and value creation This is WDP ESG WDP 2023 Annual Report 9
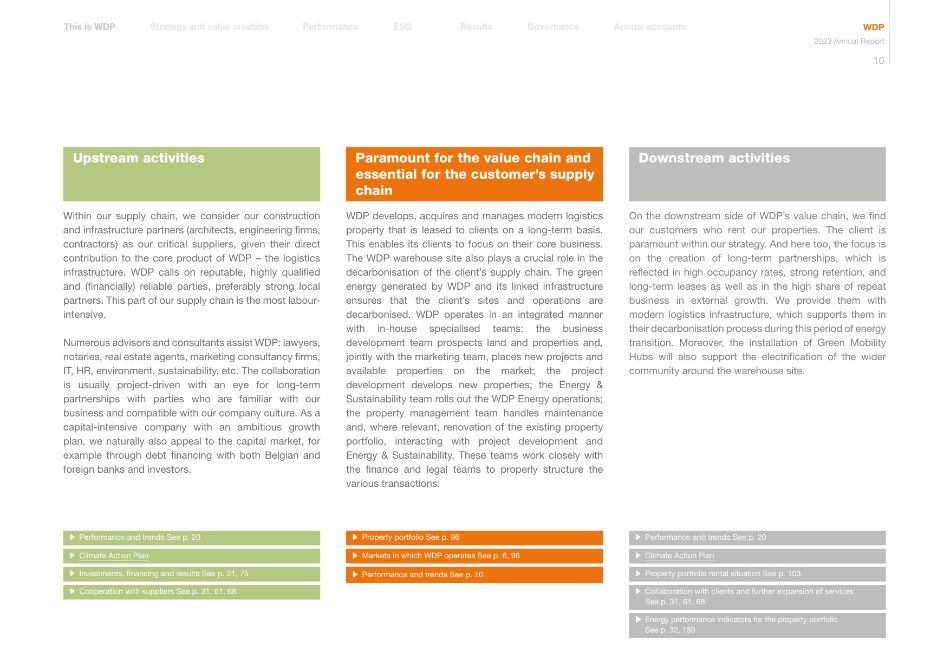
Paramount for the value chain and essential for the customer's supply chain WDP develops, acquires and manages modern logistics property that is leased to clients on a long-term basis. This enables its clients to focus on their core business. The WDP warehouse site also plays a crucial role in the decarbonisation of the client's supply chain. The green energy generated by WDP and its linked infrastructure ensures that the client's sites and operations are decarbonised. WDP operates in an integrated manner with in-house specialised teams: the business development team prospects land and properties and, jointly with the marketing team, places new projects and available properties on the market; the project development develops new properties; the Energy & Sustainability team rolls out the WDP Energy operations; the property management team handles maintenance and, where relevant, renovation of the existing property portfolio, interacting with project development and Energy & Sustainability. These teams work closely with the finance and legal teams to properly structure the various transactions. Upstream activities Within our supply chain, we consider our construction and infrastructure partners (architects, engineering firms, contractors) as our critical suppliers, given their direct contribution to the core product of WDP – the logistics infrastructure. WDP calls on reputable, highly qualified and (financially) reliable parties, preferably strong local partners. This part of our supply chain is the most labour- intensive. Numerous advisors and consultants assist WDP: lawyers, notaries, real estate agents, marketing consultancy firms, IT, HR, environment, sustainability, etc. The collaboration is usually project-driven with an eye for long-term partnerships with parties who are familiar with our business and compatible with our company culture. As a capital-intensive company with an ambitious growth plan, we naturally also appeal to the capital market, for example through debt financing with both Belgian and foreign banks and investors. Downstream activities On the downstream side of WDP's value chain, we find our customers who rent our properties. The client is paramount within our strategy. And here too, the focus is on the creation of long-term partnerships, which is reflected in high occupancy rates, strong retention, and long-term leases as well as in the high share of repeat business in external growth. We provide them with modern logistics infrastructure, which supports them in their decarbonisation process during this period of energy transition. Moreover, the installation of Green Mobility Hubs will also support the electrification of the wider community around the warehouse site. Performance and trends See p. 20 Climate Action Plan Property portfolio rental situation See p. 103 Collaboration with clients and further expansion of services See p. 31, 61, 68 Energy performance indicators for the property portfolio See p. 32, 189 Property portfolio See p. 96 Markets in which WDP operates See p. 6, 96 – Performance and trends See p. 20 Performance and trends See p. 20 Climate Action Plan Investments, financing and results See p. 21, 75 Cooperation with suppliers See p. 31, 61, 68 Annual accounts Governance Results Performance Strategy and value creation This is WDP ESG WDP 2023 Annual Report 10

03 STRATEGY AND VALUE CREATION
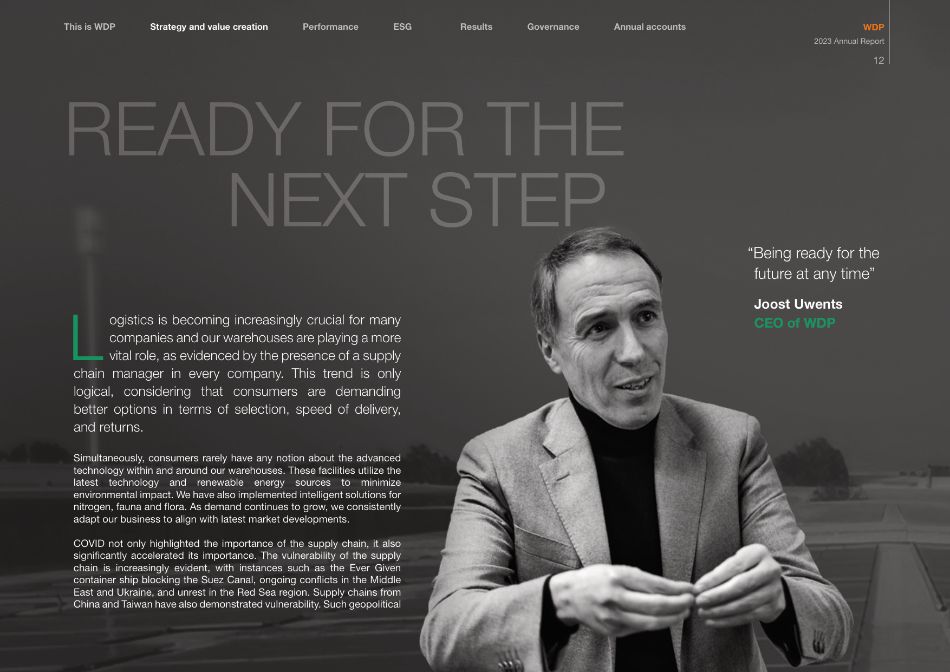
L ogistics is becoming increasingly crucial for many companies and our warehouses are playing a more vital role, as evidenced by the presence of a supply chain manager in every company. This trend is only logical, considering that consumers are demanding better options in terms of selection, speed of delivery, and returns. Simultaneously, consumers rarely have any notion about the advanced technology within and around our warehouses. These facilities utilize the latest technology and renewable energy sources to minimize environmental impact. We have also implemented intelligent solutions for nitrogen, fauna and flora. As demand continues to grow, we consistently adapt our business to align with latest market developments. COVID not only highlighted the importance of the supply chain, it also significantly accelerated its importance. The vulnerability of the supply chain is increasingly evident, with instances such as the Ever Given container ship blocking the Suez Canal, ongoing conflicts in the Middle East and Ukraine, and unrest in the Red Sea region. Supply chains from China and Taiwan have also demonstrated vulnerability. Such geopolitical READY FOR THE NEXT STEP "Being ready for the future at any time" Joost Uwents CEO of WDP Annual accounts Governance Results Performance Strategy and value creation This is WDP ESG WDP 2023 Annual Report 12
"In essence, we continue to follow the same principles laid out by our founder, Jos De Pauw. As an industrialist, he delved deeply into understanding how to help its clients grow." developments have a major impact on supply dynamics and the global economy. We note that after decades of increasing and refining globalisation, our clients now want to mitigate risk by engaging in a process of continentalisation, where certain stages of the production process occur locally. And this is exactly what WDP has anticipated for some time now, through our operations in Romania amongst others. Rich history and future Picture us as successors to the merchants of Flanders and the Netherlands, who flourished in the 16th and 17th centuries by trading goods from around the world in staple markets. Even back then, extensive logistics and real estate expertise was required, in addition to a large network and capital. WDP is an entrepreneurial real estate company. In essence, we continue to follow the same principles laid out by our founder, Jos De Pauw. As an industrialist, he delved deeply into understanding how to help its clients grow. His success arose from acquiring old factories, repurposing these for storage and then investing to improve quality. While our approach remains true to his principles, we operate on a much larger scale today. We have been listed since 1999. Starting out 25 years ago with 200 thousand square metres, our portfolio has grown since to 7 million square metres. With an annual investment of approximately 500 million euros, we now employ 125 people, compared to just four employees in 1999. Meanwhile, we manage a balance sheet value of 7 billion euros and our footprint extends across Belgium, the Netherlands, Luxembourg, Germany, France and Romania. Our warehouses and their vicinity provide work for many, many thousands of people. Higher interest After 25 years of continuously lower interest rates, we are faced with a higher interest rate environment, which has huge consequences on the real estate market. Capital is our raw material, yet passing on these heightened costs proves to be challenging. At its turn, everyone awaits for the situation to stabilise. And that takes time, time which WDP can outwait. We can continue to support our clients with our solid balance sheet and excellent liquidity. This enables expanding our buildings for improved sustainability, with automation, with green energy solutions and equipped with other smart logistics investments. We have continued access to capital to capture opportunities and create value with clients and shareholders. Navigating future opportunities is both enjoyable and crucial. However, we never lose sight of the value of our existing portfolio and existing clients. Moreover, we believe creating value goes beyond handing over the key. We continue to serve our clients' growth requirements by ensuring that their businesses can operate seamlessly around the clock. Looking ahead In the longer term, we anticipate further convergence in economic traffic. The places where we work, live, store goods and consume, combined with the scarcity of land, will become intertwined. Our warehouses will all become increasingly efficient and smarter thanks to technology and enhanced automation and machinery. Automation and e-transportation will play pivotal roles in shaping a new flow of goods which will become more sustainable. Over time, I anticipate a shift towards more sustainable goods consumption, leading to reduced waste from consumers. Buildings will also become even greener both in construction and energy supply. This transition will be a collaborative effort between our company and our stakeholders, including our contractors. We are fully prepared and ready for this transition. Annual accounts Governance Results Performance Strategy and value creation This is WDP ESG WDP 2023 Annual Report 13
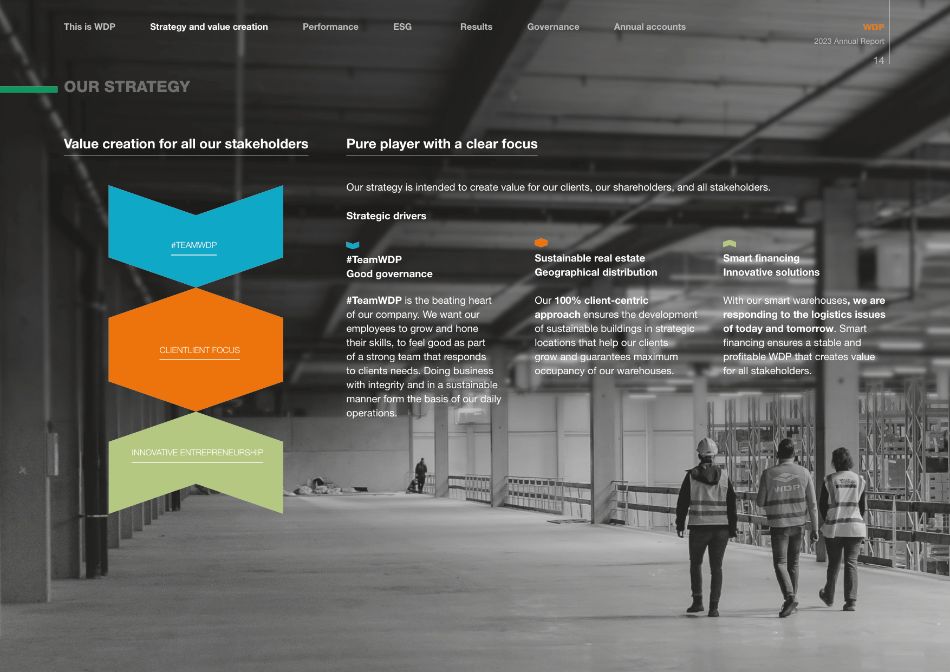
OUR STRATEGY Pure player with a clear focus Our strategy is intended to create value for our clients, our shareholders, and all stakeholders. Strategic drivers #TeamWDP Good governance #TeamWDP is the beating heart of our company. We want our employees to grow and hone their skills, to feel good as part of a strong team that responds to clients needs. Doing business with integrity and in a sustainable manner form the basis of our daily operations. Sustainable real estate Geographical distribution Our 100% client-centric approach ensures the development of sustainable buildings in strategic locations that help our clients grow and guarantees maximum occupancy of our warehouses. Smart financing Innovative solutions With our smart warehouses, we are responding to the logistics issues of today and tomorrow. Smart financing ensures a stable and profitable WDP that creates value for all stakeholders. Value creation for all our stakeholders INNOVATIVE ENTREPRENEURSHIP CLIENTLIENT FOCUS #TEAMWDP Annual accounts Governance Results Performance Strategy and value creation This is WDP ESG WDP 2023 Annual Report 14
#TeamWDP It is important that our members of employees feel good and appreciated and get the opportunity to develop their talents. WDP strives to promote the skills of its employees to facilitate a sustainable and dedicated team and to build capacity and continuity. #TeamWDP's entrepreneurship combined with short, fast decision-making lines and the flat structure providing room for innovation, ensure a dynamic cooperation. #TeamWDP is the anchor point throughout the entire process: after the commercial team has drawn up the outlines of the lease agreement, the buildings are developed under the guidance of experienced project managers and in collaboration with team Energy & Sustainability, after which the property managers relieve the client of the burden of managing them. WDP also maintains firm control over its financial, accounting, and legal affairs. Good governance Conducting business fairly and with integrity, open communication and transparent reporting ensure responsible business practices that balance the interests of different stakeholders and the community. Sustainable real estate WDP provides a solution to the demand for modern, intelligent storage facilities with an eye for sustainability. The client wants an energy-efficient (and therefore cost- reducing) location that is strategically embedded to promote an optimal flow of goods. WDP offers a diverse portfolio of sustainable and high-end buildings that meet the needs of the industry and are suitable for warehousing, XXL distribution manufacturing, cross-docking, high-bay, urban logistics, etc. WDP ENERGY will use increased green energy production and the linked infrastructure to make its sites more self-sufficient and decarbonise client operations. Geographical distribution WDP sites are always chosen based on their strategic location, for example, in the immediate vicinity of storage and distribution hubs and/or multimodal transport facilities. The majority of properties are located in the economic heart of north-western Europe, in the hinterland of the ports of Amsterdam, Rotterdam, Bremen and Hamburg - the import and export gateways of Europe. The properties are spread along the Amsterdam- Rotterdam-Breda-Antwerp-Brussels-Lille logistics axis and extend to Germany. In Central Europe, WDP is active in Romania, which serves as a gateway for supplying South-Eastern Europe. Smart financing A healthy mix of equity and debt is used to finance real estate investments. The goal is to synchronise the issuance of new capital and the taking on of external green financing. This is how the rhythm of investment is followed by the rhythm of financing. By reserving a portion of earnings, we create a financial buffer for the future and these funds can be reinvested in the further growth of WDP. Innovative solutions The development of a new building or lease of an existing location is preceded by an analysis of the client and its activities, and in close consultation we arrive at a suitable real-estate solution. Jointly reflecting with the client implies being open to and leading the way with innovative solutions regarding location, the type of building, goods flows, technology, production of renewable energy, etc. Annual accounts Governance Results Performance Strategy and value creation This is WDP ESG WDP 2023 Annual Report 15
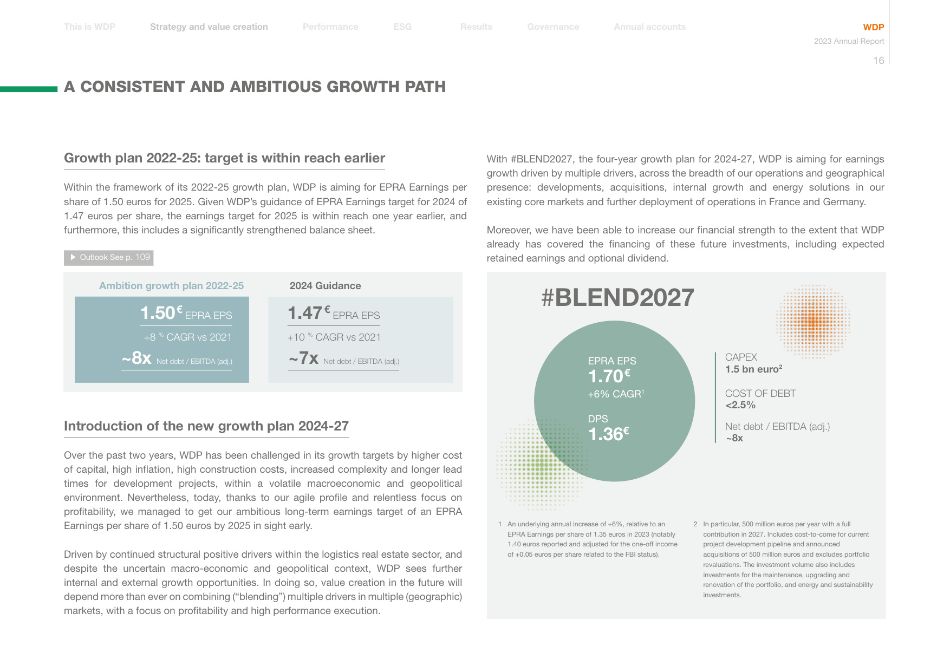
A CONSISTENT AND AMBITIOUS GROWTH PATH Growth plan 2022-25: target is within reach earlier Within the framework of its 2022-25 growth plan, WDP is aiming for EPRA Earnings per share of 1.50 euros for 2025. Given WDP's guidance of EPRA Earnings target for 2024 of 1.47 euros per share, the earnings target for 2025 is within reach one year earlier, and furthermore, this includes a significantly strengthened balance sheet. Outlook See p. 109 1.50€ EPRA EPS +8 % CAGR vs 2021 Ambition growth plan 2022-25 2024 Guidance ~8x Net debt / EBITDA (adj.) 1.5 bn euro2 CAPEX <2.5% COST OF DEBT ~8x Net debt / EBITDA (adj.) 1 An underlying annual increase of +6%, relative to an EPRA Earnings per share of 1.35 euros in 2023 (notably 1.40 euros reported and adjusted for the one-off income of +0.05 euros per share related to the FBI status). 2 In particular, 500 million euros per year with a full contribution in 2027. Includes cost-to-come for current project development pipeline and announced acquisitions of 500 million euros and excludes portfolio revaluations. The investment volume also includes investments for the maintenance, upgrading and renovation of the portfolio, and energy and sustainability investments. 1.47 € EPRA EPS +10 % CAGR vs 2021 ~7x Net debt / EBITDA (adj.) DPS 1.36€ EPRA EPS 1.70€ +6% CAGR1 #BLEND2027 With #BLEND2027, the four-year growth plan for 2024-27, WDP is aiming for earnings growth driven by multiple drivers, across the breadth of our operations and geographical presence: developments, acquisitions, internal growth and energy solutions in our existing core markets and further deployment of operations in France and Germany. Moreover, we have been able to increase our financial strength to the extent that WDP already has covered the financing of these future investments, including expected retained earnings and optional dividend. Introduction of the new growth plan 2024-27 Over the past two years, WDP has been challenged in its growth targets by higher cost of capital, high inflation, high construction costs, increased complexity and longer lead times for development projects, within a volatile macroeconomic and geopolitical environment. Nevertheless, today, thanks to our agile profile and relentless focus on profitability, we managed to get our ambitious long-term earnings target of an EPRA Earnings per share of 1.50 euros by 2025 in sight early. Driven by continued structural positive drivers within the logistics real estate sector, and despite the uncertain macro-economic and geopolitical context, WDP sees further internal and external growth opportunities. In doing so, value creation in the future will depend more than ever on combining ("blending") multiple drivers in multiple (geographic) markets, with a focus on profitability and high performance execution. Annual accounts Governance Results Performance Strategy and value creation This is WDP ESG WDP 2023 Annual Report 16
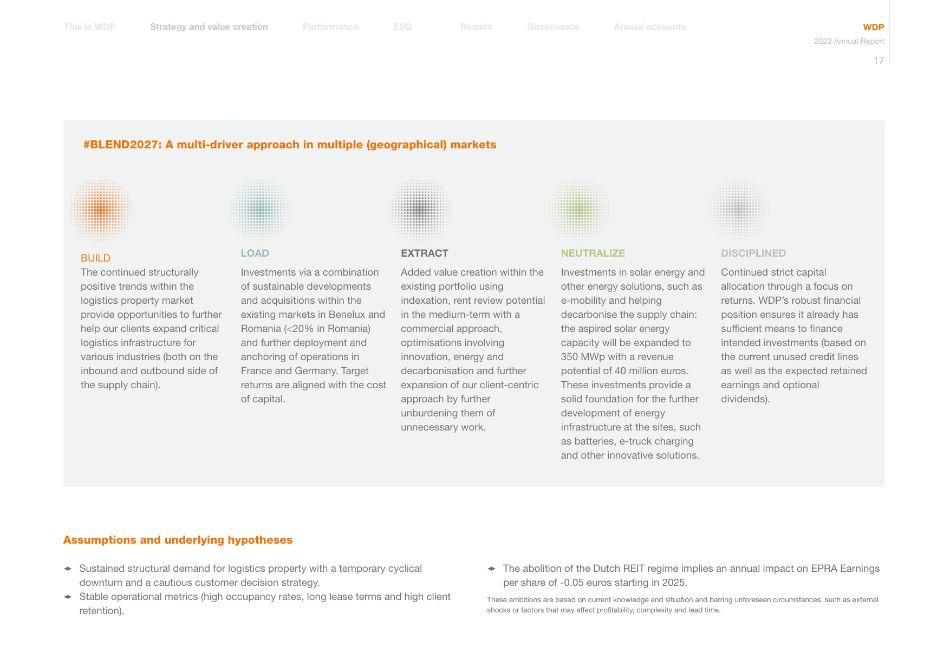
#BLEND2027: A multi-driver approach in multiple (geographical) markets Assumptions and underlying hypotheses 1 Sustained structural demand for logistics property with a temporary cyclical downturn and a cautious customer decision strategy. 1 Stable operational metrics (high occupancy rates, long lease terms and high client retention). 1 The abolition of the Dutch REIT regime implies an annual impact on EPRA Earnings per share of -0.05 euros starting in 2025. These ambitions are based on current knowledge and situation and barring unforeseen circumstances, such as external shocks or factors that may affect profitability, complexity and lead time. BUILD The continued structurally positive trends within the logistics property market provide opportunities to further help our clients expand critical logistics infrastructure for various industries (both on the inbound and outbound side of the supply chain). LOAD Investments via a combination of sustainable developments and acquisitions within the existing markets in Benelux and Romania (<20% in Romania) and further deployment and anchoring of operations in France and Germany. Target returns are aligned with the cost of capital. EXTRACT Added value creation within the existing portfolio using indexation, rent review potential in the medium-term with a commercial approach, optimisations involving innovation, energy and decarbonisation and further expansion of our client-centric approach by further unburdening them of unnecessary work. NEUTRALIZE Investments in solar energy and other energy solutions, such as e-mobility and helping decarbonise the supply chain: the aspired solar energy capacity will be expanded to 350 MWp with a revenue potential of 40 million euros. These investments provide a solid foundation for the further development of energy infrastructure at the sites, such as batteries, e-truck charging and other innovative solutions. DISCIPLINED Continued strict capital allocation through a focus on returns. WDP's robust financial position ensures it already has sufficient means to finance intended investments (based on the current unused credit lines as well as the expected retained earnings and optional dividends). Annual accounts Governance Results Performance Strategy and value creation This is WDP ESG WDP 2023 Annual Report 17
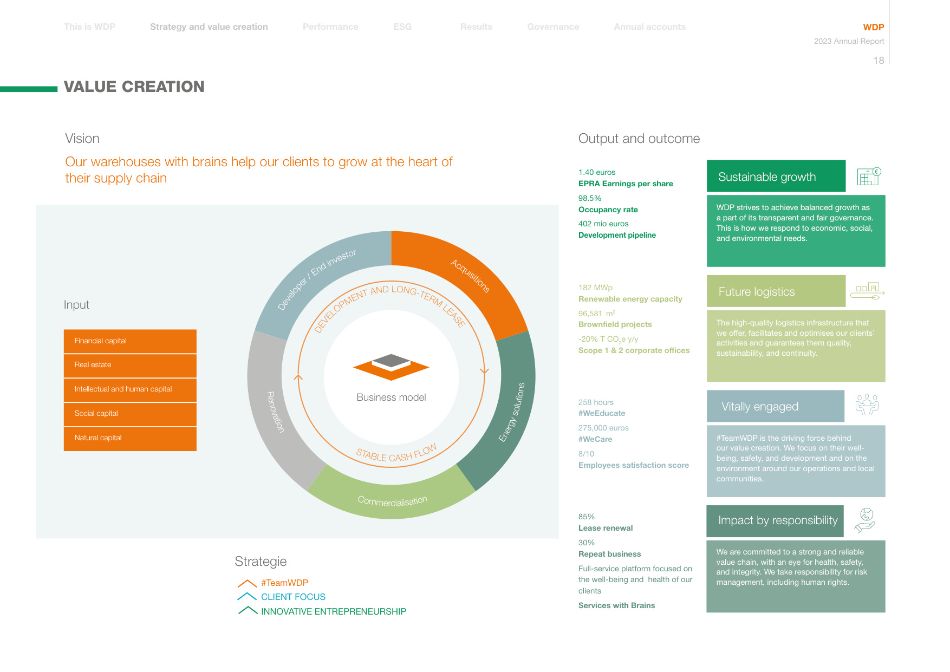
#TeamWDP is the driving force behind our value creation. We focus on their well- being, safety, and development and on the environment around our operations and local communities. WDP strives to achieve balanced growth as a part of its transparent and fair governance. This is how we respond to economic, social, and environmental needs. The high-quality logistics infrastructure that we offer, facilitates and optimises our clients' activities and guarantees them quality, sustainability, and continuity. VALUE CREATION Vision Our warehouses with brains help our clients to grow at the heart of their supply chain #TeamWDP CLIENT FOCUS INNOVATIVE ENTREPRENEURSHIP Output and outcome Vitally engaged Impact by responsibility We are committed to a strong and reliable value chain, with an eye for health, safety, and integrity. We take responsibility for risk management, including human rights. Strategie Sustainable growth Future logistics 258 hours #WeEducate 275,000 euros #WeCare 8/10 Employees satisfaction score 85% Lease renewal 30% Repeat business Full-service platform focused on the well-being and health of our clients Services with Brains 1.40 euros EPRA Earnings per share 98.5% Occupancy rate 402 mio euros Development pipeline 182 MWp Renewable energy capacity 96,581 m2 Brownfield projects -20% T CO2e y/y Scope 1 & 2 corporate offices Input Financial capital Real estate Intellectual and human capital Social capital Natural capital Business model S T A B L E C A S H F L O W D E V E L O P M E N T A N D L O N G - T E R M L E A S E Re no va ti on E ne rg y s ol ut io n s A cq ui si tio ns D ev el o pe r / E nd in ve s to r Co m me rc ia lis at io n Annual accounts Governance Results Performance Strategy and value creation This is WDP ESG WDP 2023 Annual Report 18
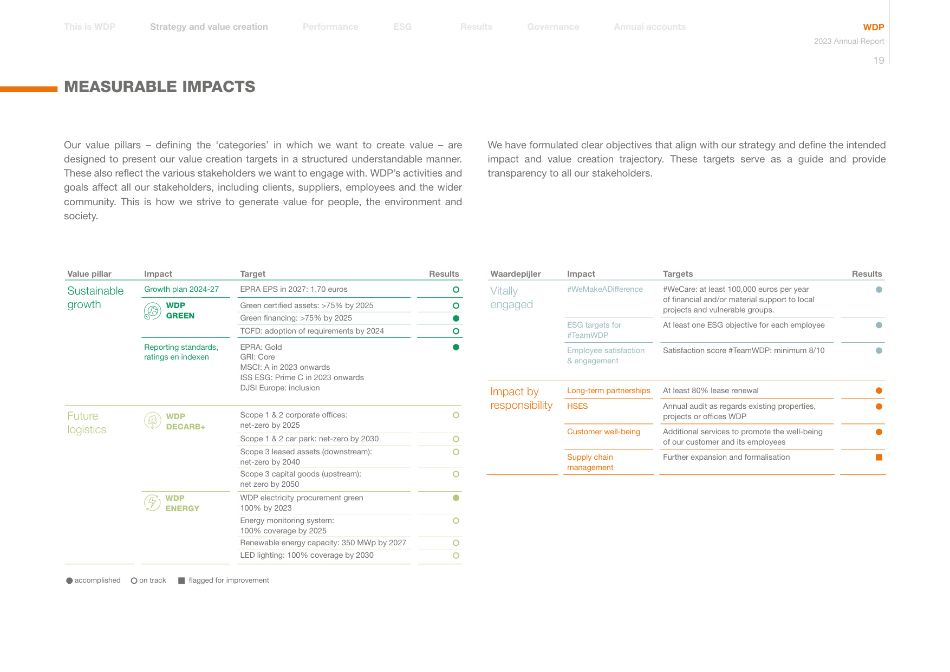
Value pillar Impact Target Results Sustainable growth Growth plan 2024-27 EPRA EPS in 2027: 1.70 euros WDP GREEN Green certified assets: >75% by 2025 Green financing: >75% by 2025 TCFD: adoption of requirements by 2024 Reporting standards, ratings en indexen EPRA: Gold GRI: Core MSCI: A in 2023 onwards ISS ESG: Prime C in 2023 onwards DJSI Europe: inclusion Future logistics WDP DECARB+ Scope 1 & 2 corporate offices: net-zero by 2025 Scope 1 & 2 car park: net-zero by 2030 Scope 3 leased assets (downstream): net-zero by 2040 Scope 3 capital goods (upstream): net zero by 2050 WDP ENERGY WDP electricity procurement green 100% by 2023 Energy monitoring system: 100% coverage by 2025 Renewable energy capacity: 350 MWp by 2027 LED lighting: 100% coverage by 2030 Waardepijler Impact Targets Results Vitally engaged #WeMakeADifference #WeCare: at least 100,000 euros per year of financial and/or material support to local projects and vulnerable groups. ESG targets for #TeamWDP At least one ESG objective for each employee Employee satisfaction & engagement Satisfaction score #TeamWDP: minimum 8/10 Impact by responsibility Long-term partnerships At least 80% lease renewal HSES Annual audit as regards existing properties, projects or offices WDP Customer well-being Additional services to promote the well-being of our customer and its employees Supply chain management Further expansion and formalisation MEASURABLE IMPACTS Our value pillars – defining the 'categories' in which we want to create value – are designed to present our value creation targets in a structured understandable manner. These also reflect the various stakeholders we want to engage with. WDP's activities and goals affect all our stakeholders, including clients, suppliers, employees and the wider community. This is how we strive to generate value for people, the environment and society. We have formulated clear objectives that align with our strategy and define the intended impact and value creation trajectory. These targets serve as a guide and provide transparency to all our stakeholders. accomplished on track flagged for improvement Annual accounts Governance Results Performance Strategy and value creation This is WDP ESG WDP 2023 Annual Report 19
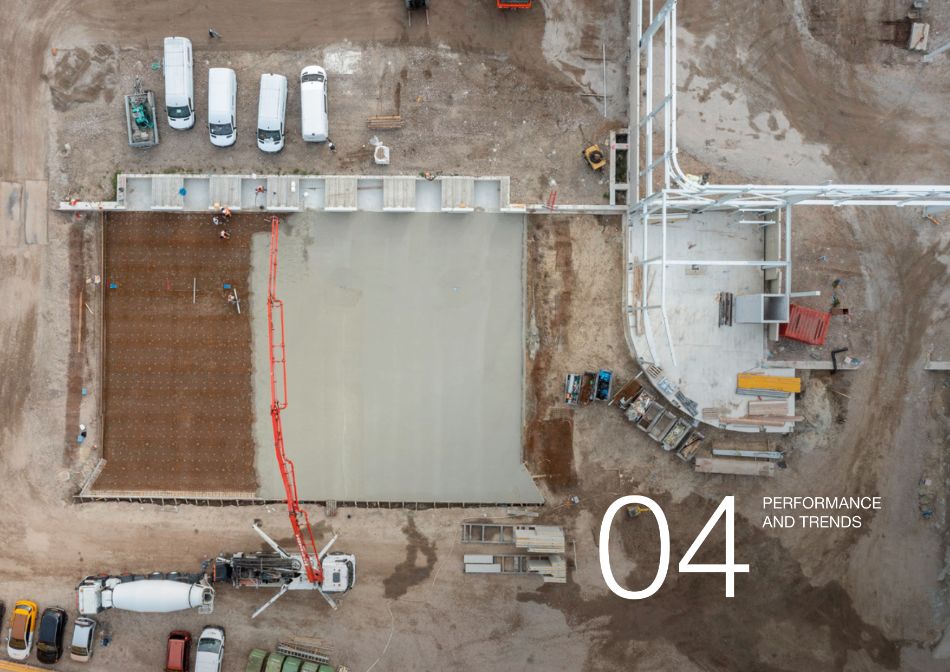
04 PERFORMANCE AND TRENDS
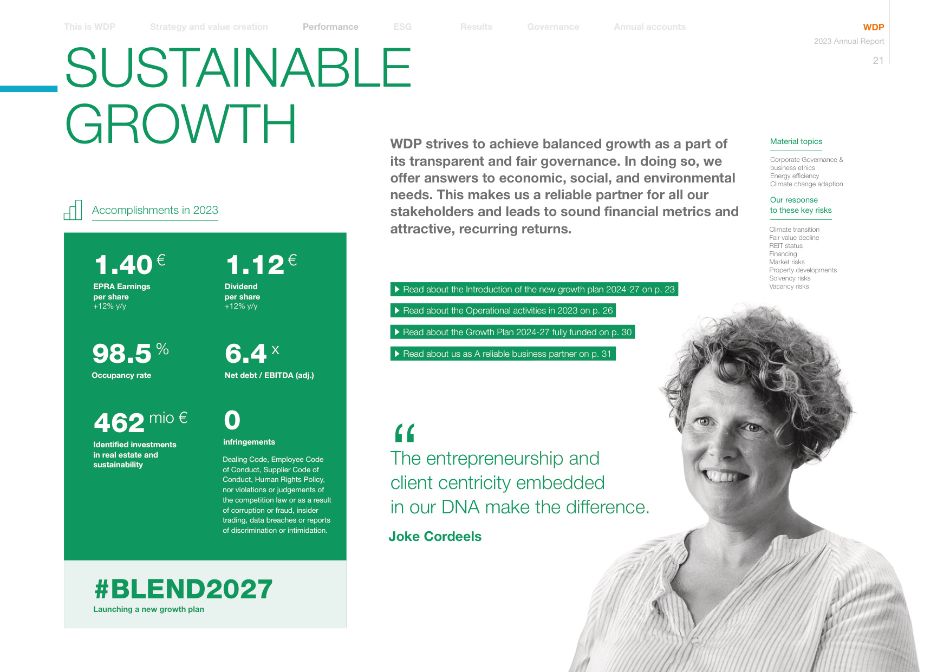
Annual accounts Governance Results Performance Strategy and value creation This is WDP ESG WDP 2023 Annual Report 21 SUSTAINABLE GROWTH Accomplishments in 2023 EPRA Earnings per share +12% y/y 1.40 € Dividend per share +12% y/y 1.12 € " The entrepreneurship and client centricity embedded in our DNA make the difference. Material topics Our response to these key risks Read about the Introduction of the new growth plan 2024-27 on p. 23 Read about the Operational activities in 2023 on p. 26 Read about the Growth Plan 2024-27 fully funded on p. 30 Corporate Governance & business ethics Energy efficiency Climate change adaption Climate transition Fair value decline REIT status Financing Market risks Property developments Solvency risks Vacancy risks Read about us as A reliable business partner on p. 31 infringements 0 Dealing Code, Employee Code of Conduct, Supplier Code of Conduct, Human Rights Policy, nor violations or judgements of the competition law or as a result of corruption or fraud, insider trading, data breaches or reports of discrimination or intimidation. Net debt / EBITDA (adj.) 6.4 x Occupancy rate 98.5 % Identified investments in real estate and sustainability 462 mio € #BLEND2027 Launching a new growth plan WDP strives to achieve balanced growth as a part of its transparent and fair governance. In doing so, we offer answers to economic, social, and environmental needs. This makes us a reliable partner for all our stakeholders and leads to sound financial metrics and attractive, recurring returns. Joke Cordeels
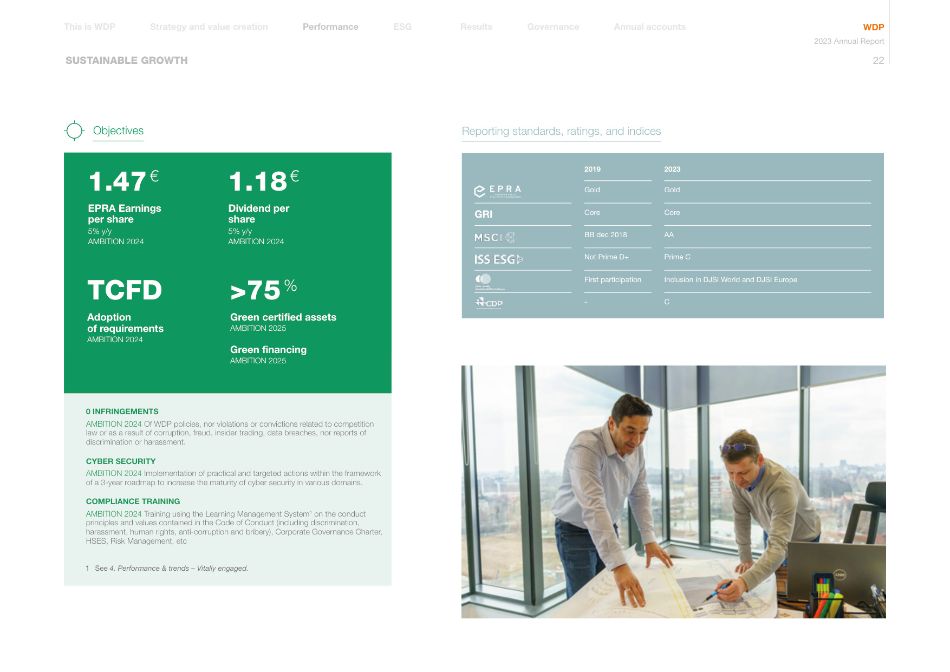
Annual accounts Governance Results Performance Strategy and value creation This is WDP ESG WDP 2023 Annual Report 22 0 INFRINGEMENTS AMBITION 2024 Of WDP policies, nor violations or convictions related to competition law or as a result of corruption, fraud, insider trading, data breaches, nor reports of discrimination or harassment. CYBER SECURITY AMBITION 2024 Implementation of practical and targeted actions within the framework of a 3-year roadmap to increase the maturity of cyber security in various domains. COMPLIANCE TRAINING AMBITION 2024 Training using the Learning Management System1 on the conduct principles and values contained in the Code of Conduct (including discrimination, harassment, human rights, anti-corruption and bribery), Corporate Governance Charter, HSES, Risk Management, etc Objectives SUSTAINABLE GROWTH Adoption of requirements AMBITION 2024 TCFD EPRA Earnings per share 5% y/y AMBITION 2024 1.47 € Dividend per share 5% y/y AMBITION 2024 1.18 € Green financing AMBITION 2025 Green certified assets AMBITION 2025 >75 % 2019 2023 Gold Gold Core Core BB dec 2018 AA Not Prime D+ Prime C First participation Inclusion in DJSI World and DJSI Europe - C Reporting standards, ratings, and indices GRI 1 See 4. Performance & trends – Vitally engaged.
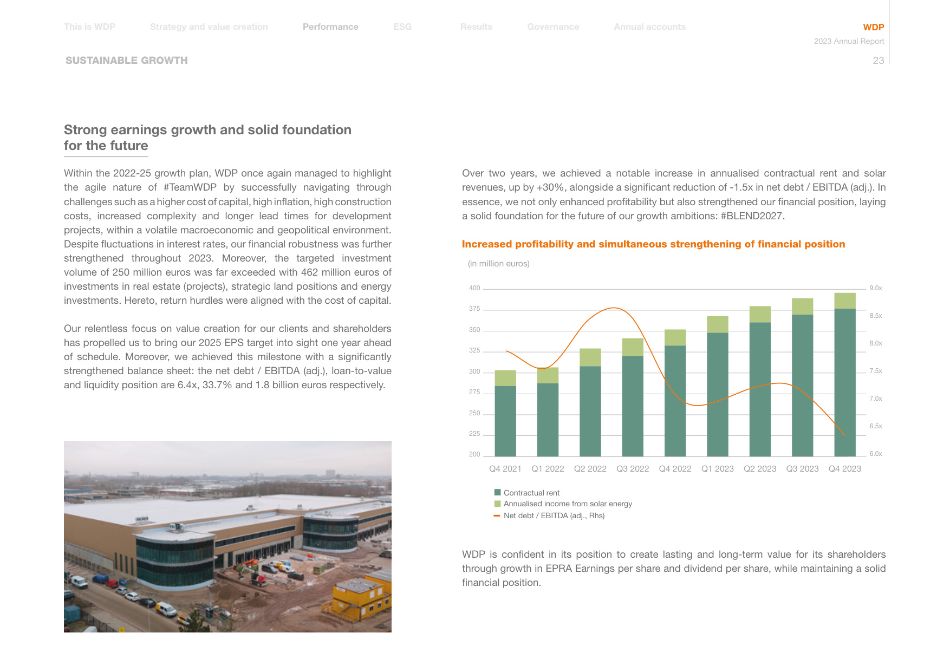
400 375 350 325 300 275 250 225 200 9.0x 6.0x 6.5x 7.0x 7.5x 8.0x 8.5x Q4 2021 Q1 2022 Q2 2022 Q3 2022 Q4 2022 Q1 2023 Q2 2023 Q3 2023 Q4 2023 (in million euros) Net debt / EBITDA (adj., Rhs) Contractual rent Annualised income from solar energy Annual accounts Governance Results Performance Strategy and value creation This is WDP ESG WDP 2023 Annual Report 23 Strong earnings growth and solid foundation for the future Within the 2022-25 growth plan, WDP once again managed to highlight the agile nature of #TeamWDP by successfully navigating through challenges such as a higher cost of capital, high inflation, high construction costs, increased complexity and longer lead times for development projects, within a volatile macroeconomic and geopolitical environment. Despite fluctuations in interest rates, our financial robustness was further strengthened throughout 2023. Moreover, the targeted investment volume of 250 million euros was far exceeded with 462 million euros of investments in real estate (projects), strategic land positions and energy investments. Hereto, return hurdles were aligned with the cost of capital. Our relentless focus on value creation for our clients and shareholders has propelled us to bring our 2025 EPS target into sight one year ahead of schedule. Moreover, we achieved this milestone with a significantly strengthened balance sheet: the net debt / EBITDA (adj.), loan-to-value and liquidity position are 6.4x, 33.7% and 1.8 billion euros respectively. Increased profitability and simultaneous strengthening of financial position Over two years, we achieved a notable increase in annualised contractual rent and solar revenues, up by +30%, alongside a significant reduction of -1.5x in net debt / EBITDA (adj.). In essence, we not only enhanced profitability but also strengthened our financial position, laying a solid foundation for the future of our growth ambitions: #BLEND2027. WDP is confident in its position to create lasting and long-term value for its shareholders through growth in EPRA Earnings per share and dividend per share, while maintaining a solid financial position. SUSTAINABLE GROWTH
O ur vision is to continue helping clients grow in their supply chain. This can only be achieved by having the resources necessary to continue facilitating our clients, providing them with warehouses, logistics and production solutions that help them meet the challenges of today and tomorrow. As a real estate company, capital is one of our most important raw materials, holding even greater significance in today's increasingly volatile market. Comfortable in volatile times A sound financing foundation is a prerequisite for remaining flexible. As a client-centric company focused on profitable growth and considering the volume of our portfolio, we are well aware of this. Capital is paramount to us as a real estate company, particularly in today's increasingly volatile climate where it's becoming scarcer. While extreme volatility poses challenges to the real estate sector, we've demonstrated the ability to capitalize on such situations, turning them into opportunities on several occasions in recent years. In early 2022, when inflation rates were already starting to rise, we proactively hedged the interest component of our future debt with lower interest rates. This decision has positioned us comfortably. Furthermore, the prevailing interest rate environment instills confidence in our cash flow and profitability. By taking prompt action, we've contributed significantly to our success. Adopting a diligent approach to business development underscores the importance of maintaining a robust balance sheet with sufficient reserves and liquidity. This ensures that we remain agile to act strategically and seize opportunities that cross our path. Thus, we can continue to pursue our growth ambitions, amidst the current elevated volatility. And we have done so by increasing our yield hurdles in existing operations. So, our growth is real. In fact, this has allowed us to strengthen our balance sheet several times recently by raising new equity. Moreover, our growth is reflected in the value creation for our shareholders with higher earnings per share. ROBUST, PROACTIVE AND LIQUID Annual accounts Governance Results Performance Strategy and value creation This is WDP ESG WDP 2023 Annual Report 24
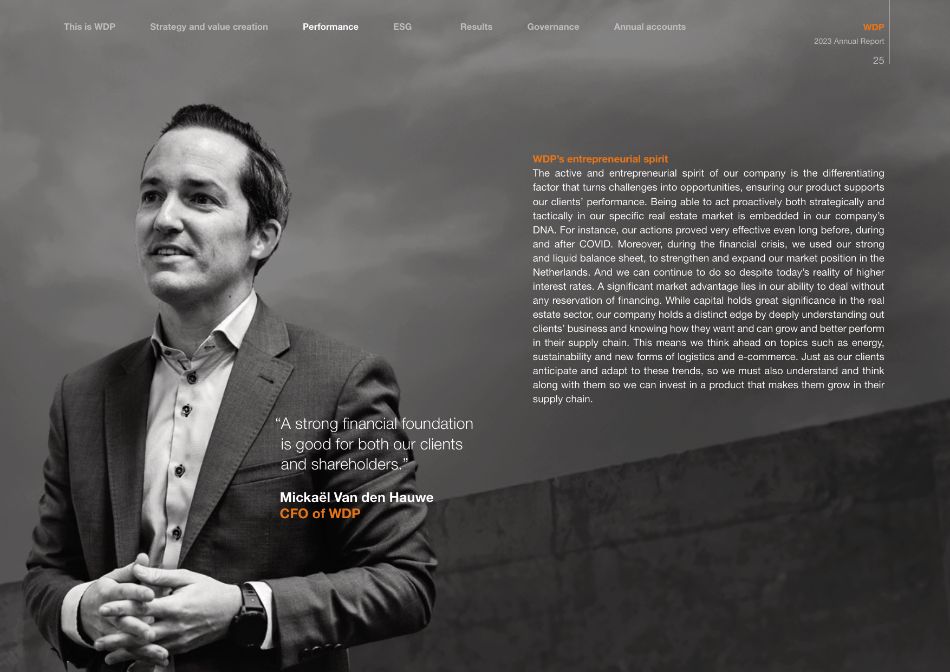
"A strong financial foundation is good for both our clients and shareholders." Mickaël Van den Hauwe CFO of WDP WDP's entrepreneurial spirit The active and entrepreneurial spirit of our company is the differentiating factor that turns challenges into opportunities, ensuring our product supports our clients' performance. Being able to act proactively both strategically and tactically in our specific real estate market is embedded in our company's DNA. For instance, our actions proved very effective even long before, during and after COVID. Moreover, during the financial crisis, we used our strong and liquid balance sheet, to strengthen and expand our market position in the Netherlands. And we can continue to do so despite today's reality of higher interest rates. A significant market advantage lies in our ability to deal without any reservation of financing. While capital holds great significance in the real estate sector, our company holds a distinct edge by deeply understanding out clients' business and knowing how they want and can grow and better perform in their supply chain. This means we think ahead on topics such as energy, sustainability and new forms of logistics and e-commerce. Just as our clients anticipate and adapt to these trends, so we must also understand and think along with them so we can invest in a product that makes them grow in their supply chain. Annual accounts Governance Results Performance Strategy and value creation This is WDP ESG WDP 2023 Annual Report 25
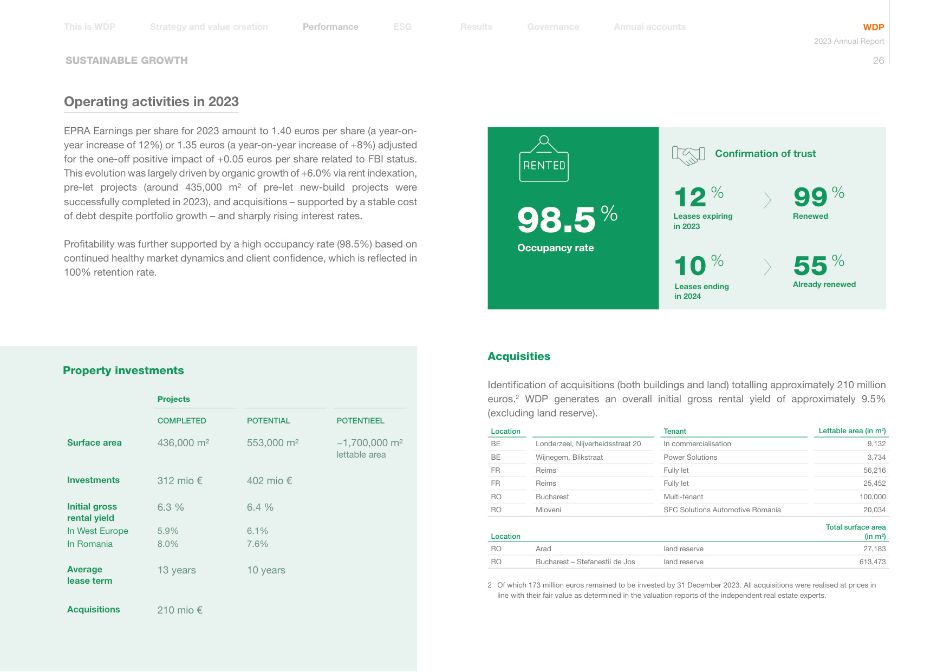
Annual accounts Governance Results Performance Strategy and value creation This is WDP ESG WDP 2023 Annual Report 26 Operating activities in 2023 EPRA Earnings per share for 2023 amount to 1.40 euros per share (a year-on- year increase of 12%) or 1.35 euros (a year-on-year increase of +8%) adjusted for the one-off positive impact of +0.05 euros per share related to FBI status. This evolution was largely driven by organic growth of +6.0% via rent indexation, pre-let projects (around 435,000 m² of pre-let new-build projects were successfully completed in 2023), and acquisitions – supported by a stable cost of debt despite portfolio growth – and sharply rising interest rates. Profitability was further supported by a high occupancy rate (98.5%) based on continued healthy market dynamics and client confidence, which is reflected in 100% retention rate. Occupancy rate 98.5 % Leases expiring in 2023 Renewed Leases ending in 2024 12 % 10 % 99 % Already renewed 55 % Confirmation of trust Projects COMPLETED POTENTIAL POTENTIEEL Surface area 436,000 m² 553,000 m² ~1,700,000 m² lettable area Investments 312 mio € 402 mio € Initial gross rental yield 6.3 % 6.4 % In West Europe 5.9% 6.1% In Romania 8.0% 7.6% Average lease term 13 years 10 years Acquisitions 210 mio € Property investments Acquisities Identification of acquisitions (both buildings and land) totalling approximately 210 million euros.2 WDP generates an overall initial gross rental yield of approximately 9.5% (excluding land reserve). Location Tenant Lettable area (in m2) BE Londerzeel, Nijverheidsstraat 20 In commercialisation 9,132 BE Wijnegem, Blikstraat Power Solutions 3,734 FR Reims Fully let 56,216 FR Reims Fully let 25,452 RO Bucharest Multi-tenant 100,000 RO Mioveni SFC Solutions Automotive Romania 20,034 Location Total surface area (in m²) RO Arad land reserve 27,183 RO Bucharest – Stefanestii de Jos land reserve 613,473 2 Of which 173 million euros remained to be invested by 31 December 2023. All acquisitions were realised at prices in line with their fair value as determined in the valuation reports of the independent real estate experts. SUSTAINABLE GROWTH
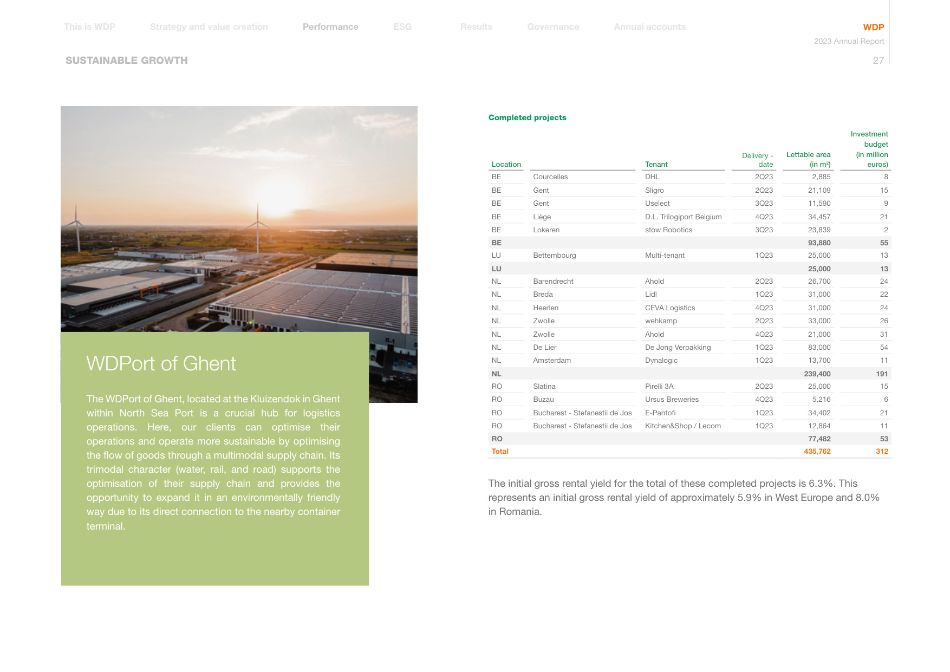
Annual accounts Governance Results Performance Strategy and value creation This is WDP ESG WDP 2023 Annual Report 27 WDPort of Ghent The WDPort of Ghent, located at the Kluizendok in Ghent within North Sea Port is a crucial hub for logistics operations. Here, our clients can optimise their operations and operate more sustainable by optimising the flow of goods through a multimodal supply chain. Its trimodal character (water, rail, and road) supports the optimisation of their supply chain and provides the opportunity to expand it in an environmentally friendly way due to its direct connection to the nearby container terminal. Completed projects Location Tenant Delivery - date Lettable area (in m2) Investment budget (in million euros) BE Courcelles DHL 2Q23 2,885 8 BE Gent Sligro 2Q23 21,109 15 BE Gent Uselect 3Q23 11,590 9 BE Liège D.L. Trilogiport Belgium 4Q23 34,457 21 BE Lokeren stow Robotics 3Q23 23,839 2 BE 93,880 55 LU Bettembourg Multi-tenant 1Q23 25,000 13 LU 25,000 13 NL Barendrecht Ahold 2Q23 26,700 24 NL Breda Lidl 1Q23 31,000 22 NL Heerlen CEVA Logistics 4Q23 31,000 24 NL Zwolle wehkamp 2Q23 33,000 26 NL Zwolle Ahold 4Q23 21,000 31 NL De Lier De Jong Verpakking 1Q23 83,000 54 NL Amsterdam Dynalogic 1Q23 13,700 11 NL 239,400 191 RO Slatina Pirelli 3A 2Q23 25,000 15 RO Buzau Ursus Breweries 4Q23 5,216 6 RO Bucharest - Stefanestii de Jos E-Pantofi 1Q23 34,402 21 RO Bucharest - Stefanestii de Jos Kitchen&Shop / Lecom 1Q23 12,864 11 RO 77,482 53 Total 435,762 312 The initial gross rental yield for the total of these completed projects is 6.3%. This represents an initial gross rental yield of approximately 5.9% in West Europe and 8.0% in Romania. SUSTAINABLE GROWTH
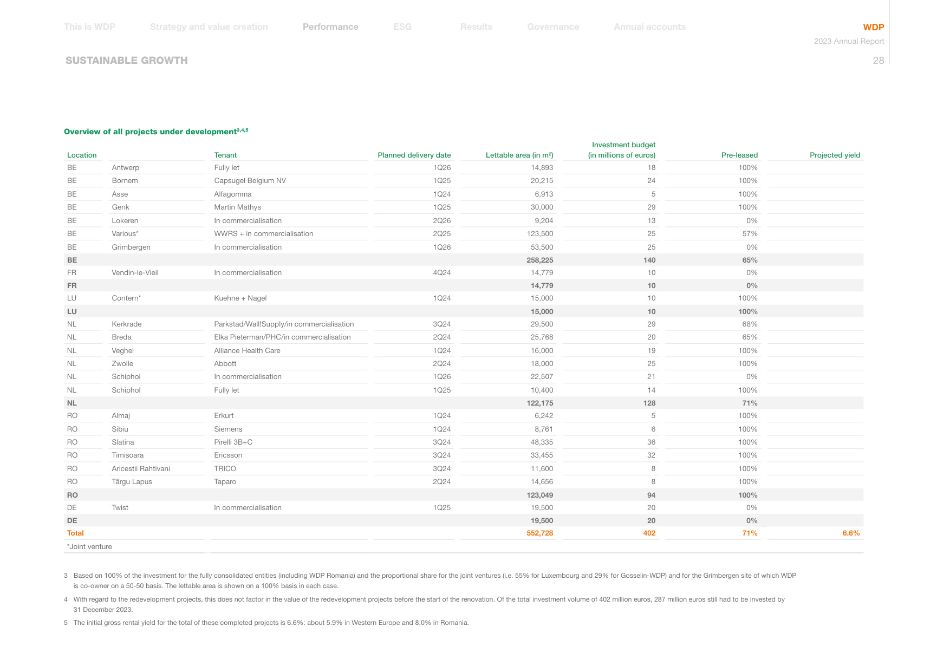
Annual accounts Governance Results Performance Strategy and value creation This is WDP ESG WDP 2023 Annual Report 28 SUSTAINABLE GROWTH Overview of all projects under development3,4,5 Location Tenant Planned delivery date Lettable area (in m²) Investment budget (in millions of euros) Pre-leased Projected yield BE Antwerp Fully let 1Q26 14,893 18 100% BE Bornem Capsugel Belgium NV 1Q25 20,215 24 100% BE Asse Alfagomma 1Q24 6,913 5 100% BE Genk Martin Mathys 1Q25 30,000 29 100% BE Lokeren In commercialisation 2Q26 9,204 13 0% BE Various* WWRS + in commercialisation 2Q25 123,500 25 57% BE Grimbergen In commercialisation 1Q26 53,500 25 0% BE 258,225 140 65% FR Vendin-le-Vieil In commercialisation 4Q24 14,779 10 0% FR 14,779 10 0% LU Contern* Kuehne + Nagel 1Q24 15,000 10 100% LU 15,000 10 100% NL Kerkrade Parkstad/Wall!Supply/in commercialisation 3Q24 29,500 29 68% NL Breda Elka Pieterman/PHC/in commercialisation 2Q24 25,768 20 65% NL Veghel Alliance Health Care 1Q24 16,000 19 100% NL Zwolle Abbott 2Q24 18,000 25 100% NL Schiphol In commercialisation 1Q26 22,507 21 0% NL Schiphol Fully let 1Q25 10,400 14 100% NL 122,175 128 71% RO Almaj Erkurt 1Q24 6,242 5 100% RO Sibiu Siemens 1Q24 8,761 6 100% RO Slatina Pirelli 3B+C 3Q24 48,335 36 100% RO Timisoara Ericsson 3Q24 33,455 32 100% RO Aricestii Rahtivani TRICO 3Q24 11,600 8 100% RO Târgu Lapus Taparo 2Q24 14,656 8 100% RO 123,049 94 100% DE Twist In commercialisation 1Q25 19,500 20 0% DE 19,500 20 0% Total 552,728 402 71% 6.6% *Joint venture 3 Based on 100% of the investment for the fully consolidated entities (including WDP Romania) and the proportional share for the joint ventures (i.e. 55% for Luxembourg and 29% for Gosselin-WDP) and for the Grimbergen site of which WDP is co-owner on a 50-50 basis. The lettable area is shown on a 100% basis in each case. 4 With regard to the redevelopment projects, this does not factor in the value of the redevelopment projects before the start of the renovation. Of the total investment volume of 402 million euros, 287 million euros still had to be invested by 31 December 2023. 5 The initial gross rental yield for the total of these completed projects is 6.6%: about 5.9% in Western Europe and 8.0% in Romania.
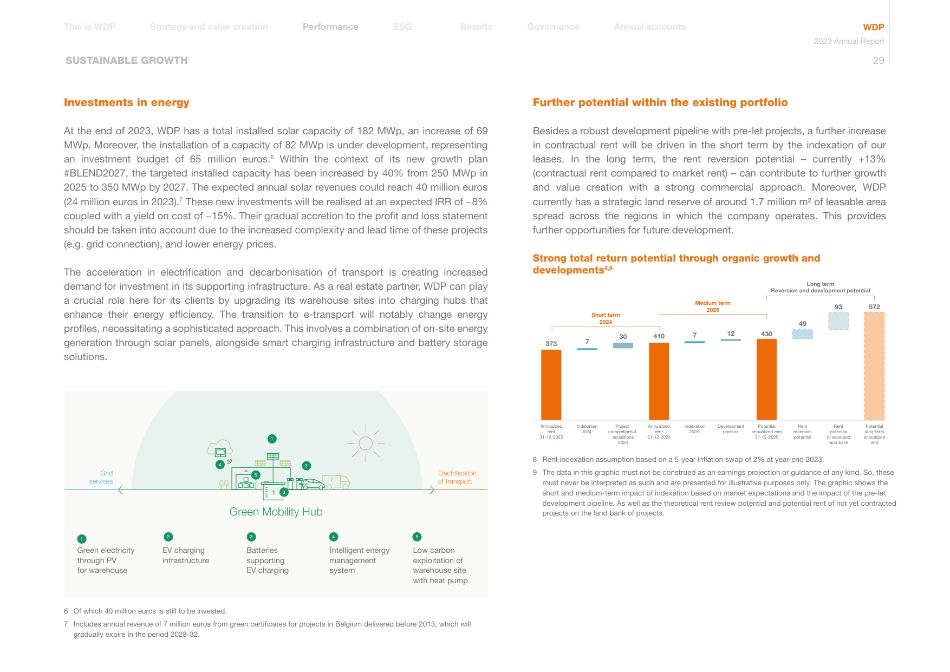
7 373 410 430 572 30 Long term Reversion and development potential 7 12 49 93 Annualized rent 31-12-2023 Indexation 20241 Project completions & acuisitions 2024 Annualized rent 31-12-2024 Indexation 20251 Development pipeline Potential annualized rent 31-12-2025 Rent reversion potential Rent potential of seceured land bank Potential long-term annualized rent Short term 2024 Medium term 2025 8 Rent indexation assumption based on a 5-year inflation swap of 2% at year-end 2023. 9 The data in this graphic must not be construed as an earnings projection or guidance of any kind. So, these must never be interpreted as such and are presented for illustrative purposes only. The graphic shows the short and medium-term impact of indexation based on market expectations and the impact of the pre-let development pipeline. As well as the theoretical rent review potential and potential rent of not yet contracted projects on the land bank of projects. Annual accounts Governance Results Performance Strategy and value creation This is WDP ESG WDP 2023 Annual Report 29 Investments in energy At the end of 2023, WDP has a total installed solar capacity of 182 MWp, an increase of 69 MWp. Moreover, the installation of a capacity of 82 MWp is under development, representing an investment budget of 65 million euros.6 Within the context of its new growth plan #BLEND2027, the targeted installed capacity has been increased by 40% from 250 MWp in 2025 to 350 MWp by 2027. The expected annual solar revenues could reach 40 million euros (24 million euros in 2023).7 These new investments will be realised at an expected IRR of ~8% coupled with a yield on cost of ~15%. Their gradual accretion to the profit and loss statement should be taken into account due to the increased complexity and lead time of these projects (e.g. grid connection), and lower energy prices. The acceleration in electrification and decarbonisation of transport is creating increased demand for investment in its supporting infrastructure. As a real estate partner, WDP can play a crucial role here for its clients by upgrading its warehouse sites into charging hubs that enhance their energy efficiency. The transition to e-transport will notably change energy profiles, necessitating a sophisticated approach. This involves a combination of on-site energy generation through solar panels, alongside smart charging infrastructure and battery storage solutions. SUSTAINABLE GROWTH Further potential within the existing portfolio Besides a robust development pipeline with pre-let projects, a further increase in contractual rent will be driven in the short term by the indexation of our leases. In the long term, the rent reversion potential – currently +13% (contractual rent compared to market rent) – can contribute to further growth and value creation with a strong commercial approach. Moreover, WDP currently has a strategic land reserve of around 1.7 million m² of leasable area spread across the regions in which the company operates. This provides further opportunities for future development. Strong total return potential through organic growth and developments8,9 6 Of which 40 million euros is still to be invested. 7 Includes annual revenue of 7 million euros from green certificates for projects in Belgium delivered before 2013, which will gradually expire in the period 2028-32. Green electricity through PV for warehouse EV charging infrastructure Batteries supporting EV charging Low carbon exploitation of warehouse site with heat pump Intelligent energy management system 1 2 3 5 4 Green Mobility Hub Grid services Electrification of transport 1 2 3 4 5
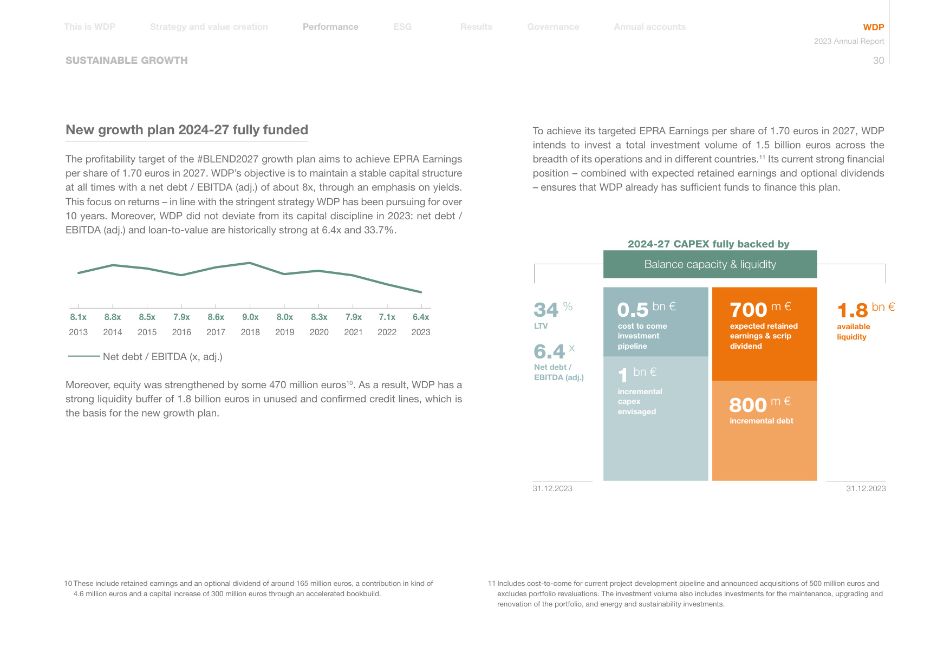
Annual accounts Governance Results Performance Strategy and value creation This is WDP ESG WDP 2023 Annual Report 30 New growth plan 2024-27 fully funded The profitability target of the #BLEND2027 growth plan aims to achieve EPRA Earnings per share of 1.70 euros in 2027. WDP's objective is to maintain a stable capital structure at all times with a net debt / EBITDA (adj.) of about 8x, through an emphasis on yields. This focus on returns – in line with the stringent strategy WDP has been pursuing for over 10 years. Moreover, WDP did not deviate from its capital discipline in 2023: net debt / EBITDA (adj.) and loan-to-value are historically strong at 6.4x and 33.7%. 2013 2014 2015 2016 2017 2018 2019 2020 2021 2022 2023 8.1x 8.8x 8.5x 7.9x 8.6x 9.0x 8.0x 8.3x 7.9x 7.1x 6.4x Net debt / EBITDA (x, adj.) Moreover, equity was strengthened by some 470 million euros10. As a result, WDP has a strong liquidity buffer of 1.8 billion euros in unused and confirmed credit lines, which is the basis for the new growth plan. 10 These include retained earnings and an optional dividend of around 165 million euros, a contribution in kind of 4.6 million euros and a capital increase of 300 million euros through an accelerated bookbuild. SUSTAINABLE GROWTH To achieve its targeted EPRA Earnings per share of 1.70 euros in 2027, WDP intends to invest a total investment volume of 1.5 billion euros across the breadth of its operations and in different countries.11 Its current strong financial position – combined with expected retained earnings and optional dividends – ensures that WDP already has sufficient funds to finance this plan. Balance capacity & liquidity 2024-27 CAPEX fully backed by cost to come investment pipeline LTV Net debt / EBITDA (adj.) available liquidity incremental capex envisaged incremental debt expected retained earnings & scrip dividend 0.5 bn € 34 % 6.4 x 1.8 bn € 1 bn € 800 m € 700 m € 31.12.2023 31.12.2023 11 Includes cost-to-come for current project development pipeline and announced acquisitions of 500 million euros and excludes portfolio revaluations. The investment volume also includes investments for the maintenance, upgrading and renovation of the portfolio, and energy and sustainability investments.
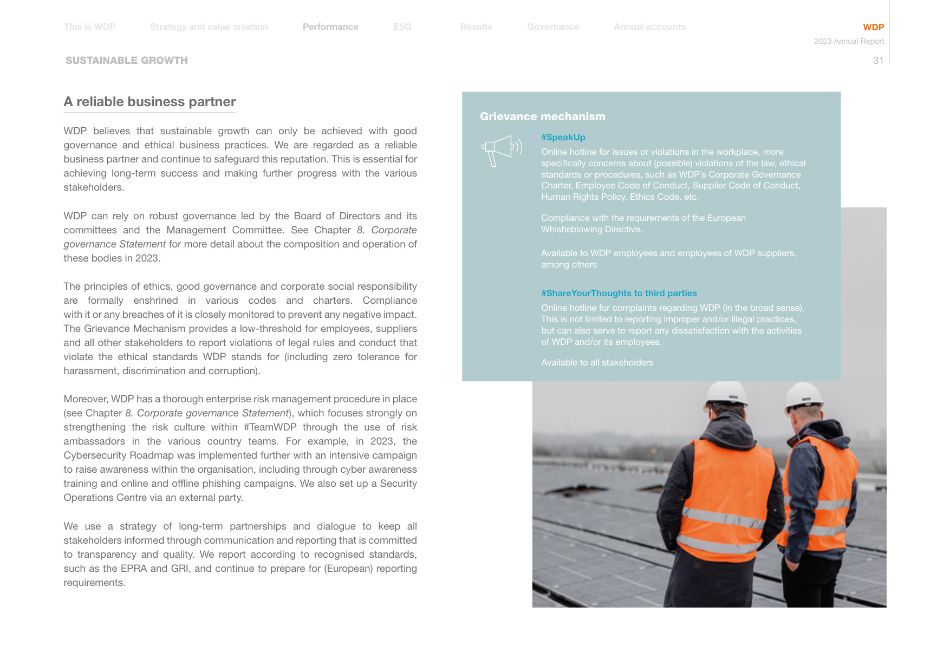
Annual accounts Governance Results Performance Strategy and value creation This is WDP ESG WDP 2023 Annual Report 31 SUSTAINABLE GROWTH A reliable business partner WDP believes that sustainable growth can only be achieved with good governance and ethical business practices. We are regarded as a reliable business partner and continue to safeguard this reputation. This is essential for achieving long-term success and making further progress with the various stakeholders. WDP can rely on robust governance led by the Board of Directors and its committees and the Management Committee. See Chapter 8. Corporate governance Statement for more detail about the composition and operation of these bodies in 2023. The principles of ethics, good governance and corporate social responsibility are formally enshrined in various codes and charters. Compliance with it or any breaches of it is closely monitored to prevent any negative impact. The Grievance Mechanism provides a low-threshold for employees, suppliers and all other stakeholders to report violations of legal rules and conduct that violate the ethical standards WDP stands for (including zero tolerance for harassment, discrimination and corruption). Moreover, WDP has a thorough enterprise risk management procedure in place (see Chapter 8. Corporate governance Statement), which focuses strongly on strengthening the risk culture within #TeamWDP through the use of risk ambassadors in the various country teams. For example, in 2023, the Cybersecurity Roadmap was implemented further with an intensive campaign to raise awareness within the organisation, including through cyber awareness training and online and offline phishing campaigns. We also set up a Security Operations Centre via an external party. We use a strategy of long-term partnerships and dialogue to keep all stakeholders informed through communication and reporting that is committed to transparency and quality. We report according to recognised standards, such as the EPRA and GRI, and continue to prepare for (European) reporting requirements. #SpeakUp Online hotline for issues or violations in the workplace, more specifically concerns about (possible) violations of the law, ethical standards or procedures, such as WDP's Corporate Governance Charter, Employee Code of Conduct, Supplier Code of Conduct, Human Rights Policy, Ethics Code, etc. Compliance with the requirements of the European Whistleblowing Directive. Available to WDP employees and employees of WDP suppliers, among others #ShareYourThoughts to third parties Online hotline for complaints regarding WDP (in the broad sense). This is not limited to reporting improper and/or illegal practices, but can also serve to report any dissatisfaction with the activities of WDP and/or its employees. Available to all stakeholders Grievance mechanism
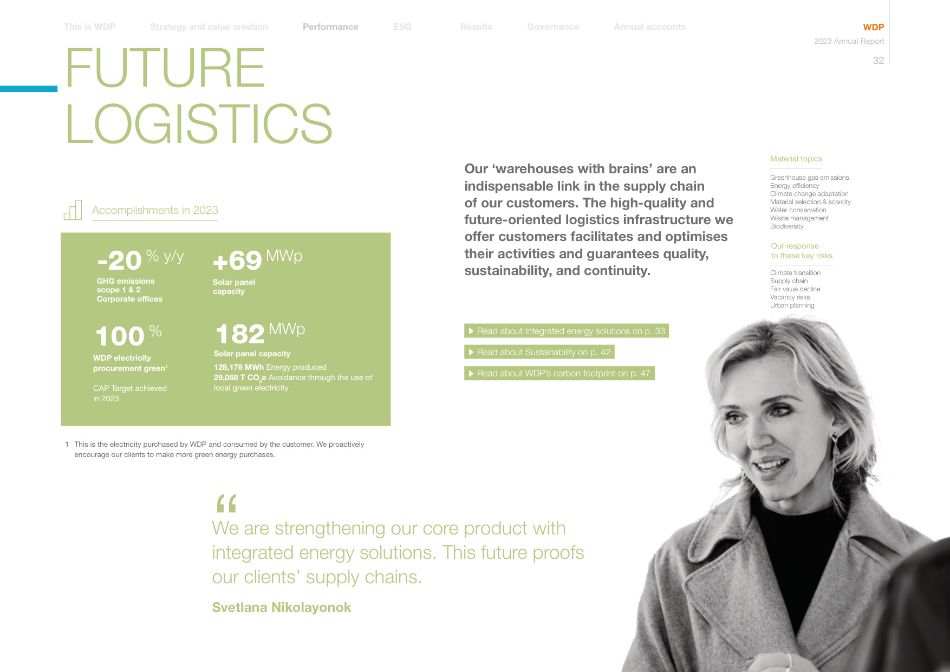
Our 'warehouses with brains' are an indispensable link in the supply chain of our customers. The high-quality and future-oriented logistics infrastructure we offer customers facilitates and optimises their activities and guarantees quality, sustainability, and continuity. Annual accounts Governance Results Performance Strategy and value creation This is WDP ESG WDP 2023 Annual Report 32 FUTURE LOGISTICS Accomplishments in 2023 " We are strengthening our core product with integrated energy solutions. This future proofs our clients' supply chains. Read about Integrated energy solutions on p. 33 Read about Sustainability on p. 42 Read about WDP's carbon footprint on p. 47 GHG emissions scope 1 & 2 Corporate offices -20 % y/y Solar panel capacity +69 MWp WDP electricity procurement green1 CAP Target achieved in 2023 100 % Solar panel capacity 182 MWp 128,178 MWh Energy produced 29,068 T CO2e Avoidance through the use of local green electricity Material topics Greenhouse gas emissions Energy efficiency Climate change adaptation Material selection & scarcity Water conservation Waste management Biodiversity Climate transition Supply chain Fair value decline Vacancy risks Urban planning 1 This is the electricity purchased by WDP and consumed by the customer. We proactively encourage our clients to make more green energy purchases. Our response to these key risks Svetlana Nikolayonok
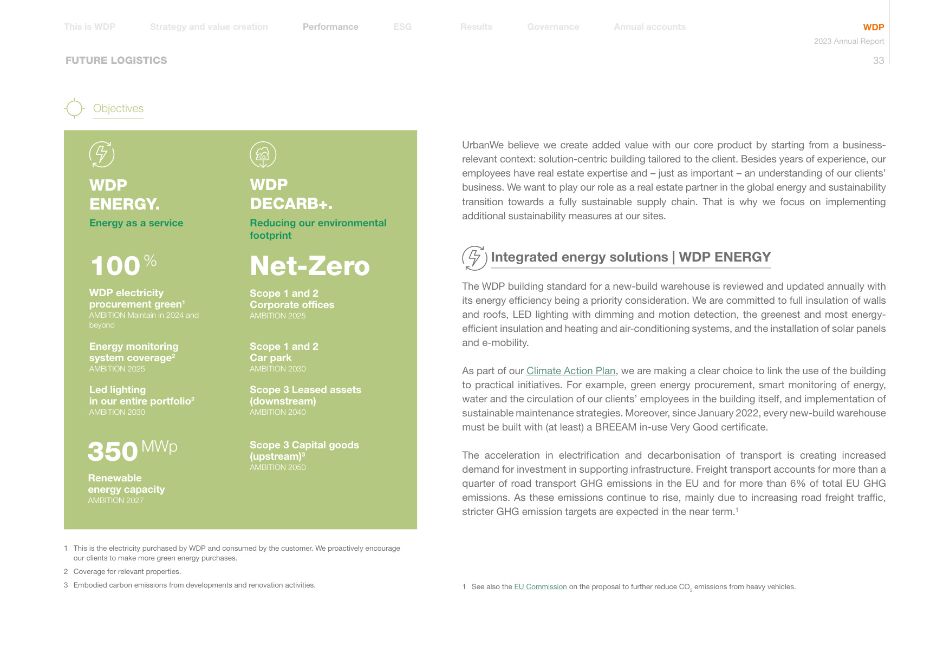
Annual accounts Governance Results Performance Strategy and value creation This is WDP ESG WDP 2023 Annual Report 33 UrbanWe believe we create added value with our core product by starting from a business- relevant context: solution-centric building tailored to the client. Besides years of experience, our employees have real estate expertise and – just as important – an understanding of our clients' business. We want to play our role as a real estate partner in the global energy and sustainability transition towards a fully sustainable supply chain. That is why we focus on implementing additional sustainability measures at our sites. Integrated energy solutions | WDP ENERGY The WDP building standard for a new-build warehouse is reviewed and updated annually with its energy efficiency being a priority consideration. We are committed to full insulation of walls and roofs, LED lighting with dimming and motion detection, the greenest and most energy- efficient insulation and heating and air-conditioning systems, and the installation of solar panels and e-mobility. As part of our Climate Action Plan, we are making a clear choice to link the use of the building to practical initiatives. For example, green energy procurement, smart monitoring of energy, water and the circulation of our clients' employees in the building itself, and implementation of sustainable maintenance strategies. Moreover, since January 2022, every new-build warehouse must be built with (at least) a BREEAM in-use Very Good certificate. The acceleration in electrification and decarbonisation of transport is creating increased demand for investment in supporting infrastructure. Freight transport accounts for more than a quarter of road transport GHG emissions in the EU and for more than 6% of total EU GHG emissions. As these emissions continue to rise, mainly due to increasing road freight traffic, stricter GHG emission targets are expected in the near term.1 1 See also the EU Commission on the proposal to further reduce CO2 emissions from heavy vehicles. Objectives Energy monitoring system coverage2 AMBITION 2025 Scope 3 Capital goods (upstream)3 AMBITION 2050 Led lighting in our entire portfolio2 AMBITION 2030 Scope 1 and 2 Car park AMBITION 2030 WDP electricity procurement green1 AMBITION Maintain in 2024 and beyond 100 % Scope 3 Leased assets (downstream) AMBITION 2040 Net-Zero Renewable energy capacity AMBITION 2027 350 MWp Scope 1 and 2 Corporate offices AMBITION 2025 FUTURE LOGISTICS WDP ENERGY. WDP DECARB+. 1 This is the electricity purchased by WDP and consumed by the customer. We proactively encourage our clients to make more green energy purchases. 2 Coverage for relevant properties. 3 Embodied carbon emissions from developments and renovation activities. Energy as a service Reducing our environmental footprint
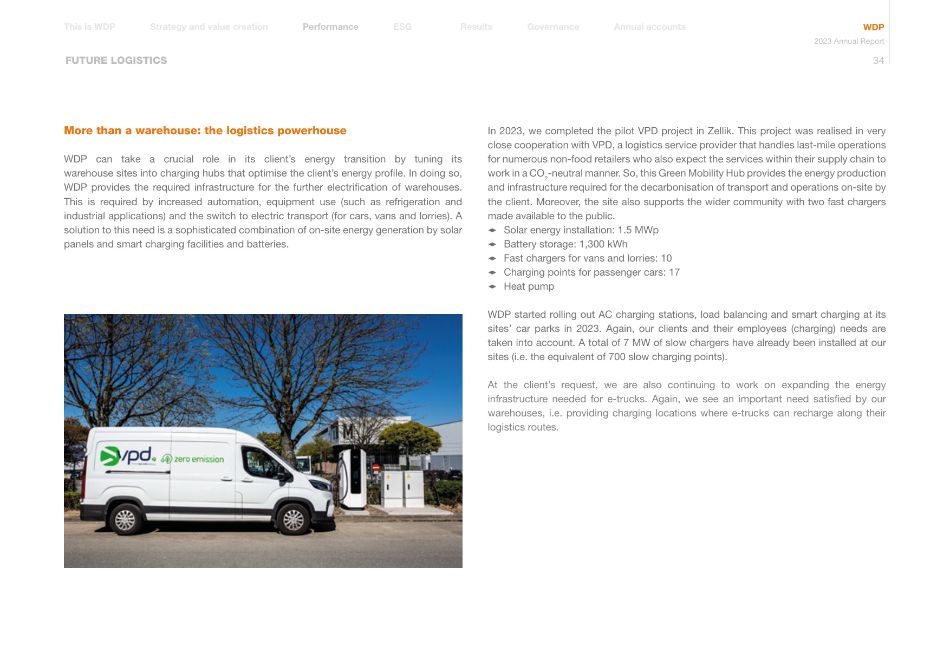
Annual accounts Governance Results Performance Strategy and value creation This is WDP ESG WDP 2023 Annual Report 34 More than a warehouse: the logistics powerhouse WDP can take a crucial role in its client's energy transition by tuning its warehouse sites into charging hubs that optimise the client's energy profile. In doing so, WDP provides the required infrastructure for the further electrification of warehouses. This is required by increased automation, equipment use (such as refrigeration and industrial applications) and the switch to electric transport (for cars, vans and lorries). A solution to this need is a sophisticated combination of on-site energy generation by solar panels and smart charging facilities and batteries. In 2023, we completed the pilot VPD project in Zellik. This project was realised in very close cooperation with VPD, a logistics service provider that handles last-mile operations for numerous non-food retailers who also expect the services within their supply chain to work in a CO2-neutral manner. So, this Green Mobility Hub provides the energy production and infrastructure required for the decarbonisation of transport and operations on-site by the client. Moreover, the site also supports the wider community with two fast chargers made available to the public. 1 Solar energy installation: 1.5 MWp 1 Battery storage: 1,300 kWh 1 Fast chargers for vans and lorries: 10 1 Charging points for passenger cars: 17 1 Heat pump WDP started rolling out AC charging stations, load balancing and smart charging at its sites' car parks in 2023. Again, our clients and their employees (charging) needs are taken into account. A total of 7 MW of slow chargers have already been installed at our sites (i.e. the equivalent of 700 slow charging points). At the client's request, we are also continuing to work on expanding the energy infrastructure needed for e-trucks. Again, we see an important need satisfied by our warehouses, i.e. providing charging locations where e-trucks can recharge along their logistics routes. FUTURE LOGISTICS
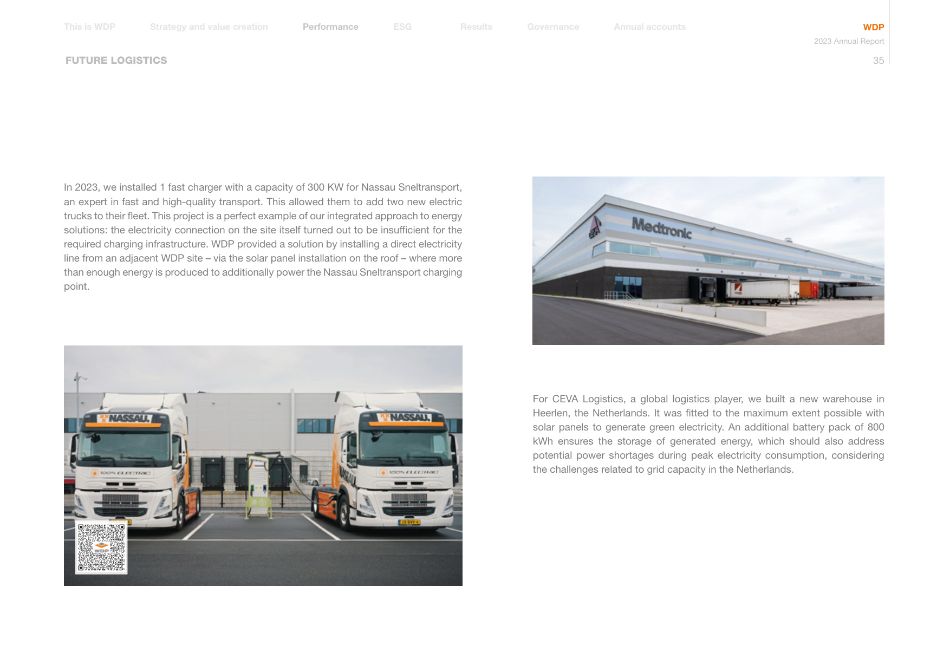
Annual accounts Governance Results Performance Strategy and value creation This is WDP ESG WDP 2023 Annual Report 35 In 2023, we installed 1 fast charger with a capacity of 300 KW for Nassau Sneltransport, an expert in fast and high-quality transport. This allowed them to add two new electric trucks to their fleet. This project is a perfect example of our integrated approach to energy solutions: the electricity connection on the site itself turned out to be insufficient for the required charging infrastructure. WDP provided a solution by installing a direct electricity line from an adjacent WDP site – via the solar panel installation on the roof – where more than enough energy is produced to additionally power the Nassau Sneltransport charging point. For CEVA Logistics, a global logistics player, we built a new warehouse in Heerlen, the Netherlands. It was fitted to the maximum extent possible with solar panels to generate green electricity. An additional battery pack of 800 kWh ensures the storage of generated energy, which should also address potential power shortages during peak electricity consumption, considering the challenges related to grid capacity in the Netherlands. FUTURE LOGISTICS
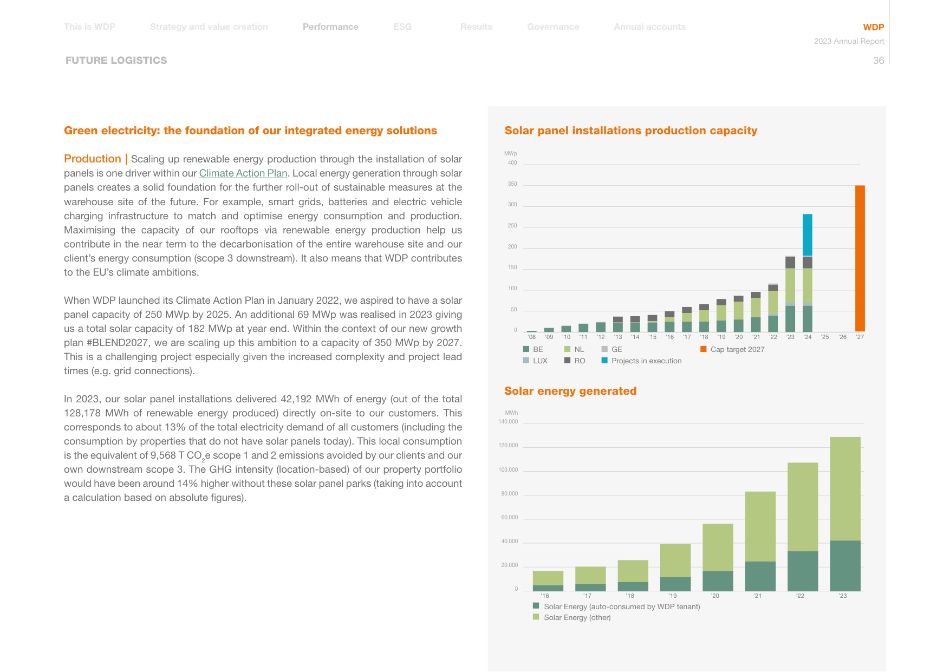
Cap target 2027 '24 '25 '26 '27 '23 '22 '21 '20 '19 '18 '17 '16 '15 '14 '13 '12 '11 '10 '09 '08 400 350 300 250 200 150 100 50 0 MWp BE LUX NL RO GE Projects in execution '16 '17 '18 '19 '20 '21 '22 '23 140.000 120.000 100.000 80.000 60.000 40.000 20.000 0 MWh Solar Energy (other) Solar Energy (auto-consumed by WDP tenant) Annual accounts Governance Results Performance Strategy and value creation This is WDP ESG WDP 2023 Annual Report 36 FUTURE LOGISTICS Green electricity: the foundation of our integrated energy solutions Production | Scaling up renewable energy production through the installation of solar panels is one driver within our Climate Action Plan. Local energy generation through solar panels creates a solid foundation for the further roll-out of sustainable measures at the warehouse site of the future. For example, smart grids, batteries and electric vehicle charging infrastructure to match and optimise energy consumption and production. Maximising the capacity of our rooftops via renewable energy production help us contribute in the near term to the decarbonisation of the entire warehouse site and our client's energy consumption (scope 3 downstream). It also means that WDP contributes to the EU's climate ambitions. When WDP launched its Climate Action Plan in January 2022, we aspired to have a solar panel capacity of 250 MWp by 2025. An additional 69 MWp was realised in 2023 giving us a total solar capacity of 182 MWp at year end. Within the context of our new growth plan #BLEND2027, we are scaling up this ambition to a capacity of 350 MWp by 2027. This is a challenging project especially given the increased complexity and project lead times (e.g. grid connections). In 2023, our solar panel installations delivered 42,192 MWh of energy (out of the total 128,178 MWh of renewable energy produced) directly on-site to our customers. This corresponds to about 13% of the total electricity demand of all customers (including the consumption by properties that do not have solar panels today). This local consumption is the equivalent of 9,568 T CO2e scope 1 and 2 emissions avoided by our clients and our own downstream scope 3. The GHG intensity (location-based) of our property portfolio would have been around 14% higher without these solar panel parks (taking into account a calculation based on absolute figures). Solar panel installations production capacity Solar energy generated
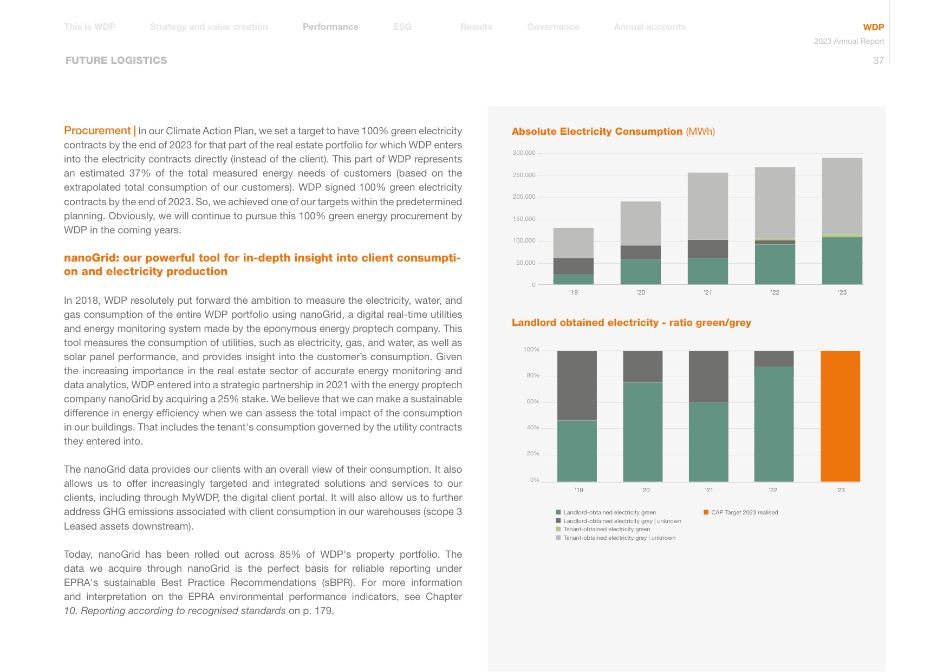
Annual accounts Governance Results Performance Strategy and value creation This is WDP ESG WDP 2023 Annual Report 37 FUTURE LOGISTICS Procurement | In our Climate Action Plan, we set a target to have 100% green electricity contracts by the end of 2023 for that part of the real estate portfolio for which WDP enters into the electricity contracts directly (instead of the client). This part of WDP represents an estimated 37% of the total measured energy needs of customers (based on the extrapolated total consumption of our customers). WDP signed 100% green electricity contracts by the end of 2023. So, we achieved one of our targets within the predetermined planning. Obviously, we will continue to pursue this 100% green energy procurement by WDP in the coming years. nanoGrid: our powerful tool for in-depth insight into client consumpti- on and electricity production In 2018, WDP resolutely put forward the ambition to measure the electricity, water, and gas consumption of the entire WDP portfolio using nanoGrid, a digital real-time utilities and energy monitoring system made by the eponymous energy proptech company. This tool measures the consumption of utilities, such as electricity, gas, and water, as well as solar panel performance, and provides insight into the customer's consumption. Given the increasing importance in the real estate sector of accurate energy monitoring and data analytics, WDP entered into a strategic partnership in 2021 with the energy proptech company nanoGrid by acquiring a 25% stake. We believe that we can make a sustainable difference in energy efficiency when we can assess the total impact of the consumption in our buildings. That includes the tenant's consumption governed by the utility contracts they entered into. The nanoGrid data provides our clients with an overall view of their consumption. It also allows us to offer increasingly targeted and integrated solutions and services to our clients, including through MyWDP, the digital client portal. It will also allow us to further address GHG emissions associated with client consumption in our warehouses (scope 3 Leased assets downstream). Today, nanoGrid has been rolled out across 85% of WDP's property portfolio. The data we acquire through nanoGrid is the perfect basis for reliable reporting under EPRA's sustainable Best Practice Recommendations (sBPR). For more information and interpretation on the EPRA environmental performance indicators, see Chapter 10. Reporting according to recognised standards on p. 179. Landlord obtained electricity - ratio green/grey Absolute Electricity Consumption (MWh) '19 '20 '21 '22 '23 100% 80% 60% 40% 20% 0% Landlord-obtained electricity green Landlord-obtained electricity grey | unknown Tenant-obtained electricity green Tenant-obtained electricity grey | unknown CAP Target 2023 realised '20 '19 '21 '22 '23 300,000 250,000 200,000 150,000 100,000 50,000 0
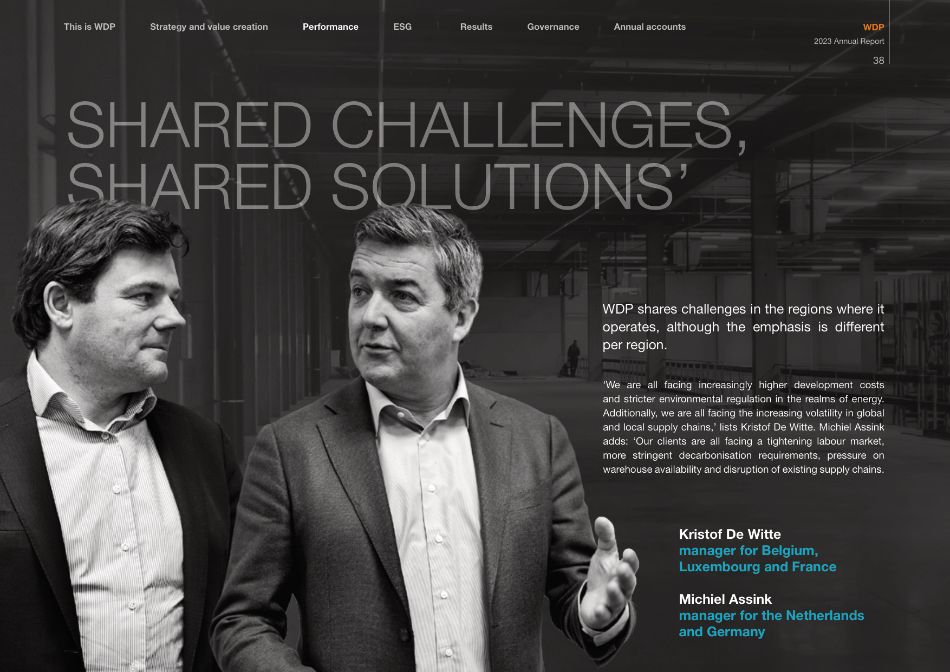
WDP shares challenges in the regions where it operates, although the emphasis is different per region. 'We are all facing increasingly higher development costs and stricter environmental regulation in the realms of energy. Additionally, we are all facing the increasing volatility in global and local supply chains,' lists Kristof De Witte. Michiel Assink adds: 'Our clients are all facing a tightening labour market, more stringent decarbonisation requirements, pressure on warehouse availability and disruption of existing supply chains. Kristof De Witte manager for Belgium, Luxembourg and France Michiel Assink manager for the Netherlands and Germany SHARED CHALLENGES, SHARED SOLUTIONS' Annual accounts Governance Results Performance Strategy and value creation This is WDP ESG WDP 2023 Annual Report 38
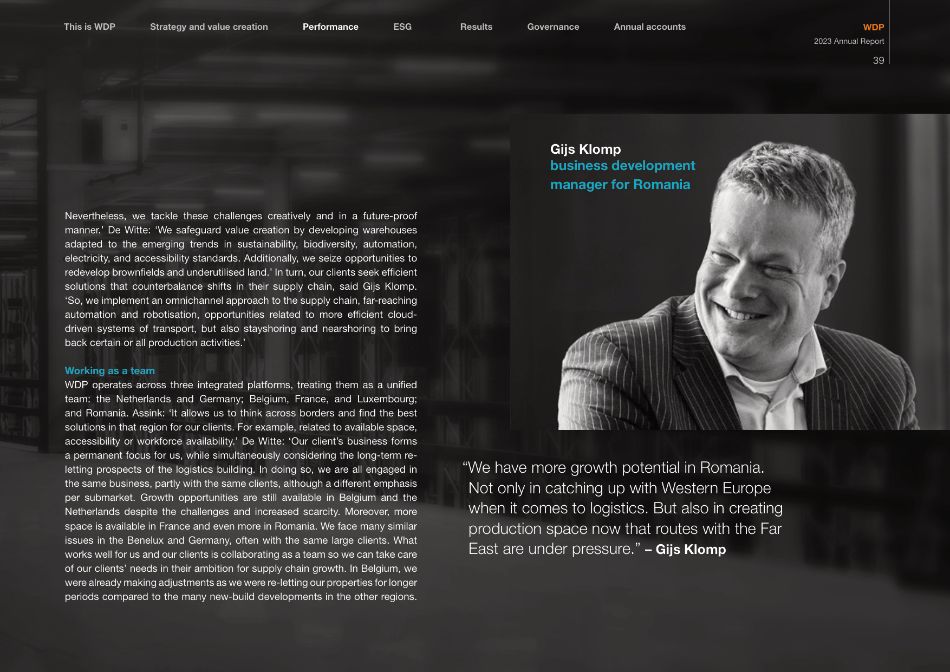
Nevertheless, we tackle these challenges creatively and in a future-proof manner.' De Witte: 'We safeguard value creation by developing warehouses adapted to the emerging trends in sustainability, biodiversity, automation, electricity, and accessibility standards. Additionally, we seize opportunities to redevelop brownfields and underutilised land.' In turn, our clients seek efficient solutions that counterbalance shifts in their supply chain, said Gijs Klomp. 'So, we implement an omnichannel approach to the supply chain, far-reaching automation and robotisation, opportunities related to more efficient cloud- driven systems of transport, but also stayshoring and nearshoring to bring back certain or all production activities.' Working as a team WDP operates across three integrated platforms, treating them as a unified team: the Netherlands and Germany; Belgium, France, and Luxembourg; and Romania. Assink: 'It allows us to think across borders and find the best solutions in that region for our clients. For example, related to available space, accessibility or workforce availability.' De Witte: 'Our client's business forms a permanent focus for us, while simultaneously considering the long-term re- letting prospects of the logistics building. In doing so, we are all engaged in the same business, partly with the same clients, although a different emphasis per submarket. Growth opportunities are still available in Belgium and the Netherlands despite the challenges and increased scarcity. Moreover, more space is available in France and even more in Romania. We face many similar issues in the Benelux and Germany, often with the same large clients. What works well for us and our clients is collaborating as a team so we can take care of our clients' needs in their ambition for supply chain growth. In Belgium, we were already making adjustments as we were re-letting our properties for longer periods compared to the many new-build developments in the other regions. "We have more growth potential in Romania. Not only in catching up with Western Europe when it comes to logistics. But also in creating production space now that routes with the Far East are under pressure." – Gijs Klomp Annual accounts Governance Results Performance Strategy and value creation This is WDP ESG WDP 2023 Annual Report 39 Gijs Klomp business development manager for Romania
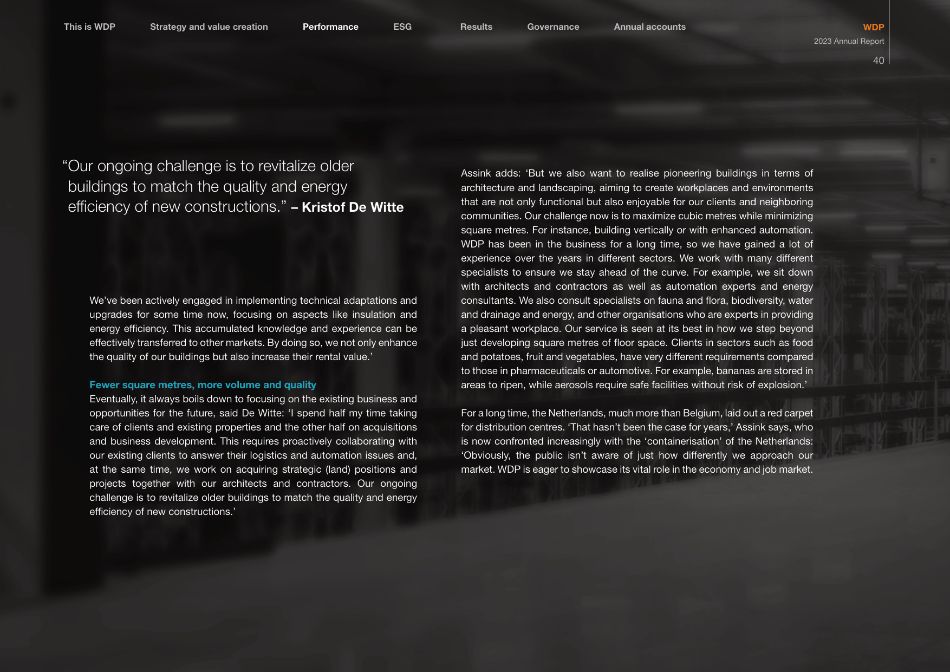
We've been actively engaged in implementing technical adaptations and upgrades for some time now, focusing on aspects like insulation and energy efficiency. This accumulated knowledge and experience can be effectively transferred to other markets. By doing so, we not only enhance the quality of our buildings but also increase their rental value.' Fewer square metres, more volume and quality Eventually, it always boils down to focusing on the existing business and opportunities for the future, said De Witte: 'I spend half my time taking care of clients and existing properties and the other half on acquisitions and business development. This requires proactively collaborating with our existing clients to answer their logistics and automation issues and, at the same time, we work on acquiring strategic (land) positions and projects together with our architects and contractors. Our ongoing challenge is to revitalize older buildings to match the quality and energy efficiency of new constructions.' Assink adds: 'But we also want to realise pioneering buildings in terms of architecture and landscaping, aiming to create workplaces and environments that are not only functional but also enjoyable for our clients and neighboring communities. Our challenge now is to maximize cubic metres while minimizing square metres. For instance, building vertically or with enhanced automation. WDP has been in the business for a long time, so we have gained a lot of experience over the years in different sectors. We work with many different specialists to ensure we stay ahead of the curve. For example, we sit down with architects and contractors as well as automation experts and energy consultants. We also consult specialists on fauna and flora, biodiversity, water and drainage and energy, and other organisations who are experts in providing a pleasant workplace. Our service is seen at its best in how we step beyond just developing square metres of floor space. Clients in sectors such as food and potatoes, fruit and vegetables, have very different requirements compared to those in pharmaceuticals or automotive. For example, bananas are stored in areas to ripen, while aerosols require safe facilities without risk of explosion.' For a long time, the Netherlands, much more than Belgium, laid out a red carpet for distribution centres. 'That hasn't been the case for years,' Assink says, who is now confronted increasingly with the 'containerisation' of the Netherlands: 'Obviously, the public isn't aware of just how differently we approach our market. WDP is eager to showcase its vital role in the economy and job market. "Our ongoing challenge is to revitalize older buildings to match the quality and energy efficiency of new constructions." – Kristof De Witte Annual accounts Governance Results Performance Strategy and value creation This is WDP ESG WDP 2023 Annual Report 40
"Collaborating with specialists in flora and fauna, biodiversity, water and drainage and energy, and partnering with companies that excel in creating a pleasant workplace. Our service is seen at its best in how we step beyond just developing square metres." – Michiel Assink Shorter lines, more growth potential Gijs Klomp discusses the challenges faced in Romania, highlighting both similarities and unique aspects compared to Western Europe. We recognize the significant growth potential in Romania, not only in catching up with Western Europe in terms of logistics infrastructure but also in meeting the increasing demand for production space, particularly as routes with the Far East come under pressure. We're observing a trend towards so-called friendshoring and nearshoring, where companies establish themselves in more favourable business environments for production and distribution. Risks have increased greatly due to supply chain disruption. For example, problems at the Suez Canal and caused by the war in Ukraine, have amplified the need for companies to localise their logistics and production closer to their markets. Production may require specific technical knowledge in our team, for example, manufacturing knowledge for large automotive suppliers. In Romania, there is less pressure to reduce costs with automation because labour costs are lower. At the same time, we also see the labour market tightening, which increases labour costs. Besides the availability of land, the communication lines with government are also considerably shorter than those in the Netherlands and Belgium. This enables faster decision-making.' Every stakeholder matters 'I know that many people have no idea what goes on in our clients' warehouses,' says Assink. 'We've all seen this. At WDP, we spend all day looking into the inner workings of great companies like Alliance Health Care, DHL, Unilever, Albert Heijn, BOL., Wehkamp and Medtronic. Our role extends far beyond merely leasing grey boxes. We are a developer/end-investor with a long- term horizon for further expanding the operations of these companies and our clients. The redevelopment and optimisation of our existing portfolio are not only logical but essential. These efforts not only enhance the aesthetic appeal and biodiversity of our sites but also contribute to their sustainability through the integration of solar panels and electric vehicle charging points. We have a dedicated team to ensure the proper maintenance of these facilities. In addition to our internal efforts, we actively engage with local communities by participating in town council meetings, in cooperation with other partners, such as the Dutch Industrial & Logistics Association (DILAS), a collaboration of innovative and sustainable stakeholders in the logistics and industrial property chain in the Netherlands or LogVil in Flanders.' 'Because the environment around our premises and the people who live there are just as important,' add De Witte and Klomp. Annual accounts Governance Results Performance Strategy and value creation This is WDP ESG WDP 2023 Annual Report 41
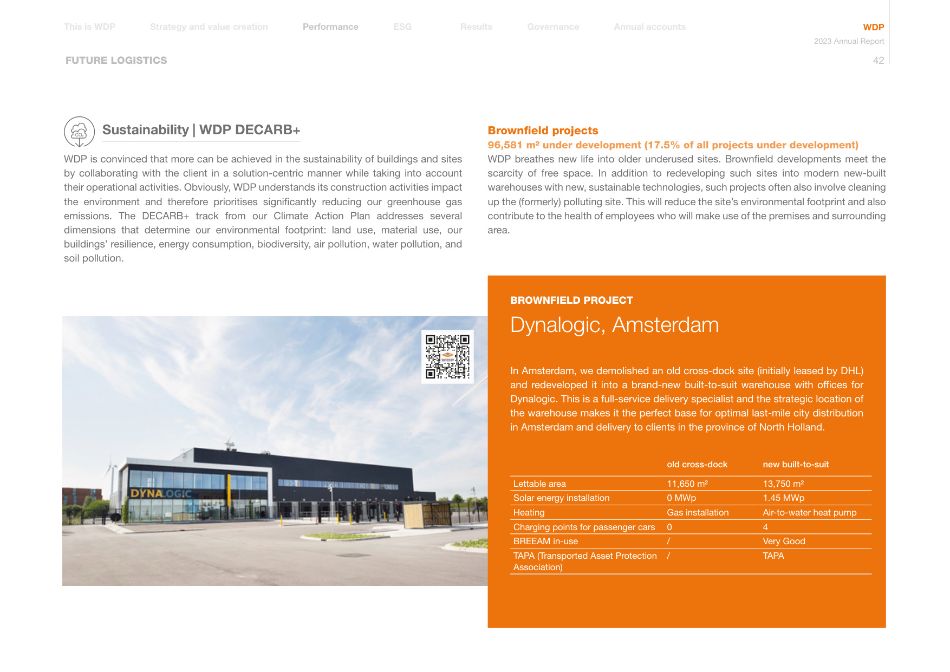
Annual accounts Governance Results Performance Strategy and value creation This is WDP ESG WDP 2023 Annual Report 42 FUTURE LOGISTICS Sustainability | WDP DECARB+ WDP is convinced that more can be achieved in the sustainability of buildings and sites by collaborating with the client in a solution-centric manner while taking into account their operational activities. Obviously, WDP understands its construction activities impact the environment and therefore prioritises significantly reducing our greenhouse gas emissions. The DECARB+ track from our Climate Action Plan addresses several dimensions that determine our environmental footprint: land use, material use, our buildings' resilience, energy consumption, biodiversity, air pollution, water pollution, and soil pollution. Dynalogic, Amsterdam BROWNFIELD PROJECT In Amsterdam, we demolished an old cross-dock site (initially leased by DHL) and redeveloped it into a brand-new built-to-suit warehouse with offices for Dynalogic. This is a full-service delivery specialist and the strategic location of the warehouse makes it the perfect base for optimal last-mile city distribution in Amsterdam and delivery to clients in the province of North Holland. old cross-dock new built-to-suit Lettable area 11,650 m² 13,750 m² Solar energy installation 0 MWp 1.45 MWp Heating Gas installation Air-to-water heat pump Charging points for passenger cars 0 4 BREEAM in-use / Very Good TAPA (Transported Asset Protection Association) / TAPA Brownfield projects 96,581 m² under development (17.5% of all projects under development) WDP breathes new life into older underused sites. Brownfield developments meet the scarcity of free space. In addition to redeveloping such sites into modern new-built warehouses with new, sustainable technologies, such projects often also involve cleaning up the (formerly) polluting site. This will reduce the site's environmental footprint and also contribute to the health of employees who will make use of the premises and surrounding area.
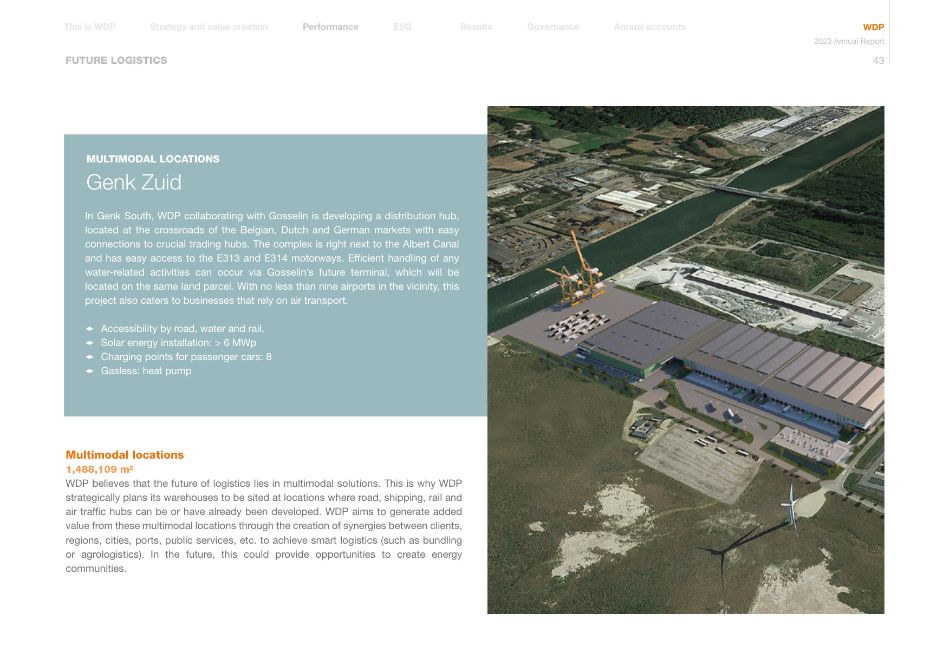
Annual accounts Governance Results Performance Strategy and value creation This is WDP ESG WDP 2023 Annual Report 43 Genk Zuid MULTIMODAL LOCATIONS Multimodal locations 1,488,109 m² WDP believes that the future of logistics lies in multimodal solutions. This is why WDP strategically plans its warehouses to be sited at locations where road, shipping, rail and air traffic hubs can be or have already been developed. WDP aims to generate added value from these multimodal locations through the creation of synergies between clients, regions, cities, ports, public services, etc. to achieve smart logistics (such as bundling or agrologistics). In the future, this could provide opportunities to create energy communities. FUTURE LOGISTICS In Genk South, WDP collaborating with Gosselin is developing a distribution hub, located at the crossroads of the Belgian, Dutch and German markets with easy connections to crucial trading hubs. The complex is right next to the Albert Canal and has easy access to the E313 and E314 motorways. Efficient handling of any water-related activities can occur via Gosselin's future terminal, which will be located on the same land parcel. With no less than nine airports in the vicinity, this project also caters to businesses that rely on air transport. 1 Accessibility by road, water and rail. 1 Solar energy installation: > 6 MWp 1 Charging points for passenger cars: 8 1 Gasless: heat pump
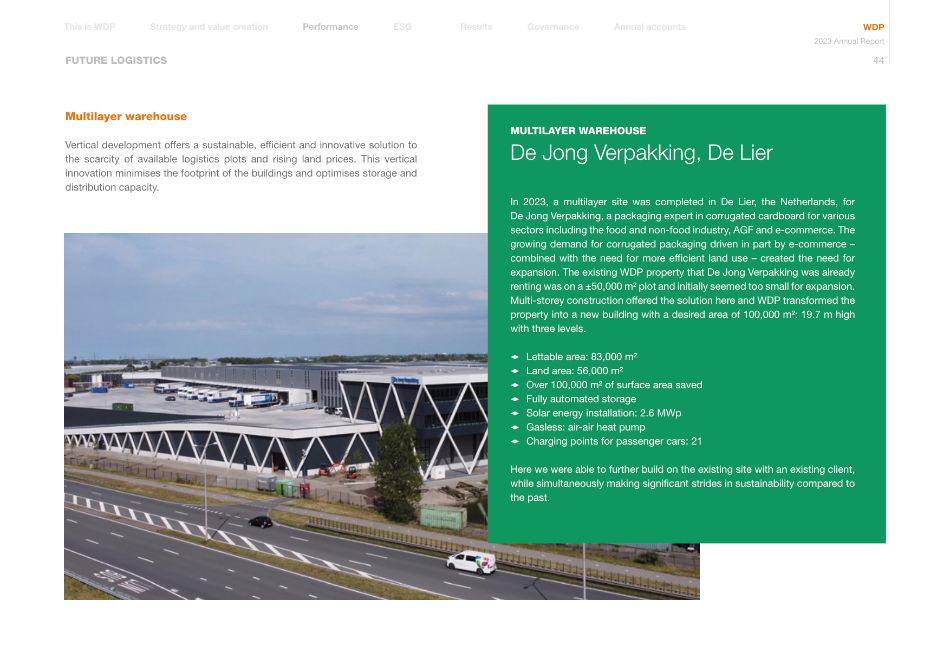
Annual accounts Governance Results Performance Strategy and value creation This is WDP ESG WDP 2023 Annual Report 44 De Jong Verpakking, De Lier MULTILAYER WAREHOUSE In 2023, a multilayer site was completed in De Lier, the Netherlands, for De Jong Verpakking, a packaging expert in corrugated cardboard for various sectors including the food and non-food industry, AGF and e-commerce. The growing demand for corrugated packaging driven in part by e-commerce – combined with the need for more efficient land use – created the need for expansion. The existing WDP property that De Jong Verpakking was already renting was on a ±50,000 m² plot and initially seemed too small for expansion. Multi-storey construction offered the solution here and WDP transformed the property into a new building with a desired area of 100,000 m²: 19.7 m high with three levels. 1 Lettable area: 83,000 m² 1 Land area: 56,000 m² 1 Over 100,000 m² of surface area saved 1 Fully automated storage 1 Solar energy installation: 2.6 MWp 1 Gasless: air-air heat pump 1 Charging points for passenger cars: 21 Here we were able to further build on the existing site with an existing client, while simultaneously making significant strides in sustainability compared to the past. Multilayer warehouse Vertical development offers a sustainable, efficient and innovative solution to the scarcity of available logistics plots and rising land prices. This vertical innovation minimises the footprint of the buildings and optimises storage and distribution capacity. FUTURE LOGISTICS
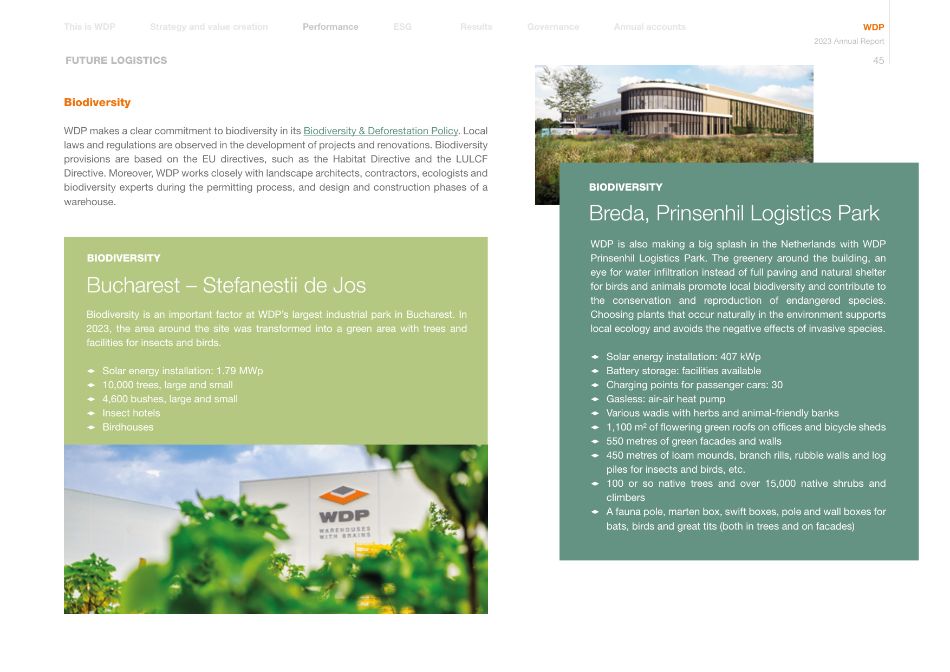
Annual accounts Governance Results Performance Strategy and value creation This is WDP ESG WDP 2023 Annual Report 45 Bucharest – Stefanestii de Jos BIODIVERSITY Biodiversity is an important factor at WDP's largest industrial park in Bucharest. In 2023, the area around the site was transformed into a green area with trees and facilities for insects and birds. 1 Solar energy installation: 1.79 MWp 1 10,000 trees, large and small 1 4,600 bushes, large and small 1 Insect hotels 1 Birdhouses Biodiversity WDP makes a clear commitment to biodiversity in its Biodiversity & Deforestation Policy. Local laws and regulations are observed in the development of projects and renovations. Biodiversity provisions are based on the EU directives, such as the Habitat Directive and the LULCF Directive. Moreover, WDP works closely with landscape architects, contractors, ecologists and biodiversity experts during the permitting process, and design and construction phases of a warehouse. Breda, Prinsenhil Logistics Park BIODIVERSITY WDP is also making a big splash in the Netherlands with WDP Prinsenhil Logistics Park. The greenery around the building, an eye for water infiltration instead of full paving and natural shelter for birds and animals promote local biodiversity and contribute to the conservation and reproduction of endangered species. Choosing plants that occur naturally in the environment supports local ecology and avoids the negative effects of invasive species. 1 Solar energy installation: 407 kWp 1 Battery storage: facilities available 1 Charging points for passenger cars: 30 1 Gasless: air-air heat pump 1 Various wadis with herbs and animal-friendly banks 1 1,100 m² of flowering green roofs on offices and bicycle sheds 1 550 metres of green facades and walls 1 450 metres of loam mounds, branch rills, rubble walls and log piles for insects and birds, etc. 1 100 or so native trees and over 15,000 native shrubs and climbers 1 A fauna pole, marten box, swift boxes, pole and wall boxes for bats, birds and great tits (both in trees and on facades) FUTURE LOGISTICS
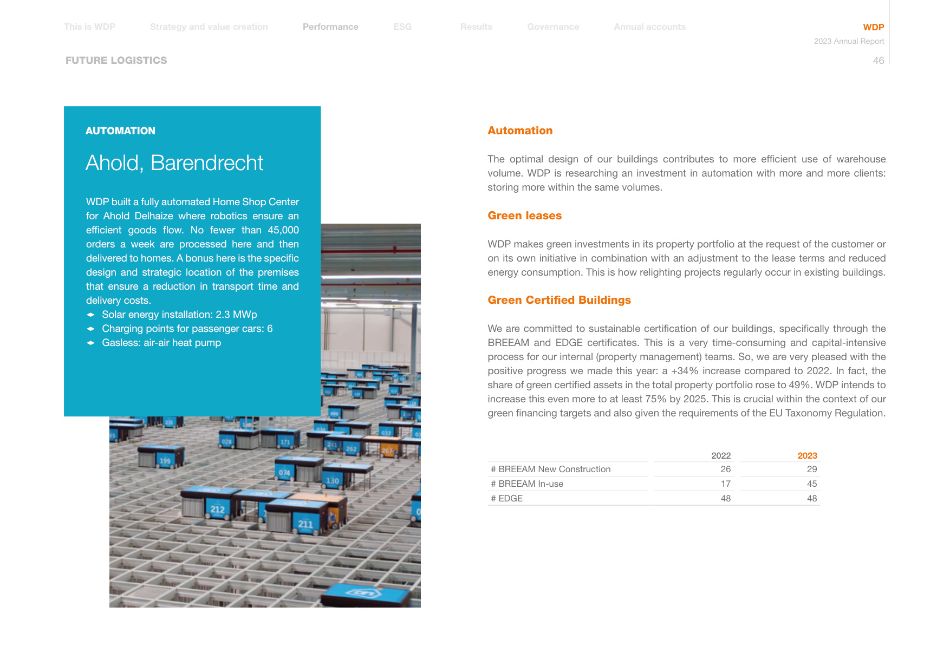
Annual accounts Governance Results Performance Strategy and value creation This is WDP ESG WDP 2023 Annual Report 46 FUTURE LOGISTICS Automation The optimal design of our buildings contributes to more efficient use of warehouse volume. WDP is researching an investment in automation with more and more clients: storing more within the same volumes. Ahold, Barendrecht AUTOMATION WDP built a fully automated Home Shop Center for Ahold Delhaize where robotics ensure an efficient goods flow. No fewer than 45,000 orders a week are processed here and then delivered to homes. A bonus here is the specific design and strategic location of the premises that ensure a reduction in transport time and delivery costs. 1 Solar energy installation: 2.3 MWp 1 Charging points for passenger cars: 6 1 Gasless: air-air heat pump Green leases WDP makes green investments in its property portfolio at the request of the customer or on its own initiative in combination with an adjustment to the lease terms and reduced energy consumption. This is how relighting projects regularly occur in existing buildings. Green Certified Buildings We are committed to sustainable certification of our buildings, specifically through the BREEAM and EDGE certificates. This is a very time-consuming and capital-intensive process for our internal (property management) teams. So, we are very pleased with the positive progress we made this year: a +34% increase compared to 2022. In fact, the share of green certified assets in the total property portfolio rose to 49%. WDP intends to increase this even more to at least 75% by 2025. This is crucial within the context of our green financing targets and also given the requirements of the EU Taxonomy Regulation. 2022 2023 # BREEAM New Construction 26 29 # BREEAM In-use 17 45 # EDGE 48 48
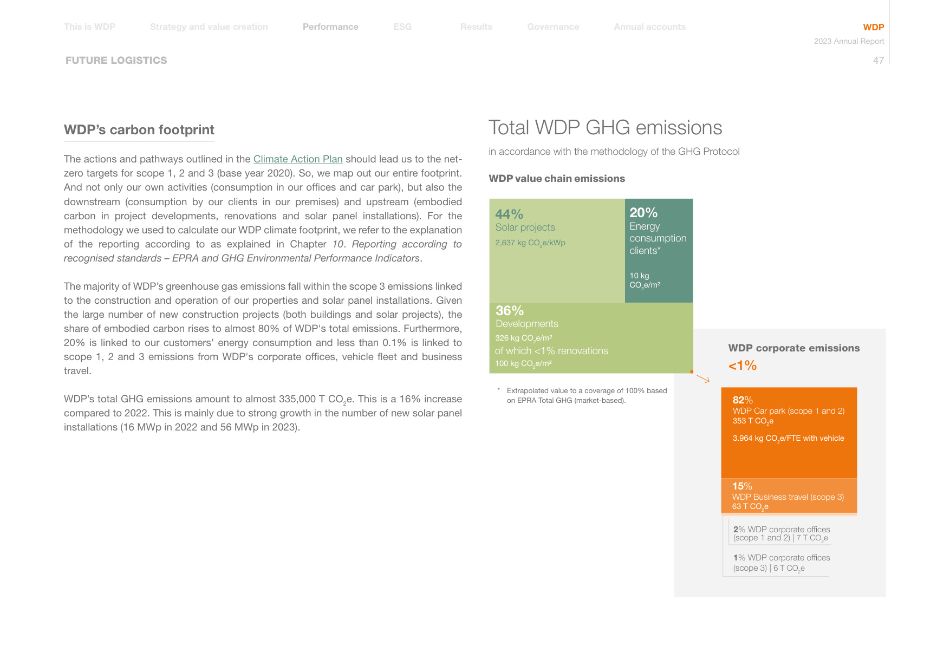
Annual accounts Governance Results Performance Strategy and value creation This is WDP ESG WDP 2023 Annual Report 47 WDP's carbon footprint The actions and pathways outlined in the Climate Action Plan should lead us to the net- zero targets for scope 1, 2 and 3 (base year 2020). So, we map out our entire footprint. And not only our own activities (consumption in our offices and car park), but also the downstream (consumption by our clients in our premises) and upstream (embodied carbon in project developments, renovations and solar panel installations). For the methodology we used to calculate our WDP climate footprint, we refer to the explanation of the reporting according to as explained in Chapter 10. Reporting according to recognised standards – EPRA and GHG Environmental Performance Indicators. The majority of WDP's greenhouse gas emissions fall within the scope 3 emissions linked to the construction and operation of our properties and solar panel installations. Given the large number of new construction projects (both buildings and solar projects), the share of embodied carbon rises to almost 80% of WDP's total emissions. Furthermore, 20% is linked to our customers' energy consumption and less than 0.1% is linked to scope 1, 2 and 3 emissions from WDP's corporate offices, vehicle fleet and business travel. WDP's total GHG emissions amount to almost 335,000 T CO2e. This is a 16% increase compared to 2022. This is mainly due to strong growth in the number of new solar panel installations (16 MWp in 2022 and 56 MWp in 2023). FUTURE LOGISTICS 82% WDP Car park (scope 1 and 2) 353 T CO2e 3.964 kg CO2e/FTE with vehicle 2% WDP corporate offices (scope 1 and 2) | 7 T CO2e 1% WDP corporate offices (scope 3) | 6 T CO2e 36% Developments of which <1% renovations 100 kg CO2e/m² 44% Solar projects 20% Energy consumption clients* 2,637 kg CO2e/kWp 10 kg CO2e/m² 326 kg CO2e/m² 15% WDP Business travel (scope 3) 63 T CO2e <1% WDP corporate emissions Total WDP GHG emissions in accordance with the methodology of the GHG Protocol WDP value chain emissions * Extrapolated value to a coverage of 100% based on EPRA Total GHG (market-based).
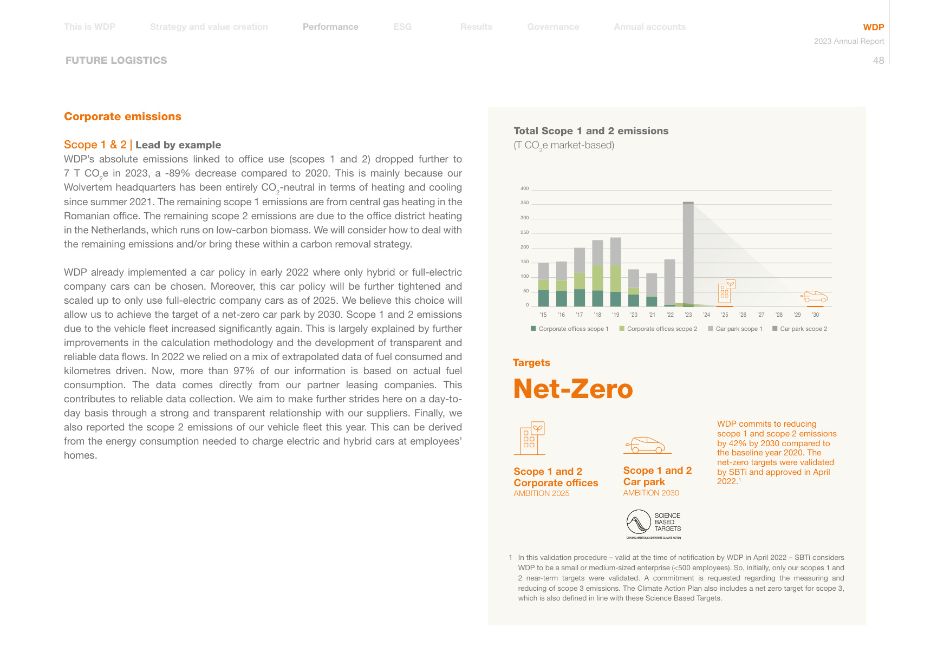
Annual accounts Governance Results Performance Strategy and value creation This is WDP ESG WDP 2023 Annual Report 48 FUTURE LOGISTICS Corporate emissions Scope 1 & 2 | Lead by example WDP's absolute emissions linked to office use (scopes 1 and 2) dropped further to 7 T CO2e in 2023, a -89% decrease compared to 2020. This is mainly because our Wolvertem headquarters has been entirely CO2-neutral in terms of heating and cooling since summer 2021. The remaining scope 1 emissions are from central gas heating in the Romanian office. The remaining scope 2 emissions are due to the office district heating in the Netherlands, which runs on low-carbon biomass. We will consider how to deal with the remaining emissions and/or bring these within a carbon removal strategy. WDP already implemented a car policy in early 2022 where only hybrid or full-electric company cars can be chosen. Moreover, this car policy will be further tightened and scaled up to only use full-electric company cars as of 2025. We believe this choice will allow us to achieve the target of a net-zero car park by 2030. Scope 1 and 2 emissions due to the vehicle fleet increased significantly again. This is largely explained by further improvements in the calculation methodology and the development of transparent and reliable data flows. In 2022 we relied on a mix of extrapolated data of fuel consumed and kilometres driven. Now, more than 97% of our information is based on actual fuel consumption. The data comes directly from our partner leasing companies. This contributes to reliable data collection. We aim to make further strides here on a day-to- day basis through a strong and transparent relationship with our suppliers. Finally, we also reported the scope 2 emissions of our vehicle fleet this year. This can be derived from the energy consumption needed to charge electric and hybrid cars at employees' homes. Total Scope 1 and 2 emissions (T CO2e market-based) Targets Scope 1 and 2 Car park AMBITION 2030 Net-Zero Scope 1 and 2 Corporate offices AMBITION 2025 WDP commits to reducing scope 1 and scope 2 emissions by 42% by 2030 compared to the baseline year 2020. The net-zero targets were validated by SBTi and approved in April 2022.1 1 In this validation procedure – valid at the time of notification by WDP in April 2022 – SBTi considers WDP to be a small or medium-sized enterprise (<500 employees). So, initially, only our scopes 1 and 2 near-term targets were validated. A commitment is requested regarding the measuring and reducing of scope 3 emissions. The Climate Action Plan also includes a net zero target for scope 3, which is also defined in line with these Science Based Targets. Corporate offices scope 1 Corporate offices scope 2 '15 '16 '17 '18 '19 '20 '21 Car park scope 2 Car park scope 1 '22 '23 '24 '25 '26 '27 '28 '29 '30 400 350 300 250 200 150 100 50 0
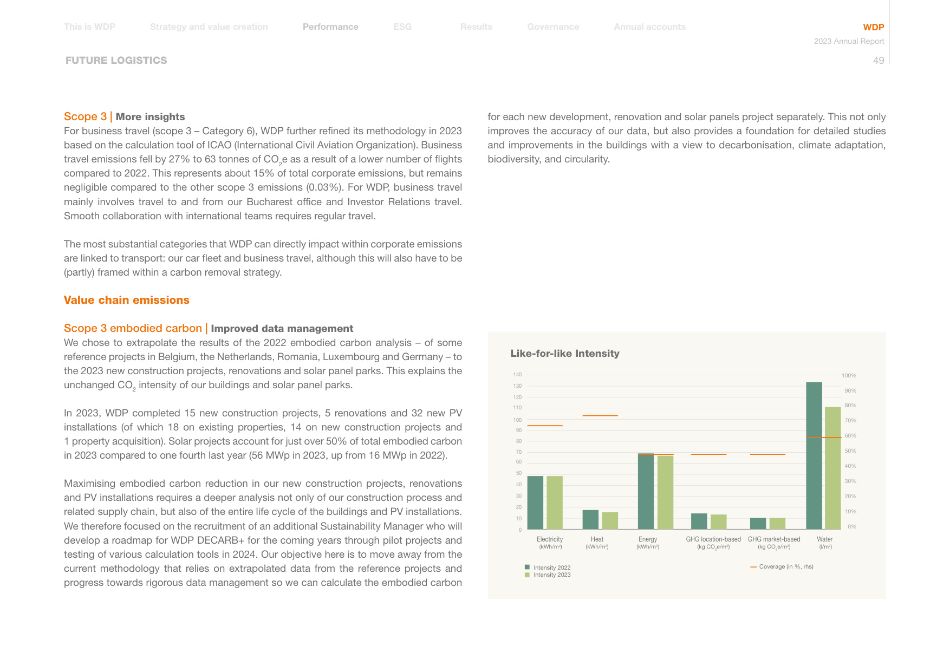
Annual accounts Governance Results Performance Strategy and value creation This is WDP ESG WDP 2023 Annual Report 49 FUTURE LOGISTICS Scope 3 | More insights For business travel (scope 3 – Category 6), WDP further refined its methodology in 2023 based on the calculation tool of ICAO (International Civil Aviation Organization). Business travel emissions fell by 27% to 63 tonnes of CO2e as a result of a lower number of flights compared to 2022. This represents about 15% of total corporate emissions, but remains negligible compared to the other scope 3 emissions (0.03%). For WDP, business travel mainly involves travel to and from our Bucharest office and Investor Relations travel. Smooth collaboration with international teams requires regular travel. The most substantial categories that WDP can directly impact within corporate emissions are linked to transport: our car fleet and business travel, although this will also have to be (partly) framed within a carbon removal strategy. Value chain emissions Scope 3 embodied carbon | Improved data management We chose to extrapolate the results of the 2022 embodied carbon analysis – of some reference projects in Belgium, the Netherlands, Romania, Luxembourg and Germany – to the 2023 new construction projects, renovations and solar panel parks. This explains the unchanged CO2 intensity of our buildings and solar panel parks. In 2023, WDP completed 15 new construction projects, 5 renovations and 32 new PV installations (of which 18 on existing properties, 14 on new construction projects and 1 property acquisition). Solar projects account for just over 50% of total embodied carbon in 2023 compared to one fourth last year (56 MWp in 2023, up from 16 MWp in 2022). Maximising embodied carbon reduction in our new construction projects, renovations and PV installations requires a deeper analysis not only of our construction process and related supply chain, but also of the entire life cycle of the buildings and PV installations. We therefore focused on the recruitment of an additional Sustainability Manager who will develop a roadmap for WDP DECARB+ for the coming years through pilot projects and testing of various calculation tools in 2024. Our objective here is to move away from the current methodology that relies on extrapolated data from the reference projects and progress towards rigorous data management so we can calculate the embodied carbon for each new development, renovation and solar panels project separately. This not only improves the accuracy of our data, but also provides a foundation for detailed studies and improvements in the buildings with a view to decarbonisation, climate adaptation, biodiversity, and circularity. 0 10 20 30 40 50 60 70 80 90 100 110 120 130 140 Electricity (kWh/m2) Heat (kWh/m2) Energy (kWh/m2) GHG location-based (kg CO2e/m2) GHG market-based (kg CO2e/m2) Water (l/m2) 100% 90% 80% 70% 60% 50% 40% 30% 20% 10% 0% Intensity 2022 Intensity 2023 Like-for-like Intensity Coverage (in %, rhs)
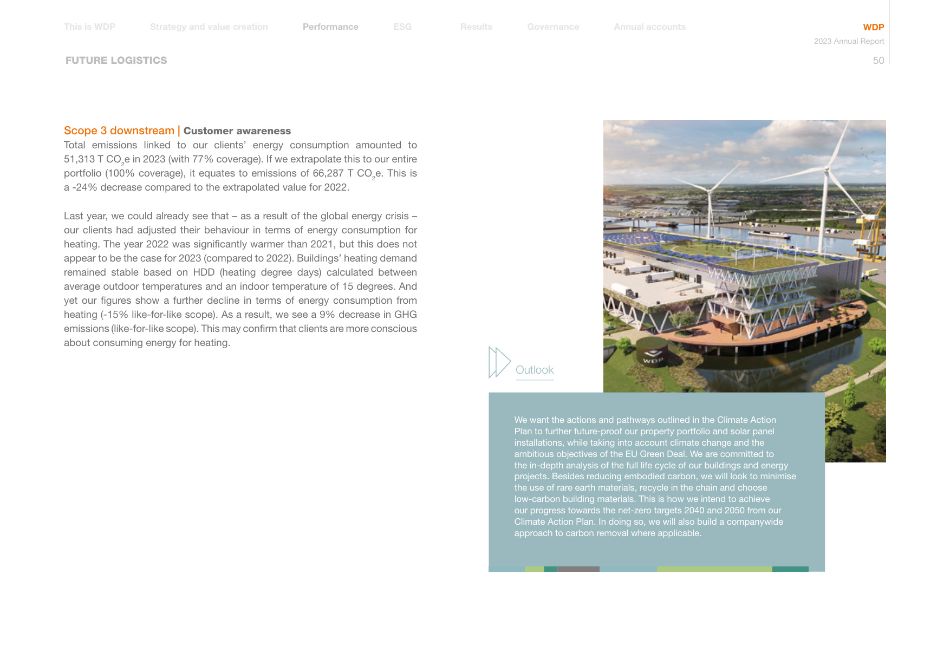
Annual accounts Governance Results Performance Strategy and value creation This is WDP ESG WDP 2023 Annual Report 50 FUTURE LOGISTICS Outlook We want the actions and pathways outlined in the Climate Action Plan to further future-proof our property portfolio and solar panel installations, while taking into account climate change and the ambitious objectives of the EU Green Deal. We are committed to the in-depth analysis of the full life cycle of our buildings and energy projects. Besides reducing embodied carbon, we will look to minimise the use of rare earth materials, recycle in the chain and choose low-carbon building materials. This is how we intend to achieve our progress towards the net-zero targets 2040 and 2050 from our Climate Action Plan. In doing so, we will also build a companywide approach to carbon removal where applicable. Scope 3 downstream | Customer awareness Total emissions linked to our clients' energy consumption amounted to 51,313 T CO2e in 2023 (with 77% coverage). If we extrapolate this to our entire portfolio (100% coverage), it equates to emissions of 66,287 T CO2e. This is a -24% decrease compared to the extrapolated value for 2022. Last year, we could already see that – as a result of the global energy crisis – our clients had adjusted their behaviour in terms of energy consumption for heating. The year 2022 was significantly warmer than 2021, but this does not appear to be the case for 2023 (compared to 2022). Buildings' heating demand remained stable based on HDD (heating degree days) calculated between average outdoor temperatures and an indoor temperature of 15 degrees. And yet our figures show a further decline in terms of energy consumption from heating (-15% like-for-like scope). As a result, we see a 9% decrease in GHG emissions (like-for-like scope). This may confirm that clients are more conscious about consuming energy for heating.
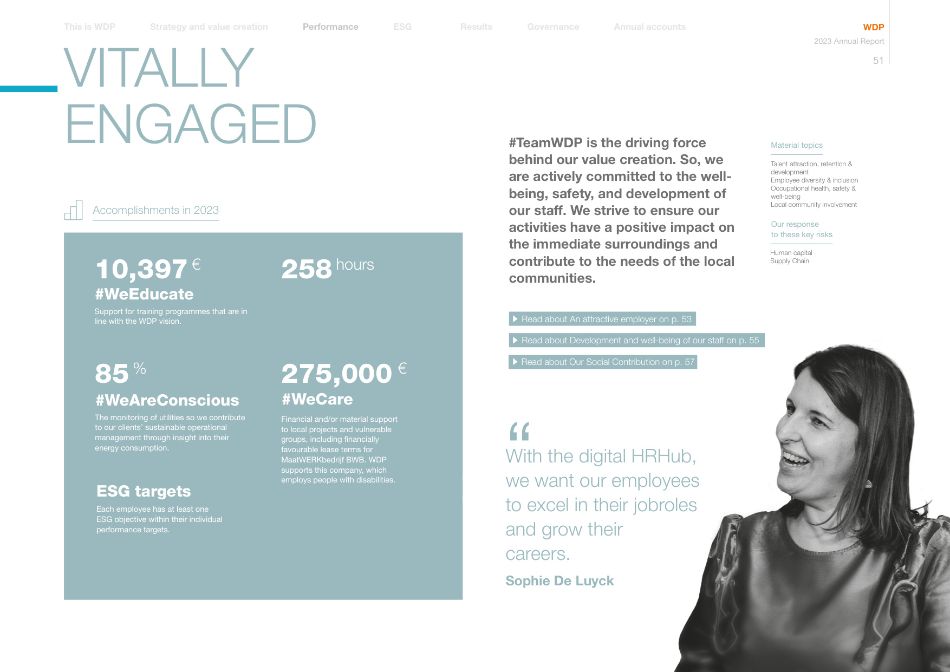
Annual accounts Governance Results Performance Strategy and value creation This is WDP ESG WDP 2023 Annual Report 51 VITALLY ENGAGED " With the digital HRHub, we want our employees to excel in their jobroles and grow their careers. Read about Development and well-being of our staff on p. 55 Read about Our Social Contribution on p. 57 Accomplishments in 2023 10,397 € 258 hours Support for training programmes that are in line with the WDP vision. #WeEducate 275,000 € #WeCare Each employee has at least one ESG objective within their individual performance targets. ESG targets Material topics Talent attraction, retention & development Employee diversity & inclusion Occupational health, safety & well-being Local community involvement Human capital Supply Chain Read about An attractive employer on p. 53 The monitoring of utilities so we contribute to our clients' sustainable operational management through insight into their energy consumption. #WeAreConscious 85 % Financial and/or material support to local projects and vulnerable groups, including financially favourable lease terms for MaatWERKbedrijf BWB. WDP supports this company, which employs people with disabilities. Our response to these key risks #TeamWDP is the driving force behind our value creation. So, we are actively committed to the well- being, safety, and development of our staff. We strive to ensure our activities have a positive impact on the immediate surroundings and contribute to the needs of the local communities. Sophie De Luyck

Annual accounts Governance Results Performance Strategy and value creation This is WDP ESG WDP 2023 Annual Report 52 VITALLY ENGAGED Objectives Satisfaction score AMBITION 2024 Employee satisfaction & engagement Annual audit AMBITION 2024 For existing WDP properties, projects or offices Psychosocial risk analysis AMBITION 2024 Further roll-out of the action plan 8 /10 #WeEducate AMBITION 2024 Support and guidance for at least 100 students #WeAreConsious AMBITION 2025 100% coverage energy monitoring system HRHub AMBITION 2024 The next phase in the digitisation of HR processes where onboarding, appraisal interviews, training and objectives can be consulted and facilitated by employees using an online platform. HSES From the #TeamWDP satisfaction survey AMBITION 2025 Increase in average #TeamWDP satisfaction score From the #TeamWDP satisfaction survey Results in line across regions Response ratio: 91% Basis for action plan roll-out in 2024 8/10 Employee survey by external partners on: 1 organisation 1 context 1 dealing with colleagues and manager 1 job content 1 mental well-being #WeCare AMBITION 2024 Min. 100,000 euros per year of financial and/or material support to local projects and vulnerable groups.
Annual accounts Governance Results Performance Strategy and value creation This is WDP ESG WDP 2023 Annual Report 53 VITALLY ENGAGED Outlook Over the past two years, we have laid the foundations with #TeamWDP for an organisation ready for a new growth story: #BLEND2027. #TeamWDP has expanded significantly across the regions over the past few years. Some new positions were also created to help fine-tune our in-house expertise. This created a decisive, competent and international team that is ready for the ambitious challenges of our new growth plan. Now we must safeguard continued interconnection, cooperation and commitment. To this end, the HR Roadmap for the next few years is providing workshops, team building, and ad hoc actions. AMBITION 2027 Ownership, intrapreneurship, creativity, and innovation embedded in #TeamWDP An attractive employer #TeamWDP was expanded by 18 new employees in 2023 – a substantial +16% increase in headcount. As a growing organisation, the right talent needs to be attracted and integrated within the company and its company culture. Only in this way the future resilience of WDP Group can be guaranteed, the resilience of the company will be increased and growth can be continuously be facilitated. A good mixture of different talents, cultures and personalities is of the utmost importance. As an employer, WDP does not discriminate based on race, colour, sex, religion, political opinion, national origin or social origin. WDP is looking for employees with the right skills that best fit the company culture and activities, with due regard to objective selection procedures and diversity. Our recruitment and selection process is fully aligned with WDP's Diversity Policy, Code of Ethics, and Human Rights Policy. Organisational structure The family atmosphere within the company ensures that staff are regarded as individuals and are not purely seen in terms of their professional performance. It is vital that everyone on the team feels good and valued and has space to deploy their talents. WDP employees receive leeway for their own initiative, and Management does its utmost to feed and stimulate the ideas of its people, rather than pushing through top-down decisions. The innovative, flat organisational structure ensures a continuous dynamic and fosters involvement, responsibility and ownership. New talent The search for new talent is supported by an ongoing employer branding campaign that spotlights WDP as an attractive employer via website, LinkedIn or other communication tools within recruiting. A brief but thorough selection process, clear information and attention to the right match are the basis of successful recruitment. Recruitment will be followed by an extensive onboarding procedure intended to provide a very in-depth understanding of WDP's business: 1 an extensive onboarding procedure, a well-equipped workplace and the right tools; 1 an onboarding package for each new employee with attention to the Employee Code of Conduct; 1 allocation of a mentor for each new employee to show them around the company informally; 1 personal introductory talks with colleagues from all departments, including a talk with the compliance officer for a further explanation and a formal introduction to the WDP policies (e.g. Dealing Code, Employee Code of Conduct, #SpeakUp procedure); 1 a visit to construction sites and/or a visit to clients together with one of the project managers or property managers; and 1 feedback interviews on the quality of the onboarding after one month and six months with the HR Manager. This onboarding will be integrated into the HRHub in 2024. Decisive and competent
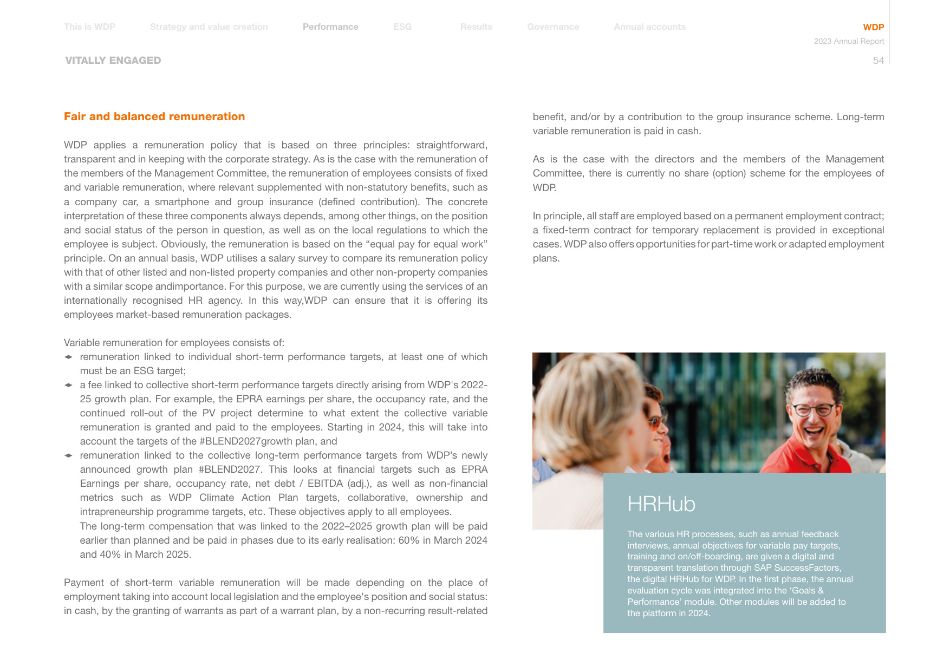
HRHub The various HR processes, such as annual feedback interviews, annual objectives for variable pay targets, training and on/off-boarding, are given a digital and transparent translation through SAP SuccessFactors, the digital HRHub for WDP. In the first phase, the annual evaluation cycle was integrated into the 'Goals & Performance' module. Other modules will be added to the platform in 2024. Annual accounts Governance Results Performance Strategy and value creation This is WDP ESG WDP 2023 Annual Report 54 benefit, and/or by a contribution to the group insurance scheme. Long-term variable remuneration is paid in cash. As is the case with the directors and the members of the Management Committee, there is currently no share (option) scheme for the employees of WDP. In principle, all staff are employed based on a permanent employment contract; a fixed-term contract for temporary replacement is provided in exceptional cases. WDP also offers opportunities for part-time work or adapted employment plans. VITALLY ENGAGED Fair and balanced remuneration WDP applies a remuneration policy that is based on three principles: straightforward, transparent and in keeping with the corporate strategy. As is the case with the remuneration of the members of the Management Committee, the remuneration of employees consists of fixed and variable remuneration, where relevant supplemented with non-statutory benefits, such as a company car, a smartphone and group insurance (defined contribution). The concrete interpretation of these three components always depends, among other things, on the position and social status of the person in question, as well as on the local regulations to which the employee is subject. Obviously, the remuneration is based on the "equal pay for equal work" principle. On an annual basis, WDP utilises a salary survey to compare its remuneration policy with that of other listed and non-listed property companies and other non-property companies with a similar scope andimportance. For this purpose, we are currently using the services of an internationally recognised HR agency. In this way,WDP can ensure that it is offering its employees market-based remuneration packages. Variable remuneration for employees consists of: 1 remuneration linked to individual short-term performance targets, at least one of which must be an ESG target; 1 a fee linked to collective short-term performance targets directly arising from WDP's 2022- 25 growth plan. For example, the EPRA earnings per share, the occupancy rate, and the continued roll-out of the PV project determine to what extent the collective variable remuneration is granted and paid to the employees. Starting in 2024, this will take into account the targets of the #BLEND2027growth plan, and 1 remuneration linked to the collective long-term performance targets from WDP's newly announced growth plan #BLEND2027. This looks at financial targets such as EPRA Earnings per share, occupancy rate, net debt / EBITDA (adj.), as well as non-financial metrics such as WDP Climate Action Plan targets, collaborative, ownership and intrapreneurship programme targets, etc. These objectives apply to all employees. The long-term compensation that was linked to the 2022–2025 growth plan will be paid earlier than planned and be paid in phases due to its early realisation: 60% in March 2024 and 40% in March 2025. Payment of short-term variable remuneration will be made depending on the place of employment taking into account local legislation and the employee's position and social status: in cash, by the granting of warrants as part of a warrant plan, by a non-recurring result-related
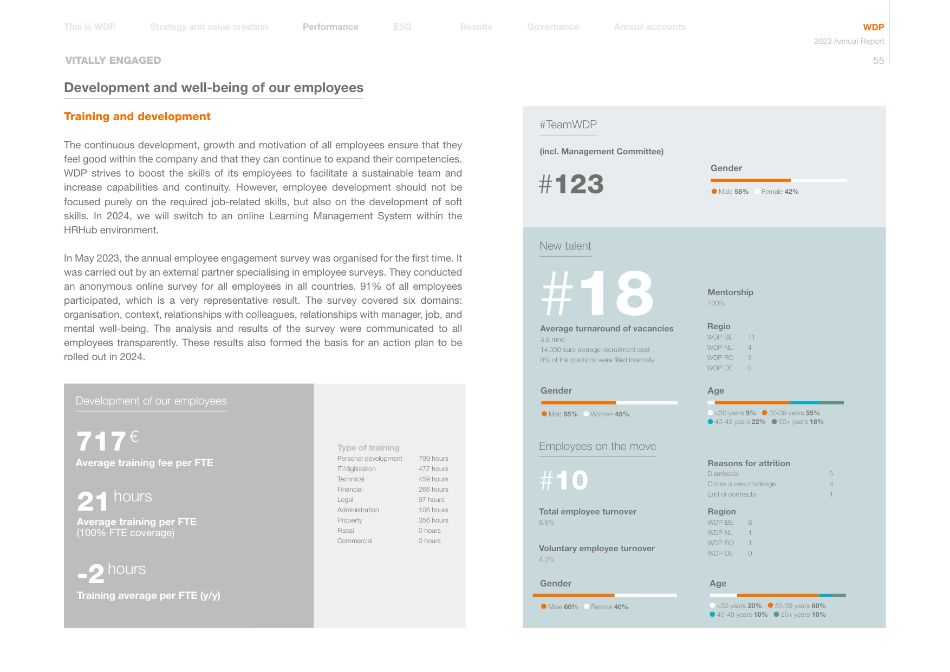
Annual accounts Governance Results Performance Strategy and value creation This is WDP ESG WDP 2023 Annual Report 55 VITALLY ENGAGED Development and well-being of our employees Training and development The continuous development, growth and motivation of all employees ensure that they feel good within the company and that they can continue to expand their competencies. WDP strives to boost the skills of its employees to facilitate a sustainable team and increase capabilities and continuity. However, employee development should not be focused purely on the required job-related skills, but also on the development of soft skills. In 2024, we will switch to an online Learning Management System within the HRHub environment. In May 2023, the annual employee engagement survey was organised for the first time. It was carried out by an external partner specialising in employee surveys. They conducted an anonymous online survey for all employees in all countries. 91% of all employees participated, which is a very representative result. The survey covered six domains: organisation, context, relationships with colleagues, relationships with manager, job, and mental well-being. The analysis and results of the survey were communicated to all employees transparently. These results also formed the basis for an action plan to be rolled out in 2024. <30 years 5% 30-39 years 55% 40-49 years 22% 50+ years 18% Man 55% Woman 45% Gender Age New talent Employees on the move #10 Total employee turnover 8.6% Voluntary employee turnover 4.3% Reasons for attrition Dismissals 5 Chose a new challenge 4 End of contracts 1 Region WDP BE 8 WDP NL 1 WDP RO 1 WDP DE 0 (incl. Management Committee) Development of our employees Average training fee per FTE Average training per FTE (100% FTE coverage) 717 € 21 hours Type of training Personal development 799 hours IT/digitisation 477 hours Technical 459 hours Financial 266 hours Legal 97 hours Administration 106 hours Property 356 hours Fiscal 0 hours Commercial 0 hours #TeamWDP Male 58% Female 42% Gender Training average per FTE (y/y) -2 hours #123 Male 60% Female 40% Gender <30 years 20% 30-39 years 60% 40-49 years 10% 50+ years 10% Age #18 Regio WDP BE 11 WDP NL 4 WDP RO 3 WDP DE 0 Mentorship 100% Average turnaround of vacancies 3.8 mnd 14,000 euro average recruitment cost 0% of the positions were filled internally
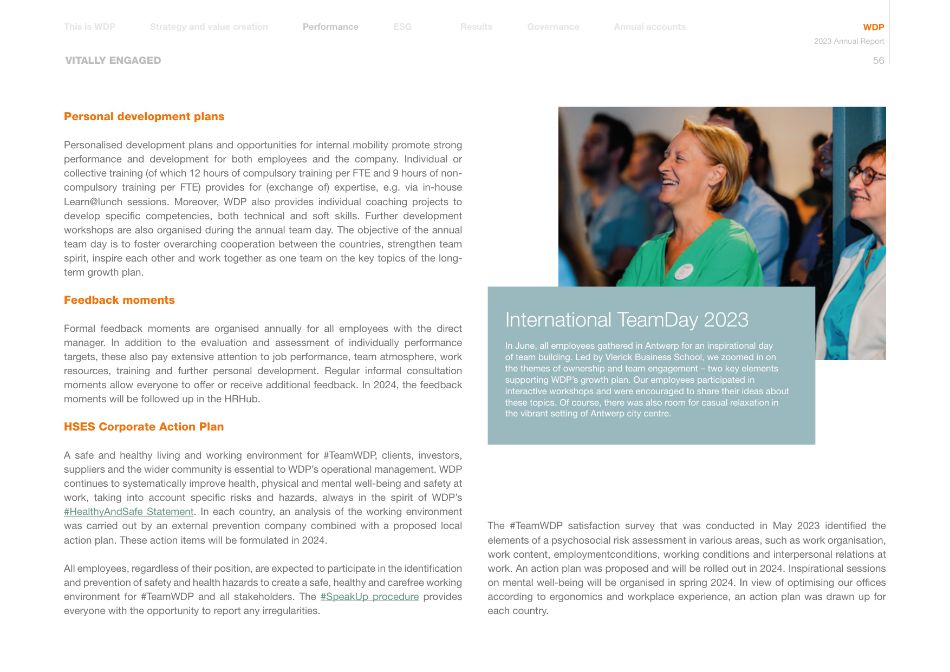
Annual accounts Governance Results Performance Strategy and value creation This is WDP ESG WDP 2023 Annual Report 56 Personal development plans Personalised development plans and opportunities for internal mobility promote strong performance and development for both employees and the company. Individual or collective training (of which 12 hours of compulsory training per FTE and 9 hours of non- compulsory training per FTE) provides for (exchange of) expertise, e.g. via in-house Learn@lunch sessions. Moreover, WDP also provides individual coaching projects to develop specific competencies, both technical and soft skills. Further development workshops are also organised during the annual team day. The objective of the annual team day is to foster overarching cooperation between the countries, strengthen team spirit, inspire each other and work together as one team on the key topics of the long- term growth plan. Feedback moments Formal feedback moments are organised annually for all employees with the direct manager. In addition to the evaluation and assessment of individually performance targets, these also pay extensive attention to job performance, team atmosphere, work resources, training and further personal development. Regular informal consultation moments allow everyone to offer or receive additional feedback. In 2024, the feedback moments will be followed up in the HRHub. HSES Corporate Action Plan A safe and healthy living and working environment for #TeamWDP, clients, investors, suppliers and the wider community is essential to WDP's operational management. WDP continues to systematically improve health, physical and mental well-being and safety at work, taking into account specific risks and hazards, always in the spirit of WDP's #HealthyAndSafe Statement. In each country, an analysis of the working environment was carried out by an external prevention company combined with a proposed local action plan. These action items will be formulated in 2024. All employees, regardless of their position, are expected to participate in the identification and prevention of safety and health hazards to create a safe, healthy and carefree working environment for #TeamWDP and all stakeholders. The #SpeakUp procedure provides everyone with the opportunity to report any irregularities. International TeamDay 2023 In June, all employees gathered in Antwerp for an inspirational day of team building. Led by Vlerick Business School, we zoomed in on the themes of ownership and team engagement – two key elements supporting WDP's growth plan. Our employees participated in interactive workshops and were encouraged to share their ideas about these topics. Of course, there was also room for casual relaxation in the vibrant setting of Antwerp city centre. VITALLY ENGAGED The #TeamWDP satisfaction survey that was conducted in May 2023 identified the elements of a psychosocial risk assessment in various areas, such as work organisation, work content, employmentconditions, working conditions and interpersonal relations at work. An action plan was proposed and will be rolled out in 2024. Inspirational sessions on mental well-being will be organised in spring 2024. In view of optimising our offices according to ergonomics and workplace experience, an action plan was drawn up for each country.
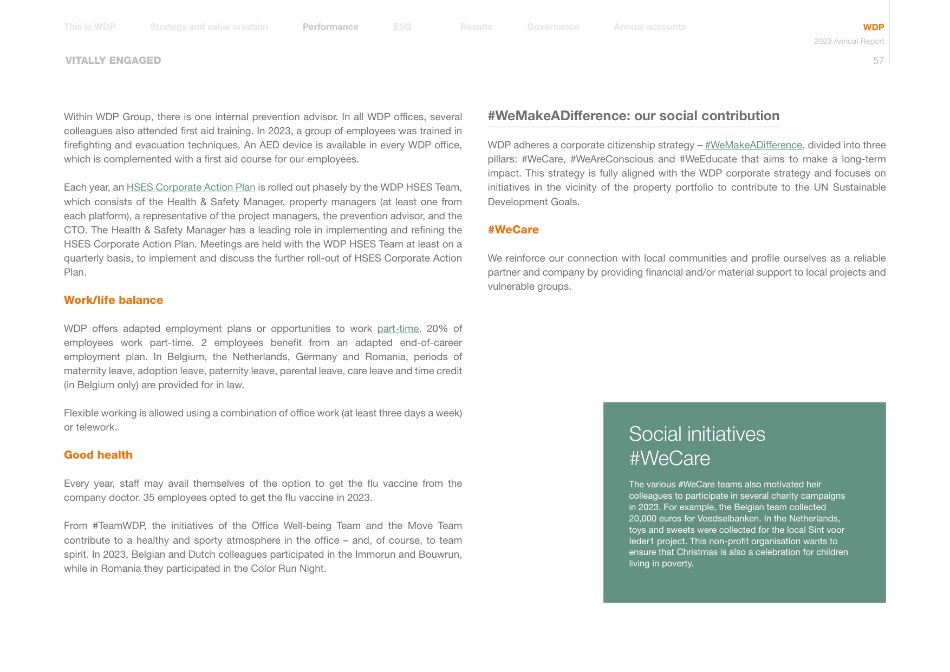
Annual accounts Governance Results Performance Strategy and value creation This is WDP ESG WDP 2023 Annual Report 57 Within WDP Group, there is one internal prevention advisor. In all WDP offices, several colleagues also attended first aid training. In 2023, a group of employees was trained in firefighting and evacuation techniques. An AED device is available in every WDP office, which is complemented with a first aid course for our employees. Each year, an HSES Corporate Action Plan is rolled out phasely by the WDP HSES Team, which consists of the Health & Safety Manager, property managers (at least one from each platform), a representative of the project managers, the prevention advisor, and the CTO. The Health & Safety Manager has a leading role in implementing and refining the HSES Corporate Action Plan. Meetings are held with the WDP HSES Team at least on a quarterly basis, to implement and discuss the further roll-out of HSES Corporate Action Plan. Work/life balance WDP offers adapted employment plans or opportunities to work part-time. 20% of employees work part-time. 2 employees benefit from an adapted end-of-career employment plan. In Belgium, the Netherlands, Germany and Romania, periods of maternity leave, adoption leave, paternity leave, parental leave, care leave and time credit (in Belgium only) are provided for in law. Flexible working is allowed using a combination of office work (at least three days a week) or telework. Good health Every year, staff may avail themselves of the option to get the flu vaccine from the company doctor. 35 employees opted to get the flu vaccine in 2023. From #TeamWDP, the initiatives of the Office Well-being Team and the Move Team contribute to a healthy and sporty atmosphere in the office – and, of course, to team spirit. In 2023, Belgian and Dutch colleagues participated in the Immorun and Bouwrun, while in Romania they participated in the Color Run Night. #WeMakeADifference: our social contribution WDP adheres a corporate citizenship strategy – #WeMakeADifference, divided into three pillars: #WeCare, #WeAreConscious and #WeEducate that aims to make a long-term impact. This strategy is fully aligned with the WDP corporate strategy and focuses on initiatives in the vicinity of the property portfolio to contribute to the UN Sustainable Development Goals. #WeCare We reinforce our connection with local communities and profile ourselves as a reliable partner and company by providing financial and/or material support to local projects and vulnerable groups. VITALLY ENGAGED Social initiatives #WeCare The various #WeCare teams also motivated heir colleagues to participate in several charity campaigns in 2023. For example, the Belgian team collected 20,000 euros for Voedselbanken. In the Netherlands, toys and sweets were collected for the local Sint voor Ieder1 project. This non-profit organisation wants to ensure that Christmas is also a celebration for children living in poverty.
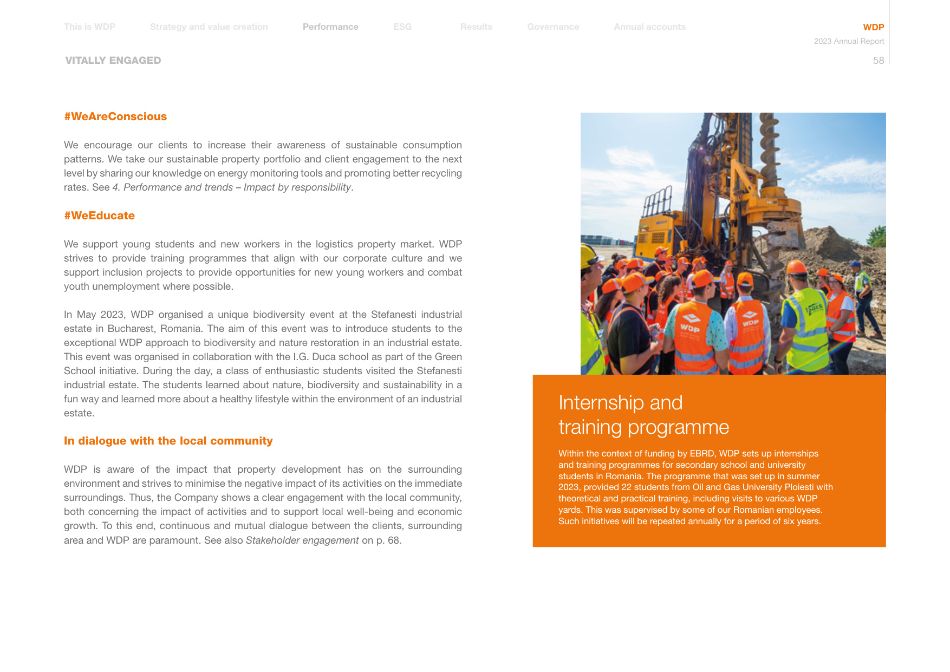
Annual accounts Governance Results Performance Strategy and value creation This is WDP ESG WDP 2023 Annual Report 58 #WeAreConscious We encourage our clients to increase their awareness of sustainable consumption patterns. We take our sustainable property portfolio and client engagement to the next level by sharing our knowledge on energy monitoring tools and promoting better recycling rates. See 4. Performance and trends – Impact by responsibility. #WeEducate We support young students and new workers in the logistics property market. WDP strives to provide training programmes that align with our corporate culture and we support inclusion projects to provide opportunities for new young workers and combat youth unemployment where possible. In May 2023, WDP organised a unique biodiversity event at the Stefanesti industrial estate in Bucharest, Romania. The aim of this event was to introduce students to the exceptional WDP approach to biodiversity and nature restoration in an industrial estate. This event was organised in collaboration with the I.G. Duca school as part of the Green School initiative. During the day, a class of enthusiastic students visited the Stefanesti industrial estate. The students learned about nature, biodiversity and sustainability in a fun way and learned more about a healthy lifestyle within the environment of an industrial estate. In dialogue with the local community WDP is aware of the impact that property development has on the surrounding environment and strives to minimise the negative impact of its activities on the immediate surroundings. Thus, the Company shows a clear engagement with the local community, both concerning the impact of activities and to support local well-being and economic growth. To this end, continuous and mutual dialogue between the clients, surrounding area and WDP are paramount. See also Stakeholder engagement on p. 68. Internship and training programme Within the context of funding by EBRD, WDP sets up internships and training programmes for secondary school and university students in Romania. The programme that was set up in summer 2023, provided 22 students from Oil and Gas University Ploiesti with theoretical and practical training, including visits to various WDP yards. This was supervised by some of our Romanian employees. Such initiatives will be repeated annually for a period of six years. VITALLY ENGAGED
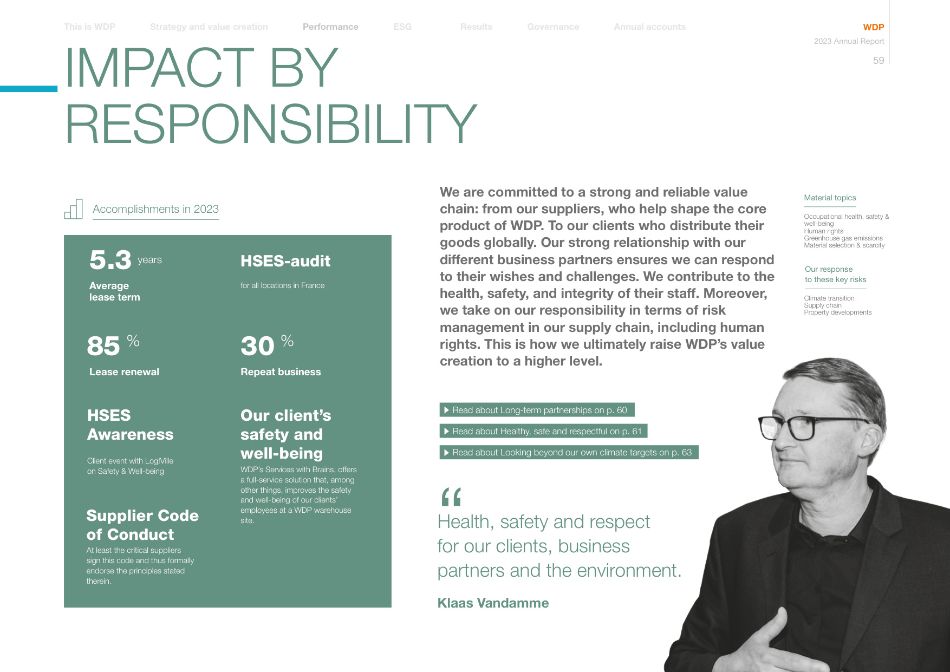
Annual accounts Governance Results Performance Strategy and value creation This is WDP ESG WDP 2023 Annual Report 59 IMPACT BY RESPONSIBILITY " Health, safety and respect for our clients, business partners and the environment. Read about Long-term partnerships on p. 60 Read about Healthy, safe and respectful on p. 61 Read about Looking beyond our own climate targets on p. 63 Accomplishments in 2023 for all locations in France HSES-audit Average lease term Lease renewal Repeat business 5.3 years 85 % 30 % HSES Awareness Client event with Log!Ville on Safety & Well-being Supplier Code of Conduct At least the critical suppliers sign this code and thus formally endorse the principles stated therein. Our client's safety and well-being WDP's Services with Brains, offers a full-service solution that, among other things, improves the safety and well-being of our clients' employees at a WDP warehouse site. Material topics Occupational health, safety & well-being Human rights Greenhouse gas emissions Material selection & scarcity Climate transition Supply chain Property developments Our response to these key risks We are committed to a strong and reliable value chain: from our suppliers, who help shape the core product of WDP. To our clients who distribute their goods globally. Our strong relationship with our different business partners ensures we can respond to their wishes and challenges. We contribute to the health, safety, and integrity of their staff. Moreover, we take on our responsibility in terms of risk management in our supply chain, including human rights. This is how we ultimately raise WDP's value creation to a higher level. Klaas Vandamme
Annual accounts Governance Results Performance Strategy and value creation This is WDP ESG WDP 2023 Annual Report 60 IMPACT BY RESPONSIBILITY Long-term partnerships Our business strategy is based on long-term partnerships with all stakeholders. Our clients are key to our strategy, and our business partners are essential to achieving our goals. Clients WDP primarily wants to be a partner to its clients, develop a successful long-term relationship with them, and support them in their activities. We listen carefully to clients' needs and use our expertise and long-standing knowledge of the logistics market and its processes to provide our clients with the most suitable premises at the most suitable location. We also want to serve our clients across country borders. Weekly meetings between the three country managers within the Management Committee and international workshops ensure knowledge is exchanged and appropriate responses to our clients' needs occur in all regions. Long-term leases, high occupancy rate, strong retention, and a high share of repeat business in external growth reflect this strategy. Concerning project development and property management, our clients praise our solution orientation, easy accessibility, flexibility, short lines of communication, and proactive approach. The MyWDP digital client portal is the intelligent link between our clients and #TeamWDP that transforms real-time data into valuable insights. Clients can use this platform – via web or app – to access important information about buildings, contracts, invoices, and documents. Problems can be reported instantly, and the WDP manager can easily be contacted. We are a crucial axis in our client's supply chain, so our warehouse sites are more than just the real estate at their disposal: our energy solutions support their decarbonisation ambitions and our Services with Brains offer a broad portfolio of services that further unburden clients and optimise their operations. Objectives CUSTOMER WELL-BEING AMBITION 2025 Further expansion and implementation of Services with Brains, the full-service solution for clients that focuses on safety and well-being, among other things. Customer satisfaction indicator: the percentage of contracts that mature in the reporting year and are renewed. AMBITION 2024 MAINTAIN Lease renewal of minimally 80% EXPANSION OF SUPPLY CHAIN MANAGEMENT AMBITION 2025 Further formalisation of supply chain management, taking into account future legal requirements for due diligence in the value chain. Annual HSES audit for existing WDP premises, projects, or offices. AMBITION 2024 MAINTAIN Minimally one HSES audit
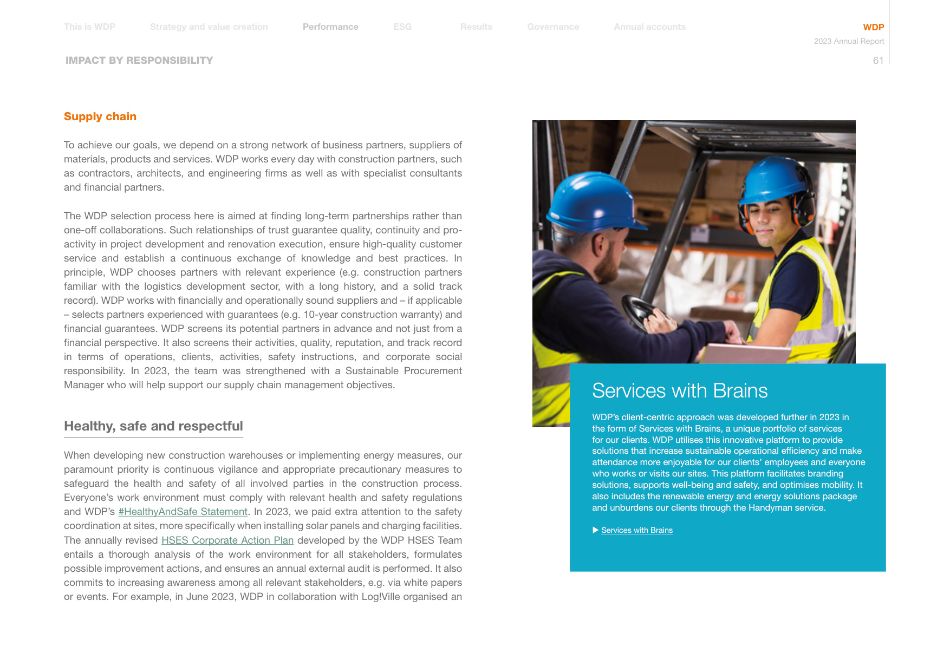
Annual accounts Governance Results Performance Strategy and value creation This is WDP ESG WDP 2023 Annual Report 61 IMPACT BY RESPONSIBILITY Supply chain To achieve our goals, we depend on a strong network of business partners, suppliers of materials, products and services. WDP works every day with construction partners, such as contractors, architects, and engineering firms as well as with specialist consultants and financial partners. The WDP selection process here is aimed at finding long-term partnerships rather than one-off collaborations. Such relationships of trust guarantee quality, continuity and pro- activity in project development and renovation execution, ensure high-quality customer service and establish a continuous exchange of knowledge and best practices. In principle, WDP chooses partners with relevant experience (e.g. construction partners familiar with the logistics development sector, with a long history, and a solid track record). WDP works with financially and operationally sound suppliers and – if applicable – selects partners experienced with guarantees (e.g. 10-year construction warranty) and financial guarantees. WDP screens its potential partners in advance and not just from a financial perspective. It also screens their activities, quality, reputation, and track record in terms of operations, clients, activities, safety instructions, and corporate social responsibility. In 2023, the team was strengthened with a Sustainable Procurement Manager who will help support our supply chain management objectives. Healthy, safe and respectful When developing new construction warehouses or implementing energy measures, our paramount priority is continuous vigilance and appropriate precautionary measures to safeguard the health and safety of all involved parties in the construction process. Everyone's work environment must comply with relevant health and safety regulations and WDP's #HealthyAndSafe Statement. In 2023, we paid extra attention to the safety coordination at sites, more specifically when installing solar panels and charging facilities. The annually revised HSES Corporate Action Plan developed by the WDP HSES Team entails a thorough analysis of the work environment for all stakeholders, formulates possible improvement actions, and ensures an annual external audit is performed. It also commits to increasing awareness among all relevant stakeholders, e.g. via white papers or events. For example, in June 2023, WDP in collaboration with Log!Ville organised an Services with Brains WDP's client-centric approach was developed further in 2023 in the form of Services with Brains, a unique portfolio of services for our clients. WDP utilises this innovative platform to provide solutions that increase sustainable operational efficiency and make attendance more enjoyable for our clients' employees and everyone who works or visits our sites. This platform facilitates branding solutions, supports well-being and safety, and optimises mobility. It also includes the renewable energy and energy solutions package and unburdens our clients through the Handyman service. Services with Brains
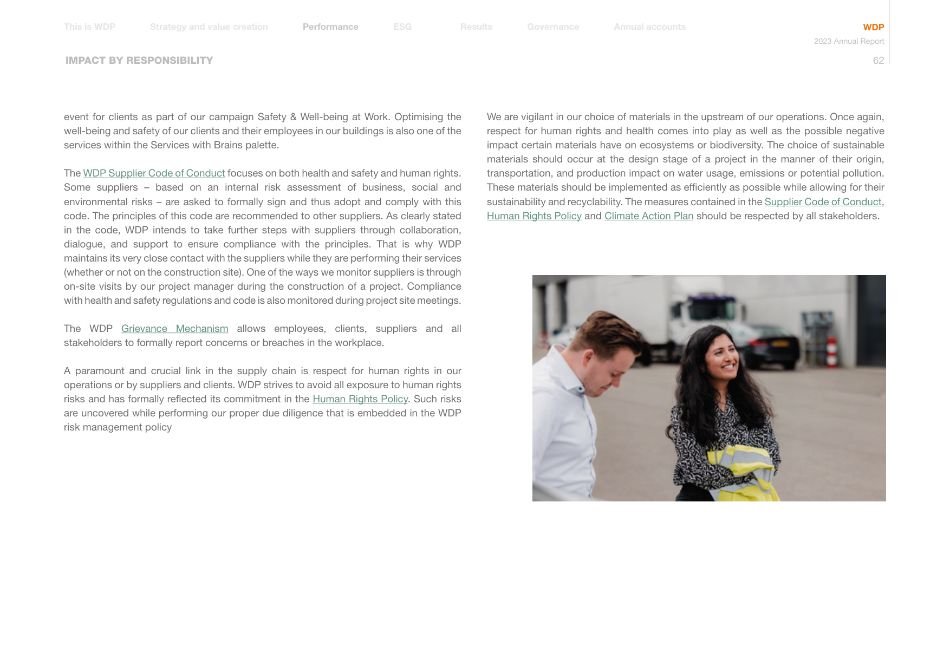
Annual accounts Governance Results Performance Strategy and value creation This is WDP ESG WDP 2023 Annual Report 62 IMPACT BY RESPONSIBILITY event for clients as part of our campaign Safety & Well-being at Work. Optimising the well-being and safety of our clients and their employees in our buildings is also one of the services within the Services with Brains palette. The WDP Supplier Code of Conduct focuses on both health and safety and human rights. Some suppliers – based on an internal risk assessment of business, social and environmental risks – are asked to formally sign and thus adopt and comply with this code. The principles of this code are recommended to other suppliers. As clearly stated in the code, WDP intends to take further steps with suppliers through collaboration, dialogue, and support to ensure compliance with the principles. That is why WDP maintains its very close contact with the suppliers while they are performing their services (whether or not on the construction site). One of the ways we monitor suppliers is through on-site visits by our project manager during the construction of a project. Compliance with health and safety regulations and code is also monitored during project site meetings. The WDP Grievance Mechanism allows employees, clients, suppliers and all stakeholders to formally report concerns or breaches in the workplace. A paramount and crucial link in the supply chain is respect for human rights in our operations or by suppliers and clients. WDP strives to avoid all exposure to human rights risks and has formally reflected its commitment in the Human Rights Policy. Such risks are uncovered while performing our proper due diligence that is embedded in the WDP risk management policy We are vigilant in our choice of materials in the upstream of our operations. Once again, respect for human rights and health comes into play as well as the possible negative impact certain materials have on ecosystems or biodiversity. The choice of sustainable materials should occur at the design stage of a project in the manner of their origin, transportation, and production impact on water usage, emissions or potential pollution. These materials should be implemented as efficiently as possible while allowing for their sustainability and recyclability. The measures contained in the Supplier Code of Conduct, Human Rights Policy and Climate Action Plan should be respected by all stakeholders.
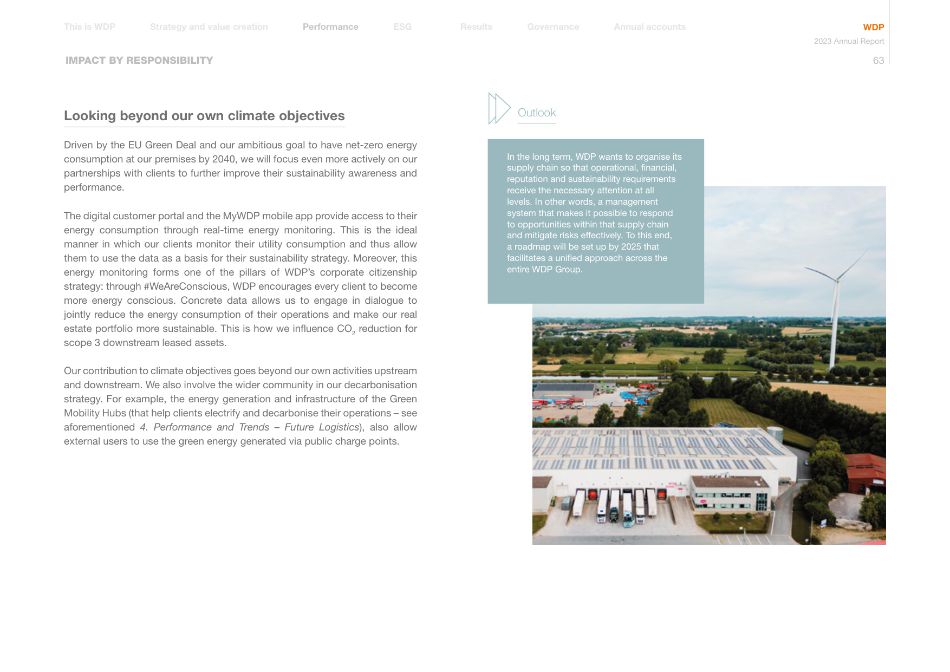
Annual accounts Governance Results Performance Strategy and value creation This is WDP ESG WDP 2023 Annual Report 63 Outlook In the long term, WDP wants to organise its supply chain so that operational, financial, reputation and sustainability requirements receive the necessary attention at all levels. In other words, a management system that makes it possible to respond to opportunities within that supply chain and mitigate risks effectively. To this end, a roadmap will be set up by 2025 that facilitates a unified approach across the entire WDP Group. Looking beyond our own climate objectives Driven by the EU Green Deal and our ambitious goal to have net-zero energy consumption at our premises by 2040, we will focus even more actively on our partnerships with clients to further improve their sustainability awareness and performance. The digital customer portal and the MyWDP mobile app provide access to their energy consumption through real-time energy monitoring. This is the ideal manner in which our clients monitor their utility consumption and thus allow them to use the data as a basis for their sustainability strategy. Moreover, this energy monitoring forms one of the pillars of WDP's corporate citizenship strategy: through #WeAreConscious, WDP encourages every client to become more energy conscious. Concrete data allows us to engage in dialogue to jointly reduce the energy consumption of their operations and make our real estate portfolio more sustainable. This is how we influence CO2 reduction for scope 3 downstream leased assets. Our contribution to climate objectives goes beyond our own activities upstream and downstream. We also involve the wider community in our decarbonisation strategy. For example, the energy generation and infrastructure of the Green Mobility Hubs (that help clients electrify and decarbonise their operations – see aforementioned 4. Performance and Trends – Future Logistics), also allow external users to use the green energy generated via public charge points. IMPACT BY RESPONSIBILITY
05 OUR APPROACH ON ESG
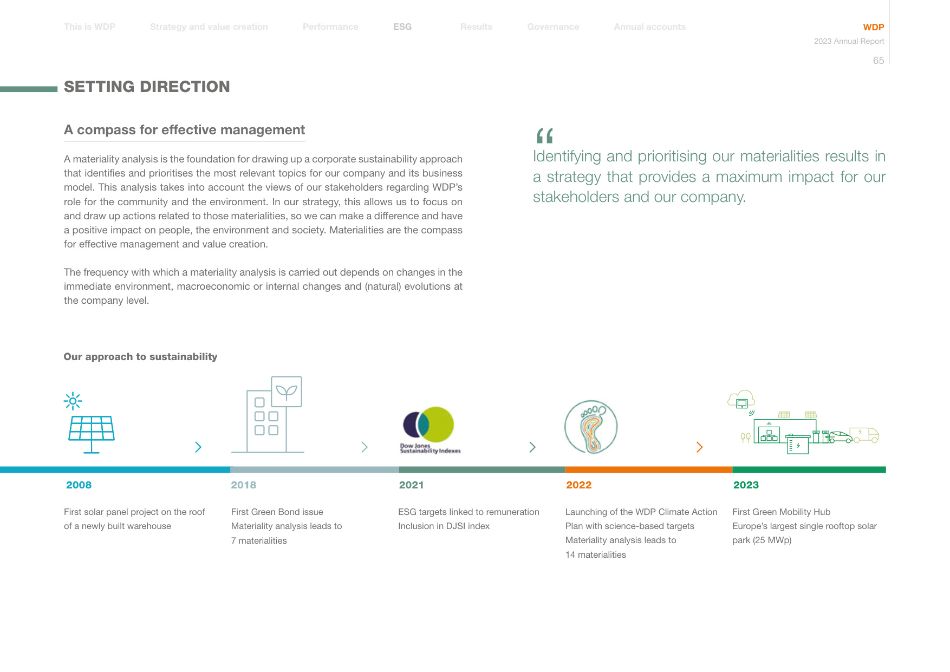
SETTING DIRECTION A compass for effective management A materiality analysis is the foundation for drawing up a corporate sustainability approach that identifies and prioritises the most relevant topics for our company and its business model. This analysis takes into account the views of our stakeholders regarding WDP's role for the community and the environment. In our strategy, this allows us to focus on and draw up actions related to those materialities, so we can make a difference and have a positive impact on people, the environment and society. Materialities are the compass for effective management and value creation. The frequency with which a materiality analysis is carried out depends on changes in the immediate environment, macroeconomic or internal changes and (natural) evolutions at the company level. First solar panel project on the roof of a newly built warehouse First Green Bond issue Materiality analysis leads to 7 materialities ESG targets linked to remuneration Inclusion in DJSI index Launching of the WDP Climate Action Plan with science-based targets Materiality analysis leads to 14 materialities First Green Mobility Hub Europe's largest single rooftop solar park (25 MWp) 2018 2008 " Identifying and prioritising our materialities results in a strategy that provides a maximum impact for our stakeholders and our company. Our approach to sustainability 2022 2021 2023 Annual accounts Governance Results Performance Strategy and value creation This is WDP ESG WDP 2023 Annual Report 65
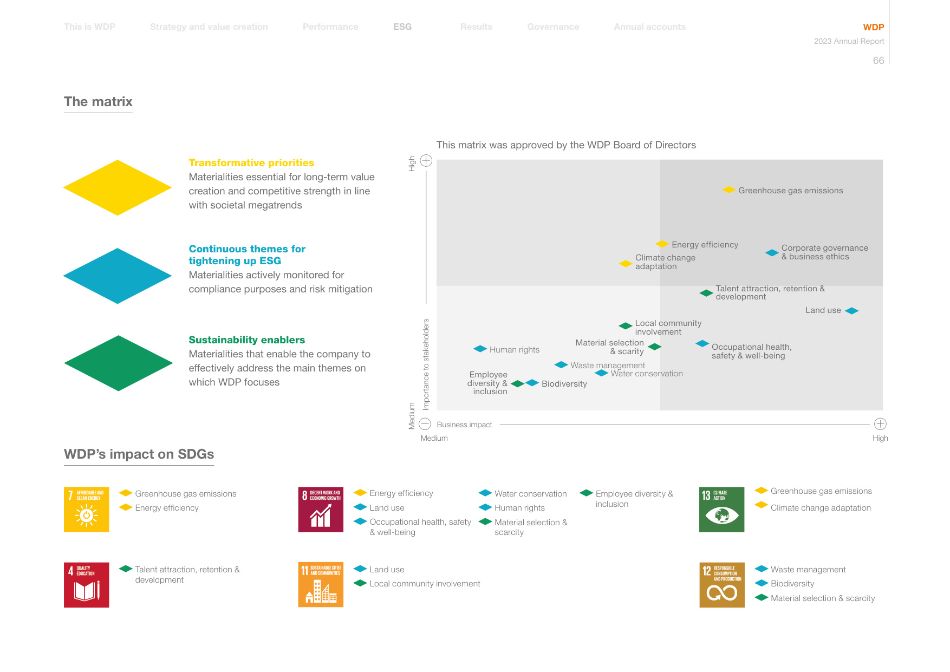
Transformative priorities Materialities essential for long-term value creation and competitive strength in line with societal megatrends Continuous themes for tightening up ESG Materialities actively monitored for compliance purposes and risk mitigation Sustainability enablers Materialities that enable the company to effectively address the main themes on which WDP focuses The matrix Energy efficiency Greenhouse gas emissions Corporate governance & business ethics Talent attraction, retention & development Climate change adaptation Biodiversity Waste management Water conservation Human rights Local community involvement Occupational health, safety & well-being Business impact Importance to stakeholders High High Medium Material selection & scarity Employee diversity & inclusion Land use Medium This matrix was approved by the WDP Board of Directors Energy efficiency Land use Occupational health, safety & well-being Greenhouse gas emissions Climate change adaptation Greenhouse gas emissions Energy efficiency Land use Local community involvement Waste management Biodiversity Material selection & scarcity Talent attraction, retention & development WDP's impact on SDGs Employee diversity & inclusion Water conservation Human rights Material selection & scarcity Annual accounts Governance Results Performance Strategy and value creation This is WDP ESG WDP 2023 Annual Report 66
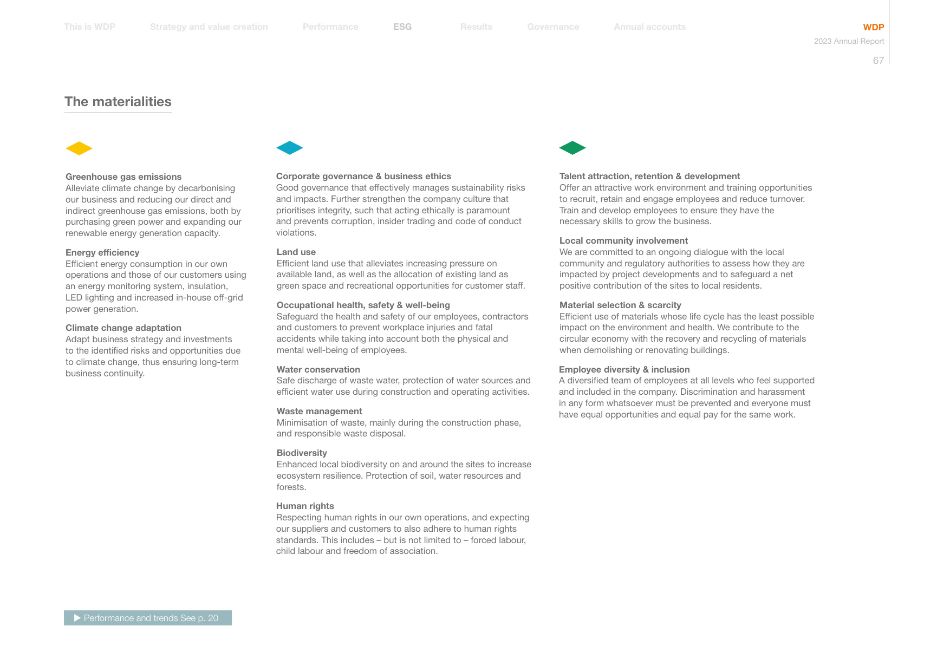
Greenhouse gas emissions Alleviate climate change by decarbonising our business and reducing our direct and indirect greenhouse gas emissions, both by purchasing green power and expanding our renewable energy generation capacity. Energy efficiency Efficient energy consumption in our own operations and those of our customers using an energy monitoring system, insulation, LED lighting and increased in-house off-grid power generation. Climate change adaptation Adapt business strategy and investments to the identified risks and opportunities due to climate change, thus ensuring long-term business continuity. The materialities Corporate governance & business ethics Good governance that effectively manages sustainability risks and impacts. Further strengthen the company culture that prioritises integrity, such that acting ethically is paramount and prevents corruption, insider trading and code of conduct violations. Land use Efficient land use that alleviates increasing pressure on available land, as well as the allocation of existing land as green space and recreational opportunities for customer staff. Occupational health, safety & well-being Safeguard the health and safety of our employees, contractors and customers to prevent workplace injuries and fatal accidents while taking into account both the physical and mental well-being of employees. Water conservation Safe discharge of waste water, protection of water sources and efficient water use during construction and operating activities. Waste management Minimisation of waste, mainly during the construction phase, and responsible waste disposal. Biodiversity Enhanced local biodiversity on and around the sites to increase ecosystem resilience. Protection of soil, water resources and forests. Human rights Respecting human rights in our own operations, and expecting our suppliers and customers to also adhere to human rights standards. This includes – but is not limited to – forced labour, child labour and freedom of association. Talent attraction, retention & development Offer an attractive work environment and training opportunities to recruit, retain and engage employees and reduce turnover. Train and develop employees to ensure they have the necessary skills to grow the business. Local community involvement We are committed to an ongoing dialogue with the local community and regulatory authorities to assess how they are impacted by project developments and to safeguard a net positive contribution of the sites to local residents. Material selection & scarcity Efficient use of materials whose life cycle has the least possible impact on the environment and health. We contribute to the circular economy with the recovery and recycling of materials when demolishing or renovating buildings. Employee diversity & inclusion A diversified team of employees at all levels who feel supported and included in the company. Discrimination and harassment in any form whatsoever must be prevented and everyone must have equal opportunities and equal pay for the same work. Performance and trends See p. 20 Annual accounts Governance Results Performance Strategy and value creation This is WDP ESG WDP 2023 Annual Report 67
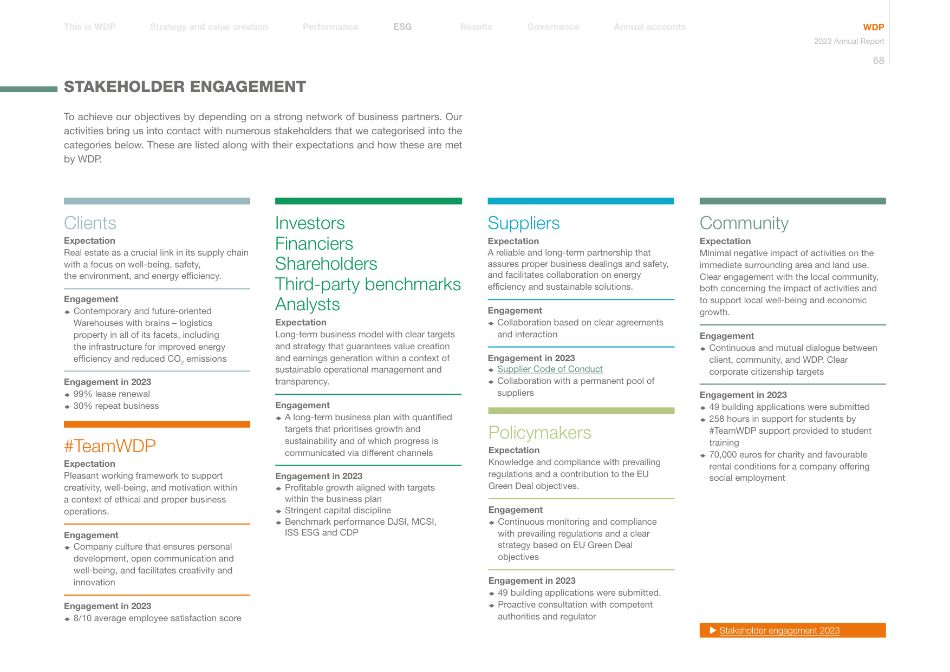
STAKEHOLDER ENGAGEMENT Policymakers Expectation Knowledge and compliance with prevailing regulations and a contribution to the EU Green Deal objectives. Engagement ♦Continuous monitoring and compliance with prevailing regulations and a clear strategy based on EU Green Deal objectives Engagement in 2023 ♦49 building applications were submitted. ♦Proactive consultation with competent authorities and regulator Community Expectation Minimal negative impact of activities on the immediate surrounding area and land use. Clear engagement with the local community, both concerning the impact of activities and to support local well-being and economic growth. Engagement ♦Continuous and mutual dialogue between client, community, and WDP. Clear corporate citizenship targets Engagement in 2023 ♦49 building applications were submitted ♦258 hours in support for students by #TeamWDP support provided to student training ♦70,000 euros for charity and favourable rental conditions for a company offering social employment Clients Expectation Real estate as a crucial link in its supply chain with a focus on well-being, safety, the environment, and energy efficiency. Engagement ♦Contemporary and future-oriented Warehouses with brains – logistics property in all of its facets, including the infrastructure for improved energy efficiency and reduced CO2 emissions Engagement in 2023 ♦99% lease renewal ♦30% repeat business Suppliers Expectation A reliable and long-term partnership that assures proper business dealings and safety, and facilitates collaboration on energy efficiency and sustainable solutions. Engagement ♦Collaboration based on clear agreements and interaction Engagement in 2023 ♦Supplier Code of Conduct ♦Collaboration with a permanent pool of suppliers #TeamWDP Expectation Pleasant working framework to support creativity, well-being, and motivation within a context of ethical and proper business operations. Engagement ♦Company culture that ensures personal development, open communication and well-being, and facilitates creativity and innovation Engagement in 2023 ♦8/10 average employee satisfaction score Investors Financiers Shareholders Third-party benchmarks Analysts Expectation Long-term business model with clear targets and strategy that guarantees value creation and earnings generation within a context of sustainable operational management and transparency. Engagement ♦A long-term business plan with quantified targets that prioritises growth and sustainability and of which progress is communicated via different channels Engagement in 2023 ♦Profitable growth aligned with targets within the business plan ♦Stringent capital discipline ♦Benchmark performance DJSI, MCSI, ISS ESG and CDP Stakeholder engagement 2023 To achieve our objectives by depending on a strong network of business partners. Our activities bring us into contact with numerous stakeholders that we categorised into the categories below. These are listed along with their expectations and how these are met by WDP. Annual accounts Governance Results Performance Strategy and value creation This is WDP ESG WDP 2023 Annual Report 68
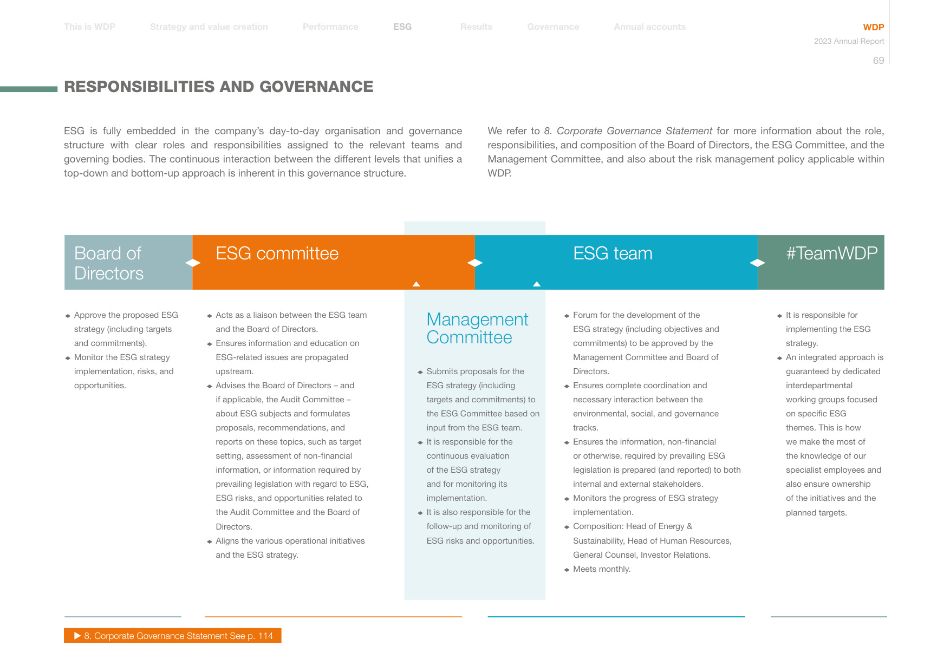
ESG is fully embedded in the company's day-to-day organisation and governance structure with clear roles and responsibilities assigned to the relevant teams and governing bodies. The continuous interaction between the different levels that unifies a top-down and bottom-up approach is inherent in this governance structure. We refer to 8. Corporate Governance Statement for more information about the role, responsibilities, and composition of the Board of Directors, the ESG Committee, and the Management Committee, and also about the risk management policy applicable within WDP. Board of Directors ♦Approve the proposed ESG strategy (including targets and commitments). ♦Monitor the ESG strategy implementation, risks, and opportunities. ESG committee ♦Acts as a liaison between the ESG team and the Board of Directors. ♦Ensures information and education on ESG-related issues are propagated upstream. ♦Advises the Board of Directors – and if applicable, the Audit Committee – about ESG subjects and formulates proposals, recommendations, and reports on these topics, such as target setting, assessment of non-financial information, or information required by prevailing legislation with regard to ESG, ESG risks, and opportunities related to the Audit Committee and the Board of Directors. ♦Aligns the various operational initiatives and the ESG strategy. ESG team ♦Forum for the development of the ESG strategy (including objectives and commitments) to be approved by the Management Committee and Board of Directors. ♦Ensures complete coordination and necessary interaction between the environmental, social, and governance tracks. ♦Ensures the information, non-financial or otherwise, required by prevailing ESG legislation is prepared (and reported) to both internal and external stakeholders. ♦Monitors the progress of ESG strategy implementation. ♦Composition: Head of Energy & Sustainability, Head of Human Resources, General Counsel, Investor Relations. ♦Meets monthly. #TeamWDP ♦It is responsible for implementing the ESG strategy. ♦An integrated approach is guaranteed by dedicated interdepartmental working groups focused on specific ESG themes. This is how we make the most of the knowledge of our specialist employees and also ensure ownership of the initiatives and the planned targets. Management Committee ♦Submits proposals for the ESG strategy (including targets and commitments) to the ESG Committee based on input from the ESG team. ♦It is responsible for the continuous evaluation of the ESG strategy and for monitoring its implementation. ♦It is also responsible for the follow-up and monitoring of ESG risks and opportunities. 8. Corporate Governance Statement See p. 114 RESPONSIBILITIES AND GOVERNANCE Annual accounts Governance Results Performance Strategy and value creation This is WDP ESG WDP 2023 Annual Report 69
06 SHARES AND BONDS
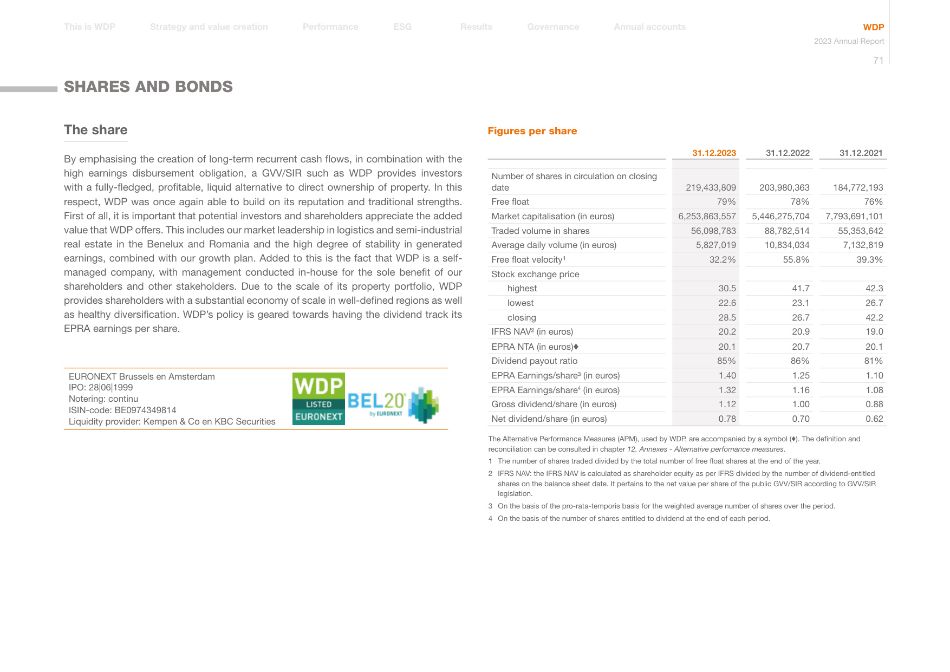
Annual accounts Governance Results Performance Strategy and value creation This is WDP ESG WDP 2023 Annual Report 71 The share By emphasising the creation of long-term recurrent cash flows, in combination with the high earnings disbursement obligation, a GVV/SIR such as WDP provides investors with a fully-fledged, profitable, liquid alternative to direct ownership of property. In this respect, WDP was once again able to build on its reputation and traditional strengths. First of all, it is important that potential investors and shareholders appreciate the added value that WDP offers. This includes our market leadership in logistics and semi-industrial real estate in the Benelux and Romania and the high degree of stability in generated earnings, combined with our growth plan. Added to this is the fact that WDP is a self- managed company, with management conducted in-house for the sole benefit of our shareholders and other stakeholders. Due to the scale of its property portfolio, WDP provides shareholders with a substantial economy of scale in well-defined regions as well as healthy diversification. WDP's policy is geared towards having the dividend track its EPRA earnings per share. EURONEXT Brussels en Amsterdam IPO: 28|06|1999 Notering: continu ISIN-code: BE0974349814 Liquidity provider: Kempen & Co en KBC Securities Figures per share 31.12.2023 31.12.2022 31.12.2021 Number of shares in circulation on closing date 219,433,809 203,980,363 184,772,193 Free float 79% 78% 76% Market capitalisation (in euros) 6,253,863,557 5,446,275,704 7,793,691,101 Traded volume in shares 56,098,783 88,782,514 55,353,642 Average daily volume (in euros) 5,827,019 10,834,034 7,132,819 Free float velocity¹ 32.2% 55.8% 39.3% Stock exchange price highest 30.5 41.7 42.3 lowest 22.6 23.1 26.7 closing 28.5 26.7 42.2 IFRS NAV² (in euros) 20.2 20.9 19.0 EPRA NTA (in euros)♦ 20.1 20.7 20.1 Dividend payout ratio 85% 86% 81% EPRA Earnings/share³ (in euros) 1.40 1.25 1.10 EPRA Earnings/share4 (in euros) 1.32 1.16 1.08 Gross dividend/share (in euros) 1.12 1.00 0.88 Net dividend/share (in euros) 0.78 0.70 0.62 The Alternative Performance Measures (APM), used by WDP, are accompanied by a symbol (♦). The definition and reconciliation can be consulted in chapter 12. Annexes - Alternative perfomance measures. 1 The number of shares traded divided by the total number of free float shares at the end of the year. 2 IFRS NAV: the IFRS NAV is calculated as shareholder equity as per IFRS divided by the number of dividend-entitled shares on the balance sheet date. It pertains to the net value per share of the public GVV/SIR according to GVV/SIR legislation. 3 On the basis of the pro-rata-temporis basis for the weighted average number of shares over the period. 4 On the basis of the number of shares entitled to dividend at the end of each period. SHARES AND BONDS
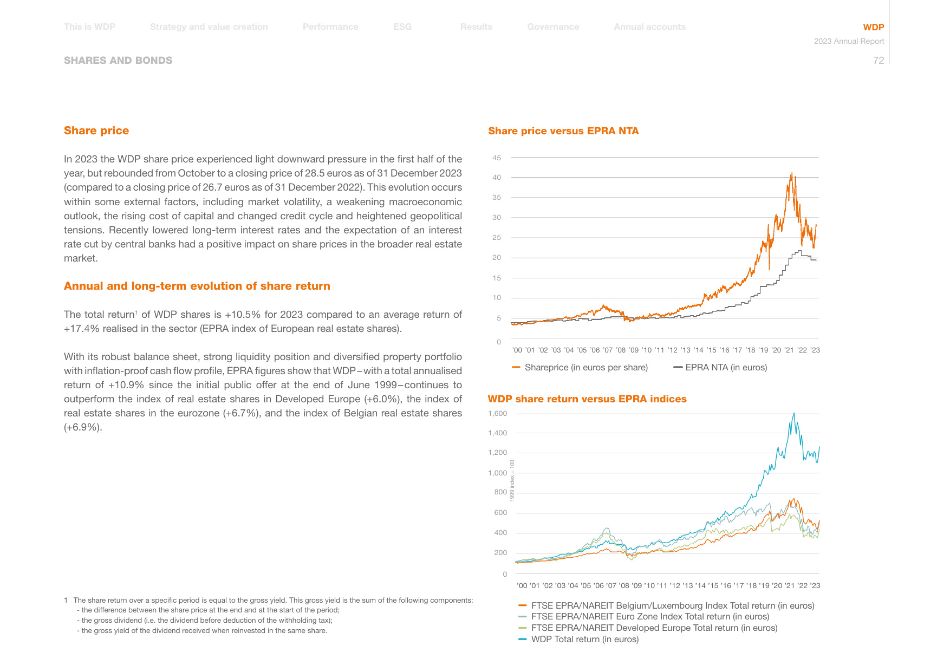
Annual accounts Governance Results Performance Strategy and value creation This is WDP ESG WDP 2023 Annual Report 72 SHARES AND BONDS Share price In 2023 the WDP share price experienced light downward pressure in the first half of the year, but rebounded from October to a closing price of 28.5 euros as of 31 December 2023 (compared to a closing price of 26.7 euros as of 31 December 2022). This evolution occurs within some external factors, including market volatility, a weakening macroeconomic outlook, the rising cost of capital and changed credit cycle and heightened geopolitical tensions. Recently lowered long-term interest rates and the expectation of an interest rate cut by central banks had a positive impact on share prices in the broader real estate market. Annual and long-term evolution of share return The total return1 of WDP shares is +10.5% for 2023 compared to an average return of +17.4% realised in the sector (EPRA index of European real estate shares). With its robust balance sheet, strong liquidity position and diversified property portfolio with inflation-proof cash flow profile, EPRA figures show that WDP – with a total annualised return of +10.9% since the initial public offer at the end of June 1999 – continues to outperform the index of real estate shares in Developed Europe (+6.0%), the index of real estate shares in the eurozone (+6.7%), and the index of Belgian real estate shares (+6.9%). Share price versus EPRA NTA 0 200 400 600 800 1,000 1,200 1,400 1,600 '00 '01 '02 '03 '04 '05 '06 '07 '08 '09 '10 '11 '12 '13 '14 '15 '16 '17 '18 '19 '20 '21 '23 '22 1999 index = 100 WDP share return versus EPRA indices 1 The share return over a specific period is equal to the gross yield. This gross yield is the sum of the following components: - the difference between the share price at the end and at the start of the period; - the gross dividend (i.e. the dividend before deduction of the withholding tax); - the gross yield of the dividend received when reinvested in the same share. 0 5 10 15 20 25 30 35 40 45 '00 '01 '02 '03 '04 '05 '06 '07 '08 '09 '10 '11 '12 '13 '14 '15 '16 '17 '18 '19 '20 '21 '23 '22 Shareprice (in euros per share) EPRA NTA (in euros) FTSE EPRA/NAREIT Belgium/Luxembourg Index Total return (in euros) FTSE EPRA/NAREIT Euro Zone Index Total return (in euros) FTSE EPRA/NAREIT Developed Europe Total return (in euros) WDP Total return (in euros)
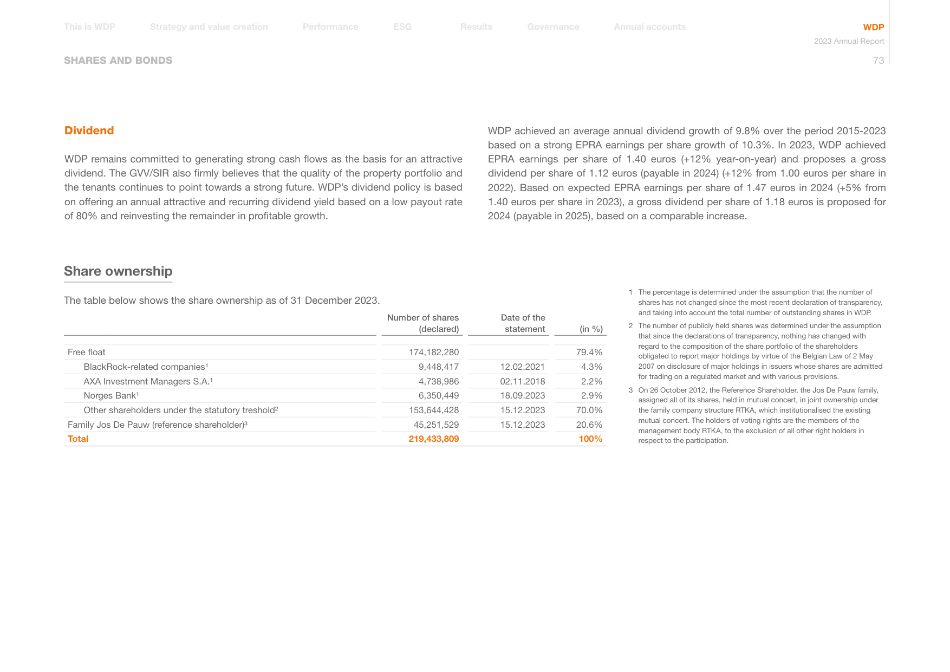
Annual accounts Governance Results Performance Strategy and value creation This is WDP ESG WDP 2023 Annual Report 73 SHARES AND BONDS Share ownership The table below shows the share ownership as of 31 December 2023. Number of shares (declared) Date of the statement (in %) Free float 174,182,280 79.4% BlackRock-related companies¹ 9,448,417 12.02.2021 4.3% AXA Investment Managers S.A.¹ 4,738,986 02.11.2018 2.2% Norges Bank¹ 6,350,449 18.09.2023 2.9% Other shareholders under the statutory treshold² 153,644,428 15.12.2023 70.0% Family Jos De Pauw (reference shareholder)³ 45,251,529 15.12.2023 20.6% Total 219,433,809 100% 1 The percentage is determined under the assumption that the number of shares has not changed since the most recent declaration of transparency, and taking into account the total number of outstanding shares in WDP. 2 The number of publicly held shares was determined under the assumption that since the declarations of transparency, nothing has changed with regard to the composition of the share portfolio of the shareholders obligated to report major holdings by virtue of the Belgian Law of 2 May 2007 on disclosure of major holdings in issuers whose shares are admitted for trading on a regulated market and with various provisions. 3 On 26 October 2012, the Reference Shareholder, the Jos De Pauw family, assigned all of its shares, held in mutual concert, in joint ownership under the family company structure RTKA, which institutionalised the existing mutual concert. The holders of voting rights are the members of the management body RTKA, to the exclusion of all other right holders in respect to the participation. Dividend WDP remains committed to generating strong cash flows as the basis for an attractive dividend. The GVV/SIR also firmly believes that the quality of the property portfolio and the tenants continues to point towards a strong future. WDP's dividend policy is based on offering an annual attractive and recurring dividend yield based on a low payout rate of 80% and reinvesting the remainder in profitable growth. WDP achieved an average annual dividend growth of 9.8% over the period 2015-2023 based on a strong EPRA earnings per share growth of 10.3%. In 2023, WDP achieved EPRA earnings per share of 1.40 euros (+12% year-on-year) and proposes a gross dividend per share of 1.12 euros (payable in 2024) (+12% from 1.00 euros per share in 2022). Based on expected EPRA earnings per share of 1.47 euros in 2024 (+5% from 1.40 euros per share in 2023), a gross dividend per share of 1.18 euros is proposed for 2024 (payable in 2025), based on a comparable increase.
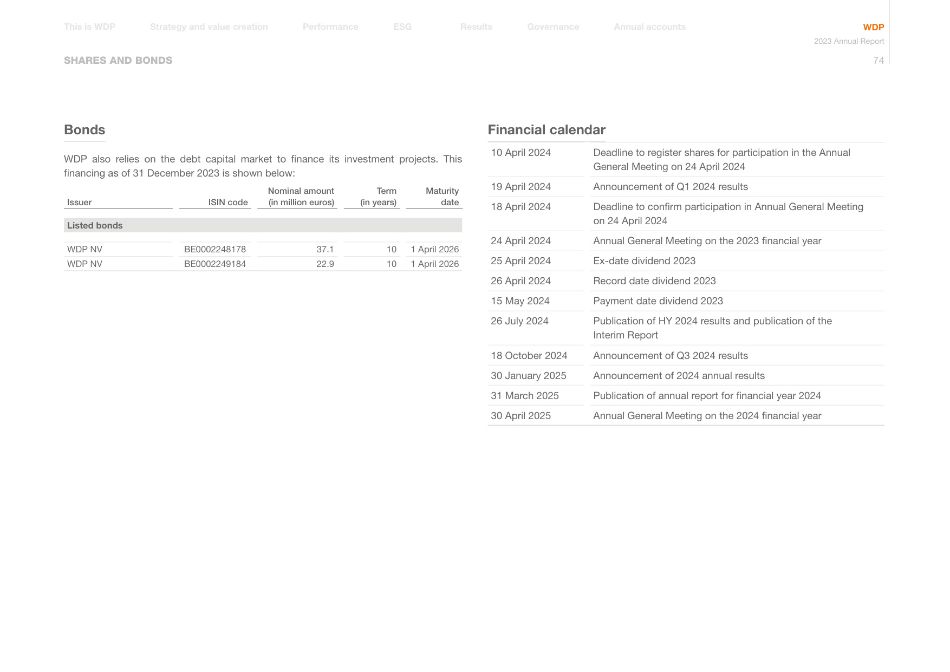
Annual accounts Governance Results Performance Strategy and value creation This is WDP ESG WDP 2023 Annual Report 74 SHARES AND BONDS Bonds WDP also relies on the debt capital market to finance its investment projects. This financing as of 31 December 2023 is shown below: Issuer ISIN code Nominal amount (in million euros) Term (in years) Maturity date Listed bonds WDP NV BE0002248178 37.1 10 1 April 2026 WDP NV BE0002249184 22.9 10 1 April 2026 Financial calendar 10 April 2024 Deadline to register shares for participation in the Annual General Meeting on 24 April 2024 19 April 2024 Announcement of Q1 2024 results 18 April 2024 Deadline to confirm participation in Annual General Meeting on 24 April 2024 24 April 2024 Annual General Meeting on the 2023 financial year 25 April 2024 Ex-date dividend 2023 26 April 2024 Record date dividend 2023 15 May 2024 Payment date dividend 2023 26 July 2024 Publication of HY 2024 results and publication of the Interim Report 18 October 2024 Announcement of Q3 2024 results 30 January 2025 Announcement of 2024 annual results 31 March 2025 Publication of annual report for financial year 2024 30 April 2025 Annual General Meeting on the 2024 financial year
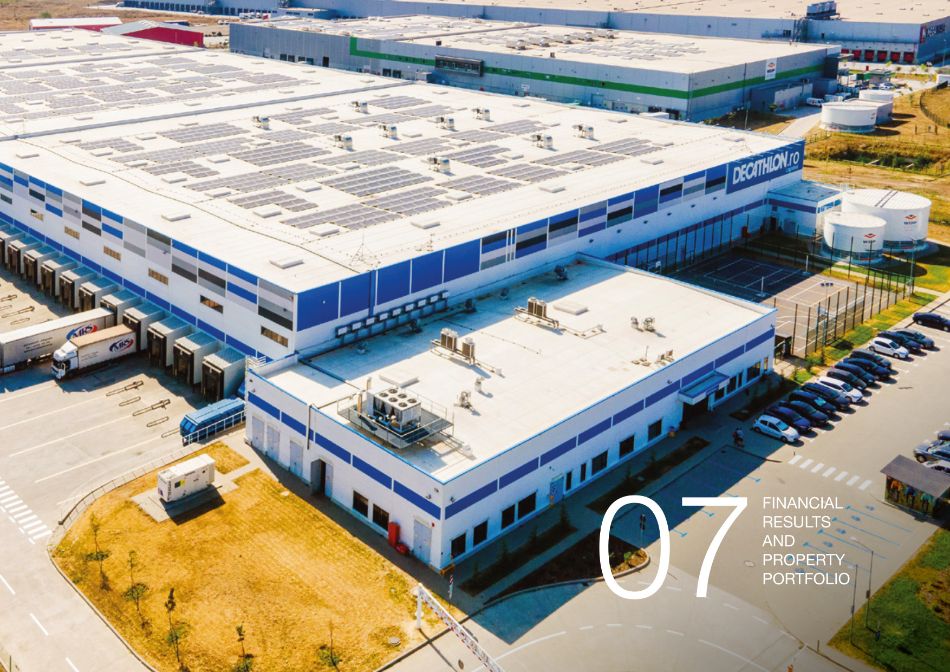
07 FINANCIAL RESULTS AND PROPERTY PORTFOLIO
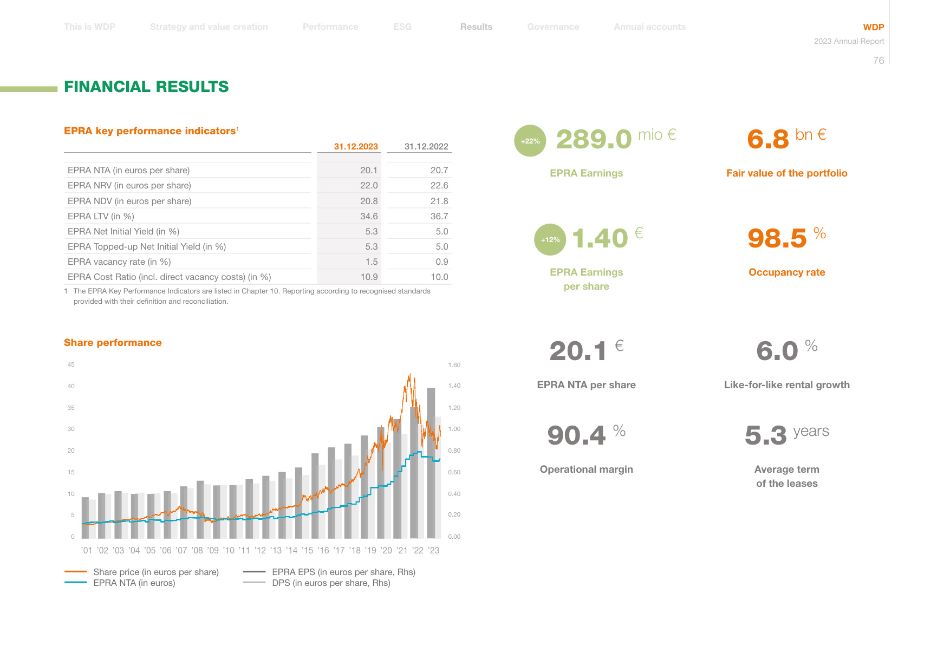
0 15 10 5 20 30 35 40 45 0.00 0.20 0.40 0.60 0.80 1.00 1.20 1.40 1.60 Share price (in euros per share) EPRA NTA (in euros) EPRA EPS (in euros per share, Rhs) DPS (in euros per share, Rhs) '23 '01 '02 '03 '04 '05 '06 '07 '08 '09 '10 '11 '12 '13 '14 '15 '16 '17 '18 '19 '20 '21 '22 EPRA key performance indicators1 31.12.2023 31.12.2022 EPRA NTA (in euros per share) 20.1 20.7 EPRA NRV (in euros per share) 22.0 22.6 EPRA NDV (in euros per share) 20.8 21.8 EPRA LTV (in %) 34.6 36.7 EPRA Net Initial Yield (in %) 5.3 5.0 EPRA Topped-up Net Initial Yield (in %) 5.3 5.0 EPRA vacancy rate (in %) 1.5 0.9 EPRA Cost Ratio (incl. direct vacancy costs) (in %) 10.9 10.0 1 The EPRA Key Performance Indicators are listed in Chapter 10. Reporting according to recognised standards provided with their definition and reconciliation. Share performance FINANCIAL RESULTS 6.8 bn € EPRA Earnings 6.0 % Like-for-like rental growth Fair value of the portfolio 20.1 € EPRA NTA per share 289.0 mio € +22% EPRA Earnings per share 1.40 € +12% 90.4 % Operational margin 5.3 years Average term of the leases 98.5 % Occupancy rate Annual accounts Governance Results Performance Strategy and value creation This is WDP ESG WDP 2023 Annual Report 76
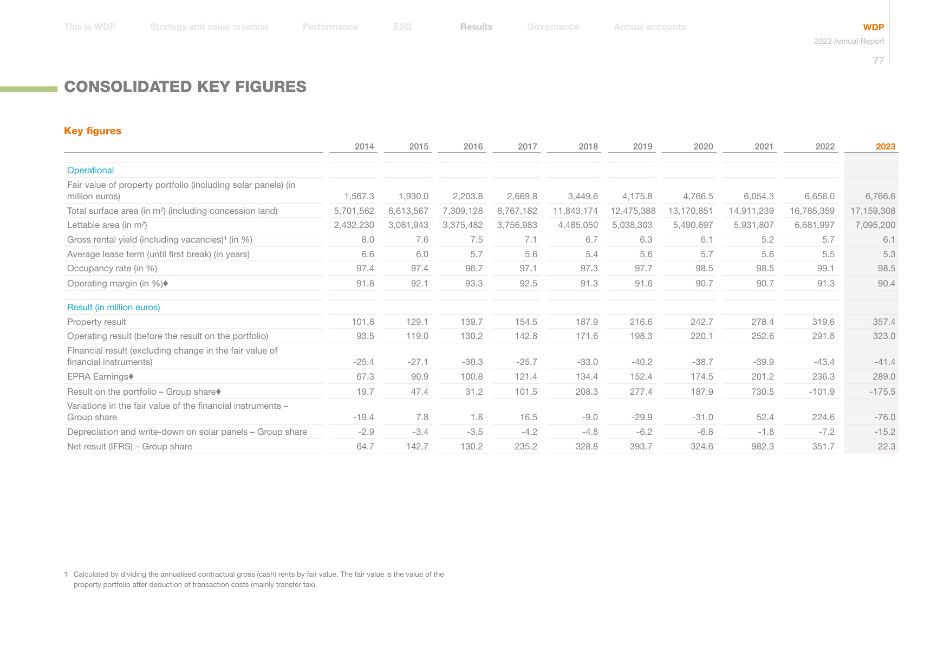
CONSOLIDATED KEY FIGURES Key figures 2014 2015 2016 2017 2018 2019 2020 2021 2022 2023 Operational Fair value of property portfolio (including solar panels) (in million euros) 1,567.3 1,930.0 2,203.8 2,669.8 3,449.6 4,175.8 4,766.5 6,054.3 6,656.0 6,766.6 Total surface area (in m²) (including concession land) 5,701,562 6,613,567 7,309,128 8,767,182 11,843,174 12,475,388 13,170,851 14,911,239 16,785,359 17,159,308 Lettable area (in m²) 2,432,230 3,081,943 3,375,482 3,756,983 4,485,050 5,038,303 5,490,697 5,931,807 6,681,997 7,095,200 Gross rental yield (including vacancies)¹ (in %) 8.0 7.6 7.5 7.1 6.7 6.3 6.1 5.2 5.7 6.1 Average lease term (until first break) (in years) 6.6 6.0 5.7 5.6 5.4 5.6 5.7 5.6 5.5 5.3 Occupancy rate (in %) 97.4 97.4 96.7 97.1 97.3 97.7 98.5 98.5 99.1 98.5 Operating margin (in %)♦ 91.8 92.1 93.3 92.5 91.3 91.6 90.7 90.7 91.3 90.4 Result (in million euros) Property result 101.8 129.1 139.7 154.5 187.9 216.6 242.7 278.4 319.6 357.4 Operating result (before the result on the portfolio) 93.5 119.0 130.2 142.8 171.6 198.3 220.1 252.6 291.8 323.0 Financial result (excluding change in the fair value of financial instruments) -25.4 -27.1 -30.3 -25.7 -33.0 -40.2 -38.7 -39.9 -43.4 -41.4 EPRA Earnings♦ 67.3 90.9 100.8 121.4 134.4 152.4 174.5 201.2 236.3 289.0 Result on the portfolio – Group share♦ 19.7 47.4 31.2 101.5 208.3 277.4 187.9 730.5 -101.9 -175.5 Variations in the fair value of the financial instruments – Group share -19.4 7.8 1.8 16.5 -9.0 -29.9 -31.0 52.4 224.6 -76.0 Depreciation and write-down on solar panels – Group share -2.9 -3.4 -3.5 -4.2 -4.8 -6.2 -6.8 -1.8 -7.2 -15.2 Net result (IFRS) – Group share 64.7 142.7 130.2 235.2 328.8 393.7 324.6 982.3 351.7 22.3 1 Calculated by dividing the annualised contractual gross (cash) rents by fair value. The fair value is the value of the property portfolio after deduction of transaction costs (mainly transfer tax). Annual accounts Governance Results Performance Strategy and value creation This is WDP ESG WDP 2023 Annual Report 77
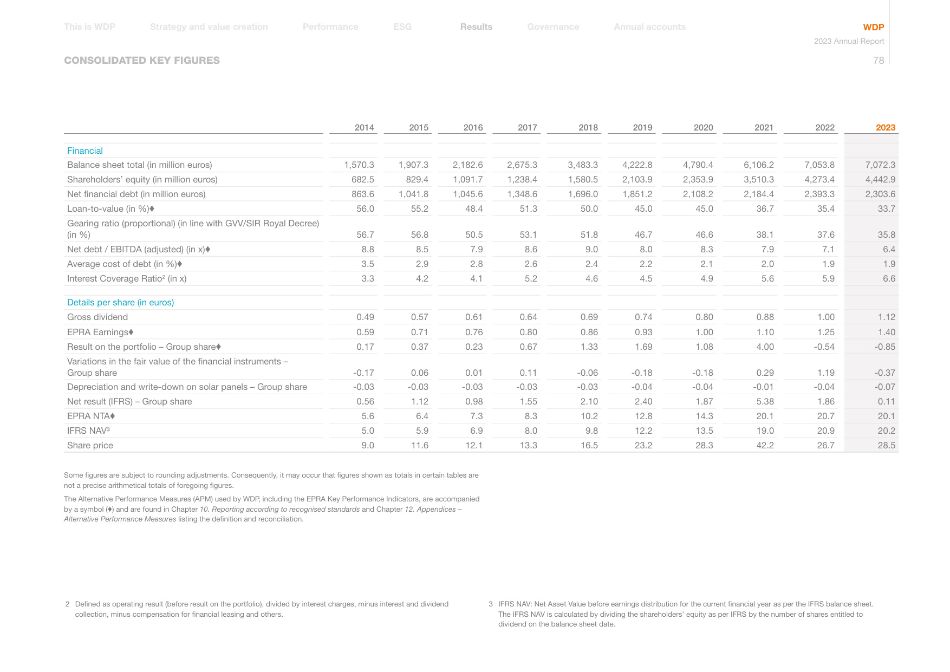
CONSOLIDATED KEY FIGURES 2014 2015 2016 2017 2018 2019 2020 2021 2022 2023 Financial Balance sheet total (in million euros) 1,570.3 1,907.3 2,182.6 2,675.3 3,483.3 4,222.8 4,790.4 6,106.2 7,053.8 7,072.3 Shareholders' equity (in million euros) 682.5 829.4 1,091.7 1,238.4 1,580.5 2,103.9 2,353.9 3,510.3 4,273.4 4,442.9 Net financial debt (in million euros) 863.6 1,041.8 1,045.6 1,348.6 1,696.0 1,851.2 2,108.2 2,184.4 2,393.3 2,303.6 Loan-to-value (in %)♦ 56.0 55.2 48.4 51.3 50.0 45.0 45.0 36.7 35.4 33.7 Gearing ratio (proportional) (in line with GVV/SIR Royal Decree) (in %) 56.7 56.8 50.5 53.1 51.8 46.7 46.6 38.1 37.6 35.8 Net debt / EBITDA (adjusted) (in x)♦ 8.8 8.5 7.9 8.6 9.0 8.0 8.3 7.9 7.1 6.4 Average cost of debt (in %)♦ 3.5 2.9 2.8 2.6 2.4 2.2 2.1 2.0 1.9 1.9 Interest Coverage Ratio2 (in x) 3.3 4.2 4.1 5.2 4.6 4.5 4.9 5.6 5.9 6.6 Details per share (in euros) Gross dividend 0.49 0.57 0.61 0.64 0.69 0.74 0.80 0.88 1.00 1.12 EPRA Earnings♦ 0.59 0.71 0.76 0.80 0.86 0.93 1.00 1.10 1.25 1.40 Result on the portfolio – Group share♦ 0.17 0.37 0.23 0.67 1.33 1.69 1.08 4.00 -0.54 -0.85 Variations in the fair value of the financial instruments – Group share -0.17 0.06 0.01 0.11 -0.06 -0.18 -0.18 0.29 1.19 -0.37 Depreciation and write-down on solar panels – Group share -0.03 -0.03 -0.03 -0.03 -0.03 -0.04 -0.04 -0.01 -0.04 -0.07 Net result (IFRS) – Group share 0.56 1.12 0.98 1.55 2.10 2.40 1.87 5.38 1.86 0.11 EPRA NTA♦ 5.6 6.4 7.3 8.3 10.2 12.8 14.3 20.1 20.7 20.1 IFRS NAV³ 5.0 5.9 6.9 8.0 9.8 12.2 13.5 19.0 20.9 20.2 Share price 9.0 11.6 12.1 13.3 16.5 23.2 28.3 42.2 26.7 28.5 2 Defined as operating result (before result on the portfolio), divided by interest charges, minus interest and dividend collection, minus compensation for financial leasing and others. 3 IFRS NAV: Net Asset Value before earnings distribution for the current financial year as per the IFRS balance sheet. The IFRS NAV is calculated by dividing the shareholders' equity as per IFRS by the number of shares entitled to dividend on the balance sheet date. Some figures are subject to rounding adjustments. Consequently, it may occur that figures shown as totals in certain tables are not a precise arithmetical totals of foregoing figures. The Alternative Performance Measures (APM) used by WDP, including the EPRA Key Performance Indicators, are accompanied by a symbol (♦) and are found in Chapter 10. Reporting according to recognised standards and Chapter 12. Appendices – Alternative Performance Measures listing the definition and reconciliation. Annual accounts Governance Results Performance Strategy and value creation This is WDP ESG WDP 2023 Annual Report 78
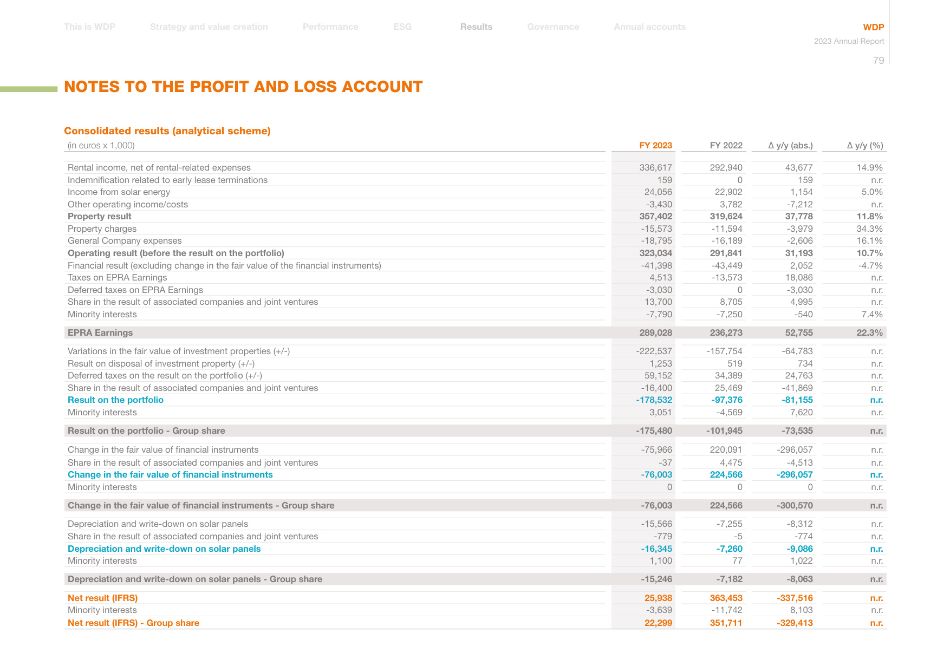
NOTES TO THE PROFIT AND LOSS ACCOUNT Consolidated results (analytical scheme) (in euros x 1,000) FY 2023 FY 2022 ∆ y/y (abs.) ∆ y/y (%) Rental income, net of rental-related expenses 336,617 292,940 43,677 14.9% Indemnification related to early lease terminations 159 0 159 n.r. Income from solar energy 24,056 22,902 1,154 5.0% Other operating income/costs -3,430 3,782 -7,212 n.r. Property result 357,402 319,624 37,778 11.8% Property charges -15,573 -11,594 -3,979 34.3% General Company expenses -18,795 -16,189 -2,606 16.1% Operating result (before the result on the portfolio) 323,034 291,841 31,193 10.7% Financial result (excluding change in the fair value of the financial instruments) -41,398 -43,449 2,052 -4.7% Taxes on EPRA Earnings 4,513 -13,573 18,086 n.r. Deferred taxes on EPRA Earnings -3,030 0 -3,030 n.r. Share in the result of associated companies and joint ventures 13,700 8,705 4,995 n.r. Minority interests -7,790 -7,250 -540 7.4% EPRA Earnings 289,028 236,273 52,755 22.3% Variations in the fair value of investment properties (+/-) -222,537 -157,754 -64,783 n.r. Result on disposal of investment property (+/-) 1,253 519 734 n.r. Deferred taxes on the result on the portfolio (+/-) 59,152 34,389 24,763 n.r. Share in the result of associated companies and joint ventures -16,400 25,469 -41,869 n.r. Result on the portfolio -178,532 -97,376 -81,155 n.r. Minority interests 3,051 -4,569 7,620 n.r. Result on the portfolio - Group share -175,480 -101,945 -73,535 n.r. Change in the fair value of financial instruments -75,966 220,091 -296,057 n.r. Share in the result of associated companies and joint ventures -37 4,475 -4,513 n.r. Change in the fair value of financial instruments -76,003 224,566 -296,057 n.r. Minority interests 0 0 0 n.r. Change in the fair value of financial instruments - Group share -76,003 224,566 -300,570 n.r. Depreciation and write-down on solar panels -15,566 -7,255 -8,312 n.r. Share in the result of associated companies and joint ventures -779 -5 -774 n.r. Depreciation and write-down on solar panels -16,345 -7,260 -9,086 n.r. Minority interests 1,100 77 1,022 n.r. Depreciation and write-down on solar panels - Group share -15,246 -7,182 -8,063 n.r. Net result (IFRS) 25,938 363,453 -337,516 n.r. Minority interests -3,639 -11,742 8,103 n.r. Net result (IFRS) - Group share 22,299 351,711 -329,413 n.r. Annual accounts Governance Results Performance Strategy and value creation This is WDP ESG WDP 2023 Annual Report 79
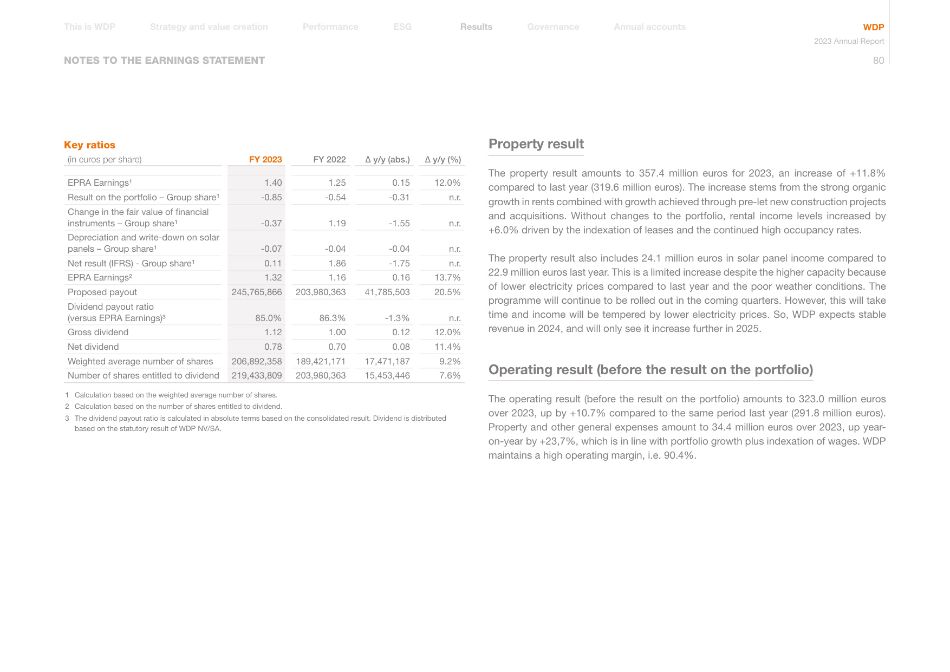
NOTES TO THE EARNINGS STATEMENT Key ratios (in euros per share) FY 2023 FY 2022 ∆ y/y (abs.) ∆ y/y (%) EPRA Earnings¹ 1.40 1.25 0.15 12.0% Result on the portfolio – Group share¹ -0.85 -0.54 -0.31 n.r. Change in the fair value of financial instruments – Group share¹ -0.37 1.19 -1.55 n.r. Depreciation and write-down on solar panels – Group share¹ -0.07 -0.04 -0.04 n.r. Net result (IFRS) - Group share¹ 0.11 1.86 -1.75 n.r. EPRA Earnings² 1.32 1.16 0.16 13.7% Proposed payout 245,765,866 203,980,363 41,785,503 20.5% Dividend payout ratio (versus EPRA Earnings)³ 85.0% 86.3% -1.3% n.r. Gross dividend 1.12 1.00 0.12 12.0% Net dividend 0.78 0.70 0.08 11.4% Weighted average number of shares 206,892,358 189,421,171 17,471,187 9.2% Number of shares entitled to dividend 219,433,809 203,980,363 15,453,446 7.6% 1 Calculation based on the weighted average number of shares. 2 Calculation based on the number of shares entitled to dividend. 3 The dividend payout ratio is calculated in absolute terms based on the consolidated result. Dividend is distributed based on the statutory result of WDP NV/SA. Property result The property result amounts to 357.4 million euros for 2023, an increase of +11.8% compared to last year (319.6 million euros). The increase stems from the strong organic growth in rents combined with growth achieved through pre-let new construction projects and acquisitions. Without changes to the portfolio, rental income levels increased by +6.0% driven by the indexation of leases and the continued high occupancy rates. The property result also includes 24.1 million euros in solar panel income compared to 22.9 million euros last year. This is a limited increase despite the higher capacity because of lower electricity prices compared to last year and the poor weather conditions. The programme will continue to be rolled out in the coming quarters. However, this will take time and income will be tempered by lower electricity prices. So, WDP expects stable revenue in 2024, and will only see it increase further in 2025. Operating result (before the result on the portfolio) The operating result (before the result on the portfolio) amounts to 323.0 million euros over 2023, up by +10.7% compared to the same period last year (291.8 million euros). Property and other general expenses amount to 34.4 million euros over 2023, up year- on-year by +23,7%, which is in line with portfolio growth plus indexation of wages. WDP maintains a high operating margin, i.e. 90.4%. Annual accounts Governance Results Performance Strategy and value creation This is WDP ESG WDP 2023 Annual Report 80
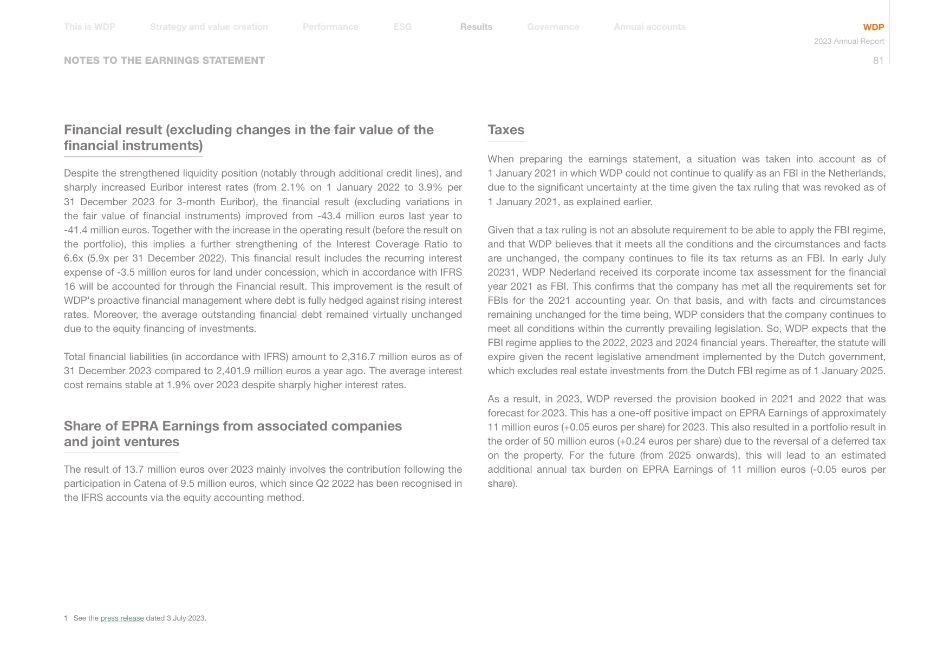
NOTES TO THE EARNINGS STATEMENT Financial result (excluding changes in the fair value of the financial instruments) Despite the strengthened liquidity position (notably through additional credit lines), and sharply increased Euribor interest rates (from 2.1% on 1 January 2022 to 3.9% per 31 December 2023 for 3-month Euribor), the financial result (excluding variations in the fair value of financial instruments) improved from -43.4 million euros last year to -41.4 million euros. Together with the increase in the operating result (before the result on the portfolio), this implies a further strengthening of the Interest Coverage Ratio to 6.6x (5.9x per 31 December 2022). This financial result includes the recurring interest expense of -3.5 million euros for land under concession, which in accordance with IFRS 16 will be accounted for through the Financial result. This improvement is the result of WDP's proactive financial management where debt is fully hedged against rising interest rates. Moreover, the average outstanding financial debt remained virtually unchanged due to the equity financing of investments. Total financial liabilities (in accordance with IFRS) amount to 2,316.7 million euros as of 31 December 2023 compared to 2,401.9 million euros a year ago. The average interest cost remains stable at 1.9% over 2023 despite sharply higher interest rates. Share of EPRA Earnings from associated companies and joint ventures The result of 13.7 million euros over 2023 mainly involves the contribution following the participation in Catena of 9.5 million euros, which since Q2 2022 has been recognised in the IFRS accounts via the equity accounting method. 1 See the press release dated 3 July 2023. Taxes When preparing the earnings statement, a situation was taken into account as of 1 January 2021 in which WDP could not continue to qualify as an FBI in the Netherlands, due to the significant uncertainty at the time given the tax ruling that was revoked as of 1 January 2021, as explained earlier. Given that a tax ruling is not an absolute requirement to be able to apply the FBI regime, and that WDP believes that it meets all the conditions and the circumstances and facts are unchanged, the company continues to file its tax returns as an FBI. In early July 20231, WDP Nederland received its corporate income tax assessment for the financial year 2021 as FBI. This confirms that the company has met all the requirements set for FBIs for the 2021 accounting year. On that basis, and with facts and circumstances remaining unchanged for the time being, WDP considers that the company continues to meet all conditions within the currently prevailing legislation. So, WDP expects that the FBI regime applies to the 2022, 2023 and 2024 financial years. Thereafter, the statute will expire given the recent legislative amendment implemented by the Dutch government, which excludes real estate investments from the Dutch FBI regime as of 1 January 2025. As a result, in 2023, WDP reversed the provision booked in 2021 and 2022 that was forecast for 2023. This has a one-off positive impact on EPRA Earnings of approximately 11 million euros (+0.05 euros per share) for 2023. This also resulted in a portfolio result in the order of 50 million euros (+0.24 euros per share) due to the reversal of a deferred tax on the property. For the future (from 2025 onwards), this will lead to an estimated additional annual tax burden on EPRA Earnings of 11 million euros (-0.05 euros per share). Annual accounts Governance Results Performance Strategy and value creation This is WDP ESG WDP 2023 Annual Report 81
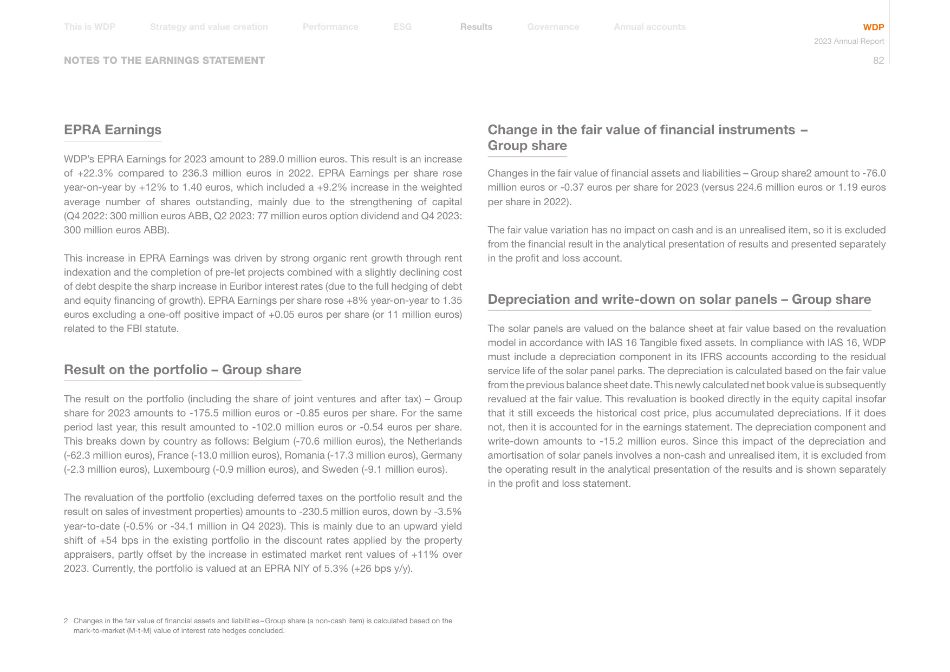
NOTES TO THE EARNINGS STATEMENT EPRA Earnings WDP's EPRA Earnings for 2023 amount to 289.0 million euros. This result is an increase of +22.3% compared to 236.3 million euros in 2022. EPRA Earnings per share rose year-on-year by +12% to 1.40 euros, which included a +9.2% increase in the weighted average number of shares outstanding, mainly due to the strengthening of capital (Q4 2022: 300 million euros ABB, Q2 2023: 77 million euros option dividend and Q4 2023: 300 million euros ABB). This increase in EPRA Earnings was driven by strong organic rent growth through rent indexation and the completion of pre-let projects combined with a slightly declining cost of debt despite the sharp increase in Euribor interest rates (due to the full hedging of debt and equity financing of growth). EPRA Earnings per share rose +8% year-on-year to 1.35 euros excluding a one-off positive impact of +0.05 euros per share (or 11 million euros) related to the FBI statute. Result on the portfolio – Group share The result on the portfolio (including the share of joint ventures and after tax) – Group share for 2023 amounts to -175.5 million euros or -0.85 euros per share. For the same period last year, this result amounted to -102.0 million euros or -0.54 euros per share. This breaks down by country as follows: Belgium (-70.6 million euros), the Netherlands (-62.3 million euros), France (-13.0 million euros), Romania (-17.3 million euros), Germany (-2.3 million euros), Luxembourg (-0.9 million euros), and Sweden (-9.1 million euros). The revaluation of the portfolio (excluding deferred taxes on the portfolio result and the result on sales of investment properties) amounts to -230.5 million euros, down by -3.5% year-to-date (-0.5% or -34.1 million in Q4 2023). This is mainly due to an upward yield shift of +54 bps in the existing portfolio in the discount rates applied by the property appraisers, partly offset by the increase in estimated market rent values of +11% over 2023. Currently, the portfolio is valued at an EPRA NIY of 5.3% (+26 bps y/y). 2 Changes in the fair value of financial assets and liabilities – Group share (a non-cash item) is calculated based on the mark-to-market (M-t-M) value of interest rate hedges concluded. Change in the fair value of financial instruments – Group share Changes in the fair value of financial assets and liabilities – Group share2 amount to -76.0 million euros or -0.37 euros per share for 2023 (versus 224.6 million euros or 1.19 euros per share in 2022). The fair value variation has no impact on cash and is an unrealised item, so it is excluded from the financial result in the analytical presentation of results and presented separately in the profit and loss account. Depreciation and write-down on solar panels – Group share The solar panels are valued on the balance sheet at fair value based on the revaluation model in accordance with IAS 16 Tangible fixed assets. In compliance with IAS 16, WDP must include a depreciation component in its IFRS accounts according to the residual service life of the solar panel parks. The depreciation is calculated based on the fair value from the previous balance sheet date. This newly calculated net book value is subsequently revalued at the fair value. This revaluation is booked directly in the equity capital insofar that it still exceeds the historical cost price, plus accumulated depreciations. If it does not, then it is accounted for in the earnings statement. The depreciation component and write-down amounts to -15.2 million euros. Since this impact of the depreciation and amortisation of solar panels involves a non-cash and unrealised item, it is excluded from the operating result in the analytical presentation of the results and is shown separately in the profit and loss statement. Annual accounts Governance Results Performance Strategy and value creation This is WDP ESG WDP 2023 Annual Report 82
Net result (IFRS) – Group share The EPRA Earnings along with the result on the portfolio, changes in the fair value of financial instruments and depreciation and write-down of the solar panels, lead to a net result (IFRS) – Group share over 2023 of 22.3 million euros (compared to the same period last year when it amounted to 351.7 million euros). The difference between the net result (IFRS) – Group share of 22.3 million euros and the EPRA Earnings of 289.0 million euros is mainly due to the depreciation of the portfolio and the negative variation of interest rate hedging instruments. NOTES TO THE EARNINGS STATEMENT Annual accounts Governance Results Performance Strategy and value creation This is WDP ESG WDP 2023 Annual Report 83
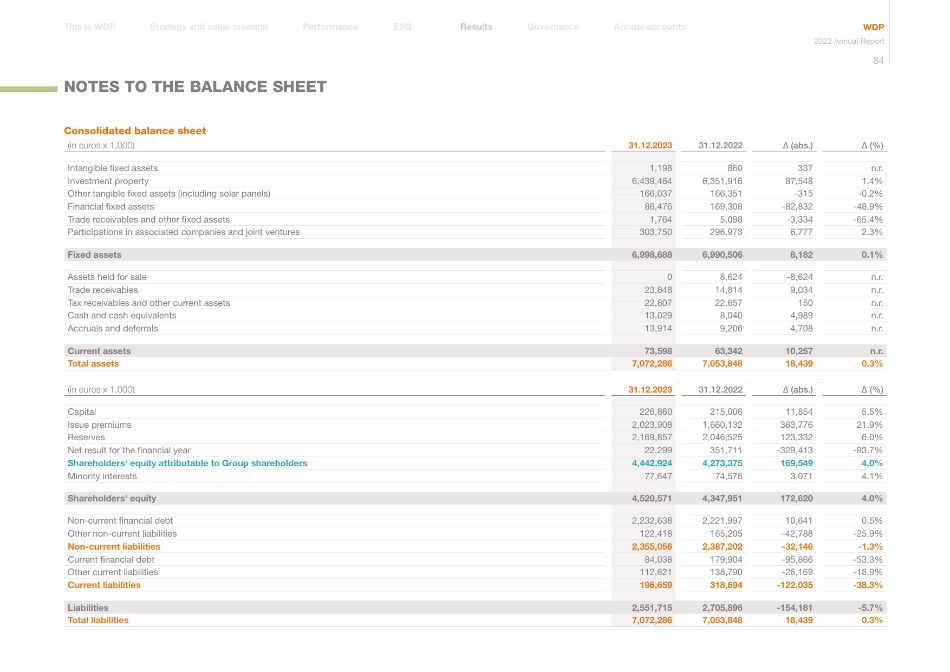
NOTES TO THE BALANCE SHEET Consolidated balance sheet (in euros x 1,000) 31.12.2023 31.12.2022 ∆ (abs.) ∆ (%) Intangible fixed assets 1,198 860 337 n.r. Investment property 6,439,464 6,351,916 87,548 1.4% Other tangible fixed assets (including solar panels) 166,037 166,351 -315 -0.2% Financial fixed assets 86,476 169,308 -82,832 -48.9% Trade receivables and other fixed assets 1,764 5,098 -3,334 -65.4% Participations in associated companies and joint ventures 303,750 296,973 6,777 2.3% Fixed assets 6,998,688 6,990,506 8,182 0.1% Assets held for sale 0 8,624 -8,624 n.r. Trade receivables 23,848 14,814 9,034 n.r. Tax receivables and other current assets 22,807 22,657 150 n.r. Cash and cash equivalents 13,029 8,040 4,989 n.r. Accruals and deferrals 13,914 9,206 4,708 n.r. Current assets 73,598 63,342 10,257 n.r. Total assets 7,072,286 7,053,848 18,439 0.3% (in euros x 1,000) 31.12.2023 31.12.2022 ∆ (abs.) ∆ (%) Capital 226,860 215,006 11,854 5.5% Issue premiums 2,023,908 1,660,132 363,776 21.9% Reserves 2,169,857 2,046,525 123,332 6.0% Net result for the financial year 22,299 351,711 -329,413 -93.7% Shareholders' equity attributable to Group shareholders 4,442,924 4,273,375 169,549 4.0% Minority interests 77,647 74,576 3,071 4.1% Shareholders' equity 4,520,571 4,347,951 172,620 4.0% Non-current financial debt 2,232,638 2,221,997 10,641 0.5% Other non-current liabilities 122,418 165,205 -42,788 -25.9% Non-current liabilities 2,355,056 2,387,202 -32,146 -1.3% Current financial debt 84,038 179,904 -95,866 -53.3% Other current liabilities 112,621 138,790 -26,169 -18.9% Current liabilities 196,659 318,694 -122,035 -38.3% Liabilities 2,551,715 2,705,896 -154,181 -5.7% Total liabilities 7,072,286 7,053,848 18,439 0.3% Annual accounts Governance Results Performance Strategy and value creation This is WDP ESG WDP 2023 Annual Report 84
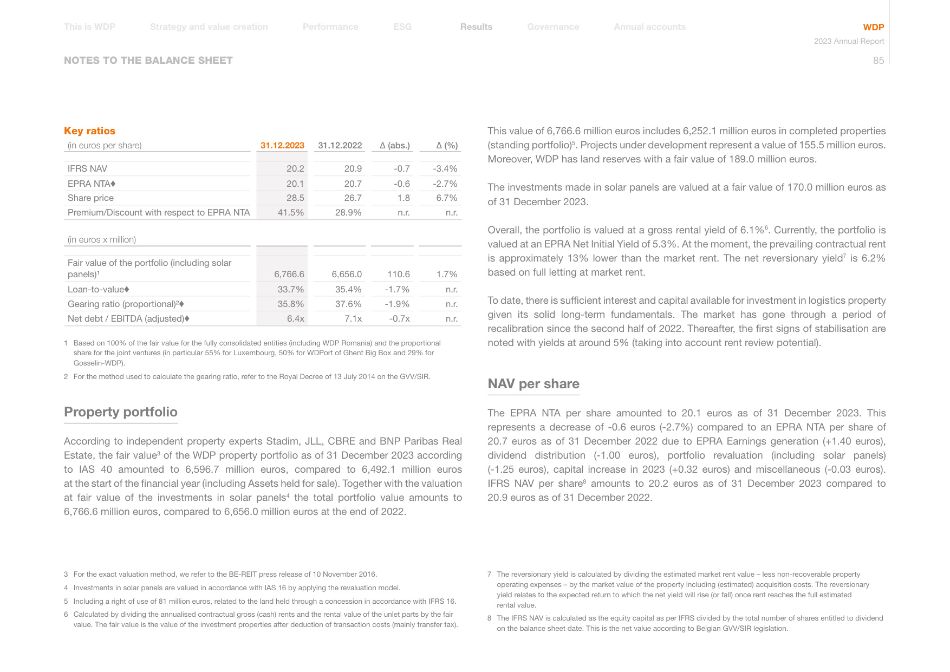
NOTES TO THE BALANCE SHEET Key ratios (in euros per share) 31.12.2023 31.12.2022 ∆ (abs.) ∆ (%) IFRS NAV 20.2 20.9 -0.7 -3.4% EPRA NTA♦ 20.1 20.7 -0.6 -2.7% Share price 28.5 26.7 1.8 6.7% Premium/Discount with respect to EPRA NTA 41.5% 28.9% n.r. n.r. (in euros x million) Fair value of the portfolio (including solar panels)¹ 6,766.6 6,656.0 110.6 1.7% Loan-to-value♦ 33.7% 35.4% -1.7% n.r. Gearing ratio (proportional)²♦ 35.8% 37.6% -1.9% n.r. Net debt / EBITDA (adjusted)♦ 6.4x 7.1x -0.7x n.r. 1 Based on 100% of the fair value for the fully consolidated entities (including WDP Romania) and the proportional share for the joint ventures (in particular 55% for Luxembourg, 50% for WDPort of Ghent Big Box and 29% for Gosselin-WDP). 2 For the method used to calculate the gearing ratio, refer to the Royal Decree of 13 July 2014 on the GVV/SIR. Property portfolio According to independent property experts Stadim, JLL, CBRE and BNP Paribas Real Estate, the fair value3 of the WDP property portfolio as of 31 December 2023 according to IAS 40 amounted to 6,596.7 million euros, compared to 6,492.1 million euros at the start of the financial year (including Assets held for sale). Together with the valuation at fair value of the investments in solar panels4 the total portfolio value amounts to 6,766.6 million euros, compared to 6,656.0 million euros at the end of 2022. This value of 6,766.6 million euros includes 6,252.1 million euros in completed properties (standing portfolio)5. Projects under development represent a value of 155.5 million euros. Moreover, WDP has land reserves with a fair value of 189.0 million euros. The investments made in solar panels are valued at a fair value of 170.0 million euros as of 31 December 2023. Overall, the portfolio is valued at a gross rental yield of 6.1%6. Currently, the portfolio is valued at an EPRA Net Initial Yield of 5.3%. At the moment, the prevailing contractual rent is approximately 13% lower than the market rent. The net reversionary yield7 is 6.2% based on full letting at market rent. To date, there is sufficient interest and capital available for investment in logistics property given its solid long-term fundamentals. The market has gone through a period of recalibration since the second half of 2022. Thereafter, the first signs of stabilisation are noted with yields at around 5% (taking into account rent review potential). NAV per share The EPRA NTA per share amounted to 20.1 euros as of 31 December 2023. This represents a decrease of -0.6 euros (-2.7%) compared to an EPRA NTA per share of 20.7 euros as of 31 December 2022 due to EPRA Earnings generation (+1.40 euros), dividend distribution (-1.00 euros), portfolio revaluation (including solar panels) (-1.25 euros), capital increase in 2023 (+0.32 euros) and miscellaneous (-0.03 euros). IFRS NAV per share8 amounts to 20.2 euros as of 31 December 2023 compared to 20.9 euros as of 31 December 2022. 3 For the exact valuation method, we refer to the BE-REIT press release of 10 November 2016. 4 Investments in solar panels are valued in accordance with IAS 16 by applying the revaluation model. 5 Including a right of use of 81 million euros, related to the land held through a concession in accordance with IFRS 16. 6 Calculated by dividing the annualised contractual gross (cash) rents and the rental value of the unlet parts by the fair value. The fair value is the value of the investment properties after deduction of transaction costs (mainly transfer tax). 7 The reversionary yield is calculated by dividing the estimated market rent value – less non-recoverable property operating expenses – by the market value of the property including (estimated) acquisition costs. The reversionary yield relates to the expected return to which the net yield will rise (or fall) once rent reaches the full estimated rental value. 8 The IFRS NAV is calculated as the equity capital as per IFRS divided by the total number of shares entitled to dividend on the balance sheet date. This is the net value according to Belgian GVV/SIR legislation. Annual accounts Governance Results Performance Strategy and value creation This is WDP ESG WDP 2023 Annual Report 85
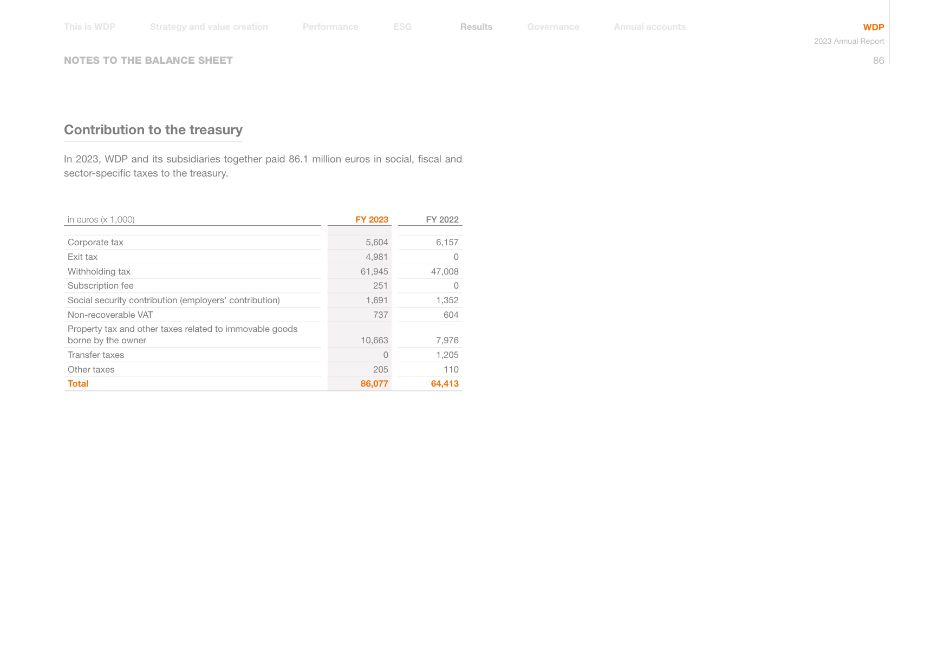
NOTES TO THE BALANCE SHEET Contribution to the treasury In 2023, WDP and its subsidiaries together paid 86.1 million euros in social, fiscal and sector-specific taxes to the treasury. in euros (x 1,000) FY 2023 FY 2022 Corporate tax 5,604 6,157 Exit tax 4,981 0 Withholding tax 61,945 47,008 Subscription fee 251 0 Social security contribution (employers' contribution) 1,691 1,352 Non-recoverable VAT 737 604 Property tax and other taxes related to immovable goods borne by the owner 10,663 7,976 Transfer taxes 0 1,205 Other taxes 205 110 Total 86,077 64,413 Annual accounts Governance Results Performance Strategy and value creation This is WDP ESG WDP 2023 Annual Report 86
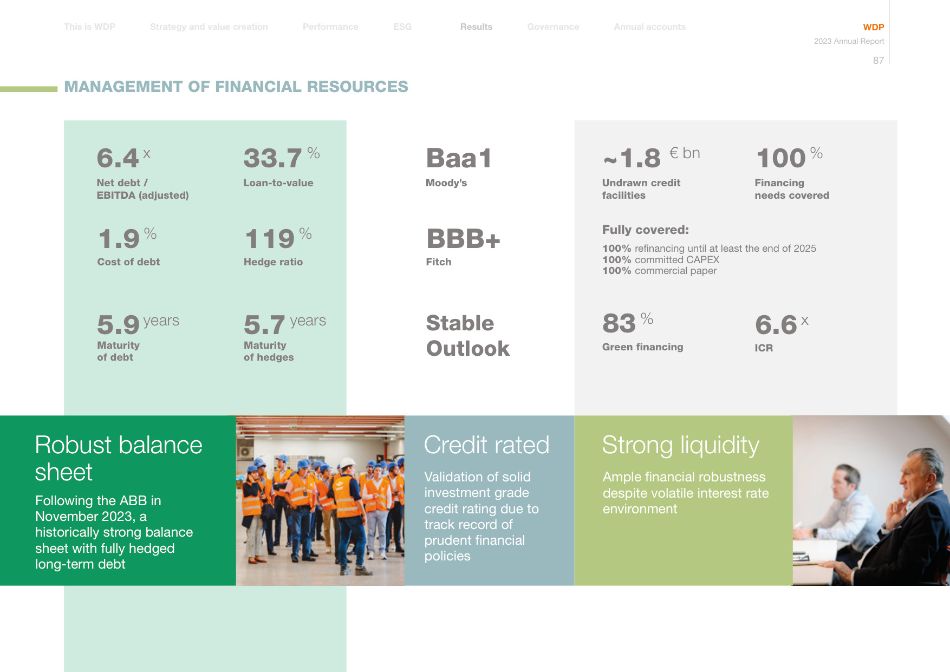
MANAGEMENT OF FINANCIAL RESOURCES Annual accounts Governance Results Performance Strategy and value creation This is WDP ESG WDP 2023 Annual Report 87 33.7 % Loan-to-value 6.4 x Net debt / EBITDA (adjusted) Baa1 Moody's 119 % Hedge ratio 1.9 % Cost of debt BBB+ Fitch 5.7 years Maturity of hedges 5.9 years Maturity of debt Stable Outlook Following the ABB in November 2023, a historically strong balance sheet with fully hedged long-term debt Validation of solid investment grade credit rating due to track record of prudent financial policies Ample financial robustness despite volatile interest rate environment Robust balance sheet Credit rated Strong liquidity 100 % Financing needs covered ~1.8 € bn Undrawn credit facilities 6.6 x ICR 83 % Green financing Fully covered: 100% refinancing until at least the end of 2025 100% committed CAPEX 100% commercial paper
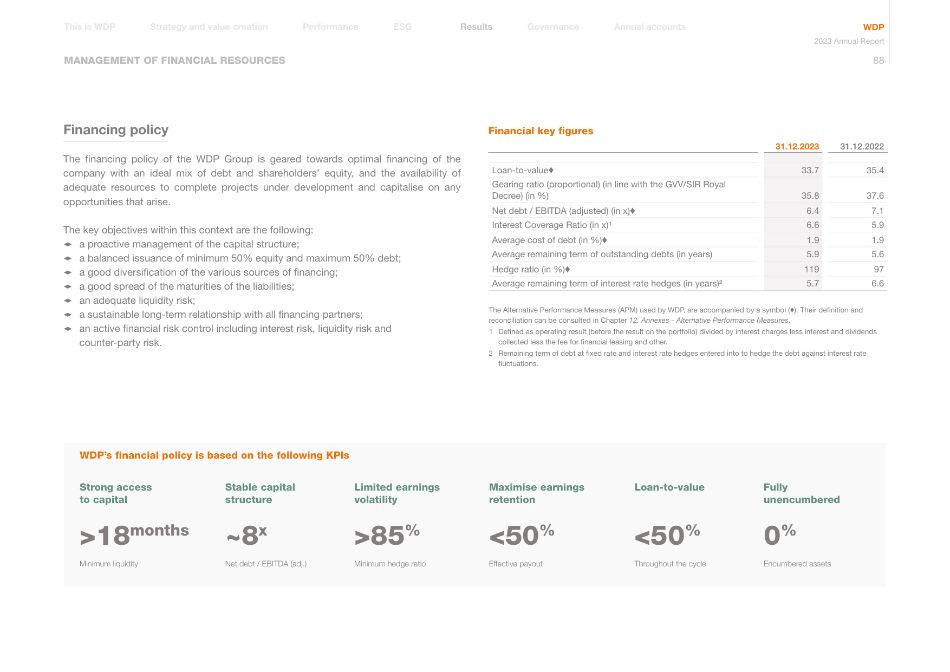
Financing policy The financing policy of the WDP Group is geared towards optimal financing of the company with an ideal mix of debt and shareholders' equity, and the availability of adequate resources to complete projects under development and capitalise on any opportunities that arise. The key objectives within this context are the following: 1 a proactive management of the capital structure; 1 a balanced issuance of minimum 50% equity and maximum 50% debt; 1 a good diversification of the various sources of financing; 1 a good spread of the maturities of the liabilities; 1 an adequate liquidity risk; 1 a sustainable long-term relationship with all financing partners; 1 an active financial risk control including interest risk, liquidity risk and counter-party risk. Financial key figures 31.12.2023 31.12.2022 Loan-to-value♦ 33.7 35.4 Gearing ratio (proportional) (in line with the GVV/SIR Royal Decree) (in %) 35.8 37.6 Net debt / EBITDA (adjusted) (in x)♦ 6.4 7.1 Interest Coverage Ratio (in x)¹ 6.6 5.9 Average cost of debt (in %)♦ 1.9 1.9 Average remaining term of outstanding debts (in years) 5.9 5.6 Hedge ratio (in %)♦ 119 97 Average remaining term of interest rate hedges (in years)² 5.7 6.6 The Alternative Performance Measures (APM) used by WDP, are accompanied by a symbol (♦). Their definition and reconciliation can be consulted in Chapter 12. Annexes - Alternative Performance Measures. 1 Defined as operating result (before the result on the portfolio) divided by interest charges less interest and dividends collected less the fee for financial leasing and other. 2 Remaining term of debt at fixed rate and interest rate hedges entered into to hedge the debt against interest rate fluctuations. WDP's financial policy is based on the following KPIs >18months Strong access to capital MANAGEMENT OF FINANCIAL RESOURCES Annual accounts Governance Results Performance Strategy and value creation This is WDP ESG WDP 2023 Annual Report 88 Minimum liquidity Effective payout Net debt / EBITDA (adj.) Throughout the cycle Minimum hedge ratio Encumbered assets ~8x <50% >85% 0% Stable capital structure Loan-to-value Limited earnings volatility Fully unencumbered <50% Maximise earnings retention
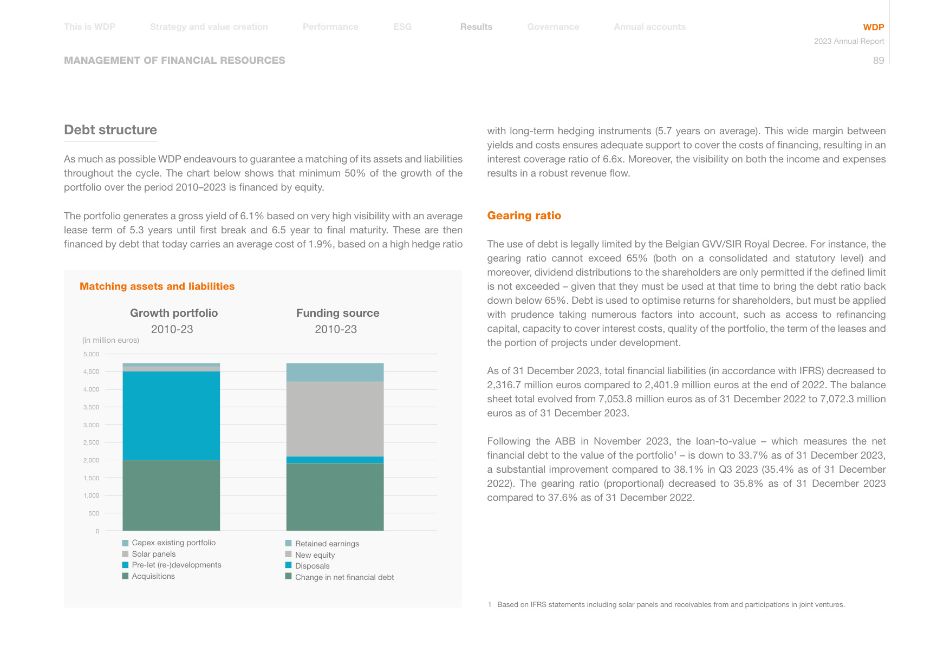
Debt structure As much as possible WDP endeavours to guarantee a matching of its assets and liabilities throughout the cycle. The chart below shows that minimum 50% of the growth of the portfolio over the period 2010–2023 is financed by equity. The portfolio generates a gross yield of 6.1% based on very high visibility with an average lease term of 5.3 years until first break and 6.5 year to final maturity. These are then financed by debt that today carries an average cost of 1.9%, based on a high hedge ratio (in million euros) Growth portfolio 2010-23 Funding source 2010-23 Capex existing portfolio Solar panels Pre-let (re-)developments Acquisitions Retained earnings New equity Disposals Change in net financial debt 5,000 4,500 4,000 3,500 3,000 2,500 2,000 1,500 1,000 500 0 Matching assets and liabilities 1 Based on IFRS statements including solar panels and receivables from and participations in joint ventures. MANAGEMENT OF FINANCIAL RESOURCES with long-term hedging instruments (5.7 years on average). This wide margin between yields and costs ensures adequate support to cover the costs of financing, resulting in an interest coverage ratio of 6.6x. Moreover, the visibility on both the income and expenses results in a robust revenue flow. Gearing ratio The use of debt is legally limited by the Belgian GVV/SIR Royal Decree. For instance, the gearing ratio cannot exceed 65% (both on a consolidated and statutory level) and moreover, dividend distributions to the shareholders are only permitted if the defined limit is not exceeded – given that they must be used at that time to bring the debt ratio back down below 65%. Debt is used to optimise returns for shareholders, but must be applied with prudence taking numerous factors into account, such as access to refinancing capital, capacity to cover interest costs, quality of the portfolio, the term of the leases and the portion of projects under development. As of 31 December 2023, total financial liabilities (in accordance with IFRS) decreased to 2,316.7 million euros compared to 2,401.9 million euros at the end of 2022. The balance sheet total evolved from 7,053.8 million euros as of 31 December 2022 to 7,072.3 million euros as of 31 December 2023. Following the ABB in November 2023, the loan-to-value – which measures the net financial debt to the value of the portfolio1 – is down to 33.7% as of 31 December 2023, a substantial improvement compared to 38.1% in Q3 2023 (35.4% as of 31 December 2022). The gearing ratio (proportional) decreased to 35.8% as of 31 December 2023 compared to 37.6% as of 31 December 2022. Annual accounts Governance Results Performance Strategy and value creation This is WDP ESG WDP 2023 Annual Report 89
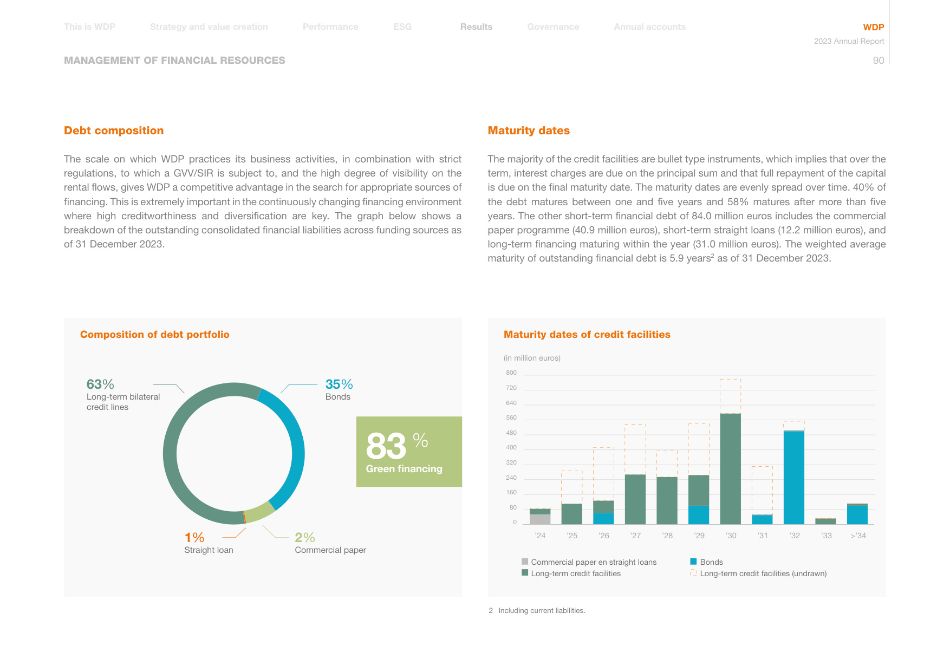
2% Commercial paper 1% Straight loan 35% Bonds 63% Long-term bilateral credit lines Bonds Long-term credit facilities (undrawn) >'34 0 80 160 240 320 400 480 560 640 720 800 (in million euros) '24 '25 '26 '27 '28 '29 '30 '31 '32 '33 Commercial paper en straight loans Long-term credit facilities 83 % Green financing 2 Including current liabilities. MANAGEMENT OF FINANCIAL RESOURCES Debt composition The scale on which WDP practices its business activities, in combination with strict regulations, to which a GVV/SIR is subject to, and the high degree of visibility on the rental flows, gives WDP a competitive advantage in the search for appropriate sources of financing. This is extremely important in the continuously changing financing environment where high creditworthiness and diversification are key. The graph below shows a breakdown of the outstanding consolidated financial liabilities across funding sources as of 31 December 2023. Maturity dates The majority of the credit facilities are bullet type instruments, which implies that over the term, interest charges are due on the principal sum and that full repayment of the capital is due on the final maturity date. The maturity dates are evenly spread over time. 40% of the debt matures between one and five years and 58% matures after more than five years. The other short-term financial debt of 84.0 million euros includes the commercial paper programme (40.9 million euros), short-term straight loans (12.2 million euros), and long-term financing maturing within the year (31.0 million euros). The weighted average maturity of outstanding financial debt is 5.9 years2 as of 31 December 2023. Maturity dates of credit facilities Composition of debt portfolio Annual accounts Governance Results Performance Strategy and value creation This is WDP ESG WDP 2023 Annual Report 90
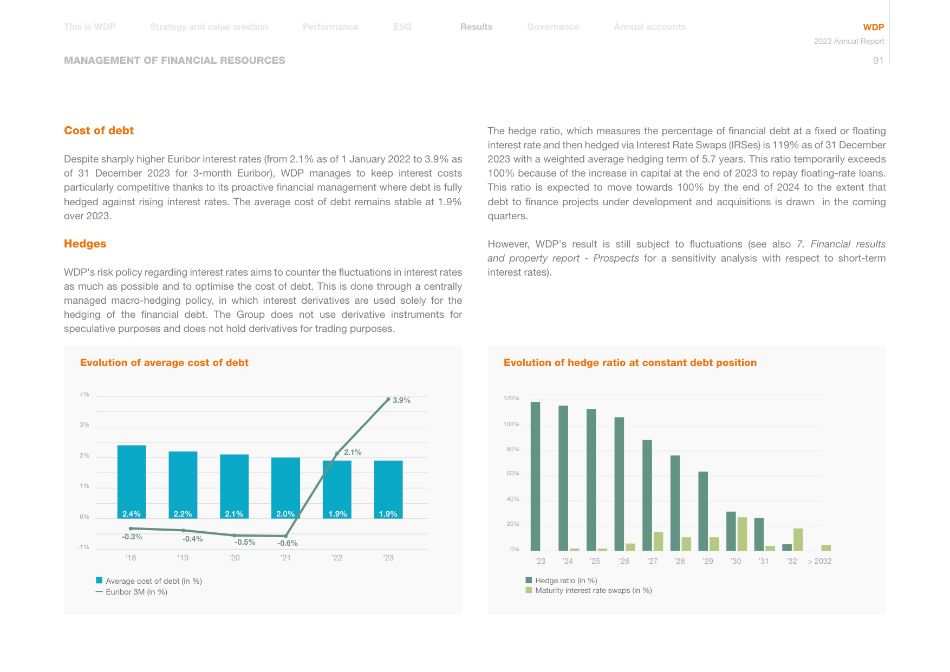
-0.3% 2.4% 2.2% 2.1% 2.0% 1.9% 1.9% -0.4% -0.5% -0.6% 2.1% 3.9% Average cost of debt (in %) Euribor 3M (in %) -1% 0% 1% 2% 3% 4% '18 '19 '20 '21 '22 '23 MANAGEMENT OF FINANCIAL RESOURCES Cost of debt Despite sharply higher Euribor interest rates (from 2.1% as of 1 January 2022 to 3.9% as of 31 December 2023 for 3-month Euribor), WDP manages to keep interest costs particularly competitive thanks to its proactive financial management where debt is fully hedged against rising interest rates. The average cost of debt remains stable at 1.9% over 2023. Hedges WDP's risk policy regarding interest rates aims to counter the fluctuations in interest rates as much as possible and to optimise the cost of debt. This is done through a centrally managed macro-hedging policy, in which interest derivatives are used solely for the hedging of the financial debt. The Group does not use derivative instruments for speculative purposes and does not hold derivatives for trading purposes. Hedge ratio (in %) Maturity interest rate swaps (in %) '23 '24 '25 '26 '27 '28 '29 '30 '31 '32 > 2032 120% 100% 80% 60% 40% 20% 0% The hedge ratio, which measures the percentage of financial debt at a fixed or floating interest rate and then hedged via Interest Rate Swaps (IRSes) is 119% as of 31 December 2023 with a weighted average hedging term of 5.7 years. This ratio temporarily exceeds 100% because of the increase in capital at the end of 2023 to repay floating-rate loans. This ratio is expected to move towards 100% by the end of 2024 to the extent that debt to finance projects under development and acquisitions is drawn in the coming quarters. However, WDP's result is still subject to fluctuations (see also 7. Financial results and property report - Prospects for a sensitivity analysis with respect to short-term interest rates). Evolution of hedge ratio at constant debt position Evolution of average cost of debt Annual accounts Governance Results Performance Strategy and value creation This is WDP ESG WDP 2023 Annual Report 91
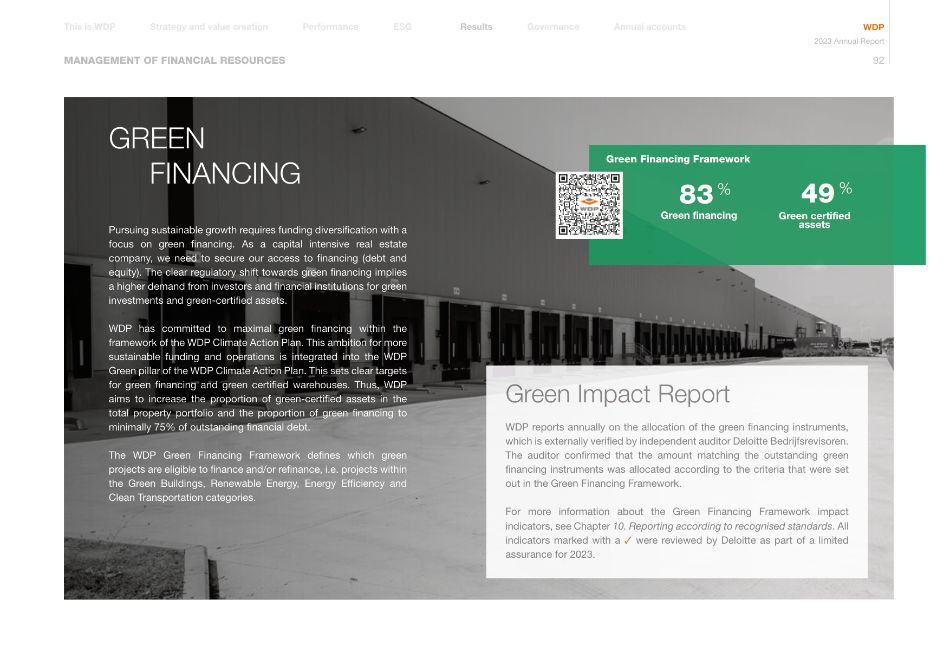
MANAGEMENT OF FINANCIAL RESOURCES GREEN FINANCING Pursuing sustainable growth requires funding diversification with a focus on green financing. As a capital intensive real estate company, we need to secure our access to financing (debt and equity). The clear regulatory shift towards green financing implies a higher demand from investors and financial institutions for green investments and green-certified assets. WDP has committed to maximal green financing within the framework of the WDP Climate Action Plan. This ambition for more sustainable funding and operations is integrated into the WDP Green pillar of the WDP Climate Action Plan. This sets clear targets for green financing and green certified warehouses. Thus, WDP aims to increase the proportion of green-certified assets in the total property portfolio and the proportion of green financing to minimally 75% of outstanding financial debt. The WDP Green Financing Framework defines which green projects are eligible to finance and/or refinance, i.e. projects within the Green Buildings, Renewable Energy, Energy Efficiency and Clean Transportation categories. Green Impact Report WDP reports annually on the allocation of the green financing instruments, which is externally verified by independent auditor Deloitte Bedrijfsrevisoren. The auditor confirmed that the amount matching the outstanding green financing instruments was allocated according to the criteria that were set out in the Green Financing Framework. For more information about the Green Financing Framework impact indicators, see Chapter 10. Reporting according to recognised standards. All indicators marked with a ✓ were reviewed by Deloitte as part of a limited assurance for 2023. Green financing 83 % Green certified assets 49 % Green Financing Framework Annual accounts Governance Results Performance Strategy and value creation This is WDP ESG WDP 2023 Annual Report 92
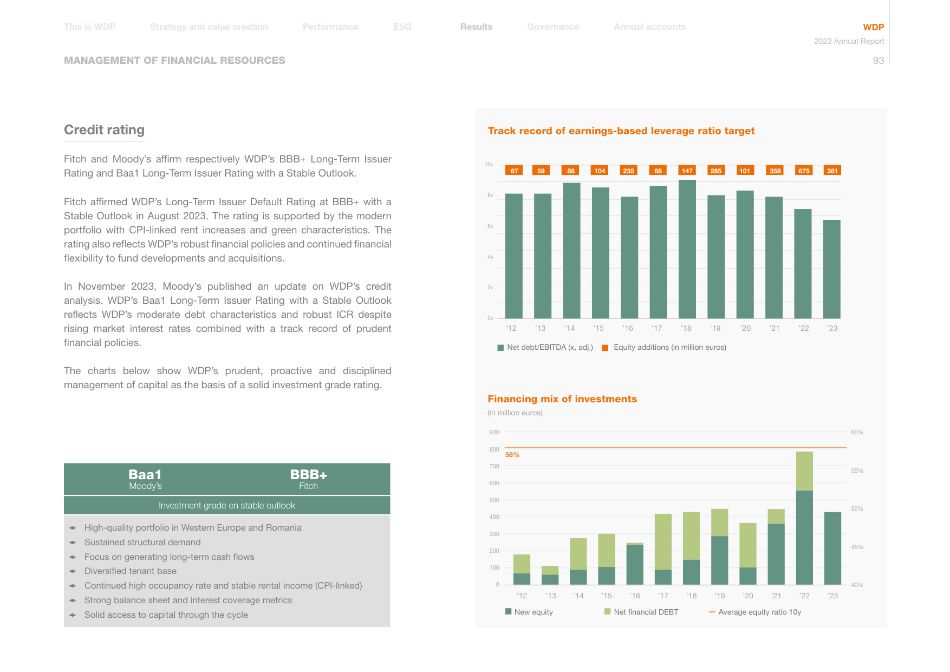
MANAGEMENT OF FINANCIAL RESOURCES Credit rating Fitch and Moody's affirm respectively WDP's BBB+ Long-Term Issuer Rating and Baa1 Long-Term Issuer Rating with a Stable Outlook. Fitch affirmed WDP's Long-Term Issuer Default Rating at BBB+ with a Stable Outlook in August 2023. The rating is supported by the modern portfolio with CPI-linked rent increases and green characteristics. The rating also reflects WDP's robust financial policies and continued financial flexibility to fund developments and acquisitions. In November 2023, Moody's published an update on WDP's credit analysis. WDP's Baa1 Long-Term Issuer Rating with a Stable Outlook reflects WDP's moderate debt characteristics and robust ICR despite rising market interest rates combined with a track record of prudent financial policies. The charts below show WDP's prudent, proactive and disciplined management of capital as the basis of a solid investment grade rating. 900 800 700 600 500 400 300 200 100 0 60% 55% 50% 45% 40% Net financial DEBT '22 '23 Average equity ratio 10y '12 '13 '14 '15 '16 '17 '18 '19 '20 '21 New equity (in million euros) 58% Baa1 Moody's BBB+ Fitch Investment grade en stable outlook 1 High-quality portfolio in Western Europe and Romania 1 Sustained structural demand 1 Focus on generating long-term cash flows 1 Diversified tenant base 1 Continued high occupancy rate and stable rental income (CPI-linked) 1 Strong balance sheet and interest coverage metrics 1 Solid access to capital through the cycle Net debt/EBITDA (x, adj.) '12 '13 '14 '15 '16 '17 '18 '19 '20 '21 '22 '23 67 59 88 104 235 88 147 285 101 358 675 381 10x 8x 6x 4x 2x 0x Equity additions (in million euros) Track record of earnings-based leverage ratio target Financing mix of investments Annual accounts Governance Results Performance Strategy and value creation This is WDP ESG WDP 2023 Annual Report 93
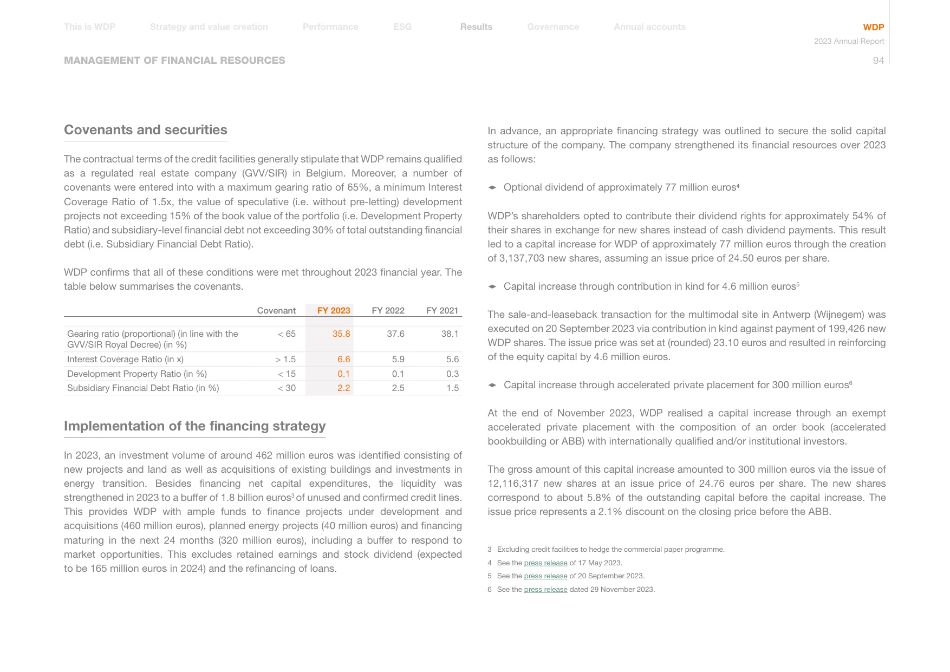
MANAGEMENT OF FINANCIAL RESOURCES Covenants and securities The contractual terms of the credit facilities generally stipulate that WDP remains qualified as a regulated real estate company (GVV/SIR) in Belgium. Moreover, a number of covenants were entered into with a maximum gearing ratio of 65%, a minimum Interest Coverage Ratio of 1.5x, the value of speculative (i.e. without pre-letting) development projects not exceeding 15% of the book value of the portfolio (i.e. Development Property Ratio) and subsidiary-level financial debt not exceeding 30% of total outstanding financial debt (i.e. Subsidiary Financial Debt Ratio). WDP confirms that all of these conditions were met throughout 2023 financial year. The table below summarises the covenants. Covenant FY 2023 FY 2022 FY 2021 Gearing ratio (proportional) (in line with the GVV/SIR Royal Decree) (in %) < 65 35.8 37.6 38.1 Interest Coverage Ratio (in x) > 1.5 6.6 5.9 5.6 Development Property Ratio (in %) < 15 0.1 0.1 0.3 Subsidiary Financial Debt Ratio (in %) < 30 2.2 2.5 1.5 Implementation of the financing strategy In 2023, an investment volume of around 462 million euros was identified consisting of new projects and land as well as acquisitions of existing buildings and investments in energy transition. Besides financing net capital expenditures, the liquidity was strengthened in 2023 to a buffer of 1.8 billion euros3 of unused and confirmed credit lines. This provides WDP with ample funds to finance projects under development and acquisitions (460 million euros), planned energy projects (40 million euros) and financing maturing in the next 24 months (320 million euros), including a buffer to respond to market opportunities. This excludes retained earnings and stock dividend (expected to be 165 million euros in 2024) and the refinancing of loans. In advance, an appropriate financing strategy was outlined to secure the solid capital structure of the company. The company strengthened its financial resources over 2023 as follows: 1 Optional dividend of approximately 77 million euros4 WDP's shareholders opted to contribute their dividend rights for approximately 54% of their shares in exchange for new shares instead of cash dividend payments. This result led to a capital increase for WDP of approximately 77 million euros through the creation of 3,137,703 new shares, assuming an issue price of 24.50 euros per share. 1 Capital increase through contribution in kind for 4.6 million euros5 The sale-and-leaseback transaction for the multimodal site in Antwerp (Wijnegem) was executed on 20 September 2023 via contribution in kind against payment of 199,426 new WDP shares. The issue price was set at (rounded) 23.10 euros and resulted in reinforcing of the equity capital by 4.6 million euros. 1 Capital increase through accelerated private placement for 300 million euros6 At the end of November 2023, WDP realised a capital increase through an exempt accelerated private placement with the composition of an order book (accelerated bookbuilding or ABB) with internationally qualified and/or institutional investors. The gross amount of this capital increase amounted to 300 million euros via the issue of 12,116,317 new shares at an issue price of 24.76 euros per share. The new shares correspond to about 5.8% of the outstanding capital before the capital increase. The issue price represents a 2.1% discount on the closing price before the ABB. 3 Excluding credit facilities to hedge the commercial paper programme. 4 See the press release of 17 May 2023. 5 See the press release of 20 September 2023. 6 See the press release dated 29 November 2023. Annual accounts Governance Results Performance Strategy and value creation This is WDP ESG WDP 2023 Annual Report 94
MANAGEMENT OF FINANCIAL RESOURCES 1 New financing and refinancing WDP was also able to extend existing credit lines and secure additional funding for around 400 million euros from various Belgian and foreign banks in 2023. Financial risks In 2023, WDP has again continuously monitored the potential impact of financial risks and has taken the necessary measures to manage these risks. These risks include counterparty risk (insolvency or credit risk affecting financial partners), liquidity risk (non- availability of financing or very expensive financing options), a negative change impacting the fair value of buildings and risks related to interest, budget, agreements and exchange rates. Significant events after the balance sheet date WDP and IFC, a member of the World Bank Group, have concluded a new financing package of around 300 million euros. This financing is a sustainability-linked green loan with a term of up to eight years and will be used exclusively to finance new logistics development projects in Romania. Two KPIs were selected that focus on green building certification and installed solar panel capacity in the Romanian portfolio, which aligns with the Group's sustainability strategy, and are linked to a pricing mechanism of the loan Annual accounts Governance Results Performance Strategy and value creation This is WDP ESG WDP 2023 Annual Report 95
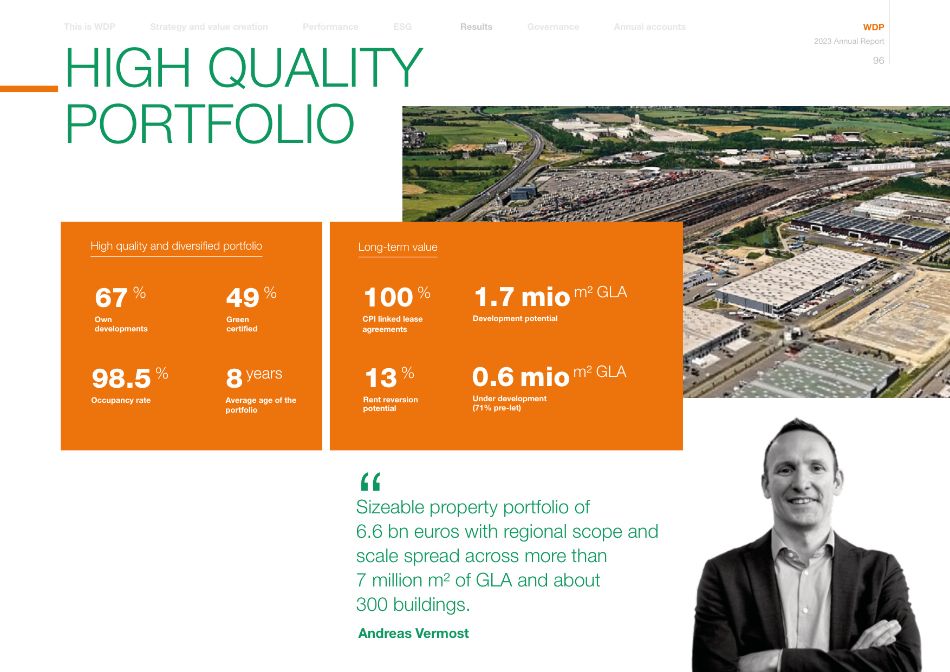
HIGH QUALITY PORTFOLIO " Sizeable property portfolio of 6.6 bn euros with regional scope and scale spread across more than 7 million m² of GLA and about 300 buildings. Own developments 67 % Green certified 49 % Average age of the portfolio 8 years Occupancy rate 98.5 % High quality and diversified portfolio Under development (71% pre-let) 0.6 mio m² GLA Development potential 1.7 mio m² GLA Long-term value CPI linked lease agreements 100 % Rent reversion potential 13 % WDP 2023 Annual Report 96 Andreas Vermost Annual accounts Governance Results Performance Strategy and value creation This is WDP ESG
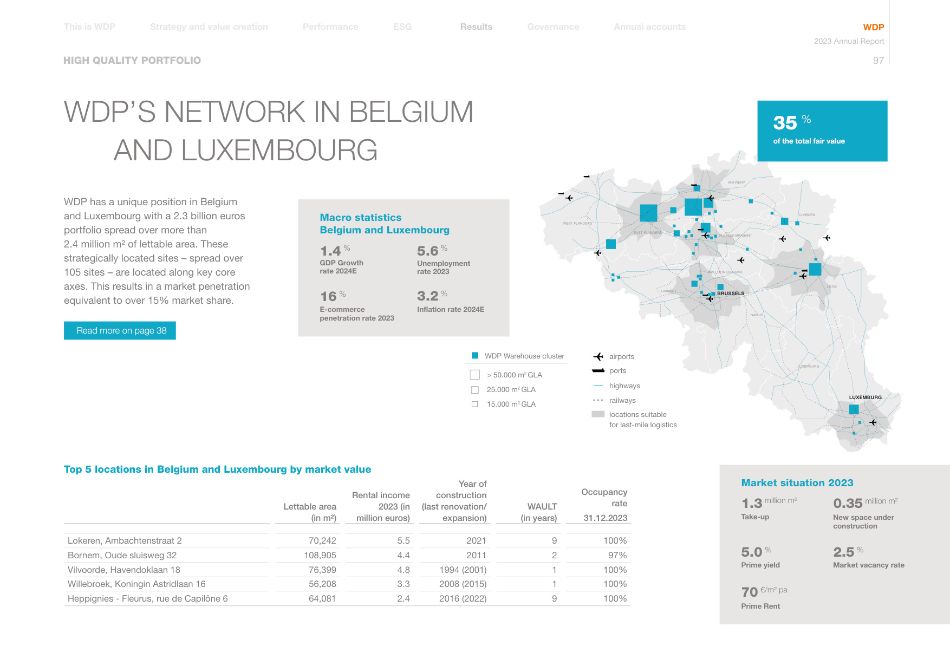
ANTWERP EAST FLANDERS WEST FLANDERS HAINAUT LIEGE LUXEMBURG NAMUR WALLOON BRABANT FLEMISH BRABANT LIMBURG LUXEMBURG BRUSSELS WDP has a unique position in Belgium and Luxembourg with a 2.3 billion euros portfolio spread over more than 2.4 million m² of lettable area. These strategically located sites – spread over 105 sites – are located along key core axes. This results in a market penetration equivalent to over 15% market share. WDP'S NETWORK IN BELGIUM AND LUXEMBOURG HIGH QUALITY PORTFOLIO Read more on page 38 Top 5 locations in Belgium and Luxembourg by market value Lettable area (in m²) Rental income 2023 (in million euros) Year of construction (last renovation/ expansion) WAULT (in years) Occupancy rate 31.12.2023 Lokeren, Ambachtenstraat 2 70,242 5.5 2021 9 100% Bornem, Oude sluisweg 32 108,905 4.4 2011 2 97% Vilvoorde, Havendoklaan 18 76,399 4.8 1994 (2001) 1 100% Willebroek, Koningin Astridlaan 16 56,208 3.3 2008 (2015) 1 100% Heppignies - Fleurus, rue de Capilône 6 64,081 2.4 2016 (2022) 9 100% WDP Warehouse cluster > 50.000 m2 GLA 25.000 m2 GLA 15.000 m2 GLA of the total fair value 35 % locations suitable for last-mile logistics airports ports railways highways 5.0 % Prime yield Prime Rent Take-up 70 €/m² pa 1.3 million m² 0.35 million m² Market situation 2023 Market vacancy rate New space under construction 2.5 % E-commerce penetration rate 2023 GDP Growth rate 2024E 16 % 1.4 % Macro statistics Belgium and Luxembourg Inflation rate 2024E Unemployment rate 2023 3.2 % 5.6 % WDP 2023 Annual Report 97 Annual accounts Governance Results Performance Strategy and value creation This is WDP ESG
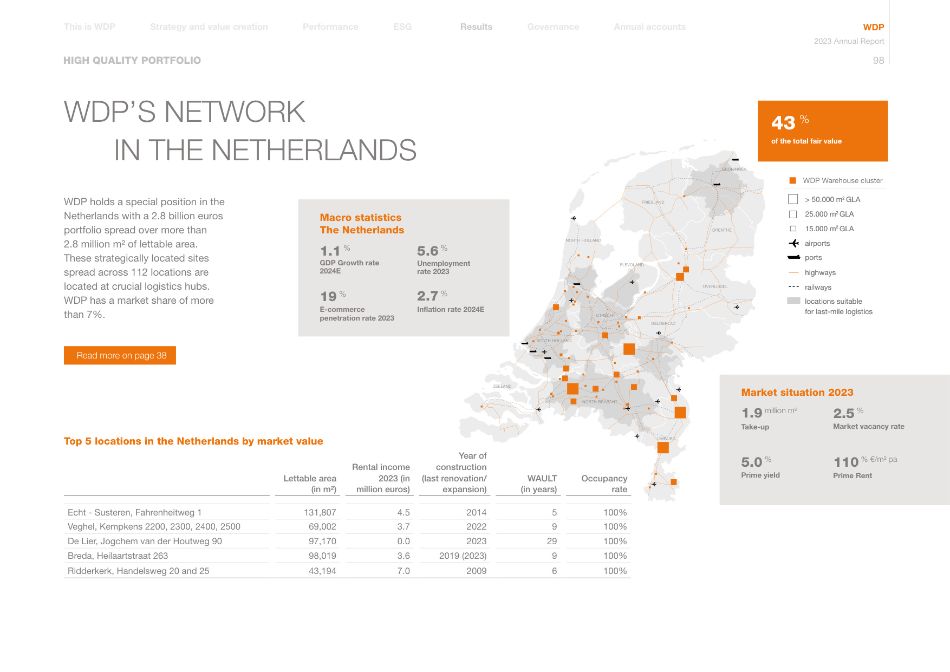
GRONINGEN DRENTHE FRIESLAND OVERIJSSEL GELDERLAD UTRECHT FLEVOLAND NORTH HOLLAND SOUTH HOLLAND ZEELAND NORTH BRABANT LIMBURG air Value WDP portfolio 44 % WDP holds a special position in the Netherlands with a 2.8 billion euros portfolio spread over more than 2.8 million m² of lettable area. These strategically located sites spread across 112 locations are located at crucial logistics hubs. WDP has a market share of more than 7%. Top 5 locations in the Netherlands by market value Lettable area (in m²) Rental income 2023 (in million euros) Year of construction (last renovation/ expansion) WAULT (in years) Occupancy rate Echt - Susteren, Fahrenheitweg 1 131,807 4.5 2014 5 100% Veghel, Kempkens 2200, 2300, 2400, 2500 69,002 3.7 2022 9 100% De Lier, Jogchem van der Houtweg 90 97,170 0.0 2023 29 100% Breda, Heilaartstraat 263 98,019 3.6 2019 (2023) 9 100% Ridderkerk, Handelsweg 20 and 25 43,194 7.0 2009 6 100% of the total fair value 43 % WDP'S NETWORK IN THE NETHERLANDS HIGH QUALITY PORTFOLIO WDP Warehouse cluster E-commerce penetration rate 2023 GDP Growth rate 2024E 19 % 1.1 % Macro statistics The Netherlands Inflation rate 2024E Unemployment rate 2023 2.7 % 5.6 % 5.0 % Prime yield Prime Rent Take-up 110 % €/m² pa 1.9 million m² Market situation 2023 Market vacancy rate 2.5 % WDP 2023 Annual Report 98 Annual accounts Governance Results Performance Strategy and value creation This is WDP ESG Read more on page 38 > 50.000 m2 GLA 25.000 m2 GLA 15.000 m2 GLA locations suitable for last-mile logistics airports ports railways highways Read more on page 38 > 50.000 m2 GLA 25.000 m2 GLA 15.000 m2 GLA locations suitable for last-mile logistics airports ports railways highways
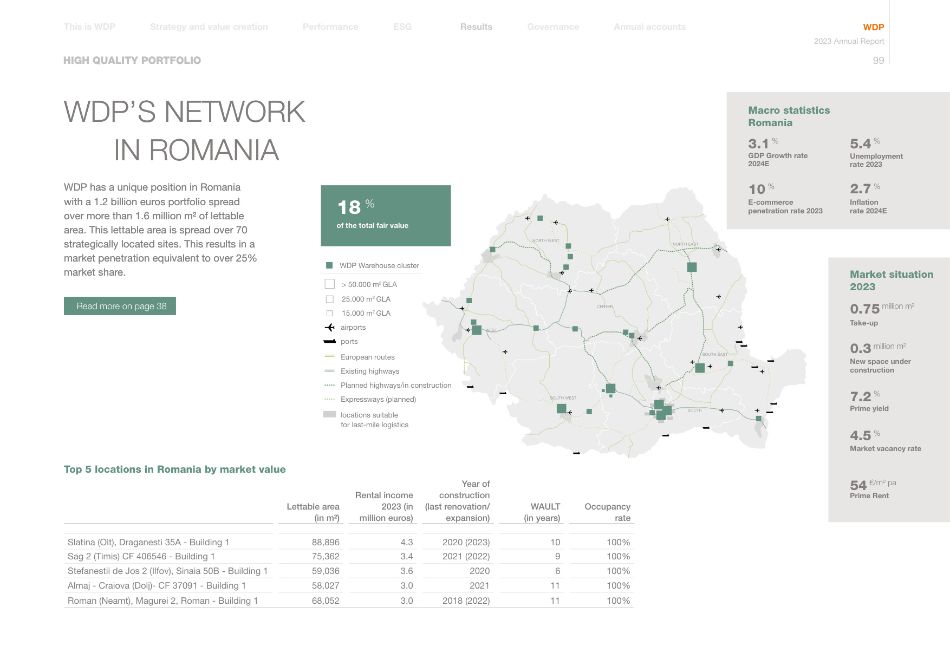
SOUTH NORTH WEST CENTER SOUTH EAST NORTH EAST SOUTH WEST WEST Market situation 2023 Top 5 locations in Romania by market value Lettable area (in m²) Rental income 2023 (in million euros) Year of construction (last renovation/ expansion) WAULT (in years) Occupancy rate Slatina (Olt), Draganesti 35A - Building 1 88,896 4.3 2020 (2023) 10 100% Sag 2 (Timis) CF 406546 - Building 1 75,362 3.4 2021 (2022) 9 100% Stefanestii de Jos 2 (Ilfov), Sinaia 50B - Building 1 59,036 3.6 2020 6 100% Almaj - Craiova (Dolj)- CF 37091 - Building 1 58,027 3.0 2021 11 100% Roman (Neamt), Magurei 2, Roman - Building 1 68,052 3.0 2018 (2022) 11 100% > 50.000 m2 GLA 25.000 m2 GLA 15.000 m2 GLA locations suitable for last-mile logistics airports ports European routes Existing highways Planned highways/in construction Expressways (planned) WDP Warehouse cluster of the total fair value 18 % 7.2 % Prime yield Prime Rent 54 €/m² pa 0.3 million m² Market vacancy rate New space under construction 4.5 % E-commerce penetration rate 2023 GDP Growth rate 2024E 10 % 3.1 % Macro statistics Romania Inflation rate 2024E Unemployment rate 2023 2.7 % 5.4 % Take-up 0.75 million m² WDP 2023 Annual Report 99 Annual accounts Governance Results Performance Strategy and value creation This is WDP ESG WDP has a unique position in Romania with a 1.2 billion euros portfolio spread over more than 1.6 million m² of lettable area. This lettable area is spread over 70 strategically located sites. This results in a market penetration equivalent to over 25% market share. WDP'S NETWORK IN ROMANIA HIGH QUALITY PORTFOLIO Read more on page 38 WDP has a unique position in Romania with a 1.2 billion euros portfolio spread over more than 1.6 million m² of lettable area. This lettable area is spread over 70 strategically located sites. This results in a market penetration equivalent to over 25% market share. WDP'S NETWORK IN ROMANIA HIGH QUALITY PORTFOLIO Read more on page 38
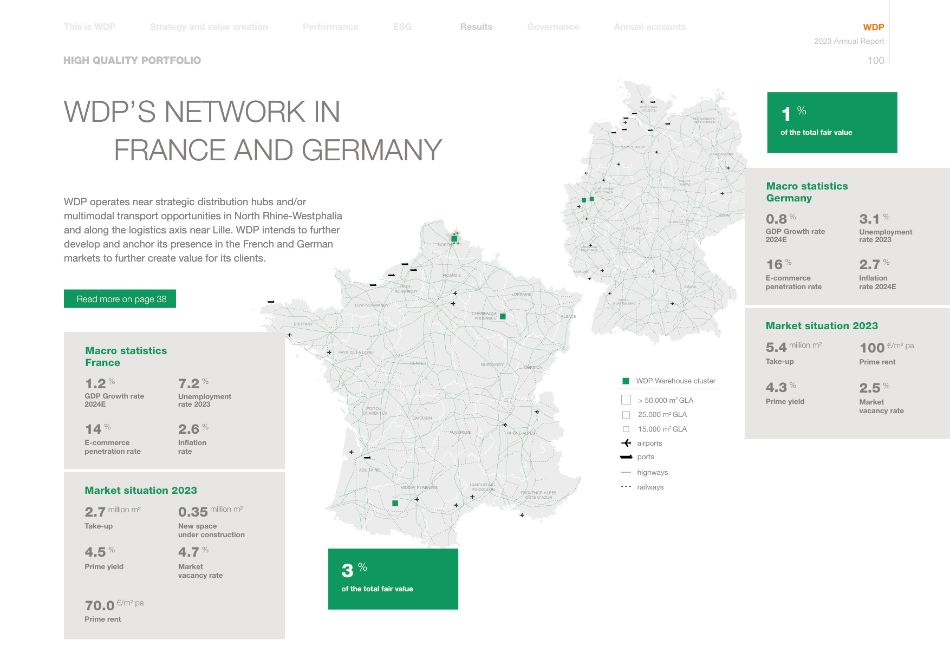
of the total fair value 1 % NORTH RHINE- WESTPHALIA BADEN- WÜRTTEMBERG BAVARIA RHINELAND- PALATINATE LOWER SAXONY HESSE THURINGIA SAXONY SAXONY- ANHALT BRANDENBURG MECKLENBURG- VORPOMMERN SCHLESWIG- HOLSTEIN SAARLAND PROVENCE-ALPES CÔTE D'AZUR AUVERGNE LANGUEDOC- ROUSSILON MIDDAY PYRENEES AQUITAINE LIMOUSIN RHÔNE-ALPES CENTER BURGUNDY CORSICA CHAMPAGNE- ARDENNES PICARDIE NORTH HIGH- NORMANDY LOW-NORMANDY PAYS DE LA LOIRE BRITTANY LORRAINE ALSACE POITOU- CHARENTES of the total fair value 3 % > 50.000 m2 GLA 25.000 m2 GLA 15.000 m2 GLA airports ports railways highways WDP Warehouse cluster Market vacancy rate Take-up Prime rent 2.5 % 5.4 million m² 100 €/m² pa Market situation 2023 Prime yield 4.3 % E-commerce penetration rate GDP Growth rate 2024E 16 % 0.8 % Macro statistics Germany Inflation rate 2024E Unemployment rate 2023 2.7 % 3.1 % 0.35 million m² New space under construction Market vacancy rate Take-up Prime rent 4.7 % 2.7 million m² 70.0 €/m² pa Market situation 2023 Prime yield 4.5 % E-commerce penetration rate GDP Growth rate 2024E 14 % 1.2 % Macro statistics France Inflation rate Unemployment rate 2023 2.6 % 7.2 % WDP 2023 Annual Report 100 Annual accounts Governance Results Performance Strategy and value creation This is WDP ESG WDP operates near strategic distribution hubs and/or multimodal transport opportunities in North Rhine-Westphalia and along the logistics axis near Lille. WDP intends to further develop and anchor its presence in the French and German markets to further create value for its clients. WDP'S NETWORK IN FRANCE AND GERMANY HIGH QUALITY PORTFOLIO Read more on page 38 WDP operates near strategic distribution hubs and/or multimodal transport opportunities in North Rhine-Westphalia and along the logistics axis near Lille. WDP intends to further develop and anchor its presence in the French and German markets to further create value for its clients. WDP'S NETWORK IN FRANCE AND GERMANY HIGH QUALITY PORTFOLIO Read more on page 38
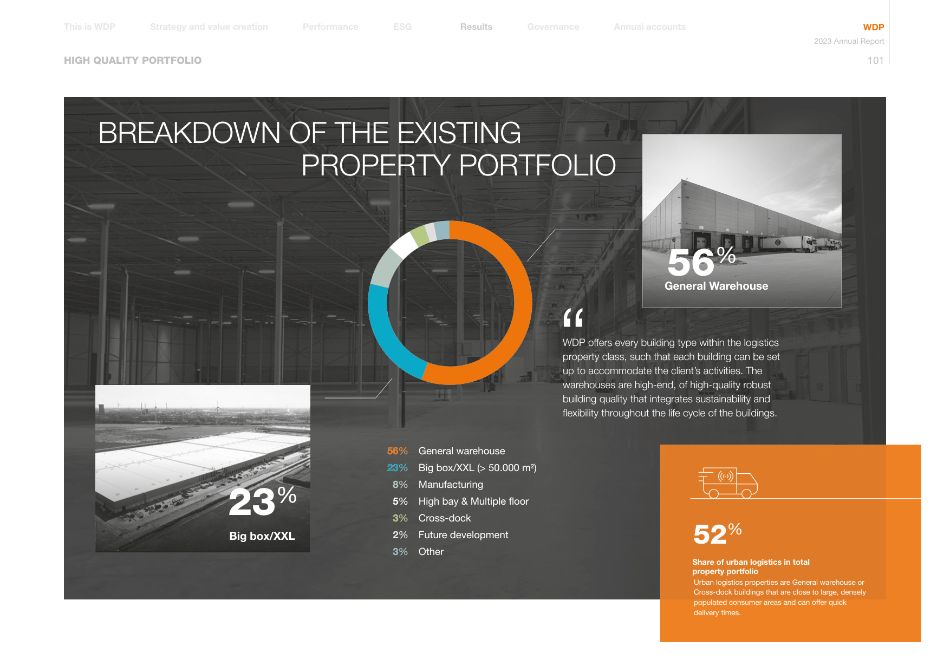
HIGH QUALITY PORTFOLIO BREAKDOWN OF THE EXISTING PROPERTY PORTFOLIO Urban logistics properties are General warehouse or Cross-dock buildings that are close to large, densely populated consumer areas and can offer quick delivery times. WDP 2023 Annual Report 101 Annual accounts Governance Results Performance Strategy and value creation This is WDP ESG WDP offers every building type within the logistics property class, such that each building can be set up to accommodate the client's activities. The warehouses are high-end, of high-quality robust building quality that integrates sustainability and flexibility throughout the life cycle of the buildings. " 56% General warehouse 23% Big box/XXL (> 50.000 m²) 8% Manufacturing 5% High bay & Multiple floor 3% Cross-dock 2% Future development 3% Other 52% Share of urban logistics in total property portfolio Big box/XXL 23% General Warehouse 56%
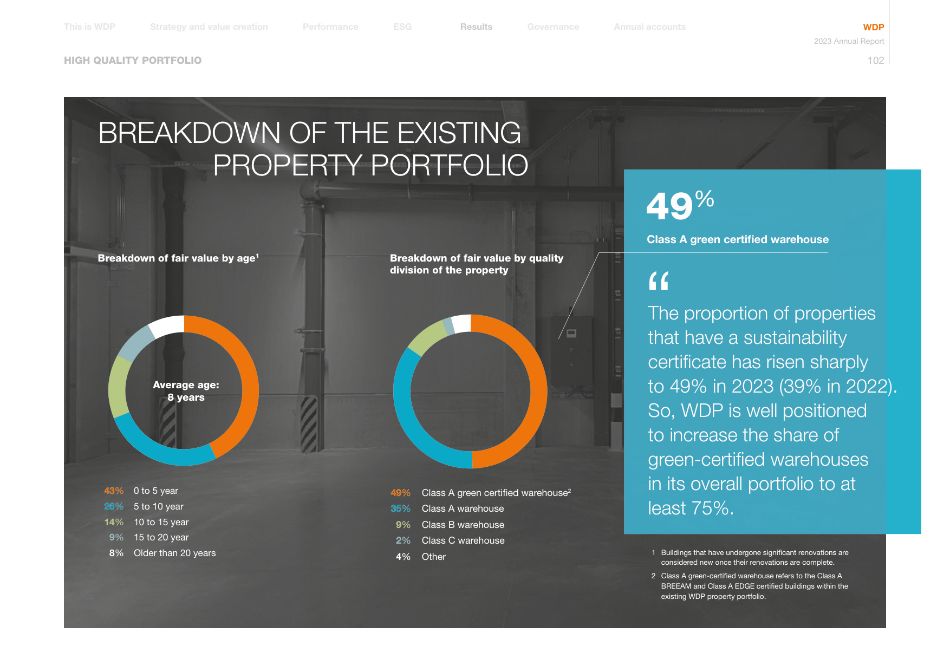
BREAKDOWN OF THE EXISTING PROPERTY PORTFOLIO HIGH QUALITY PORTFOLIO Breakdown of fair value by age1 Breakdown of fair value by quality division of the property Average age: 8 years 49% Class A green certified warehouse2 35% Class A warehouse 9% Class B warehouse 2% Class C warehouse 4% Other 43% 0 to 5 year 26% 5 to 10 year 14% 10 to 15 year 9% 15 to 20 year 8% Older than 20 years WDP 2023 Annual Report 102 Annual accounts Governance Results Performance Strategy and value creation This is WDP ESG 1 Buildings that have undergone significant renovations are considered new once their renovations are complete. 2 Class A green-certified warehouse refers to the Class A BREEAM and Class A EDGE certified buildings within the existing WDP property portfolio. Class A green certified warehouse 49% The proportion of properties that have a sustainability certificate has risen sharply to 49% in 2023 (39% in 2022). So, WDP is well positioned to increase the share of green-certified warehouses in its overall portfolio to at least 75%. "
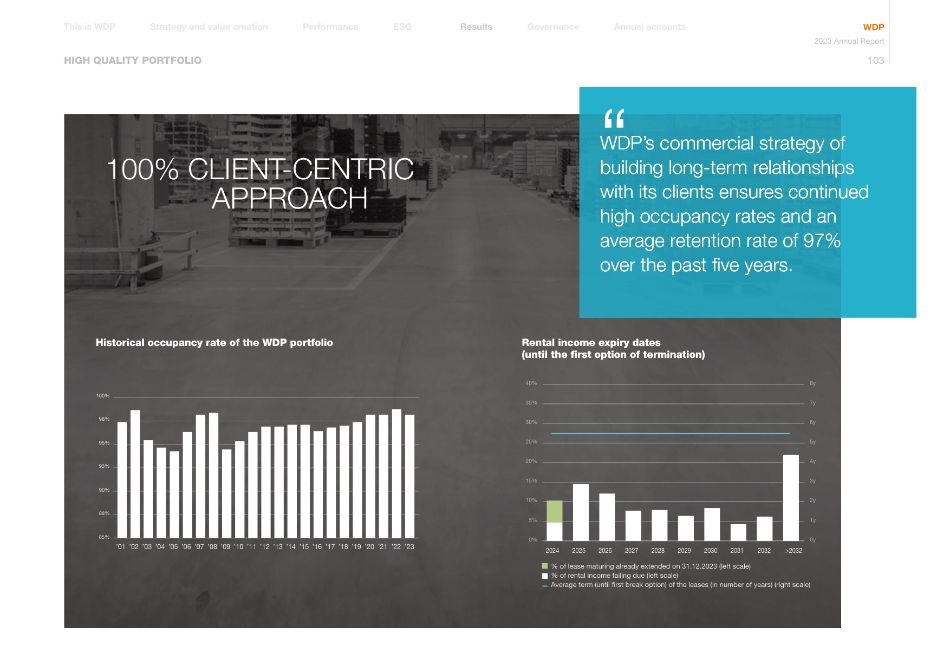
100% CLIENT-CENTRIC APPROACH HIGH QUALITY PORTFOLIO % of lease maturing already extended on 31.12.2023 (left scale) % of rental income failing due (left scale) Average term (until first break option) of the leases (in number of years) (right scale) 2024 2025 2026 2027 2028 2029 2030 2031 2032 40% 35% 30% 25% 20% 15% 10% 5% 0% 8y 7y 6y 5y 4y 3y 2y 1y 0y >2032 100% 98% 95% 93% 90% 88% 85% '23 '02 '04 '06 '08 '10 '12 '14 '16 '18 '19 '01 '03 '05 '07 '09 '11 '13 '15 '17 '20 '21 '22 WDP 2023 Annual Report 103 Annual accounts Governance Results Performance Strategy and value creation This is WDP ESG " WDP's commercial strategy of building long-term relationships with its clients ensures continued high occupancy rates and an average retention rate of 97% over the past five years. Historical occupancy rate of the WDP portfolio Rental income expiry dates (until the first option of termination) " WDP's commercial strategy of building long-term relationships with its clients ensures continued high occupancy rates and an average retention rate of 97% over the past five years. Historical occupancy rate of the WDP portfolio Rental income expiry dates (until the first option of termination)
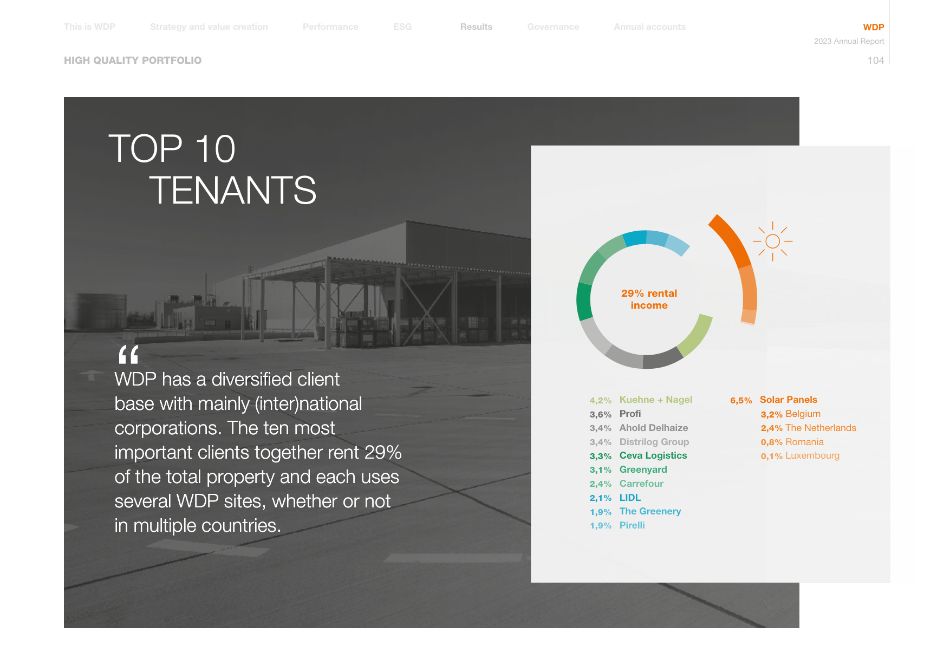
TOP 10 TENANTS HIGH QUALITY PORTFOLIO Kuehne + Nagel Profi Ahold Delhaize Distrilog Group Ceva Logistics Greenyard Carrefour LIDL The Greenery Pirelli Solar Panels Belgium The Netherlands Romania Luxembourg 4,2% 3,6% 3,4% 3,4% 3,3% 3,1% 2,4% 2,1% 1,9% 1,9% 6,5% 3,2% 2,4% 0,8% 0,1% 29% rental income WDP 2023 Annual Report 104 Annual accounts Governance Results Performance Strategy and value creation This is WDP ESG " WDP has a diversified client base with mainly (inter)national corporations. The ten most important clients together rent 29% of the total property and each uses several WDP sites, whether or not in multiple countries. " WDP has a diversified client base with mainly (inter)national corporations. The ten most important clients together rent 29% of the total property and each uses several WDP sites, whether or not in multiple countries.
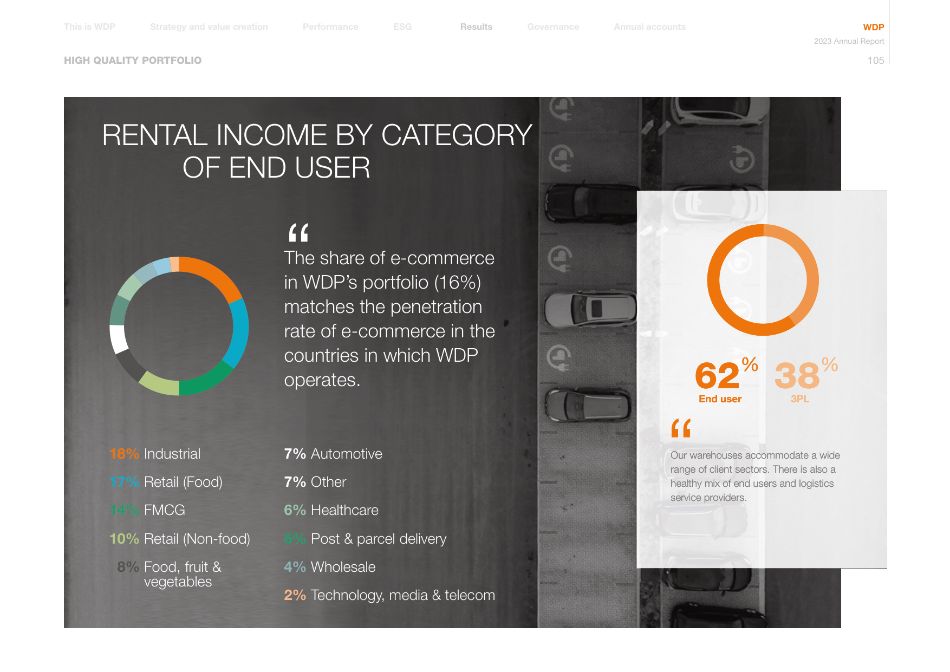
18% Industrial 17% Retail (Food) 14% FMCG 10% Retail (Non-food) 8% Food, fruit & vegetables 7% Automotive 7% Other 6% Healthcare 5% Post & parcel delivery 4% Wholesale 2% Technology, media & telecom RENTAL INCOME BY CATEGORY OF END USER HIGH QUALITY PORTFOLIO " The share of e-commerce in WDP's portfolio (16%) matches the penetration rate of e-commerce in the countries in which WDP operates. WDP 2023 Annual Report 105 Annual accounts Governance Results Performance Strategy and value creation This is WDP ESG Our warehouses accommodate a wide range of client sectors. There is also a healthy mix of end users and logistics service providers. 38 % 3PL 62 % End user " Our warehouses accommodate a wide range of client sectors. There is also a healthy mix of end users and logistics service providers. 38 % 3PL 62 % End user "
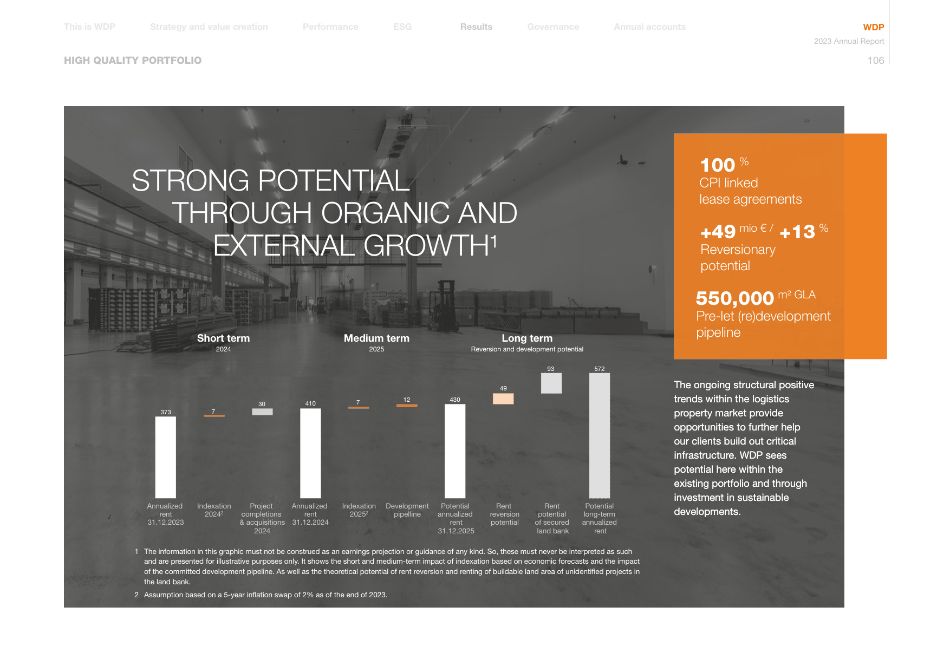
HIGH QUALITY PORTFOLIO Reversionary potential CPI linked lease agreements Pre-let (re)development pipeline +49 mio € / +13 % 100 % 550,000 m² GLA STRONG POTENTIAL THROUGH ORGANIC AND EXTERNAL GROWTH¹ Annualized rent 31.12.2023 Annualized rent 31.12.2024 Indexation 20252 Development pipelline Potential long-term annualized rent Potential annualized rent 31.12.2025 Rent reversion potential Rent potential of secured land bank Project completions & acquisitions 2024 Indexation 20242 373 30 7 410 12 430 49 93 572 7 Short term 2024 Medium term 2025 Long term Reversion and development potential 1 The information in this graphic must not be construed as an earnings projection or guidance of any kind. So, these must never be interpreted as such and are presented for illustrative purposes only. It shows the short and medium-term impact of indexation based on economic forecasts and the impact of the committed development pipeline. As well as the theoretical potential of rent reversion and renting of buildable land area of unidentified projects in the land bank. 2 Assumption based on a 5-year inflation swap of 2% as of the end of 2023. WDP 2023 Annual Report 106 Annual accounts Governance Results Performance Strategy and value creation This is WDP ESG The ongoing structural positive trends within the logistics property market provide opportunities to further help our clients build out critical infrastructure. WDP sees potential here within the existing portfolio and through investment in sustainable developments. The ongoing structural positive trends within the logistics property market provide opportunities to further help our clients build out critical infrastructure. WDP sees potential here within the existing portfolio and through investment in sustainable developments.
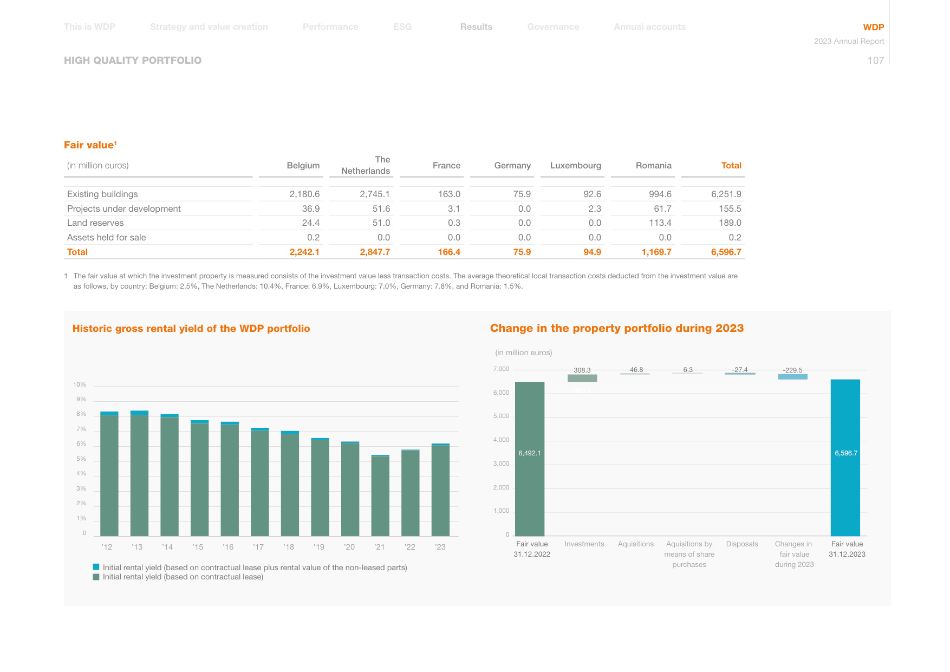
Fair value 31.12.2022 Fair value 31.12.2023 Aquisitions by means of share purchases Disposals Changes in fair value during 2023 Aquisitions Investments 6,492.1 46.8 308.3 -27.4 6.3 -229.5 6,596.7 7,000 6,000 5,000 4,000 3,000 2,000 1,000 0 (in million euros) 483,1 Initial rental yield (based on contractual lease plus rental value of the non-leased parts) Initial rental yield (based on contractual lease) '23 10% 9% 8% 7% 6% 5% 4% 3% 2% 1% 0 '12 '13 '14 '15 '16 '17 '18 '19 '21 '22 '20 Historic gross rental yield of the WDP portfolio Change in the property portfolio during 2023 Fair value1 (in million euros) Belgium The Netherlands France Germany Luxembourg Romania Total Existing buildings 2,180.6 2,745.1 163.0 75.9 92.6 994.6 6,251.9 Projects under development 36.9 51.6 3.1 0.0 2.3 61.7 155.5 Land reserves 24.4 51.0 0.3 0.0 0.0 113.4 189.0 Assets held for sale 0.2 0.0 0.0 0.0 0.0 0.0 0.2 Total 2,242.1 2,847.7 166.4 75.9 94.9 1,169.7 6,596.7 1 The fair value at which the investment property is measured consists of the investment value less transaction costs. The average theoretical local transaction costs deducted from the investment value are as follows, by country: Belgium: 2.5%, The Netherlands: 10.4%, France: 6.9%, Luxembourg: 7.0%, Germany: 7.8%, and Romania: 1.5%. HIGH QUALITY PORTFOLIO WDP 2023 Annual Report 107 Annual accounts Governance Results Performance Strategy and value creation This is WDP ESG
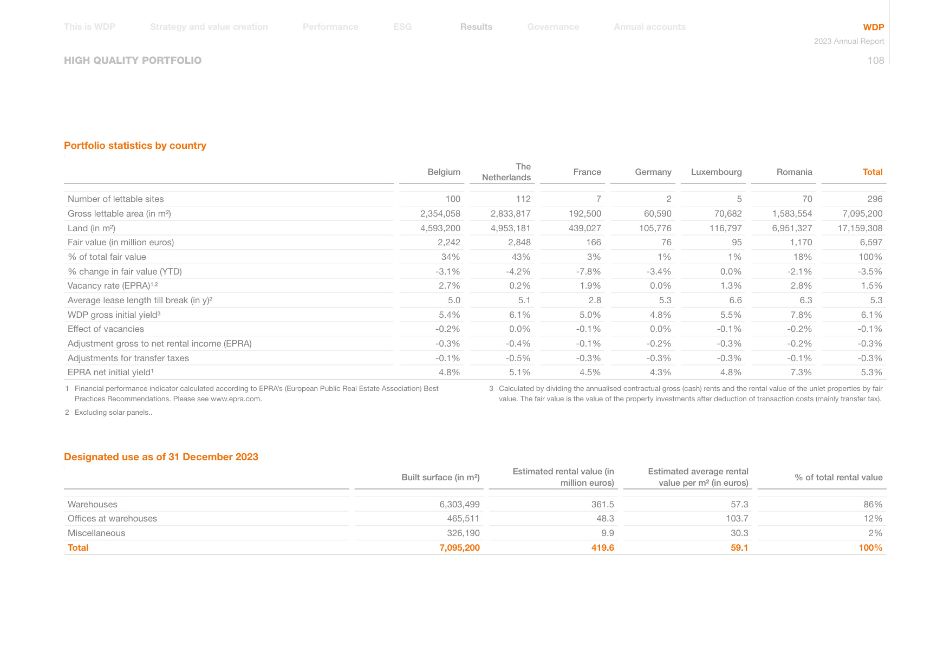
Portfolio statistics by country Belgium The Netherlands France Germany Luxembourg Romania Total Number of lettable sites 100 112 7 2 5 70 296 Gross lettable area (in m²) 2,354,058 2,833,817 192,500 60,590 70,682 1,583,554 7,095,200 Land (in m²) 4,593,200 4,953,181 439,027 105,776 116,797 6,951,327 17,159,308 Fair value (in million euros) 2,242 2,848 166 76 95 1,170 6,597 % of total fair value 34% 43% 3% 1% 1% 18% 100% % change in fair value (YTD) -3.1% -4.2% -7.8% -3.4% 0.0% -2.1% -3.5% Vacancy rate (EPRA)¹,² 2.7% 0.2% 1.9% 0.0% 1.3% 2.8% 1.5% Average lease length till break (in y)² 5.0 5.1 2.8 5.3 6.6 6.3 5.3 WDP gross initial yield³ 5.4% 6.1% 5.0% 4.8% 5.5% 7.8% 6.1% Effect of vacancies -0.2% 0.0% -0.1% 0.0% -0.1% -0.2% -0.1% Adjustment gross to net rental income (EPRA) -0.3% -0.4% -0.1% -0.2% -0.3% -0.2% -0.3% Adjustments for transfer taxes -0.1% -0.5% -0.3% -0.3% -0.3% -0.1% -0.3% EPRA net initial yield¹ 4.8% 5.1% 4.5% 4.3% 4.8% 7.3% 5.3% 1 Financial performance indicator calculated according to EPRA's (European Public Real Estate Association) Best Practices Recommendations. Please see www.epra.com. 2 Excluding solar panels.. 3 Calculated by dividing the annualised contractual gross (cash) rents and the rental value of the unlet properties by fair value. The fair value is the value of the property investments after deduction of transaction costs (mainly transfer tax). HIGH QUALITY PORTFOLIO Designated use as of 31 December 2023 Built surface (in m²) Estimated rental value (in million euros) Estimated average rental value per m² (in euros) % of total rental value Warehouses 6,303,499 361.5 57.3 86% Offices at warehouses 465,511 48.3 103.7 12% Miscellaneous 326,190 9.9 30.3 2% Total 7,095,200 419.6 59.1 100% WDP 2023 Annual Report 108 Annual accounts Governance Results Performance Strategy and value creation This is WDP ESG
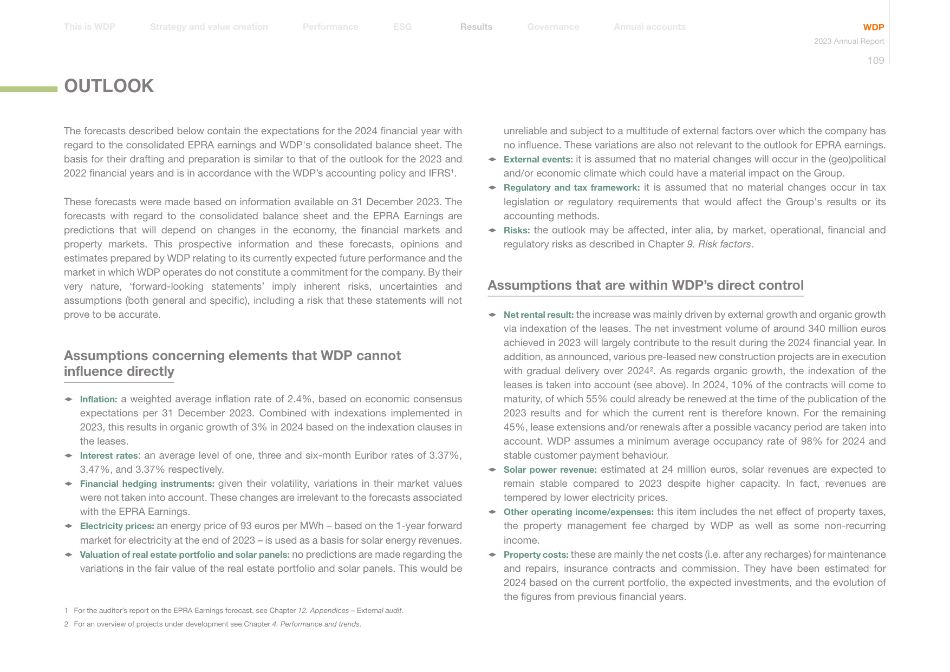
The forecasts described below contain the expectations for the 2024 financial year with regard to the consolidated EPRA earnings and WDP's consolidated balance sheet. The basis for their drafting and preparation is similar to that of the outlook for the 2023 and 2022 financial years and is in accordance with the WDP's accounting policy and IFRS1. These forecasts were made based on information available on 31 December 2023. The forecasts with regard to the consolidated balance sheet and the EPRA Earnings are predictions that will depend on changes in the economy, the financial markets and property markets. This prospective information and these forecasts, opinions and estimates prepared by WDP relating to its currently expected future performance and the market in which WDP operates do not constitute a commitment for the company. By their very nature, 'forward-looking statements' imply inherent risks, uncertainties and assumptions (both general and specific), including a risk that these statements will not prove to be accurate. Assumptions concerning elements that WDP cannot influence directly 1 Inflation: a weighted average inflation rate of 2.4%, based on economic consensus expectations per 31 December 2023. Combined with indexations implemented in 2023, this results in organic growth of 3% in 2024 based on the indexation clauses in the leases. 1 Interest rates: an average level of one, three and six-month Euribor rates of 3.37%, 3.47%, and 3.37% respectively. 1 Financial hedging instruments: given their volatility, variations in their market values were not taken into account. These changes are irrelevant to the forecasts associated with the EPRA Earnings. 1 Electricity prices: an energy price of 93 euros per MWh – based on the 1-year forward market for electricity at the end of 2023 – is used as a basis for solar energy revenues. 1 Valuation of real estate portfolio and solar panels: no predictions are made regarding the variations in the fair value of the real estate portfolio and solar panels. This would be OUTLOOK 1 For the auditor's report on the EPRA Earnings forecast, see Chapter 12. Appendices – External audit. 2 For an overview of projects under development see Chapter 4. Performance and trends. unreliable and subject to a multitude of external factors over which the company has no influence. These variations are also not relevant to the outlook for EPRA earnings. 1 External events: it is assumed that no material changes will occur in the (geo)political and/or economic climate which could have a material impact on the Group. 1 Regulatory and tax framework: it is assumed that no material changes occur in tax legislation or regulatory requirements that would affect the Group's results or its accounting methods. 1 Risks: the outlook may be affected, inter alia, by market, operational, financial and regulatory risks as described in Chapter 9. Risk factors. Assumptions that are within WDP's direct control 1 Net rental result: the increase was mainly driven by external growth and organic growth via indexation of the leases. The net investment volume of around 340 million euros achieved in 2023 will largely contribute to the result during the 2024 financial year. In addition, as announced, various pre-leased new construction projects are in execution with gradual delivery over 20242. As regards organic growth, the indexation of the leases is taken into account (see above). In 2024, 10% of the contracts will come to maturity, of which 55% could already be renewed at the time of the publication of the 2023 results and for which the current rent is therefore known. For the remaining 45%, lease extensions and/or renewals after a possible vacancy period are taken into account. WDP assumes a minimum average occupancy rate of 98% for 2024 and stable customer payment behaviour. 1 Solar power revenue: estimated at 24 million euros, solar revenues are expected to remain stable compared to 2023 despite higher capacity. In fact, revenues are tempered by lower electricity prices. 1 Other operating income/expenses: this item includes the net effect of property taxes, the property management fee charged by WDP as well as some non-recurring income. 1 Property costs: these are mainly the net costs (i.e. after any recharges) for maintenance and repairs, insurance contracts and commission. They have been estimated for 2024 based on the current portfolio, the expected investments, and the evolution of the figures from previous financial years. Annual accounts Governance Results Performance Strategy and value creation This is WDP ESG WDP 2023 Annual Report 109
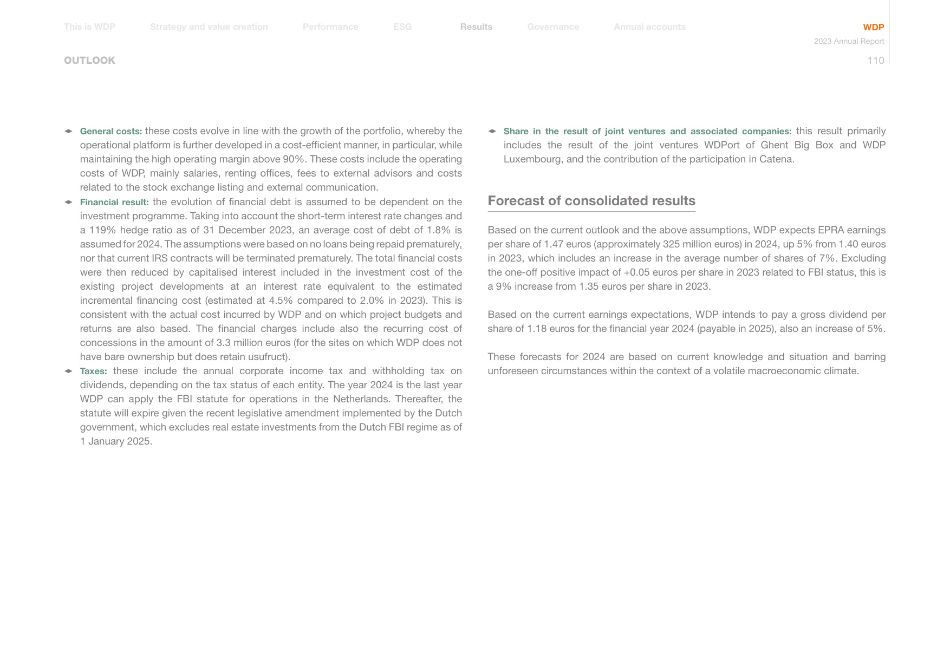
OUTLOOK 1 General costs: these costs evolve in line with the growth of the portfolio, whereby the operational platform is further developed in a cost-efficient manner, in particular, while maintaining the high operating margin above 90%. These costs include the operating costs of WDP, mainly salaries, renting offices, fees to external advisors and costs related to the stock exchange listing and external communication. 1 Financial result: the evolution of financial debt is assumed to be dependent on the investment programme. Taking into account the short-term interest rate changes and a 119% hedge ratio as of 31 December 2023, an average cost of debt of 1.8% is assumed for 2024. The assumptions were based on no loans being repaid prematurely, nor that current IRS contracts will be terminated prematurely. The total financial costs were then reduced by capitalised interest included in the investment cost of the existing project developments at an interest rate equivalent to the estimated incremental financing cost (estimated at 4.5% compared to 2.0% in 2023). This is consistent with the actual cost incurred by WDP and on which project budgets and returns are also based. The financial charges include also the recurring cost of concessions in the amount of 3.3 million euros (for the sites on which WDP does not have bare ownership but does retain usufruct). 1 Taxes: these include the annual corporate income tax and withholding tax on dividends, depending on the tax status of each entity. The year 2024 is the last year WDP can apply the FBI statute for operations in the Netherlands. Thereafter, the statute will expire given the recent legislative amendment implemented by the Dutch government, which excludes real estate investments from the Dutch FBI regime as of 1 January 2025. 1 Share in the result of joint ventures and associated companies: this result primarily includes the result of the joint ventures WDPort of Ghent Big Box and WDP Luxembourg, and the contribution of the participation in Catena. Forecast of consolidated results Based on the current outlook and the above assumptions, WDP expects EPRA earnings per share of 1.47 euros (approximately 325 million euros) in 2024, up 5% from 1.40 euros in 2023, which includes an increase in the average number of shares of 7%. Excluding the one-off positive impact of +0.05 euros per share in 2023 related to FBI status, this is a 9% increase from 1.35 euros per share in 2023. Based on the current earnings expectations, WDP intends to pay a gross dividend per share of 1.18 euros for the financial year 2024 (payable in 2025), also an increase of 5%. These forecasts for 2024 are based on current knowledge and situation and barring unforeseen circumstances within the context of a volatile macroeconomic climate. Annual accounts Governance Results Performance Strategy and value creation This is WDP ESG WDP 2023 Annual Report 110
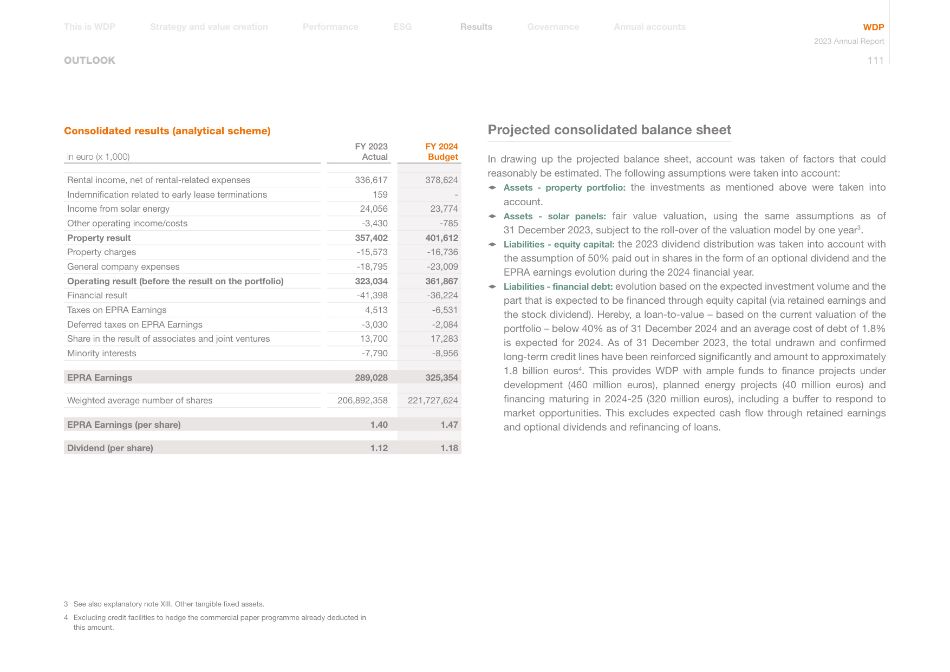
OUTLOOK Consolidated results (analytical scheme) FY 2023 FY 2024 in euro (x 1,000) Actual Budget Rental income, net of rental-related expenses 336,617 378,624 Indemnification related to early lease terminations 159 - Income from solar energy 24,056 23,774 Other operating income/costs -3,430 -785 Property result 357,402 401,612 Property charges -15,573 -16,736 General company expenses -18,795 -23,009 Operating result (before the result on the portfolio) 323,034 361,867 Financial result -41,398 -36,224 Taxes on EPRA Earnings 4,513 -6,531 Deferred taxes on EPRA Earnings -3,030 -2,084 Share in the result of associates and joint ventures 13,700 17,283 Minority interests -7,790 -8,956 EPRA Earnings 289,028 325,354 Weighted average number of shares 206,892,358 221,727,624 EPRA Earnings (per share) 1.40 1.47 Dividend (per share) 1.12 1.18 Projected consolidated balance sheet In drawing up the projected balance sheet, account was taken of factors that could reasonably be estimated. The following assumptions were taken into account: 1 Assets - property portfolio: the investments as mentioned above were taken into account. 1 Assets - solar panels: fair value valuation, using the same assumptions as of 31 December 2023, subject to the roll-over of the valuation model by one year3. 1 Liabilities - equity capital: the 2023 dividend distribution was taken into account with the assumption of 50% paid out in shares in the form of an optional dividend and the EPRA earnings evolution during the 2024 financial year. 1 Liabilities - financial debt: evolution based on the expected investment volume and the part that is expected to be financed through equity capital (via retained earnings and the stock dividend). Hereby, a loan-to-value – based on the current valuation of the portfolio – below 40% as of 31 December 2024 and an average cost of debt of 1.8% is expected for 2024. As of 31 December 2023, the total undrawn and confirmed long-term credit lines have been reinforced significantly and amount to approximately 1.8 billion euros4. This provides WDP with ample funds to finance projects under development (460 million euros), planned energy projects (40 million euros) and financing maturing in 2024-25 (320 million euros), including a buffer to respond to market opportunities. This excludes expected cash flow through retained earnings and optional dividends and refinancing of loans. 3 See also explanatory note XIII. Other tangible fixed assets. 4 Excluding credit facilities to hedge the commercial paper programme already deducted in this amount. Annual accounts Governance Results Performance Strategy and value creation This is WDP ESG WDP 2023 Annual Report 111
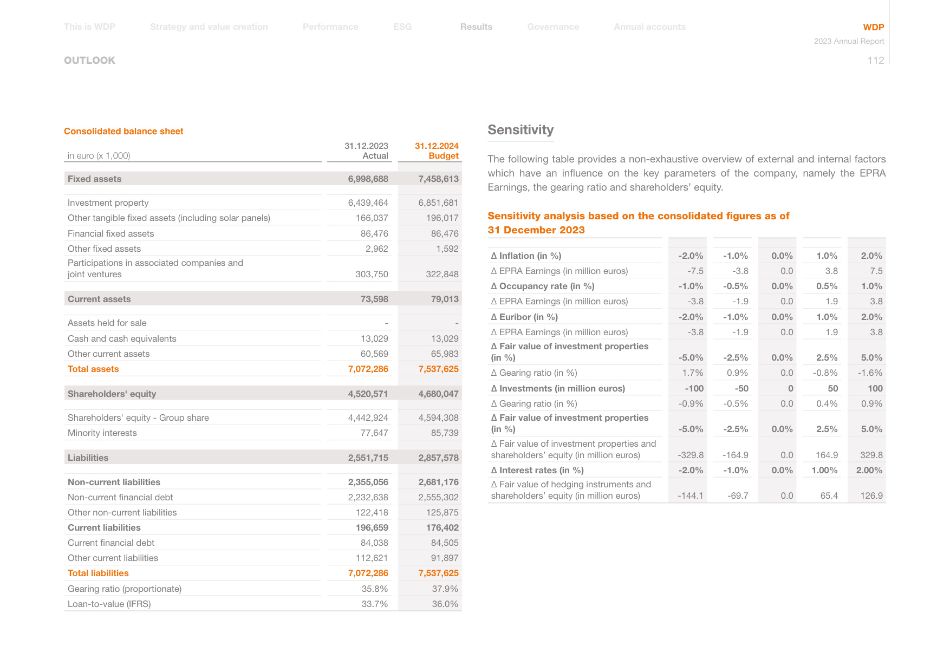
OUTLOOK Consolidated balance sheet 31.12.2023 31.12.2024 in euro (x 1,000) Actual Budget Fixed assets 6,998,688 7,458,613 Investment property 6,439,464 6,851,681 Other tangible fixed assets (including solar panels) 166,037 196,017 Financial fixed assets 86,476 86,476 Other fixed assets 2,962 1,592 Participations in associated companies and joint ventures 303,750 322,848 Current assets 73,598 79,013 Assets held for sale - - Cash and cash equivalents 13,029 13,029 Other current assets 60,569 65,983 Total assets 7,072,286 7,537,625 Shareholders' equity 4,520,571 4,680,047 Shareholders' equity - Group share 4,442,924 4,594,308 Minority interests 77,647 85,739 Liabilities 2,551,715 2,857,578 Non-current liabilities 2,355,056 2,681,176 Non-current financial debt 2,232,638 2,555,302 Other non-current liabilities 122,418 125,875 Current liabilities 196,659 176,402 Current financial debt 84,038 84,505 Other current liabilities 112,621 91,897 Total liabilities 7,072,286 7,537,625 Gearing ratio (proportionate) 35.8% 37.9% Loan-to-value (IFRS) 33.7% 36.0% Sensitivity The following table provides a non-exhaustive overview of external and internal factors which have an influence on the key parameters of the company, namely the EPRA Earnings, the gearing ratio and shareholders' equity. Sensitivity analysis based on the consolidated figures as of 31 December 2023 ∆ Inflation (in %) -2.0% -1.0% 0.0% 1.0% 2.0% ∆ EPRA Earnings (in million euros) -7.5 -3.8 0.0 3.8 7.5 ∆ Occupancy rate (in %) -1.0% -0.5% 0.0% 0.5% 1.0% ∆ EPRA Earnings (in million euros) -3.8 -1.9 0.0 1.9 3.8 ∆ Euribor (in %) -2.0% -1.0% 0.0% 1.0% 2.0% ∆ EPRA Earnings (in million euros) -3.8 -1.9 0.0 1.9 3.8 ∆ Fair value of investment properties (in %) -5.0% -2.5% 0.0% 2.5% 5.0% ∆ Gearing ratio (in %) 1.7% 0.9% 0.0 -0.8% -1.6% ∆ Investments (in million euros) -100 -50 0 50 100 ∆ Gearing ratio (in %) -0.9% -0.5% 0.0 0.4% 0.9% ∆ Fair value of investment properties (in %) -5.0% -2.5% 0.0% 2.5% 5.0% ∆ Fair value of investment properties and shareholders' equity (in million euros) -329.8 -164.9 0.0 164.9 329.8 ∆ Interest rates (in %) -2.0% -1.0% 0.0% 1.00% 2.00% ∆ Fair value of hedging instruments and shareholders' equity (in million euros) -144.1 -69.7 0.0 65.4 126.9 Annual accounts Governance Results Performance Strategy and value creation This is WDP ESG WDP 2023 Annual Report 112
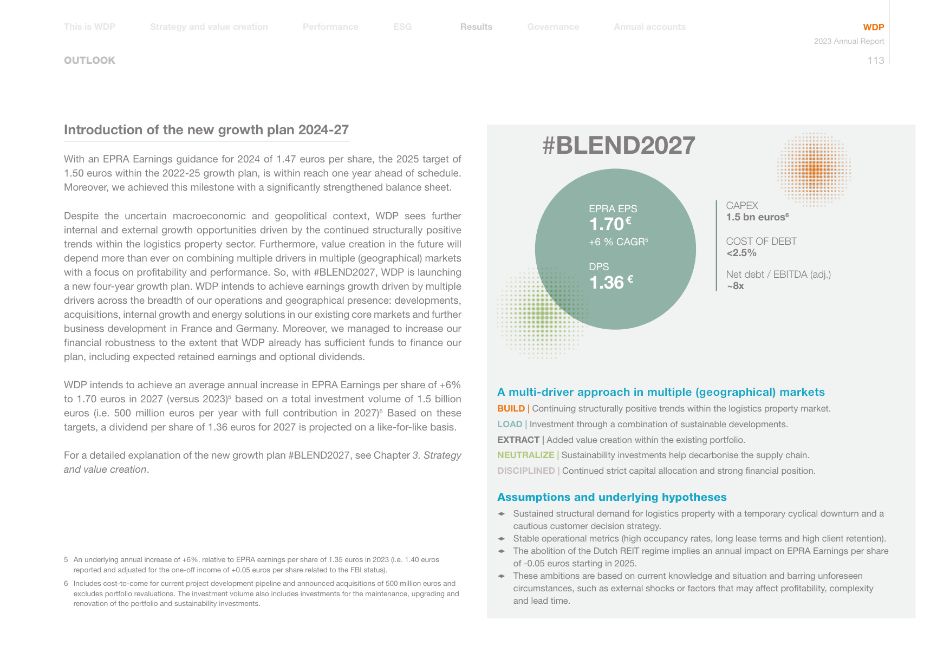
OUTLOOK Introduction of the new growth plan 2024-27 With an EPRA Earnings guidance for 2024 of 1.47 euros per share, the 2025 target of 1.50 euros within the 2022-25 growth plan, is within reach one year ahead of schedule. Moreover, we achieved this milestone with a significantly strengthened balance sheet. Despite the uncertain macroeconomic and geopolitical context, WDP sees further internal and external growth opportunities driven by the continued structurally positive trends within the logistics property sector. Furthermore, value creation in the future will depend more than ever on combining multiple drivers in multiple (geographical) markets with a focus on profitability and performance. So, with #BLEND2027, WDP is launching a new four-year growth plan. WDP intends to achieve earnings growth driven by multiple drivers across the breadth of our operations and geographical presence: developments, acquisitions, internal growth and energy solutions in our existing core markets and further business development in France and Germany. Moreover, we managed to increase our financial robustness to the extent that WDP already has sufficient funds to finance our plan, including expected retained earnings and optional dividends. WDP intends to achieve an average annual increase in EPRA Earnings per share of +6% to 1.70 euros in 2027 (versus 2023)5 based on a total investment volume of 1.5 billion euros (i.e. 500 million euros per year with full contribution in 2027)6 Based on these targets, a dividend per share of 1.36 euros for 2027 is projected on a like-for-like basis. For a detailed explanation of the new growth plan #BLEND2027, see Chapter 3. Strategy and value creation. 5 An underlying annual increase of +6%, relative to EPRA earnings per share of 1.35 euros in 2023 (i.e. 1.40 euros reported and adjusted for the one-off income of +0.05 euros per share related to the FBI status). 6 Includes cost-to-come for current project development pipeline and announced acquisitions of 500 million euros and excludes portfolio revaluations. The investment volume also includes investments for the maintenance, upgrading and renovation of the portfolio and sustainability investments. 1.5 bn euros6 CAPEX <2.5% COST OF DEBT ~8x Net debt / EBITDA (adj.) DPS 1.36 € EPRA EPS 1.70€ +6 % CAGR5 #BLEND2027 A multi-driver approach in multiple (geographical) markets BUILD | Continuing structurally positive trends within the logistics property market. LOAD | Investment through a combination of sustainable developments. EXTRACT | Added value creation within the existing portfolio. NEUTRALIZE | Sustainability investments help decarbonise the supply chain. DISCIPLINED | Continued strict capital allocation and strong financial position. Assumptions and underlying hypotheses 1 Sustained structural demand for logistics property with a temporary cyclical downturn and a cautious customer decision strategy. 1 Stable operational metrics (high occupancy rates, long lease terms and high client retention). 1 The abolition of the Dutch REIT regime implies an annual impact on EPRA Earnings per share of -0.05 euros starting in 2025. 1 These ambitions are based on current knowledge and situation and barring unforeseen circumstances, such as external shocks or factors that may affect profitability, complexity and lead time. Annual accounts Governance Results Performance Strategy and value creation This is WDP ESG WDP 2023 Annual Report 113
08 CORPORATE GOVERNANCE STATEMENT
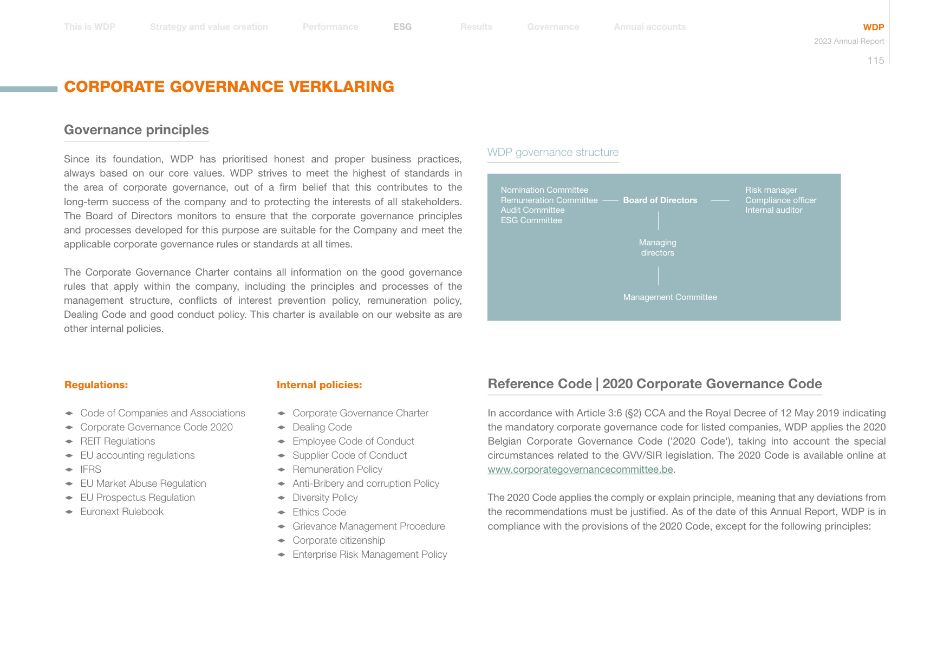
Nomination Committee Remuneration Committee Audit Committee ESG Committee Board of Directors Risk manager Compliance officer Internal auditor Management Committee WDP governance structure Managing directors Governance principles Since its foundation, WDP has prioritised honest and proper business practices, always based on our core values. WDP strives to meet the highest of standards in the area of corporate governance, out of a firm belief that this contributes to the long-term success of the company and to protecting the interests of all stakeholders. The Board of Directors monitors to ensure that the corporate governance principles and processes developed for this purpose are suitable for the Company and meet the applicable corporate governance rules or standards at all times. The Corporate Governance Charter contains all information on the good governance rules that apply within the company, including the principles and processes of the management structure, conflicts of interest prevention policy, remuneration policy, Dealing Code and good conduct policy. This charter is available on our website as are other internal policies. Regulations: 1 Code of Companies and Associations 1 Corporate Governance Code 2020 1 REIT Regulations 1 EU accounting regulations 1 IFRS 1 EU Market Abuse Regulation 1 EU Prospectus Regulation 1 Euronext Rulebook Internal policies: 1 Corporate Governance Charter 1 Dealing Code 1 Employee Code of Conduct 1 Supplier Code of Conduct 1 Remuneration Policy 1 Anti-Bribery and corruption Policy 1 Diversity Policy 1 Ethics Code 1 Grievance Management Procedure 1 Corporate citizenship 1 Enterprise Risk Management Policy Reference Code | 2020 Corporate Governance Code In accordance with Article 3:6 (§2) CCA and the Royal Decree of 12 May 2019 indicating the mandatory corporate governance code for listed companies, WDP applies the 2020 Belgian Corporate Governance Code ('2020 Code'), taking into account the special circumstances related to the GVV/SIR legislation. The 2020 Code is available online at www.corporategovernancecommittee.be. The 2020 Code applies the comply or explain principle, meaning that any deviations from the recommendations must be justified. As of the date of this Annual Report, WDP is in compliance with the provisions of the 2020 Code, except for the following principles: CORPORATE GOVERNANCE VERKLARING Annual accounts Governance Results Performance Strategy and value creation This is WDP ESG WDP 2023 Annual Report 115
CORPORATE GOVERNANCE STATEMENT Principles 3.19 to 3.21 of the 2020 Code cover the appointment of secretaries in the company. EXPLAIN | Given the rather small size of the Board of Directors, and to use the strengths within the company with maximum efficiency, for the time being the Board of Directors has opted not to assign the position of secretary to one specific person. At WDP, the function of secretary is performed by the CFO, who is also present at the Board of Directors' meetings, and the General Counsel, both of whom have the necessary skills and knowledge with regard to management issues: 1 supporting the Board of Directors and its committees in all governance matters; 1 preparing the Corporate Governance Charter and Corporate Governance Statement; 1 ensuring a proper flow of information within the Board of Directors and its committees and between the executive management and the non-executive directors; 1 accurately recording the essence of the discussions and decisions in the board meetings in the minutes; and 1 facilitating initial training and supporting professional development where necessary. Each director may contact the CFO or General Council individually. Principle 7.6 of the 2020 Code states that non-executive directors should receive part of their remuneration in the form of shares in the company. EXPLAIN | WDP deviates from this principle and does not provide remuneration in shares to non-executive directors. Taking into account the current remuneration amounts and the independent nature of the non-executive directors, WDP is of the view that providing part of the remuneration in shares would not necessarily contribute to the objective of the 2020 Code to have these directors act with the perspective of a long-term shareholder. As a GVV/SIR, WDP strives for a robust earnings and dividend per share, in line with the perspective of a long-term shareholder. Since its listing in 1999, WDP has focused on creating stable cash flows over the long-term which, in combination with its high disbursement obligation as a GVV/SIR, makes WDP a fully fledged, profitable and liquid alternative to direct investments in real estate based on rental income. This is the basis of its strategy, as determined by the Board of Directors, which is also clearly reflected in its strategic growth plan. The remuneration report included in this Corporate Governance Statement gives a summary of the total remuneration for the non-executive directors. Annual accounts Governance Results Performance Strategy and value creation This is WDP ESG WDP 2023 Annual Report 116
CORPORATE GOVERNANCE STATEMENT Principle 7.9 of the 2020 Code states that the Board of Directors must set a minimum threshold for shareholdings of members of the Management Committee. EXPLAIN | WDP deviates from this principle and does not set any explicit minimum threshold for WDP shareholdings for Management Committee members. As a GVV/SIR, WDP strives for a robust earnings and dividend per share, in line with the perspective of a long-term shareholder. Since its listing in 1999, WDP has focused on creating stable cash flows over the long-term which, in combination with its high disbursement obligation as a GVV/SIR, makes WDP a fully fledged, profitable and liquid alternative to direct investments in real estate based on rental income. This is the basis of its strategy, as determined by the Board of Directors, which is also clearly reflected in its strategic growth plan. It is this strategy that Management Committee members must roll out operationally. WDP therefore believes that its remuneration policy establishes a clear link with the creation of stable long-term cash flows and thus ensures that Management Committee members act from the perspective of a long-term shareholder. WDP does, however, encourage the members of the Management Committee to build up a shareholding and hold shares in WDP. Several members of the Management Committee have since accumulated such shareholdings. The remuneration report in this Corporate Governance Statement gives a summary of the shareholdings that the Management Committee members have in their own portfolios. This is therefore a shareholding in the Company accumulated by the relevant Management Committee member. Board of Directors Unitary board (one-tier governance structure) On 1 October 2019, after the conversion of WDP from a partnership limited by shares managed by a Statutory Manager into a public limited company with a unitary board (one-tier governance structure), the directors were appointed for the first time in WDP NV/SA, which is legally a different entity. However, this appointment took into account the terms of these directors on the Board of Directors of the former statutory manager of WDP, in the sense that: 1 they were appointed for the remaining period of their term with the former statutory manager; and 1 in drawing up their status as an independent director (Article 7:87 CCA), they also took into account the terms they had as independent and/or non-executive director with the former statutory manager. At least once every three years, the Board of Directors will evaluate the governance structure it has chosen to determine whether it is still suitable, and if not, it will propose a new governance structure to the General Meeting. A final review of the governance structure by the Board of Directors took place in December 2022 where it was decided that the choice of a unitary board is still the appropriate governance structure for WDP today. Annual accounts Governance Results Performance Strategy and value creation This is WDP ESG WDP 2023 Annual Report 117
CORPORATE GOVERNANCE STATEMENT Composition Principles The WDP Articles of Association state that the Company must be run by a Board of Directors consisting of at least three directors appointed by the General Meeting for up to four years. The majority of the Board of Directors consists of non-executive directors; it also has a suitable number of independent directors. The Articles of Association per the 2020 Code provide that at least three Directors have the status of independent Directors following the criteria described in the 2020 Code and the CG Charter. Moreover, WDP strives for the majority of the Board of Directors to be independent. The membership of the Board of Directors enables the management of WDP in accordance with its Articles of Association and its permitted activities (as described in Article 4 of the GVV/SIR Act). Members of the Board of Directors must meet the requirements set on the GVV/SIR under the applicable law, including membership exclusively comprising natural persons that meet the requirements of Articles 14 and 15 of the GVV/SIR Act (fit-and-proper test for directors). The membership of the Board of Directors as a whole must provide a combination of experience, knowledge and skills from individual members that enables optimal fulfilment of the role of the Board of Directors. Thus, on the whole, the Board of Directors must offer at least the following characteristics: 1 a proper balance in terms of knowledge, competencies and experience, beginning with the requirements for doing business efficiently in the markets where the company operates; 1 its members must ensure that it functions as an agile and effective body at all times, driven by an entrepreneurial spirit; 1 in decisions regarding its membership, the Board of Directors also strives to achieve diversity (in terms of gender, age and nationality) as well as to minimise present or future conflicts of interest between members and the WDP Group (legal, business, economic and ethical conflicts of interest). The Corporate Governance Charter also sets out the specific qualitative requirements on individual members, including an independent and enterprising personality, an impeccable reputation and proper business ethics. Moreover, the following principles must also be applied: 1 conformity with diversity requirements (Article 3:6 CCA); 1 conformity with specific gender diversity requirements (Article 7:86 CCA); 1 application of the defined age limit of 70 years, in that the term of a director shall end on conclusion of the annual meeting in the year in which the director turns 70 years of age, unless the Board of Directors resolves otherwise at the proposal of the Nomination Committee; 1 for the non-executive directors: up to 5 appointments as director of a listed company, subject to approval from the Board of Directors (with application of the comply or explain principle). Binding nomination right The articles of association of WDP provide for a binding nomination right for any natural person, legal entity or company (with or without legal personality) that individually and directly holds at least 10% of the shares in the company, under specific conditions as described in Article 15 of the Articles of Association of WDP. By virtue of this binding nomination right, Tony De Pauw was appointed by the Extraordinary General Meeting of WDP of 11 September 2019 as a director of WDP, effective as of 1 October 2019 at the proposal of the current Reference Shareholder of the company, the RTKA partnership. Tony De Pauw has been reappointed on 26 April 2023 by the General Meeting of WDP in the same role and is therefore, as of the date of this Annual Report, the only director appointed based on this binding nomination. Annual accounts Governance Results Performance Strategy and value creation This is WDP ESG WDP 2023 Annual Report 118
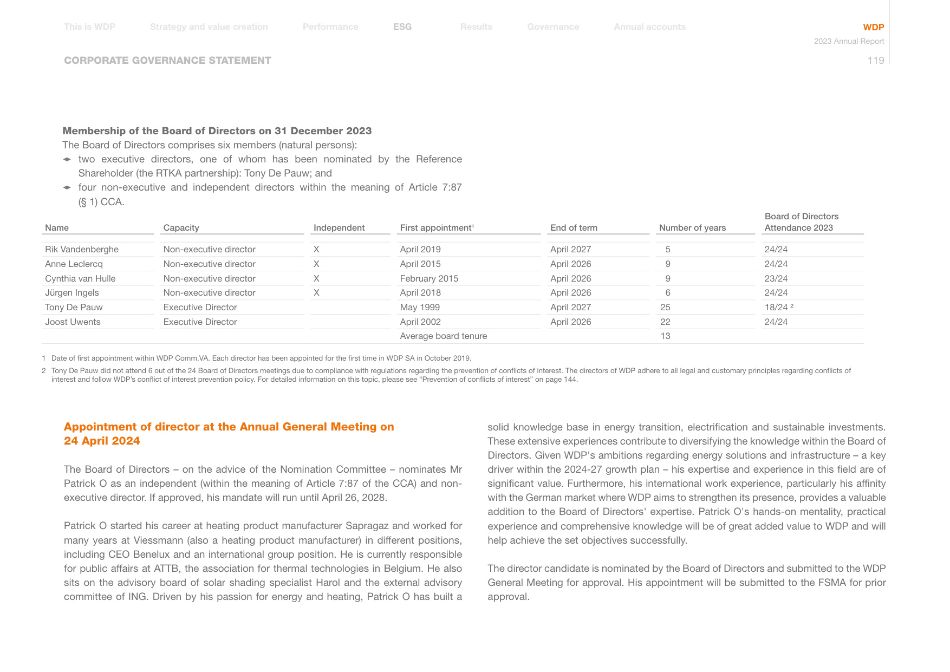
CORPORATE GOVERNANCE STATEMENT Name Capacity Independent First appointment1 End of term Number of years Board of Directors Attendance 2023 Rik Vandenberghe Non-executive director X April 2019 April 2027 5 24/24 Anne Leclercq Non-executive director X April 2015 April 2026 9 24/24 Cynthia van Hulle Non-executive director X February 2015 April 2026 9 23/24 Jürgen Ingels Non-executive director X April 2018 April 2026 6 24/24 Tony De Pauw Executive Director May 1999 April 2027 25 18/24 ² Joost Uwents Executive Director April 2002 April 2026 22 24/24 Average board tenure 13 1 Date of first appointment within WDP Comm.VA. Each director has been appointed for the first time in WDP SA in October 2019. 2 Tony De Pauw did not attend 6 out of the 24 Board of Directors meetings due to compliance with regulations regarding the prevention of conflicts of interest. The directors of WDP adhere to all legal and customary principles regarding conflicts of interest and follow WDP's conflict of interest prevention policy. For detailed information on this topic, please see "Prevention of conflicts of interest" on page 144. Membership of the Board of Directors on 31 December 2023 The Board of Directors comprises six members (natural persons): 1 two executive directors, one of whom has been nominated by the Reference Shareholder (the RTKA partnership): Tony De Pauw; and 1 four non-executive and independent directors within the meaning of Article 7:87 (§ 1) CCA. Appointment of director at the Annual General Meeting on 24 April 2024 The Board of Directors – on the advice of the Nomination Committee – nominates Mr Patrick O as an independent (within the meaning of Article 7:87 of the CCA) and non- executive director. If approved, his mandate will run until April 26, 2028. Patrick O started his career at heating product manufacturer Sapragaz and worked for many years at Viessmann (also a heating product manufacturer) in different positions, including CEO Benelux and an international group position. He is currently responsible for public affairs at ATTB, the association for thermal technologies in Belgium. He also sits on the advisory board of solar shading specialist Harol and the external advisory committee of ING. Driven by his passion for energy and heating, Patrick O has built a solid knowledge base in energy transition, electrification and sustainable investments. These extensive experiences contribute to diversifying the knowledge within the Board of Directors. Given WDP's ambitions regarding energy solutions and infrastructure – a key driver within the 2024-27 growth plan – his expertise and experience in this field are of significant value. Furthermore, his international work experience, particularly his affinity with the German market where WDP aims to strengthen its presence, provides a valuable addition to the Board of Directors' expertise. Patrick O's hands-on mentality, practical experience and comprehensive knowledge will be of great added value to WDP and will help achieve the set objectives successfully. The director candidate is nominated by the Board of Directors and submitted to the WDP General Meeting for approval. His appointment will be submitted to the FSMA for prior approval. Annual accounts Governance Results Performance Strategy and value creation This is WDP ESG WDP 2023 Annual Report 119
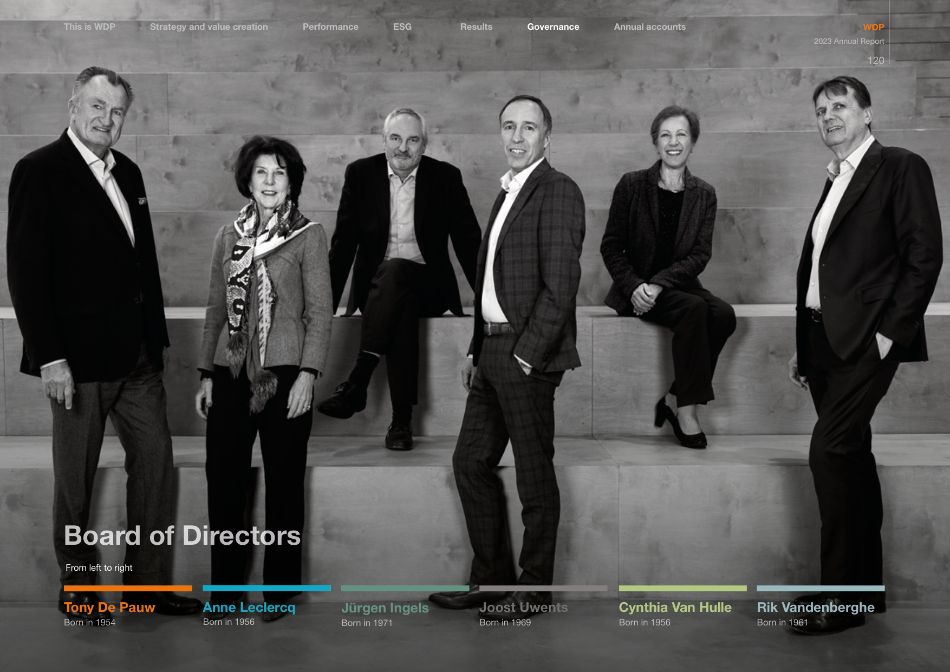
Anne Leclercq Born in 1956 From left to right Tony De Pauw Born in 1954 Jürgen Ingels Born in 1971 Joost Uwents Born in 1969 Cynthia Van Hulle Born in 1956 Rik Vandenberghe Born in 1961 Board of Directors Annual accounts Governance Results Performance Strategy and value creation This is WDP ESG WDP 2023 Annual Report 120
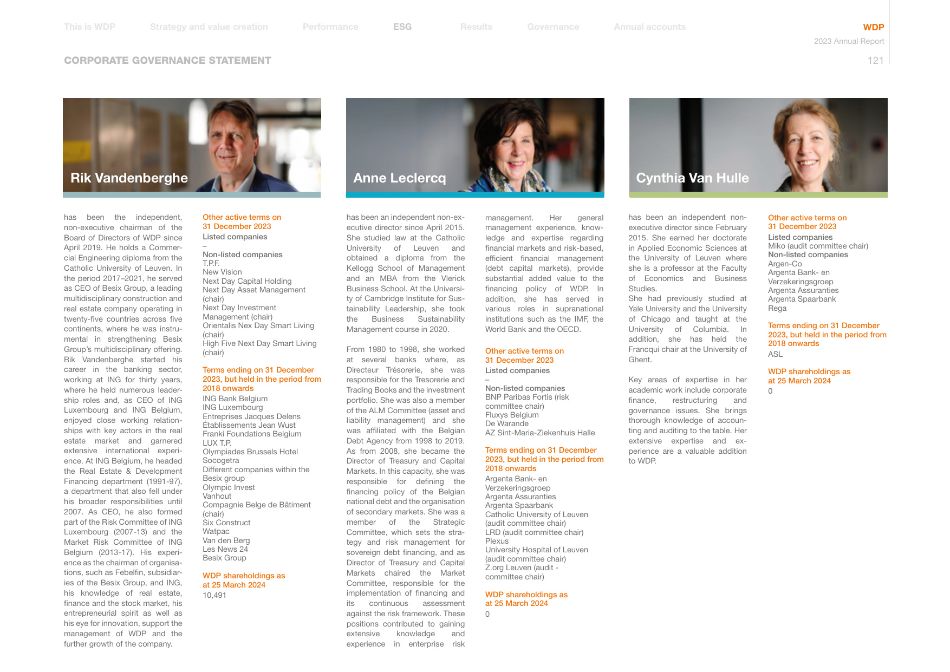
CORPORATE GOVERNANCE STATEMENT has been the independent, non-executive chairman of the Board of Directors of WDP since April 2019. He holds a Commer- cial Engineering diploma from the Catholic University of Leuven. In the period 2017–2021, he served as CEO of Besix Group, a leading multidisciplinary construction and real estate company operating in twenty-five countries across five continents, where he was instru- mental in strengthening Besix Group's multidisciplinary offering. Rik Vandenberghe started his career in the banking sector, working at ING for thirty years, where he held numerous leader- ship roles and, as CEO of ING Luxembourg and ING Belgium, enjoyed close working relation- ships with key actors in the real estate market and garnered extensive international experi- ence. At ING Belgium, he headed the Real Estate & Development Financing department (1991-97), a department that also fell under his broader responsibilities until 2007. As CEO, he also formed part of the Risk Committee of ING Luxembourg (2007-13) and the Market Risk Committee of ING Belgium (2013-17). His experi- ence as the chairman of organisa- tions, such as Febelfin, subsidiar- ies of the Besix Group, and ING, his knowledge of real estate, finance and the stock market, his entrepreneurial spirit as well as his eye for innovation, support the management of WDP and the further growth of the company. Other active terms on 31 December 2023 Listed companies – Non-listed companies T.P.F. New Vision Next Day Capital Holding Next Day Asset Management (chair) Next Day Investment Management (chair) Orientalis Nex Day Smart Living (chair) High Five Next Day Smart Living (chair) Terms ending on 31 December 2023, but held in the period from 2018 onwards ING Bank Belgium ING Luxembourg Entreprises Jacques Delens Établissements Jean Wust Franki Foundations Belgium LUX T.P. Olympiades Brussels Hotel Socogetra Different companies within the Besix group Olympic Invest Vanhout Compagnie Belge de Bâtiment (chair) Six Construct Watpac Van den Berg Les News 24 Besix Group WDP shareholdings as at 25 March 2024 10,491 has been an independent non- executive director since February 2015. She earned her doctorate in Applied Economic Sciences at the University of Leuven where she is a professor at the Faculty of Economics and Business Studies. She had previously studied at Yale University and the University of Chicago and taught at the University of Columbia. In addition, she has held the Francqui chair at the University of Ghent. Key areas of expertise in her academic work include corporate finance, restructuring and governance issues. She brings thorough knowledge of accoun- ting and auditing to the table. Her extensive expertise and ex- perience are a valuable addition to WDP. Other active terms on 31 December 2023 Listed companies Miko (audit committee chair) Non-listed companies Argen-Co Argenta Bank- en Verzekeringsgroep Argenta Assuranties Argenta Spaarbank Rega Terms ending on 31 December 2023, but held in the period from 2018 onwards ASL WDP shareholdings as at 25 March 2024 0 has been an independent non-ex- ecutive director since April 2015. She studied law at the Catholic University of Leuven and obtained a diploma from the Kellogg School of Management and an MBA from the Vlerick Business School. At the Universi- ty of Cambridge Institute for Sus- tainability Leadership, she took the Business Sustainability Management course in 2020. From 1980 to 1998, she worked at several banks where, as Directeur Trésorerie, she was responsible for the Tresorerie and Trading Books and the investment portfolio. She was also a member of the ALM Committee (asset and liability management) and she was affiliated with the Belgian Debt Agency from 1998 to 2019. As from 2008, she became the Director of Treasury and Capital Markets. In this capacity, she was responsible for defining the financing policy of the Belgian national debt and the organisation of secondary markets. She was a member of the Strategic Committee, which sets the stra tegy and risk management for sovereign debt financing, and as Director of Treasury and Capital Markets chaired the Market Committee, responsible for the implementation of financing and its continuous assessment against the risk framework. These positions contributed to gaining extensive knowledge and experience in enterprise risk management. Her general management experience, know- ledge and expertise regarding financial markets and risk-based, efficient financial management (debt capital markets), provide substantial added value to the financing policy of WDP. In addition, she has served in various roles in supranational institutions such as the IMF, the World Bank and the OECD. Other active terms on 31 December 2023 Listed companies – Non-listed companies BNP Paribas Fortis (risk committee chair) Fluxys Belgium De Warande AZ Sint-Maria-Ziekenhuis Halle Terms ending on 31 December 2023, but held in the period from 2018 onwards Argenta Bank- en Verzekeringsgroep Argenta Assuranties Argenta Spaarbank Catholic University of Leuven (audit committee chair) LRD (audit committee chair) Plexus University Hospital of Leuven (audit committee chair) Z.org Leuven (audit - committee chair) WDP shareholdings as at 25 March 2024 0 Rik Vandenberghe Anne Leclercq Cynthia Van Hulle Annual accounts Governance Results Performance Strategy and value creation This is WDP ESG WDP 2023 Annual Report 121
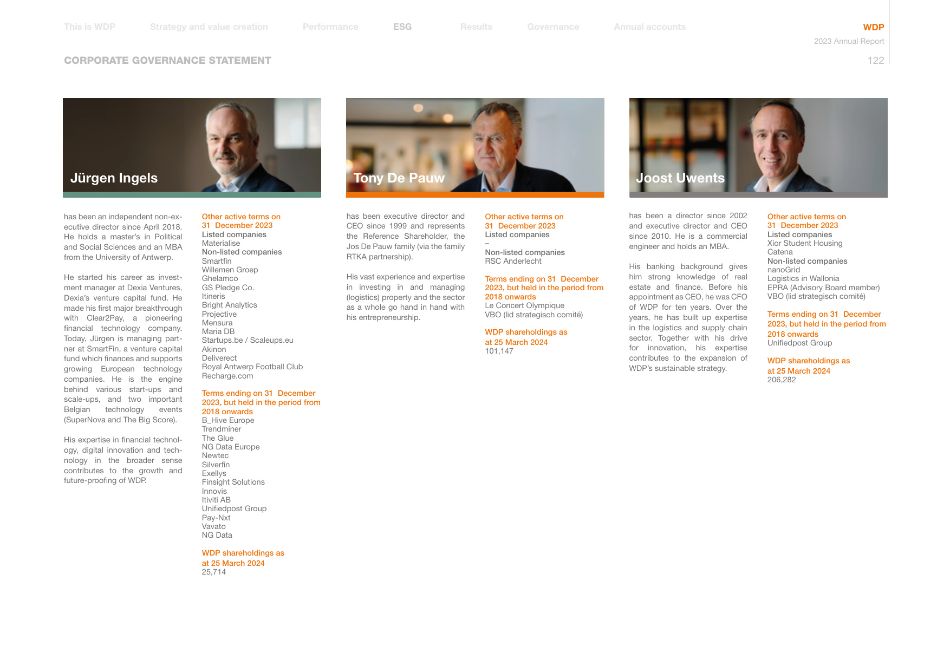
CORPORATE GOVERNANCE STATEMENT has been an independent non-ex- ecutive director since April 2018. He holds a master's in Political and Social Sciences and an MBA from the University of Antwerp. He started his career as invest- ment manager at Dexia Ventures, Dexia's venture capital fund. He made his first major breakthrough with Clear2Pay, a pioneering financial technology company. Today, Jürgen is managing part- ner at SmartFin, a venture capital fund which finances and supports growing European technology companies. He is the engine behind various start-ups and scale-ups, and two important Belgian technology events (SuperNova and The Big Score). His expertise in financial technol- ogy, digital innovation and tech- nology in the broader sense contributes to the growth and future-proofing of WDP. Other active terms on 31 December 2023 Listed companies Materialise Non-listed companies Smartfin Willemen Groep Ghelamco GS Pledge Co. Itineris Bright Analytics Projective Mensura Maria DB Startups.be / Scaleups.eu Akinon Deliverect Royal Antwerp Football Club Recharge.com Terms ending on 31 December 2023, but held in the period from 2018 onwards B_Hive Europe Trendminer The Glue NG Data Europe Newtec Silverfin Exellys Finsight Solutions Innovis Itiviti AB Unifiedpost Group Pay-Nxt Vavato NG Data WDP shareholdings as at 25 March 2024 25,714 has been executive director and CEO since 1999 and represents the Reference Shareholder, the Jos De Pauw family (via the family RTKA partnership). His vast experience and expertise in investing in and managing (logistics) property and the sector as a whole go hand in hand with his entrepreneurship. Other active terms on 31 December 2023 Listed companies – Non-listed companies RSC Anderlecht Terms ending on 31 December 2023, but held in the period from 2018 onwards Le Concert Olympique VBO (lid strategisch comité) WDP shareholdings as at 25 March 2024 101,147 has been a director since 2002 and executive director and CEO since 2010. He is a commercial engineer and holds an MBA. His banking background gives him strong knowledge of real estate and finance. Before his appointment as CEO, he was CFO of WDP for ten years. Over the years, he has built up expertise in the logistics and supply chain sector. Together with his drive for innovation, his expertise contributes to the expansion of WDP's sustainable strategy. Other active terms on 31 December 2023 Listed companies Xior Student Housing Catena Non-listed companies nanoGrid Logistics in Wallonia EPRA (Advisory Board member) VBO (lid strategisch comité) Terms ending on 31 December 2023, but held in the period from 2018 onwards Unifiedpost Group WDP shareholdings as at 25 March 2024 206,282 Jürgen Ingels Tony De Pauw Joost Uwents Annual accounts Governance Results Performance Strategy and value creation This is WDP ESG WDP 2023 Annual Report 122
CORPORATE GOVERNANCE STATEMENT Roles and responsibilities of the Board of Directors The WDP Board of Directors is authorised to perform all activities that are necessary or useful for achieving the object of the Company, with the exception of activities legally falling to the General Meeting. The Board of Directors sets the strategy and core values of WDP, decides on investments and the financing strategy and monitors the quality of the management. It prepares the WDP financial statements as well as the Annual Report (including Corporate Governance Statement and remuneration report) and convenes the General Meetings of the company. The Board of Directors decides on the use of the authorised capital. Moreover, it is the Board of Directors that decides on the structure of the management of WDP, and the powers individually or collectively conferred on the CEOs and/or other Management Committee members. Finally, the Board of Directors is the body responsible for facilitating effective dialogue with shareholders by means of, for example, transparent communication in press releases, the annual report and other channels. The Board of Directors, acting as a collegial body, represents the Company in all judicial and extrajudicial acts. The company is legally represented by two directors acting jointly in all judicial and extrajudicial acts. The Board of Directors has delegated the day-to-day management to both CEOs, each of whom may act alone, within the meaning of Article 7:121 CCA. The Company may also be represented by a special proxy. The Board of Directors operating rules are described in detail in WDP's Corporate Governance Charter. Activity report of the Board of Directors in 2023 The Board of Directors held 24 meetings in 2023 to discuss, among other things, the items listed below: 1 operating and financial reporting; 1 communications policy; 1 strategy and investment policy; 1 financing policy; 1 risk management policy; 1 composition and evaluation of the Board of Directors; 1 analysis and approval of the 2024 budget; 1 long-term strategy and analysis and new growth plan Blend 2024-27; 1 follow up on the ESG Roadmap, including the concrete targets in the WDP Climate Action Plan; 1 analysis and approval of investment, divestment and development dossiers; 1 analysis and approval of some credit agreements; 1 internal audit, digitisation, and business processes; 1 analysis and approval of a delegation matrix; 1 analysis, evaluation and implementation of specific actions with respect to specific risks, such as the regulatory risk related to the FBI status, cybersecurity, and the general macroeconomic climate; 1 analysis and approval of WDP's proposal to merge Sigmo; 1 analysis and approval of the joint venture proposal between WDP and Gosselin; 1 drafting of the Board of Directors reports related to the contribution in kind of a claim (in the context of the optional dividend); 1 approval of the capital increase by way of an accelerated bookbuild (ABB) within the authorised capital; 1 capital increases through contribution in kind of Power Solutions immovable property within the authorised capital; 1 completion of the aforementioned transactions and calculation of the resulting capital increase within the authorised capital; and 1 drafting and approving of the 2022 Universal Registration Document. Annual accounts Governance Results Performance Strategy and value creation This is WDP ESG WDP 2023 Annual Report 123
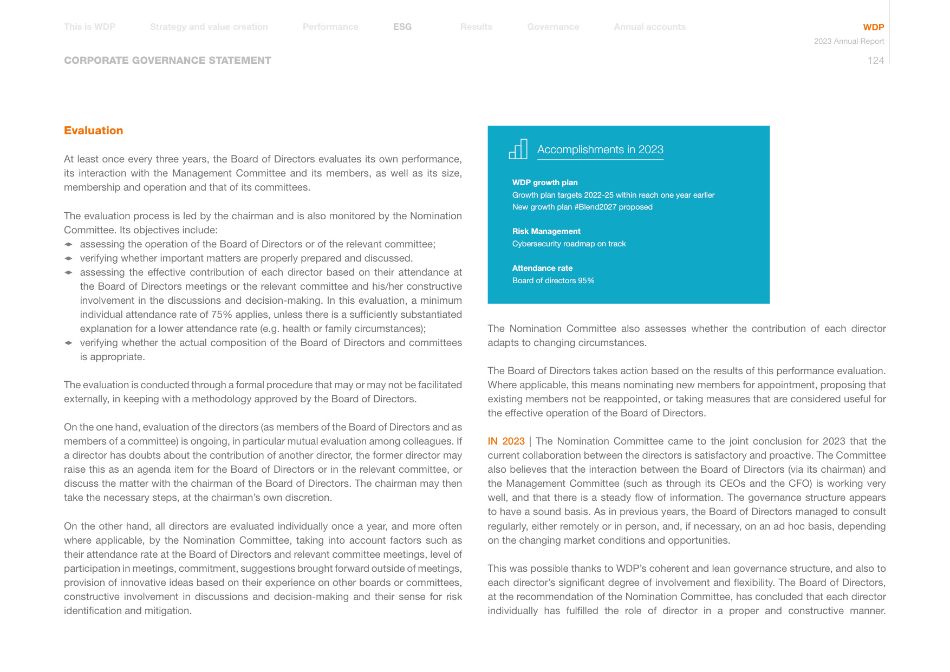
CORPORATE GOVERNANCE STATEMENT Evaluation At least once every three years, the Board of Directors evaluates its own performance, its interaction with the Management Committee and its members, as well as its size, membership and operation and that of its committees. The evaluation process is led by the chairman and is also monitored by the Nomination Committee. Its objectives include: 1 assessing the operation of the Board of Directors or of the relevant committee; 1 verifying whether important matters are properly prepared and discussed. 1 assessing the effective contribution of each director based on their attendance at the Board of Directors meetings or the relevant committee and his/her constructive involvement in the discussions and decision-making. In this evaluation, a minimum individual attendance rate of 75% applies, unless there is a sufficiently substantiated explanation for a lower attendance rate (e.g. health or family circumstances); 1 verifying whether the actual composition of the Board of Directors and committees is appropriate. The evaluation is conducted through a formal procedure that may or may not be facilitated externally, in keeping with a methodology approved by the Board of Directors. On the one hand, evaluation of the directors (as members of the Board of Directors and as members of a committee) is ongoing, in particular mutual evaluation among colleagues. If a director has doubts about the contribution of another director, the former director may raise this as an agenda item for the Board of Directors or in the relevant committee, or discuss the matter with the chairman of the Board of Directors. The chairman may then take the necessary steps, at the chairman's own discretion. On the other hand, all directors are evaluated individually once a year, and more often where applicable, by the Nomination Committee, taking into account factors such as their attendance rate at the Board of Directors and relevant committee meetings, level of participation in meetings, commitment, suggestions brought forward outside of meetings, provision of innovative ideas based on their experience on other boards or committees, constructive involvement in discussions and decision-making and their sense for risk identification and mitigation. Accomplishments in 2023 WDP growth plan Growth plan targets 2022-25 within reach one year earlier New growth plan #Blend2027 proposed Risk Management Cybersecurity roadmap on track Attendance rate Board of directors 95% The Nomination Committee also assesses whether the contribution of each director adapts to changing circumstances. The Board of Directors takes action based on the results of this performance evaluation. Where applicable, this means nominating new members for appointment, proposing that existing members not be reappointed, or taking measures that are considered useful for the effective operation of the Board of Directors. IN 2023 | The Nomination Committee came to the joint conclusion for 2023 that the current collaboration between the directors is satisfactory and proactive. The Committee also believes that the interaction between the Board of Directors (via its chairman) and the Management Committee (such as through its CEOs and the CFO) is working very well, and that there is a steady flow of information. The governance structure appears to have a sound basis. As in previous years, the Board of Directors managed to consult regularly, either remotely or in person, and, if necessary, on an ad hoc basis, depending on the changing market conditions and opportunities. This was possible thanks to WDP's coherent and lean governance structure, and also to each director's significant degree of involvement and flexibility. The Board of Directors, at the recommendation of the Nomination Committee, has concluded that each director individually has fulfilled the role of director in a proper and constructive manner. Annual accounts Governance Results Performance Strategy and value creation This is WDP ESG WDP 2023 Annual Report 124
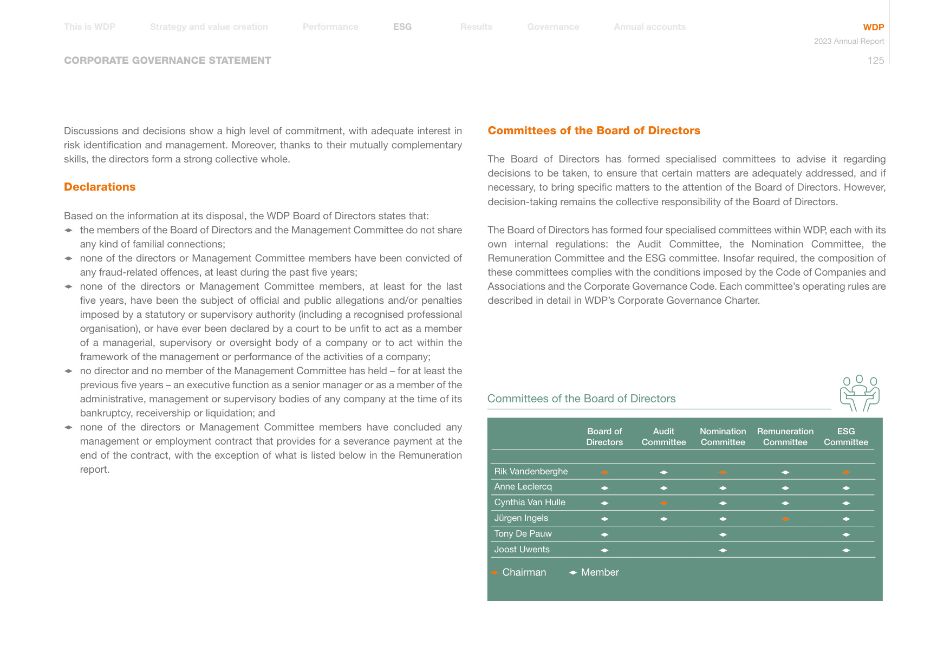
CORPORATE GOVERNANCE STATEMENT Discussions and decisions show a high level of commitment, with adequate interest in risk identification and management. Moreover, thanks to their mutually complementary skills, the directors form a strong collective whole. Declarations Based on the information at its disposal, the WDP Board of Directors states that: 1 the members of the Board of Directors and the Management Committee do not share any kind of familial connections; 1 none of the directors or Management Committee members have been convicted of any fraud-related offences, at least during the past five years; 1 none of the directors or Management Committee members, at least for the last five years, have been the subject of official and public allegations and/or penalties imposed by a statutory or supervisory authority (including a recognised professional organisation), or have ever been declared by a court to be unfit to act as a member of a managerial, supervisory or oversight body of a company or to act within the framework of the management or performance of the activities of a company; 1 no director and no member of the Management Committee has held – for at least the previous five years – an executive function as a senior manager or as a member of the administrative, management or supervisory bodies of any company at the time of its bankruptcy, receivership or liquidation; and 1 none of the directors or Management Committee members have concluded any management or employment contract that provides for a severance payment at the end of the contract, with the exception of what is listed below in the Remuneration report. Committees of the Board of Directors The Board of Directors has formed specialised committees to advise it regarding decisions to be taken, to ensure that certain matters are adequately addressed, and if necessary, to bring specific matters to the attention of the Board of Directors. However, decision-taking remains the collective responsibility of the Board of Directors. The Board of Directors has formed four specialised committees within WDP, each with its own internal regulations: the Audit Committee, the Nomination Committee, the Remuneration Committee and the ESG committee. Insofar required, the composition of these committees complies with the conditions imposed by the Code of Companies and Associations and the Corporate Governance Code. Each committee's operating rules are described in detail in WDP's Corporate Governance Charter. Board of Directors Audit Committee Nomination Committee Remuneration Committee ESG Committee Rik Vandenberghe 0 0 0 0 0 Anne Leclercq 0 0 0 0 0 Cynthia Van Hulle 0 0 0 0 0 Jürgen Ingels 0 0 0 0 0 Tony De Pauw 0 0 0 Joost Uwents 0 0 0 0 Chairman 0 Member Committees of the Board of Directors Annual accounts Governance Results Performance Strategy and value creation This is WDP ESG WDP 2023 Annual Report 125
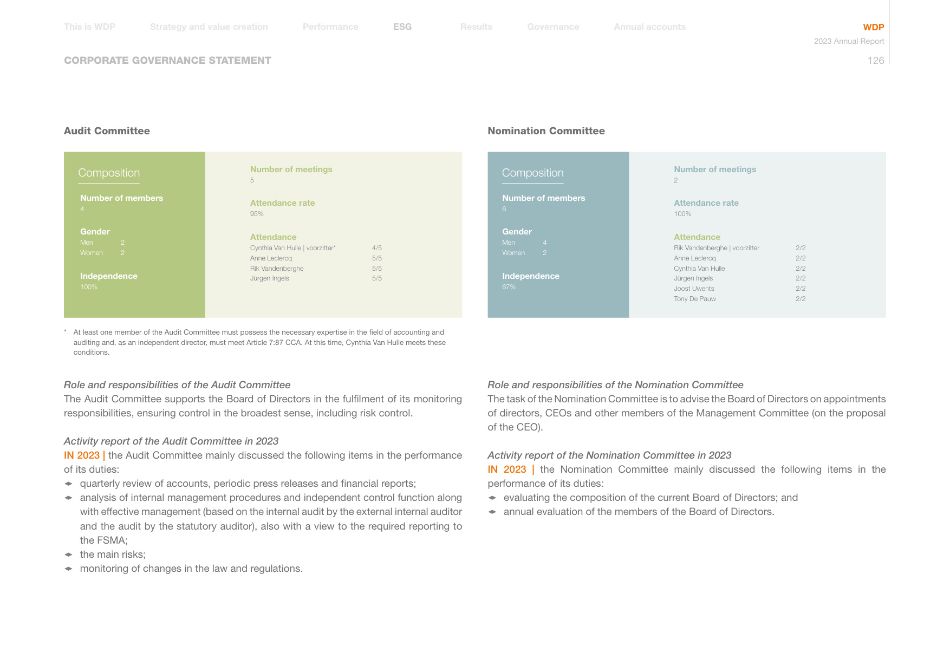
CORPORATE GOVERNANCE STATEMENT Audit Committee * At least one member of the Audit Committee must possess the necessary expertise in the field of accounting and auditing and, as an independent director, must meet Article 7:87 CCA. At this time, Cynthia Van Hulle meets these conditions. Role and responsibilities of the Audit Committee The Audit Committee supports the Board of Directors in the fulfilment of its monitoring responsibilities, ensuring control in the broadest sense, including risk control. Activity report of the Audit Committee in 2023 IN 2023 | the Audit Committee mainly discussed the following items in the performance of its duties: 1 quarterly review of accounts, periodic press releases and financial reports; 1 analysis of internal management procedures and independent control function along with effective management (based on the internal audit by the external internal auditor and the audit by the statutory auditor), also with a view to the required reporting to the FSMA; 1 the main risks; 1 monitoring of changes in the law and regulations. Nomination Committee * Role and responsibilities of the Nomination Committee The task of the Nomination Committee is to advise the Board of Directors on appointments of directors, CEOs and other members of the Management Committee (on the proposal of the CEO). Activity report of the Nomination Committee in 2023 IN 2023 | the Nomination Committee mainly discussed the following items in the performance of its duties: 1 evaluating the composition of the current Board of Directors; and 1 annual evaluation of the members of the Board of Directors. Composition Number of meetings 5 Attendance rate 95% Attendance Cynthia Van Hulle | voorzitter* 4/5 Anne Leclercq 5/5 Rik Vandenberghe 5/5 Jürgen Ingels 5/5 Number of members 4 Gender Men 2 Women 2 Independence 100% Composition Number of meetings 2 Attendance rate 100% Attendance Rik Vandenberghe | voorzitter 2/2 Anne Leclercq 2/2 Cynthia Van Hulle 2/2 Jürgen Ingels 2/2 Joost Uwents 2/2 Tony De Pauw 2/2 Number of members 6 Gender Men 4 Women 2 Independence 67% Annual accounts Governance Results Performance Strategy and value creation This is WDP ESG WDP 2023 Annual Report 126
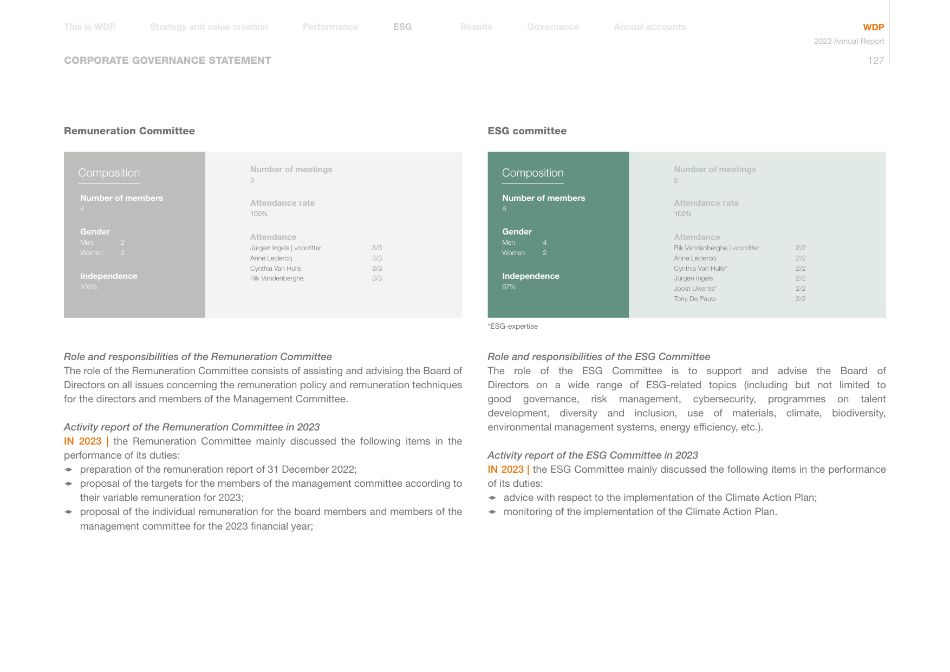
CORPORATE GOVERNANCE STATEMENT Remuneration Committee Role and responsibilities of the Remuneration Committee The role of the Remuneration Committee consists of assisting and advising the Board of Directors on all issues concerning the remuneration policy and remuneration techniques for the directors and members of the Management Committee. Activity report of the Remuneration Committee in 2023 IN 2023 | the Remuneration Committee mainly discussed the following items in the performance of its duties: 1 preparation of the remuneration report of 31 December 2022; 1 proposal of the targets for the members of the management committee according to their variable remuneration for 2023; 1 proposal of the individual remuneration for the board members and members of the management committee for the 2023 financial year; ESG committee Role and responsibilities of the ESG Committee The role of the ESG Committee is to support and advise the Board of Directors on a wide range of ESG-related topics (including but not limited to good governance, risk management, cybersecurity, programmes on talent development, diversity and inclusion, use of materials, climate, biodiversity, environmental management systems, energy efficiency, etc.). Activity report of the ESG Committee in 2023 IN 2023 | the ESG Committee mainly discussed the following items in the performance of its duties: 1 advice with respect to the implementation of the Climate Action Plan; 1 monitoring of the implementation of the Climate Action Plan. Number of meetings 3 Attendance rate 100% Attendance Jürgen Ingels | voorzitter 3/3 Anne Leclercq 3/3 Cynthia Van Hulle 3/3 Rik Vandenberghe 3/3 Composition Number of members 4 Gender Men 2 Women 2 Independence 100% Composition Number of meetings 2 Attendance rate 100% Attendance Rik Vandenberghe | voorzitter 2/2 Anne Leclercq 2/2 Cynthia Van Hulle* 2/2 Jürgen Ingels 2/2 Joost Uwents* 2/2 Tony De Pauw 2/2 Number of members 6 Gender Men 4 Women 2 Independence 67% *ESG-expertise Annual accounts Governance Results Performance Strategy and value creation This is WDP ESG WDP 2023 Annual Report 127
CORPORATE GOVERNANCE STATEMENT The role of the CEOs is to work with the other members of the Management Committee on the following: 1 implementing the WDP mission, policy plan and strategic objectives as determined by the Board of Directors; 1 implementing the decisions of the Board of Directors and following up on the performance and results; 1 reporting to the Board of Directors on the progress of all matters and files that fall under the competence of the Board of Directors. The Board of Directors has delegated the day-to-day management to both CEOs, each of whom may act alone, within the meaning of Article 7:121 CCA. The day-to-day management comprises all actions and decisions that do not extend beyond the needs of the company's day-to-day proceedings as well as the actions and decisions which, due to their lesser importance or urgency, do not justify the intervention of the Board of Directors. Each member of the Management Committee is individually responsible for the tasks delegated to them by the CEOs (or, in the case of the CEOs, by the Board of Directors). The Management Committee has no other responsibility than to act as an advisory committee to the Board of Directors. The Management Committee's operating rules are described in detail in WDP's Corporate Governance Charter. Evaluation of the Management Committee The Management Committee completes an annual evaluation of its own functioning, powers and responsibilities. The chairman of the Management Committee shall present and discuss the results of this evaluation with the Board of Directors. The Board of Directors can, if necessary, take appropriate measures. The Management Committee can in turn act on the results of the evaluation by recognising its strengths and improving its weaknesses. Management Committee By a decision of the Board of Directors, a Management Committee was formed on 1 October 2019 which acts as an advisory body to the Board of Directors. Composition Principles The members are appointed by the Board of Directors on the recommendation of the Nomination Committee. Members of the Management Committee may be either natural persons or legal entities. In the case of a legal entity, it must appoint a single permanent representative who will represent it at Management Committee meetings. The Board of Directors decides the length of the term of each member of the Management Committee at the time of his appointment. The remuneration, term and conditions for dismissal of a member of the Management Committee are governed by an agreement between each Management Committee member and the Company (with approvals by the Board of Directors and on the recommendation of the Nomination Committee and Remuneration Committee). The following pages show the composition of the Management Committee as of 31 December 2023 where the Management Committee members selected the address of the registered office of WDP NV/SA as their office address, with a view to their role in WDP NV/SA. Role and responsibilities of the Management Committee The role of the Management Committee is to consult with the Board of Directors and advise them on the day-to-day management of WDP, and always in accordance with the values, strategy, general policy and business plan determined by the Board of Directors. Annual accounts Governance Results Performance Strategy and value creation This is WDP ESG WDP 2023 Annual Report 128
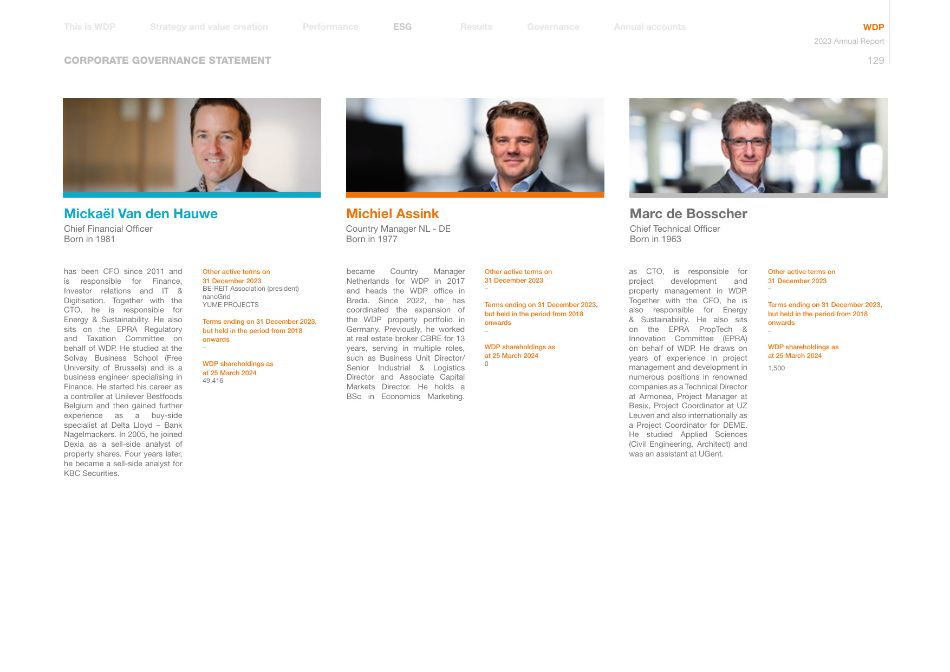
CORPORATE GOVERNANCE STATEMENT has been CFO since 2011 and is responsible for Finance, Investor relations and IT & Digitisation. Together with the CTO, he is responsible for Energy & Sustainability. He also sits on the EPRA Regulatory and Taxation Committee on behalf of WDP. He studied at the Solvay Business School (Free University of Brussels) and is a business engineer specialising in Finance. He started his career as a controller at Unilever Bestfoods Belgium and then gained further experience as a buy-side specialist at Delta Lloyd – Bank Nagelmackers. In 2005, he joined Dexia as a sell-side analyst of property shares. Four years later, he became a sell-side analyst for KBC Securities. Other active terms on 31 December 2023 BE-REIT Association (president) nanoGrid YUME PROJECTS Terms ending on 31 December 2023, but held in the period from 2018 onwards – WDP shareholdings as at 25 March 2024 49,416 Other active terms on 31 December 2023 – Terms ending on 31 December 2023, but held in the period from 2018 onwards – WDP shareholdings as at 25 March 2024 0 became Country Manager Netherlands for WDP in 2017 and heads the WDP office in Breda. Since 2022, he has coordinated the expansion of the WDP property portfolio in Germany. Previously, he worked at real estate broker CBRE for 13 years, serving in multiple roles, such as Business Unit Director/ Senior Industrial & Logistics Director and Associate Capital Markets Director. He holds a BSc in Economics Marketing. as CTO, is responsible for project development and property management in WDP. Together with the CFO, he is also responsible for Energy & Sustainability. He also sits on the EPRA PropTech & Innovation Committee (EPRA) on behalf of WDP. He draws on years of experience in project management and development in numerous positions in renowned companies as a Technical Director at Armonea, Project Manager at Besix, Project Coordinator at UZ Leuven and also internationally as a Project Coordinator for DEME. He studied Applied Sciences (Civil Engineering, Architect) and was an assistant at UGent. Other active terms on 31 December 2023 – Terms ending on 31 December 2023, but held in the period from 2018 onwards – WDP shareholdings as at 25 March 2024 1,500 Mickaël Van den Hauwe Chief Financial Officer Born in 1981 Michiel Assink Country Manager NL - DE Born in 1977 Marc de Bosscher Chief Technical Officer Born in 1963 Annual accounts Governance Results Performance Strategy and value creation This is WDP ESG WDP 2023 Annual Report 129

CORPORATE GOVERNANCE STATEMENT is WDP's Country Manager Belgium, Luxembourg and France since 2014. His responsibility in this role is to coordinate the commercial team and the property managers. He holds a Master in Business Economics and a Master in Real Estate Management. He is also a member of the Royal Institute of Chartered Surveyors. Christoffel has over 25 years of experience in commercial property. He started his career as a real estate broker before joining UK logistics REIT Segro, serving in several commercial roles in Belgium over a ten-year period. From 2007 to 2008, he was the Europe Development Director and Belgium Country Manager at US REIT First Industrial. After this, he worked as the Managing Director of Belgian real estate developer MG Real Estate for five years. Other active terms on 31 December 2023 REAL ISTIC BM De Witte Terms ending on 31 December 2023, but held in the period from 2018 onwards Comaan (joint shareholder) WDP shareholdings as at 25 March 2024 0 After his law studies, Jeroen specialised in export management and logistics. He first spent two years working at the Bar Association of Antwerp before taking a position as an international legal and financial controller at Den Braven Sealants. In 2001, Jeroen became an international entrepreneur through joint ventures with Romanian, Dutch and Belgian partners. Since 2007, he has been responsible for expanding the WDP property portfolio in Romania as the Country Manager and co-shareholder. Other active terms on 31 December 2023 J.B. Top Pro Invest Vuurkruisenbizz Antonino Invest Apartementele Trandafirul Asta Pro Invest Beltech Brabuild Invest Joca Invest NBR Pro Invest Paulina Invest San Carlo Invest Mills Invest Lamast Invest Terms ending on 31 December 2023, but held in the period from 2018 onwards – WDP shareholdings as at 25 March 2024 0 We refer to the description above under Board of Directors. Christoffel De Witte Country Manager BE-LU-FR, Born in 1967 Jeroen Biermans Country Manager RO, Born in 1971 Tony De Pauw Co-CEO, Born in 1954 Joost Uwents Co-CEO, Born in 1969 Annual accounts Governance Results Performance Strategy and value creation This is WDP ESG WDP 2023 Annual Report 130
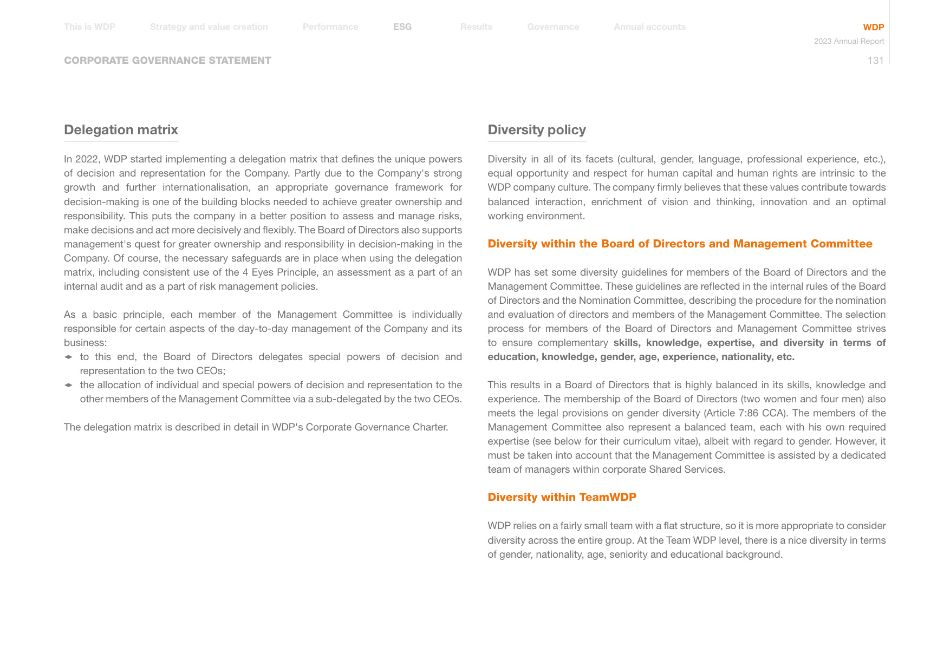
CORPORATE GOVERNANCE STATEMENT Delegation matrix In 2022, WDP started implementing a delegation matrix that defines the unique powers of decision and representation for the Company. Partly due to the Company's strong growth and further internationalisation, an appropriate governance framework for decision-making is one of the building blocks needed to achieve greater ownership and responsibility. This puts the company in a better position to assess and manage risks, make decisions and act more decisively and flexibly. The Board of Directors also supports management's quest for greater ownership and responsibility in decision-making in the Company. Of course, the necessary safeguards are in place when using the delegation matrix, including consistent use of the 4 Eyes Principle, an assessment as a part of an internal audit and as a part of risk management policies. As a basic principle, each member of the Management Committee is individually responsible for certain aspects of the day-to-day management of the Company and its business: 1 to this end, the Board of Directors delegates special powers of decision and representation to the two CEOs; 1 the allocation of individual and special powers of decision and representation to the other members of the Management Committee via a sub-delegated by the two CEOs. The delegation matrix is described in detail in WDP's Corporate Governance Charter. Diversity policy Diversity in all of its facets (cultural, gender, language, professional experience, etc.), equal opportunity and respect for human capital and human rights are intrinsic to the WDP company culture. The company firmly believes that these values contribute towards balanced interaction, enrichment of vision and thinking, innovation and an optimal working environment. Diversity within the Board of Directors and Management Committee WDP has set some diversity guidelines for members of the Board of Directors and the Management Committee. These guidelines are reflected in the internal rules of the Board of Directors and the Nomination Committee, describing the procedure for the nomination and evaluation of directors and members of the Management Committee. The selection process for members of the Board of Directors and Management Committee strives to ensure complementary skills, knowledge, expertise, and diversity in terms of education, knowledge, gender, age, experience, nationality, etc. This results in a Board of Directors that is highly balanced in its skills, knowledge and experience. The membership of the Board of Directors (two women and four men) also meets the legal provisions on gender diversity (Article 7:86 CCA). The members of the Management Committee also represent a balanced team, each with his own required expertise (see below for their curriculum vitae), albeit with regard to gender. However, it must be taken into account that the Management Committee is assisted by a dedicated team of managers within corporate Shared Services. Diversity within TeamWDP WDP relies on a fairly small team with a flat structure, so it is more appropriate to consider diversity across the entire group. At the Team WDP level, there is a nice diversity in terms of gender, nationality, age, seniority and educational background. Annual accounts Governance Results Performance Strategy and value creation This is WDP ESG WDP 2023 Annual Report 131
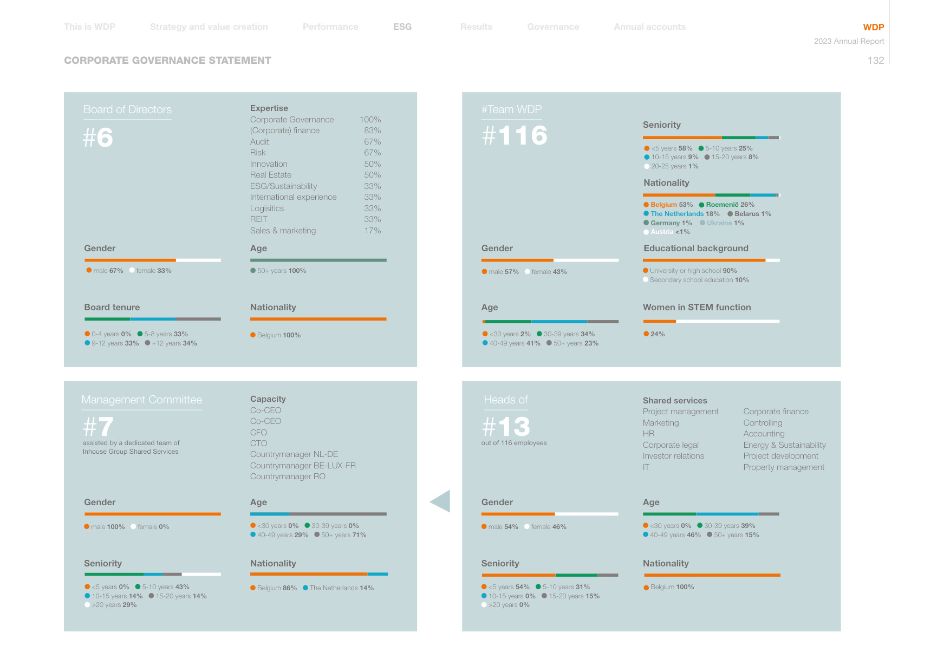
CORPORATE GOVERNANCE STATEMENT #6 #7 #13 #116 Board of Directors #Team WDP Management Committee Heads of 50+ years 100% <30 years 0% 30-39 years 0% 40-49 years 29% 50+ years 71% <30 years 0% 30-39 years 39% 40-49 years 46% 50+ years 15% <30 years 2% 30-39 years 34% 40-49 years 41% 50+ years 23% 0-4 years 0% 5-8 years 33% 9-12 years 33% +12 years 34% <5 years 0% 5-10 years 43% 10-15 years 14% 15-20 years 14% >20 years 29% University or high school 90% Secondary school education 10% Belgium 100% Belgium 86% The Netherlands 14% Belgium 100% Belgium 53% Roemenië 26% The Netherlands 18% Belarus 1% Germany 1% Ukraine 1% Austria <1% Gender Gender Gender Gender Educational background Nationality Age Women in STEM function Seniority Age Age Age Board tenure Seniority Seniority Nationality Nationality Nationality male 67% female 33% male 100% female 0% male 54% female 46% male 57% female 43% assisted by a dedicated team of Inhouse Group Shared Services out of 116 employees Expertise Corporate Governance 100% (Corporate) finance 83% Audit 67% Risk 67% Innovation 50% Real Estate 50% ESG/Sustainability 33% International experience 33% Logisitics 33% REIT 33% Sales & marketing 17% Capacity Co-CEO Co-CEO CFO CTO Countrymanager NL-DE Countrymanager BE-LUX-FR Countrymanager RO Shared services Project management Marketing HR Corporate legal Investor relations IT Corporate finance Controlling Accounting Energy & Sustainability Project development Property management <5 years 58% 5-10 years 25% 10-15 years 9% 15-20 years 8% 20-25 years 1% <5 years 54% 5-10 years 31% 10-15 years 0% 15-20 years 15% >20 years 0% 24% Annual accounts Governance Results Performance Strategy and value creation This is WDP ESG WDP 2023 Annual Report 132
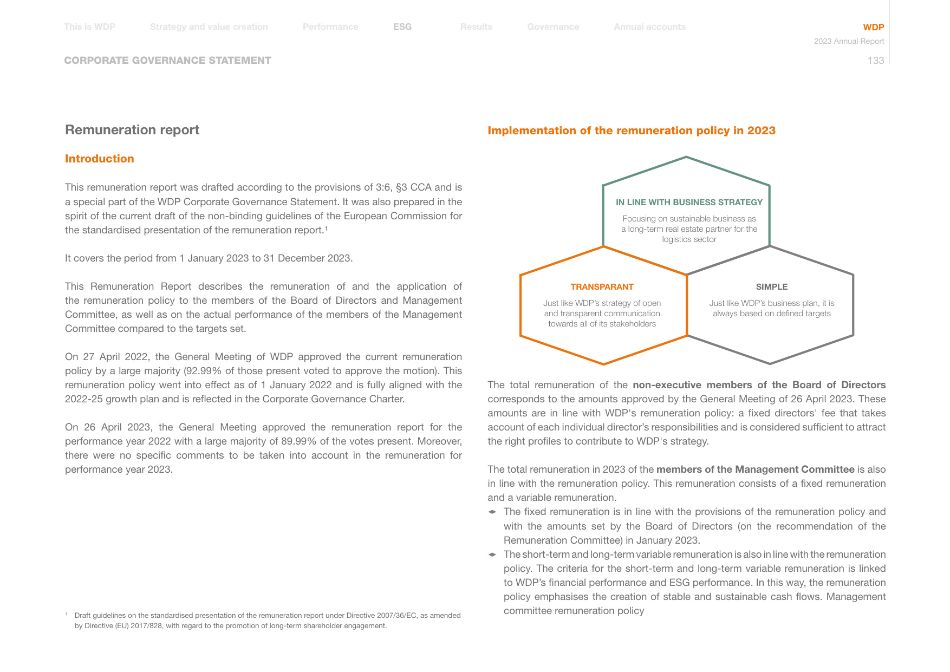
CORPORATE GOVERNANCE STATEMENT Implementation of the remuneration policy in 2023 TRANSPARANT Just like WDP's strategy of open and transparent communication towards all of its stakeholders SIMPLE Just like WDP's business plan, it is always based on defined targets IN LINE WITH BUSINESS STRATEGY Focusing on sustainable business as a long-term real estate partner for the logistics sector The total remuneration of the non-executive members of the Board of Directors corresponds to the amounts approved by the General Meeting of 26 April 2023. These amounts are in line with WDP's remuneration policy: a fixed directors' fee that takes account of each individual director's responsibilities and is considered sufficient to attract the right profiles to contribute to WDP's strategy. The total remuneration in 2023 of the members of the Management Committee is also in line with the remuneration policy. This remuneration consists of a fixed remuneration and a variable remuneration. 1 The fixed remuneration is in line with the provisions of the remuneration policy and with the amounts set by the Board of Directors (on the recommendation of the Remuneration Committee) in January 2023. 1 The short-term and long-term variable remuneration is also in line with the remuneration policy. The criteria for the short-term and long-term variable remuneration is linked to WDP's financial performance and ESG performance. In this way, the remuneration policy emphasises the creation of stable and sustainable cash flows. Management committee remuneration policy Remuneration report Introduction This remuneration report was drafted according to the provisions of 3:6, §3 CCA and is a special part of the WDP Corporate Governance Statement. It was also prepared in the spirit of the current draft of the non-binding guidelines of the European Commission for the standardised presentation of the remuneration report.1 It covers the period from 1 January 2023 to 31 December 2023. This Remuneration Report describes the remuneration of and the application of the remuneration policy to the members of the Board of Directors and Management Committee, as well as on the actual performance of the members of the Management Committee compared to the targets set. On 27 April 2022, the General Meeting of WDP approved the current remuneration policy by a large majority (92.99% of those present voted to approve the motion). This remuneration policy went into effect as of 1 January 2022 and is fully aligned with the 2022-25 growth plan and is reflected in the Corporate Governance Charter. On 26 April 2023, the General Meeting approved the remuneration report for the performance year 2022 with a large majority of 89.99% of the votes present. Moreover, there were no specific comments to be taken into account in the remuneration for performance year 2023. 1 Draft guidelines on the standardised presentation of the remuneration report under Directive 2007/36/EC, as amended by Directive (EU) 2017/828, with regard to the promotion of long-term shareholder engagement. Annual accounts Governance Results Performance Strategy and value creation This is WDP ESG WDP 2023 Annual Report 133
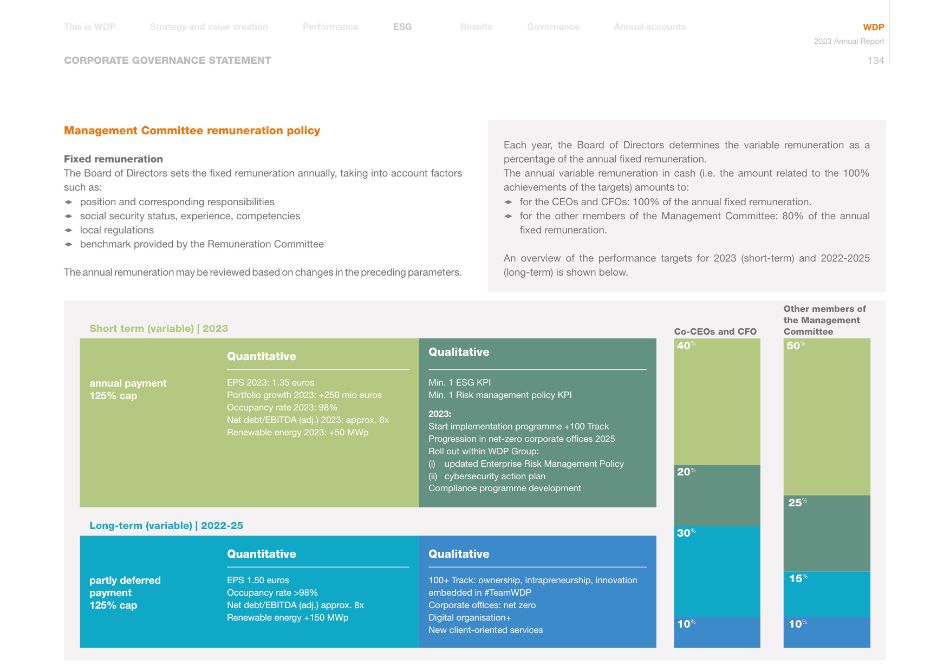
CORPORATE GOVERNANCE STATEMENT Each year, the Board of Directors determines the variable remuneration as a percentage of the annual fixed remuneration. The annual variable remuneration in cash (i.e. the amount related to the 100% achievements of the targets) amounts to: 1 for the CEOs and CFOs: 100% of the annual fixed remuneration. 1 for the other members of the Management Committee: 80% of the annual fixed remuneration. An overview of the performance targets for 2023 (short-term) and 2022-2025 (long-term) is shown below. Management Committee remuneration policy Fixed remuneration The Board of Directors sets the fixed remuneration annually, taking into account factors such as: 1 position and corresponding responsibilities 1 social security status, experience, competencies 1 local regulations 1 benchmark provided by the Remuneration Committee The annual remuneration may be reviewed based on changes in the preceding parameters. Short term (variable) | 2023 Quantitative Qualitative annual payment 125% cap EPS 2023: 1.35 euros Portfolio growth 2023: +250 mio euros Occupancy rate 2023: 98% Net debt/EBITDA (adj.) 2023: approx. 8x Renewable energy 2023: +50 MWp Min. 1 ESG KPI Min. 1 Risk management policy KPI 2023: Start implementation programme +100 Track Progression in net-zero corporate offices 2025 Roll out within WDP Group: (i) updated Enterprise Risk Management Policy (ii) cybersecurity action plan Compliance programme development Long-term (variable) | 2022-25 Quantitative Qualitative partly deferred payment 125% cap EPS 1.50 euros Occupancy rate >98% Net debt/EBITDA (adj.) approx. 8x Renewable energy +150 MWp 100+ Track: ownership, intrapreneurship, innovation embedded in #TeamWDP Corporate offices: net zero Digital organisation+ New client-oriented services Co-CEOs and CFO 20% 40% 30% 10% Other members of the Management Committee 25% 15% 10% 50% Annual accounts Governance Results Performance Strategy and value creation This is WDP ESG WDP 2023 Annual Report 134
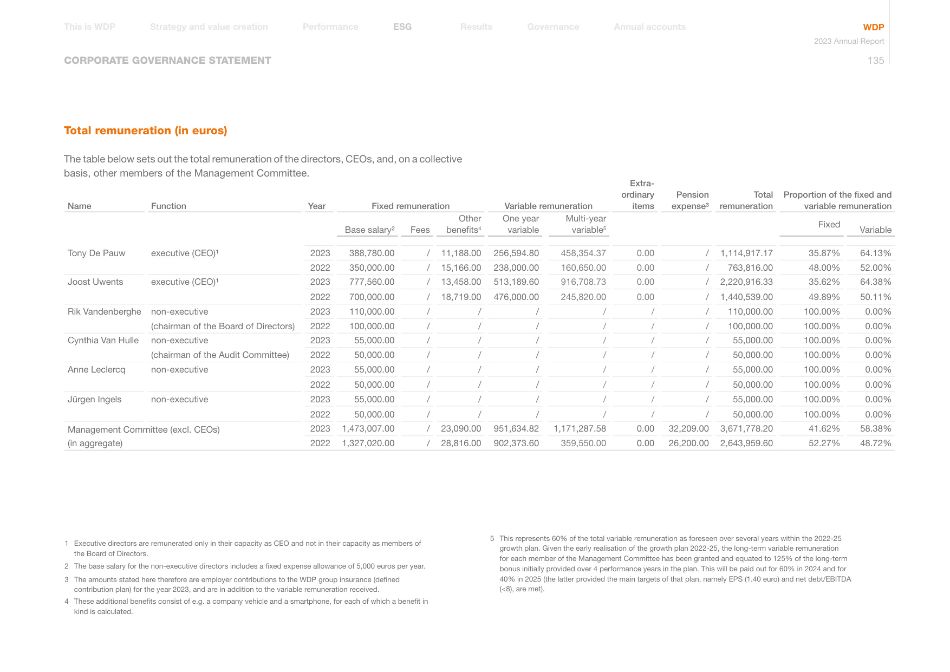
CORPORATE GOVERNANCE STATEMENT Total remuneration (in euros) The table below sets out the total remuneration of the directors, CEOs, and, on a collective basis, other members of the Management Committee. Name Function Year Fixed remuneration Variable remuneration Extra- ordinary items Pension expense³ Total remuneration Proportion of the fixed and variable remuneration Base salary² Fees Other benefits4 One year variable Multi-year variable5 Fixed Variable Tony De Pauw executive (CEO)¹ 2023 388,780.00 / 11,188.00 256,594.80 458,354.37 0.00 / 1,114,917.17 35.87% 64.13% 2022 350,000.00 / 15,166.00 238,000.00 160,650.00 0.00 / 763,816.00 48.00% 52.00% Joost Uwents executive (CEO)¹ 2023 777,560.00 / 13,458.00 513,189.60 916,708.73 0.00 / 2,220,916.33 35.62% 64.38% 2022 700,000.00 / 18,719.00 476,000.00 245,820.00 0.00 / 1,440,539.00 49.89% 50.11% Rik Vandenberghe non-executive 2023 110,000.00 / / / / / / 110,000.00 100.00% 0.00% (chairman of the Board of Directors) 2022 100,000.00 / / / / / / 100,000.00 100.00% 0.00% Cynthia Van Hulle non-executive 2023 55,000.00 / / / / / / 55,000.00 100.00% 0.00% (chairman of the Audit Committee) 2022 50,000.00 / / / / / / 50,000.00 100.00% 0.00% Anne Leclercq non-executive 2023 55,000.00 / / / / / / 55,000.00 100.00% 0.00% 2022 50,000.00 / / / / / / 50,000.00 100.00% 0.00% Jürgen Ingels non-executive 2023 55,000.00 / / / / / / 55,000.00 100.00% 0.00% 2022 50,000.00 / / / / / / 50,000.00 100.00% 0.00% Management Committee (excl. CEOs) 2023 1,473,007.00 / 23,090.00 951,634.82 1,171,287.58 0.00 32,209.00 3,671,778.20 41.62% 58.38% (in aggregate) 2022 1,327,020.00 / 28,816.00 902,373.60 359,550.00 0.00 26,200.00 2,643,959.60 52.27% 48.72% 1 Executive directors are remunerated only in their capacity as CEO and not in their capacity as members of the Board of Directors. 2 The base salary for the non-executive directors includes a fixed expense allowance of 5,000 euros per year. 3 The amounts stated here therefore are employer contributions to the WDP group insurance (defined contribution plan) for the year 2023, and are in addition to the variable remuneration received. 4 These additional benefits consist of e.g. a company vehicle and a smartphone, for each of which a benefit in kind is calculated. 5 This represents 60% of the total variable remuneration as foreseen over several years within the 2022-25 growth plan. Given the early realisation of the growth plan 2022-25, the long-term variable remuneration for each member of the Management Committee has been granted and equated to 125% of the long-term bonus initially provided over 4 performance years in the plan. This will be paid out for 60% in 2024 and for 40% in 2025 (the latter provided the main targets of that plan, namely EPS (1.40 euro) and net debt/EBITDA (<8), are met). Annual accounts Governance Results Performance Strategy and value creation This is WDP ESG WDP 2023 Annual Report 135
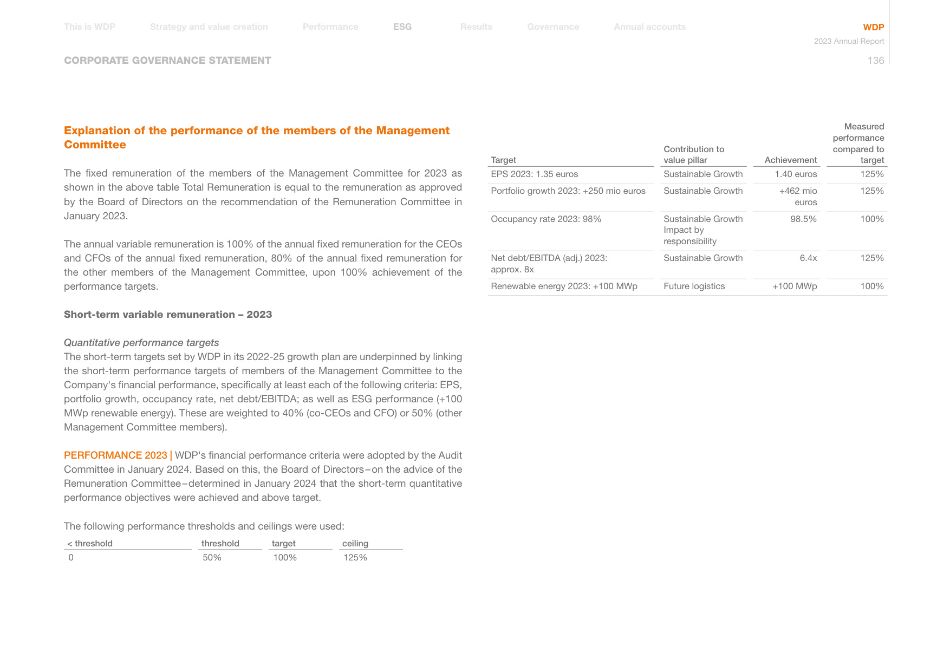
CORPORATE GOVERNANCE STATEMENT Explanation of the performance of the members of the Management Committee The fixed remuneration of the members of the Management Committee for 2023 as shown in the above table Total Remuneration is equal to the remuneration as approved by the Board of Directors on the recommendation of the Remuneration Committee in January 2023. The annual variable remuneration is 100% of the annual fixed remuneration for the CEOs and CFOs of the annual fixed remuneration, 80% of the annual fixed remuneration for the other members of the Management Committee, upon 100% achievement of the performance targets. Short-term variable remuneration – 2023 Quantitative performance targets The short-term targets set by WDP in its 2022-25 growth plan are underpinned by linking the short-term performance targets of members of the Management Committee to the Company's financial performance, specifically at least each of the following criteria: EPS, portfolio growth, occupancy rate, net debt/EBITDA; as well as ESG performance (+100 MWp renewable energy). These are weighted to 40% (co-CEOs and CFO) or 50% (other Management Committee members). PERFORMANCE 2023 | WDP's financial performance criteria were adopted by the Audit Committee in January 2024. Based on this, the Board of Directors – on the advice of the Remuneration Committee – determined in January 2024 that the short-term quantitative performance objectives were achieved and above target. The following performance thresholds and ceilings were used: < threshold threshold target ceiling 0 50% 100% 125% Target Contribution to value pillar Achievement Measured performance compared to target EPS 2023: 1.35 euros Sustainable Growth 1.40 euros 125% Portfolio growth 2023: +250 mio euros Sustainable Growth +462 mio euros 125% Occupancy rate 2023: 98% Sustainable Growth Impact by responsibility 98.5% 100% Net debt/EBITDA (adj.) 2023: approx. 8x Sustainable Growth 6.4x 125% Renewable energy 2023: +100 MWp Future logistics +100 MWp 100% Annual accounts Governance Results Performance Strategy and value creation This is WDP ESG WDP 2023 Annual Report 136
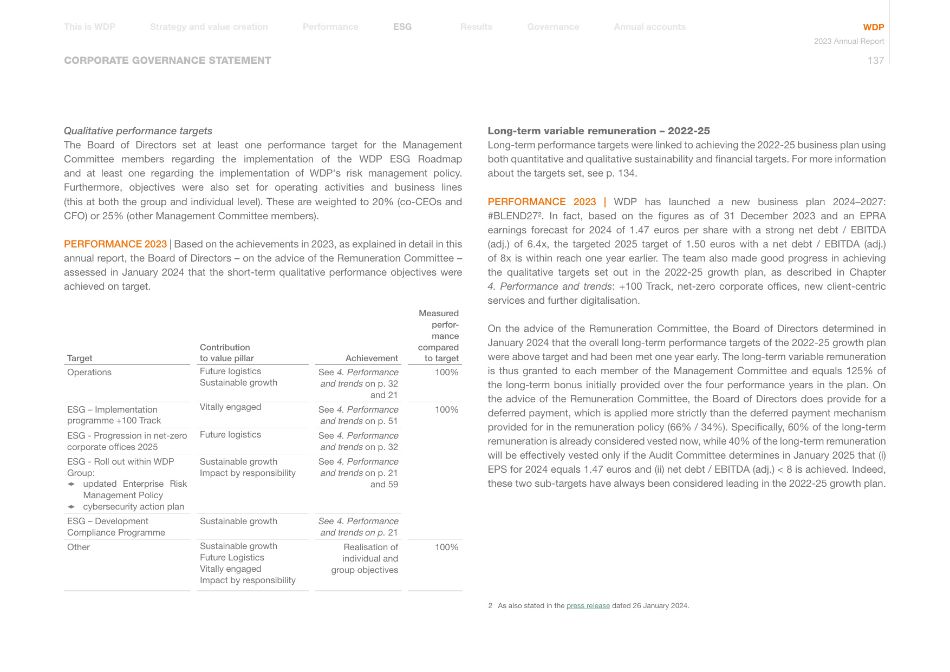
CORPORATE GOVERNANCE STATEMENT Qualitative performance targets The Board of Directors set at least one performance target for the Management Committee members regarding the implementation of the WDP ESG Roadmap and at least one regarding the implementation of WDP's risk management policy. Furthermore, objectives were also set for operating activities and business lines (this at both the group and individual level). These are weighted to 20% (co-CEOs and CFO) or 25% (other Management Committee members). PERFORMANCE 2023 | Based on the achievements in 2023, as explained in detail in this annual report, the Board of Directors – on the advice of the Remuneration Committee – assessed in January 2024 that the short-term qualitative performance objectives were achieved on target. Target Contribution to value pillar Achievement Measured perfor- mance compared to target Operations Future logistics Sustainable growth See 4. Performance and trends on p. 32 and 21 100% ESG – Implementation programme +100 Track Vitally engaged See 4. Performance and trends on p. 51 100% ESG - Progression in net-zero corporate offices 2025 Future logistics See 4. Performance and trends on p. 32 ESG - Roll out within WDP Group: 1 updated Enterprise Risk Management Policy 1 cybersecurity action plan Sustainable growth Impact by responsibility See 4. Performance and trends on p. 21 and 59 ESG – Development Compliance Programme Sustainable growth See 4. Performance and trends on p. 21 Other Sustainable growth Future Logistics Vitally engaged Impact by responsibility Realisation of individual and group objectives 100% Long-term variable remuneration – 2022-25 Long-term performance targets were linked to achieving the 2022-25 business plan using both quantitative and qualitative sustainability and financial targets. For more information about the targets set, see p. 134. PERFORMANCE 2023 | WDP has launched a new business plan 2024–2027: #BLEND272. In fact, based on the figures as of 31 December 2023 and an EPRA earnings forecast for 2024 of 1.47 euros per share with a strong net debt / EBITDA (adj.) of 6.4x, the targeted 2025 target of 1.50 euros with a net debt / EBITDA (adj.) of 8x is within reach one year earlier. The team also made good progress in achieving the qualitative targets set out in the 2022-25 growth plan, as described in Chapter 4. Performance and trends: +100 Track, net-zero corporate offices, new client-centric services and further digitalisation. On the advice of the Remuneration Committee, the Board of Directors determined in January 2024 that the overall long-term performance targets of the 2022-25 growth plan were above target and had been met one year early. The long-term variable remuneration is thus granted to each member of the Management Committee and equals 125% of the long-term bonus initially provided over the four performance years in the plan. On the advice of the Remuneration Committee, the Board of Directors does provide for a deferred payment, which is applied more strictly than the deferred payment mechanism provided for in the remuneration policy (66% / 34%). Specifically, 60% of the long-term remuneration is already considered vested now, while 40% of the long-term remuneration will be effectively vested only if the Audit Committee determines in January 2025 that (i) EPS for 2024 equals 1.47 euros and (ii) net debt / EBITDA (adj.) < 8 is achieved. Indeed, these two sub-targets have always been considered leading in the 2022-25 growth plan. 2 As also stated in the press release dated 26 January 2024. Annual accounts Governance Results Performance Strategy and value creation This is WDP ESG WDP 2023 Annual Report 137
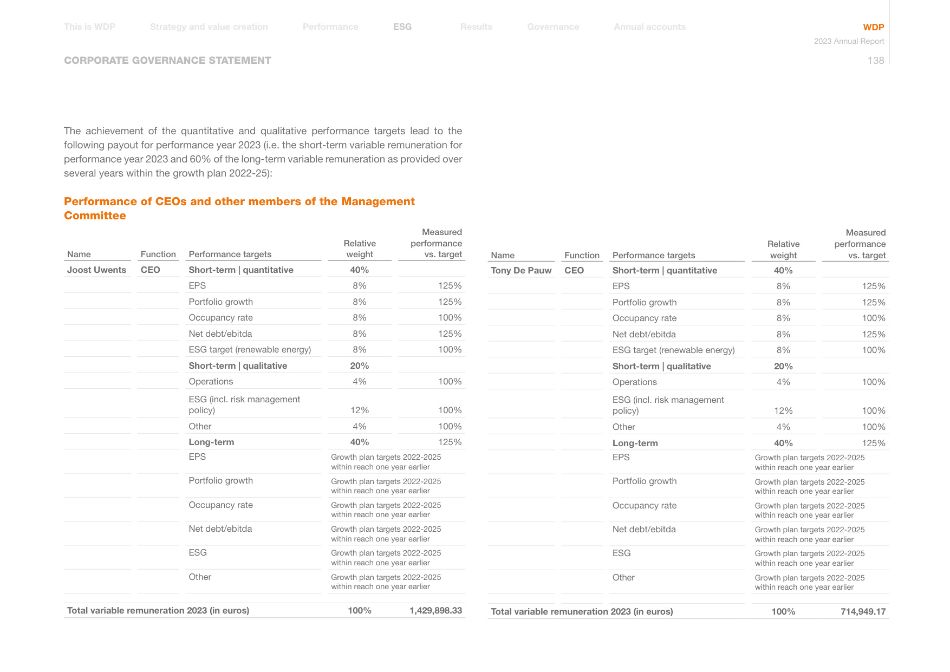
CORPORATE GOVERNANCE STATEMENT The achievement of the quantitative and qualitative performance targets lead to the following payout for performance year 2023 (i.e. the short-term variable remuneration for performance year 2023 and 60% of the long-term variable remuneration as provided over several years within the growth plan 2022-25): Performance of CEOs and other members of the Management Committee Name Function Performance targets Relative weight Measured performance vs. target Joost Uwents CEO Short-term | quantitative 40% EPS 8% 125% Portfolio growth 8% 125% Occupancy rate 8% 100% Net debt/ebitda 8% 125% ESG target (renewable energy) 8% 100% Short-term | qualitative 20% Operations 4% 100% ESG (incl. risk management policy) 12% 100% Other 4% 100% Long-term 40% 125% EPS Growth plan targets 2022-2025 within reach one year earlier Portfolio growth Growth plan targets 2022-2025 within reach one year earlier Occupancy rate Growth plan targets 2022-2025 within reach one year earlier Net debt/ebitda Growth plan targets 2022-2025 within reach one year earlier ESG Growth plan targets 2022-2025 within reach one year earlier Other Growth plan targets 2022-2025 within reach one year earlier Total variable remuneration 2023 (in euros) 100% 1,429,898.33 Name Function Performance targets Relative weight Measured performance vs. target Tony De Pauw CEO Short-term | quantitative 40% EPS 8% 125% Portfolio growth 8% 125% Occupancy rate 8% 100% Net debt/ebitda 8% 125% ESG target (renewable energy) 8% 100% Short-term | qualitative 20% Operations 4% 100% ESG (incl. risk management policy) 12% 100% Other 4% 100% Long-term 40% 125% EPS Growth plan targets 2022-2025 within reach one year earlier Portfolio growth Growth plan targets 2022-2025 within reach one year earlier Occupancy rate Growth plan targets 2022-2025 within reach one year earlier Net debt/ebitda Growth plan targets 2022-2025 within reach one year earlier ESG Growth plan targets 2022-2025 within reach one year earlier Other Growth plan targets 2022-2025 within reach one year earlier Total variable remuneration 2023 (in euros) 100% 714,949.17 Annual accounts Governance Results Performance Strategy and value creation This is WDP ESG WDP 2023 Annual Report 138
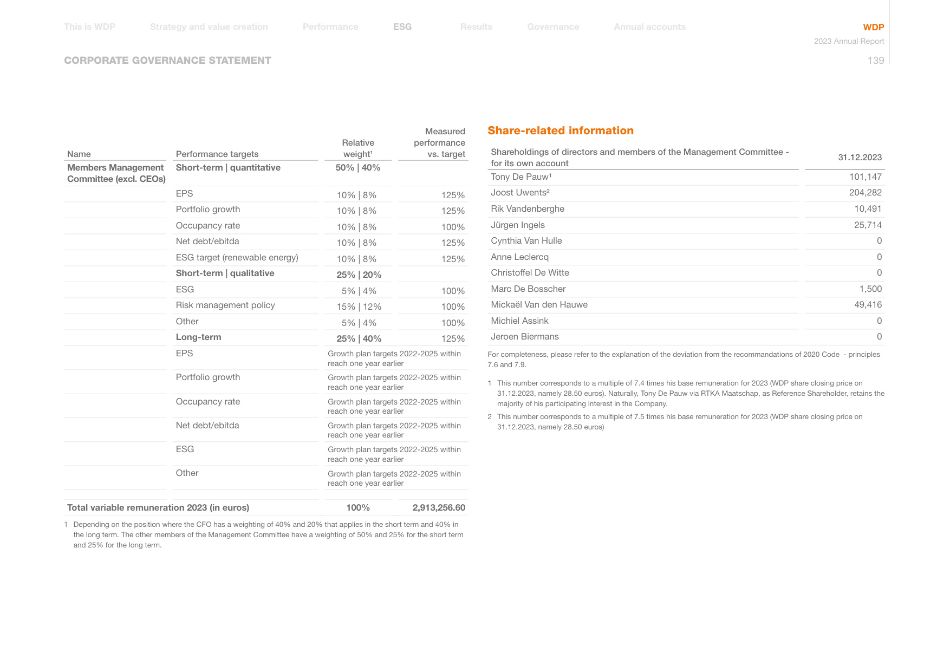
CORPORATE GOVERNANCE STATEMENT Name Performance targets Relative weight1 Measured performance vs. target Members Management Committee (excl. CEOs) Short-term | quantitative 50% | 40% EPS 10% | 8% 125% Portfolio growth 10% | 8% 125% Occupancy rate 10% | 8% 100% Net debt/ebitda 10% | 8% 125% ESG target (renewable energy) 10% | 8% 125% Short-term | qualitative 25% | 20% ESG 5% | 4% 100% Risk management policy 15% | 12% 100% Other 5% | 4% 100% Long-term 25% | 40% 125% EPS Growth plan targets 2022-2025 within reach one year earlier Portfolio growth Growth plan targets 2022-2025 within reach one year earlier Occupancy rate Growth plan targets 2022-2025 within reach one year earlier Net debt/ebitda Growth plan targets 2022-2025 within reach one year earlier ESG Growth plan targets 2022-2025 within reach one year earlier Other Growth plan targets 2022-2025 within reach one year earlier Total variable remuneration 2023 (in euros) 100% 2,913,256.60 1 Depending on the position where the CFO has a weighting of 40% and 20% that applies in the short term and 40% in the long term. The other members of the Management Committee have a weighting of 50% and 25% for the short term and 25% for the long term. Share-related information Shareholdings of directors and members of the Management Committee - for its own account 31.12.2023 Tony De Pauw¹ 101,147 Joost Uwents² 204,282 Rik Vandenberghe 10,491 Jürgen Ingels 25,714 Cynthia Van Hulle 0 Anne Leclercq 0 Christoffel De Witte 0 Marc De Bosscher 1,500 Mickaël Van den Hauwe 49,416 Michiel Assink 0 Jeroen Biermans 0 For completeness, please refer to the explanation of the deviation from the recommandations of 2020 Code - principles 7.6 and 7.9. 1 This number corresponds to a multiple of 7.4 times his base remuneration for 2023 (WDP share closing price on 31.12.2023, namely 28.50 euros). Naturally, Tony De Pauw via RTKA Maatschap, as Reference Shareholder, retains the majority of his participating interest in the Company. 2 This number corresponds to a multiple of 7.5 times his base remuneration for 2023 (WDP share closing price on 31.12.2023, namely 28.50 euros) Annual accounts Governance Results Performance Strategy and value creation This is WDP ESG WDP 2023 Annual Report 139
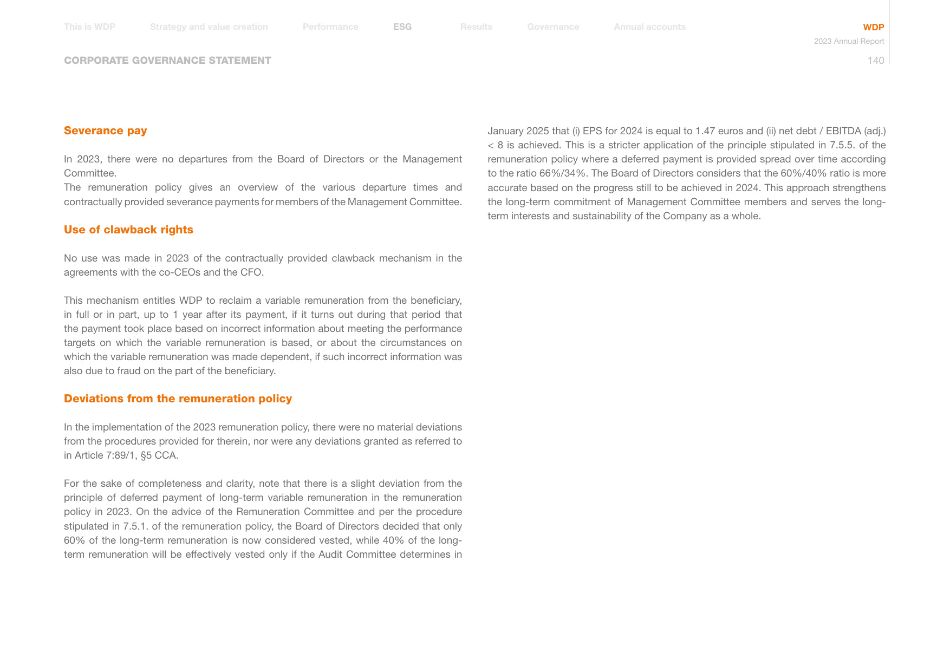
CORPORATE GOVERNANCE STATEMENT Severance pay In 2023, there were no departures from the Board of Directors or the Management Committee. The remuneration policy gives an overview of the various departure times and contractually provided severance payments for members of the Management Committee. Use of clawback rights No use was made in 2023 of the contractually provided clawback mechanism in the agreements with the co-CEOs and the CFO. This mechanism entitles WDP to reclaim a variable remuneration from the beneficiary, in full or in part, up to 1 year after its payment, if it turns out during that period that the payment took place based on incorrect information about meeting the performance targets on which the variable remuneration is based, or about the circumstances on which the variable remuneration was made dependent, if such incorrect information was also due to fraud on the part of the beneficiary. Deviations from the remuneration policy In the implementation of the 2023 remuneration policy, there were no material deviations from the procedures provided for therein, nor were any deviations granted as referred to in Article 7:89/1, §5 CCA. For the sake of completeness and clarity, note that there is a slight deviation from the principle of deferred payment of long-term variable remuneration in the remuneration policy in 2023. On the advice of the Remuneration Committee and per the procedure stipulated in 7.5.1. of the remuneration policy, the Board of Directors decided that only 60% of the long-term remuneration is now considered vested, while 40% of the long- term remuneration will be effectively vested only if the Audit Committee determines in January 2025 that (i) EPS for 2024 is equal to 1.47 euros and (ii) net debt / EBITDA (adj.) < 8 is achieved. This is a stricter application of the principle stipulated in 7.5.5. of the remuneration policy where a deferred payment is provided spread over time according to the ratio 66%/34%. The Board of Directors considers that the 60%/40% ratio is more accurate based on the progress still to be achieved in 2024. This approach strengthens the long-term commitment of Management Committee members and serves the long- term interests and sustainability of the Company as a whole. Annual accounts Governance Results Performance Strategy and value creation This is WDP ESG WDP 2023 Annual Report 140
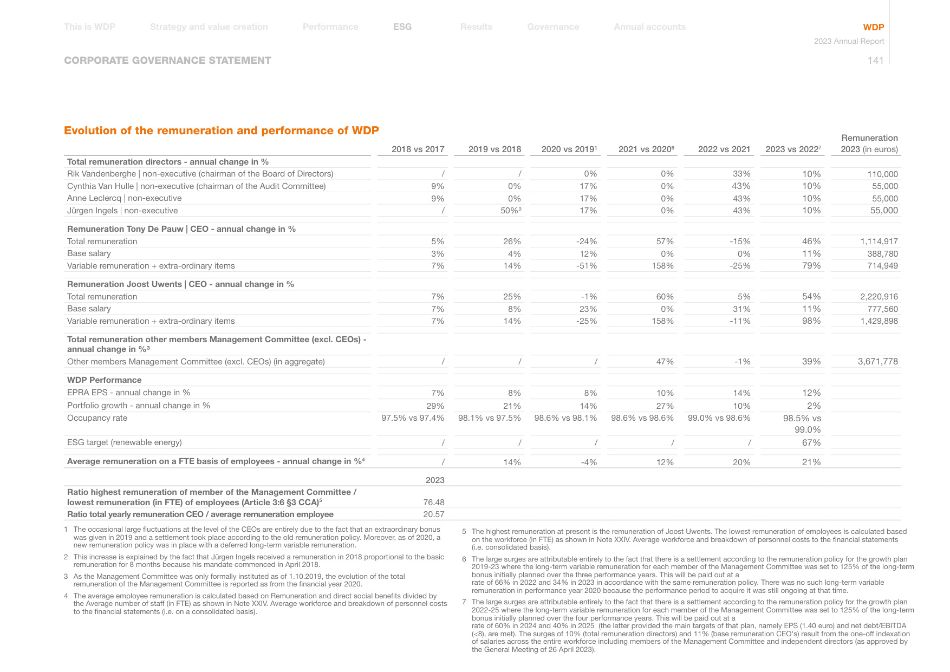
CORPORATE GOVERNANCE STATEMENT Evolution of the remuneration and performance of WDP 2018 vs 2017 2019 vs 2018 2020 vs 2019¹ 2021 vs 20206 2022 vs 2021 2023 vs 20227 Remuneration 2023 (in euros) Total remuneration directors - annual change in % Rik Vandenberghe | non-executive (chairman of the Board of Directors) / / 0% 0% 33% 10% 110,000 Cynthia Van Hulle | non-executive (chairman of the Audit Committee) 9% 0% 17% 0% 43% 10% 55,000 Anne Leclercq | non-executive 9% 0% 17% 0% 43% 10% 55,000 Jürgen Ingels | non-executive / 50%² 17% 0% 43% 10% 55,000 Remuneration Tony De Pauw | CEO - annual change in % Total remuneration 5% 26% -24% 57% -15% 46% 1,114,917 Base salary 3% 4% 12% 0% 0% 11% 388,780 Variable remuneration + extra-ordinary items 7% 14% -51% 158% -25% 79% 714,949 Remuneration Joost Uwents | CEO - annual change in % Total remuneration 7% 25% -1% 60% 5% 54% 2,220,916 Base salary 7% 8% 23% 0% 31% 11% 777,560 Variable remuneration + extra-ordinary items 7% 14% -25% 158% -11% 98% 1,429,898 Total remuneration other members Management Committee (excl. CEOs) - annual change in %³ Other members Management Committee (excl. CEOs) (in aggregate) / / / 47% -1% 39% 3,671,778 WDP Performance EPRA EPS - annual change in % 7% 8% 8% 10% 14% 12% Portfolio growth - annual change in % 29% 21% 14% 27% 10% 2% Occupancy rate 97.5% vs 97.4% 98.1% vs 97.5% 98.6% vs 98.1% 98.6% vs 98.6% 99.0% vs 98.6% 98.5% vs 99.0% ESG target (renewable energy) / / / / / 67% Average remuneration on a FTE basis of employees - annual change in %4 / 14% -4% 12% 20% 21% 2023 Ratio highest remuneration of member of the Management Committee / lowest remuneration (in FTE) of employees (Article 3:6 §3 CCA)5 76.48 Ratio total yearly remuneration CEO / average remuneration employee 20.57 1 The occasional large fluctuations at the level of the CEOs are entirely due to the fact that an extraordinary bonus was given in 2019 and a settlement took place according to the old remuneration policy. Moreover, as of 2020, a new remuneration policy was in place with a deferred long-term variable remuneration. 2 This increase is explained by the fact that Jürgen Ingels received a remuneration in 2018 proportional to the basic remuneration for 8 months because his mandate commenced in April 2018. 3 As the Management Committee was only formally instituted as of 1.10.2019, the evolution of the total remuneration of the Management Committee is reported as from the financial year 2020. 4 The average employee remuneration is calculated based on Remuneration and direct social benefits divided by the Average number of staff (in FTE) as shown in Note XXIV. Average workforce and breakdown of personnel costs to the financial statements (i.e. on a consolidated basis). 5 The highest remuneration at present is the remuneration of Joost Uwents. The lowest remuneration of employees is calculated based on the workforce (in FTE) as shown in Note XXIV. Average workforce and breakdown of personnel costs to the financial statements (i.e. consolidated basis). 6 The large surges are attributable entirely to the fact that there is a settlement according to the remuneration policy for the growth plan 2019-23 where the long-term variable remuneration for each member of the Management Committee was set to 125% of the long-term bonus initially planned over the three performance years. This will be paid out at a rate of 66% in 2022 and 34% in 2023 in accordance with the same remuneration policy. There was no such long-term variable remuneration in performance year 2020 because the performance period to acquire it was still ongoing at that time. 7 The large surges are attributable entirely to the fact that there is a settlement according to the remuneration policy for the growth plan 2022-25 where the long-term variable remuneration for each member of the Management Committee was set to 125% of the long-term bonus initially planned over the four performance years. This will be paid out at a rate of 60% in 2024 and 40% in 2025 (the latter provided the main targets of that plan, namely EPS (1.40 euro) and net debt/EBITDA (<8), are met). The surges of 10% (total remuneration directors) and 11% (base remuneration CEO's) result from the one-off indexation of salaries across the entire workforce including members of the Management Committee and independent directors (as approved by the General Meeting of 26 April 2023). Annual accounts Governance Results Performance Strategy and value creation This is WDP ESG WDP 2023 Annual Report 141
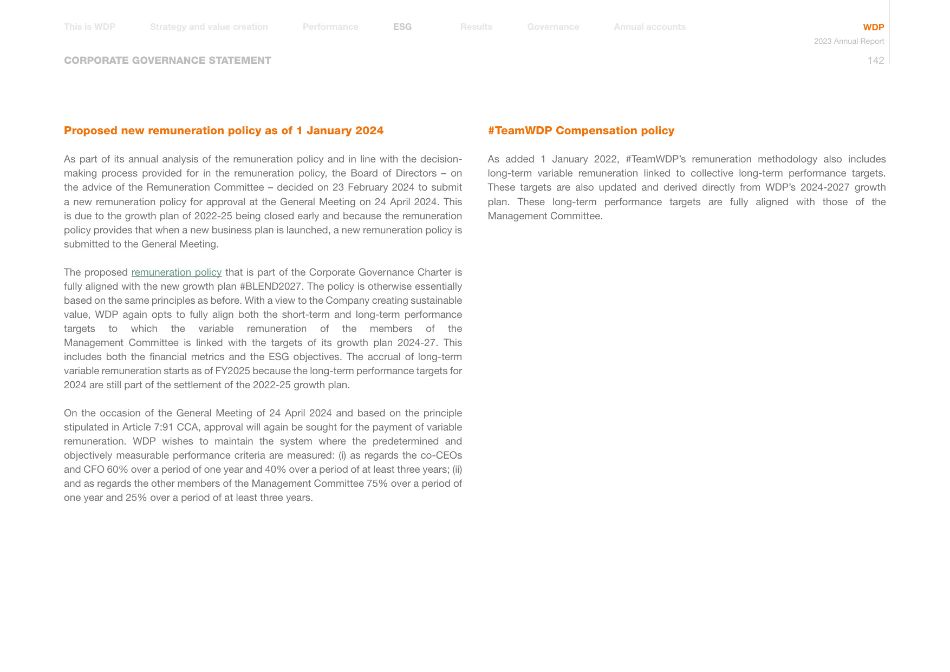
CORPORATE GOVERNANCE STATEMENT Proposed new remuneration policy as of 1 January 2024 As part of its annual analysis of the remuneration policy and in line with the decision- making process provided for in the remuneration policy, the Board of Directors – on the advice of the Remuneration Committee – decided on 23 February 2024 to submit a new remuneration policy for approval at the General Meeting on 24 April 2024. This is due to the growth plan of 2022-25 being closed early and because the remuneration policy provides that when a new business plan is launched, a new remuneration policy is submitted to the General Meeting. The proposed remuneration policy that is part of the Corporate Governance Charter is fully aligned with the new growth plan #BLEND2027. The policy is otherwise essentially based on the same principles as before. With a view to the Company creating sustainable value, WDP again opts to fully align both the short-term and long-term performance targets to which the variable remuneration of the members of the Management Committee is linked with the targets of its growth plan 2024-27. This includes both the financial metrics and the ESG objectives. The accrual of long-term variable remuneration starts as of FY2025 because the long-term performance targets for 2024 are still part of the settlement of the 2022-25 growth plan. On the occasion of the General Meeting of 24 April 2024 and based on the principle stipulated in Article 7:91 CCA, approval will again be sought for the payment of variable remuneration. WDP wishes to maintain the system where the predetermined and objectively measurable performance criteria are measured: (i) as regards the co-CEOs and CFO 60% over a period of one year and 40% over a period of at least three years; (ii) and as regards the other members of the Management Committee 75% over a period of one year and 25% over a period of at least three years. #TeamWDP Compensation policy As added 1 January 2022, #TeamWDP's remuneration methodology also includes long-term variable remuneration linked to collective long-term performance targets. These targets are also updated and derived directly from WDP's 2024-2027 growth plan. These long-term performance targets are fully aligned with those of the Management Committee. Annual accounts Governance Results Performance Strategy and value creation This is WDP ESG WDP 2023 Annual Report 142
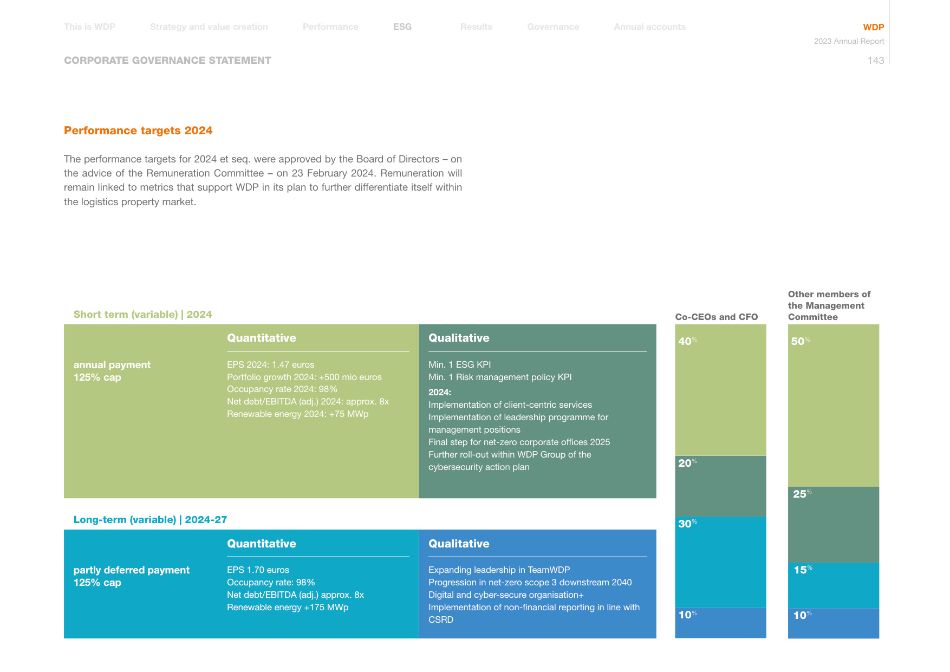
CORPORATE GOVERNANCE STATEMENT Short term (variable) | 2024 Quantitative Qualitative annual payment 125% cap EPS 2024: 1.47 euros Portfolio growth 2024: +500 mio euros Occupancy rate 2024: 98% Net debt/EBITDA (adj.) 2024: approx. 8x Renewable energy 2024: +75 MWp Min. 1 ESG KPI Min. 1 Risk management policy KPI 2024: Implementation of client-centric services Implementation of leadership programme for management positions Final step for net-zero corporate offices 2025 Further roll-out within WDP Group of the cybersecurity action plan Long-term (variable) | 2024-27 Quantitative Qualitative partly deferred payment 125% cap EPS 1.70 euros Occupancy rate: 98% Net debt/EBITDA (adj.) approx. 8x Renewable energy +175 MWp Expanding leadership in TeamWDP Progression in net-zero scope 3 downstream 2040 Digital and cyber-secure organisation+ Implementation of non-financial reporting in line with CSRD 20% 40% 30% 10% 25% 15% 10% 50% Co-CEOs and CFO Other members of the Management Committee Performance targets 2024 The performance targets for 2024 et seq. were approved by the Board of Directors – on the advice of the Remuneration Committee – on 23 February 2024. Remuneration will remain linked to metrics that support WDP in its plan to further differentiate itself within the logistics property market. Annual accounts Governance Results Performance Strategy and value creation This is WDP ESG WDP 2023 Annual Report 143
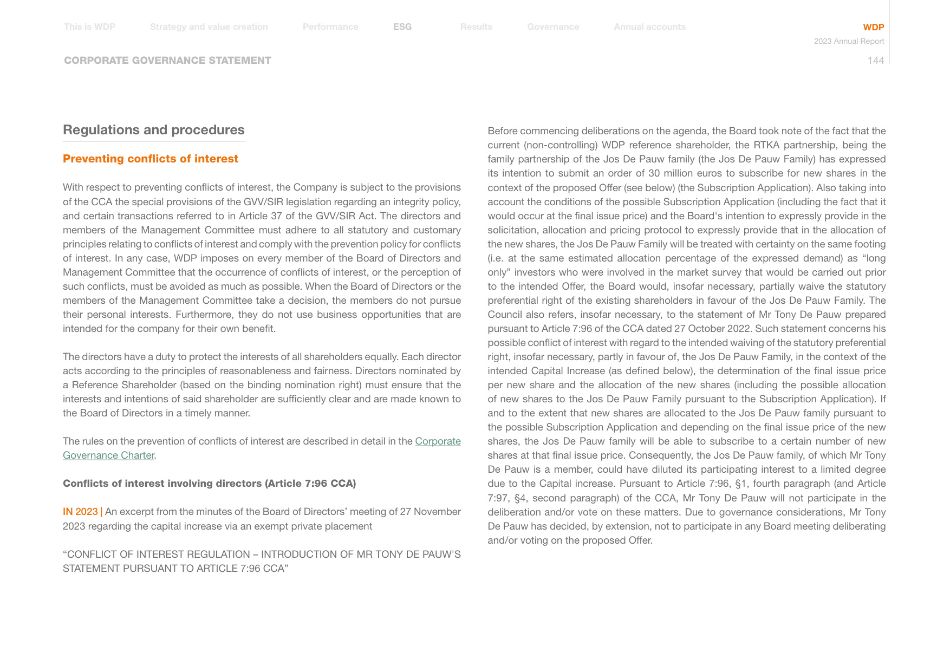
CORPORATE GOVERNANCE STATEMENT Regulations and procedures Preventing conflicts of interest With respect to preventing conflicts of interest, the Company is subject to the provisions of the CCA the special provisions of the GVV/SIR legislation regarding an integrity policy, and certain transactions referred to in Article 37 of the GVV/SIR Act. The directors and members of the Management Committee must adhere to all statutory and customary principles relating to conflicts of interest and comply with the prevention policy for conflicts of interest. In any case, WDP imposes on every member of the Board of Directors and Management Committee that the occurrence of conflicts of interest, or the perception of such conflicts, must be avoided as much as possible. When the Board of Directors or the members of the Management Committee take a decision, the members do not pursue their personal interests. Furthermore, they do not use business opportunities that are intended for the company for their own benefit. The directors have a duty to protect the interests of all shareholders equally. Each director acts according to the principles of reasonableness and fairness. Directors nominated by a Reference Shareholder (based on the binding nomination right) must ensure that the interests and intentions of said shareholder are sufficiently clear and are made known to the Board of Directors in a timely manner. The rules on the prevention of conflicts of interest are described in detail in the Corporate Governance Charter. Conflicts of interest involving directors (Article 7:96 CCA) IN 2023 | An excerpt from the minutes of the Board of Directors' meeting of 27 November 2023 regarding the capital increase via an exempt private placement "CONFLICT OF INTEREST REGULATION – INTRODUCTION OF MR TONY DE PAUW'S STATEMENT PURSUANT TO ARTICLE 7:96 CCA" Before commencing deliberations on the agenda, the Board took note of the fact that the current (non-controlling) WDP reference shareholder, the RTKA partnership, being the family partnership of the Jos De Pauw family (the Jos De Pauw Family) has expressed its intention to submit an order of 30 million euros to subscribe for new shares in the context of the proposed Offer (see below) (the Subscription Application). Also taking into account the conditions of the possible Subscription Application (including the fact that it would occur at the final issue price) and the Board's intention to expressly provide in the solicitation, allocation and pricing protocol to expressly provide that in the allocation of the new shares, the Jos De Pauw Family will be treated with certainty on the same footing (i.e. at the same estimated allocation percentage of the expressed demand) as "long only" investors who were involved in the market survey that would be carried out prior to the intended Offer, the Board would, insofar necessary, partially waive the statutory preferential right of the existing shareholders in favour of the Jos De Pauw Family. The Council also refers, insofar necessary, to the statement of Mr Tony De Pauw prepared pursuant to Article 7:96 of the CCA dated 27 October 2022. Such statement concerns his possible conflict of interest with regard to the intended waiving of the statutory preferential right, insofar necessary, partly in favour of, the Jos De Pauw Family, in the context of the intended Capital Increase (as defined below), the determination of the final issue price per new share and the allocation of the new shares (including the possible allocation of new shares to the Jos De Pauw Family pursuant to the Subscription Application). If and to the extent that new shares are allocated to the Jos De Pauw family pursuant to the possible Subscription Application and depending on the final issue price of the new shares, the Jos De Pauw family will be able to subscribe to a certain number of new shares at that final issue price. Consequently, the Jos De Pauw family, of which Mr Tony De Pauw is a member, could have diluted its participating interest to a limited degree due to the Capital increase. Pursuant to Article 7:96, §1, fourth paragraph (and Article 7:97, §4, second paragraph) of the CCA, Mr Tony De Pauw will not participate in the deliberation and/or vote on these matters. Due to governance considerations, Mr Tony De Pauw has decided, by extension, not to participate in any Board meeting deliberating and/or voting on the proposed Offer. Annual accounts Governance Results Performance Strategy and value creation This is WDP ESG WDP 2023 Annual Report 144
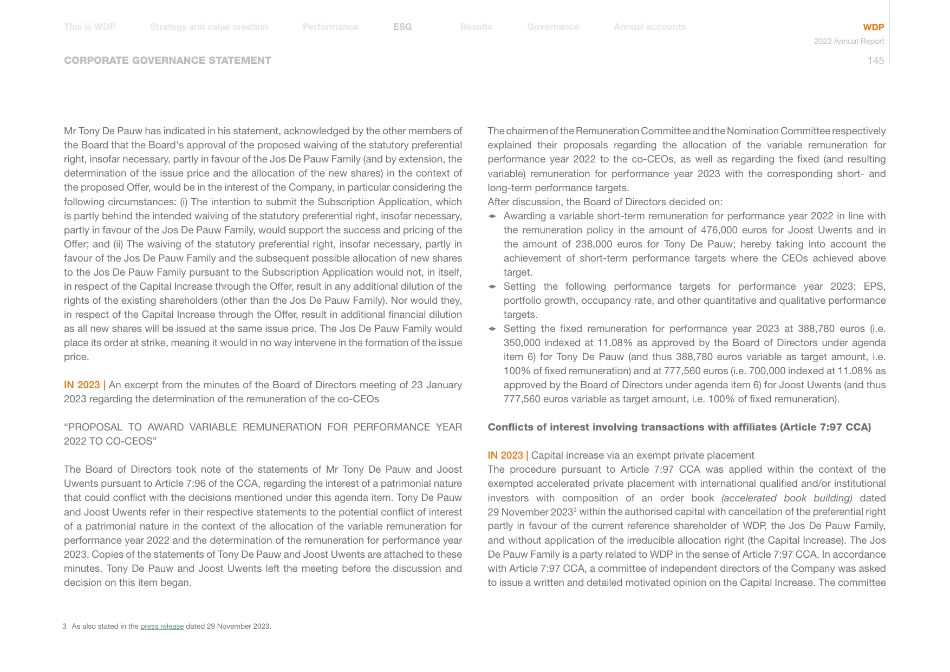
CORPORATE GOVERNANCE STATEMENT Mr Tony De Pauw has indicated in his statement, acknowledged by the other members of the Board that the Board's approval of the proposed waiving of the statutory preferential right, insofar necessary, partly in favour of the Jos De Pauw Family (and by extension, the determination of the issue price and the allocation of the new shares) in the context of the proposed Offer, would be in the interest of the Company, in particular considering the following circumstances: (i) The intention to submit the Subscription Application, which is partly behind the intended waiving of the statutory preferential right, insofar necessary, partly in favour of the Jos De Pauw Family, would support the success and pricing of the Offer; and (ii) The waiving of the statutory preferential right, insofar necessary, partly in favour of the Jos De Pauw Family and the subsequent possible allocation of new shares to the Jos De Pauw Family pursuant to the Subscription Application would not, in itself, in respect of the Capital Increase through the Offer, result in any additional dilution of the rights of the existing shareholders (other than the Jos De Pauw Family). Nor would they, in respect of the Capital Increase through the Offer, result in additional financial dilution as all new shares will be issued at the same issue price. The Jos De Pauw Family would place its order at strike, meaning it would in no way intervene in the formation of the issue price. IN 2023 | An excerpt from the minutes of the Board of Directors meeting of 23 January 2023 regarding the determination of the remuneration of the co-CEOs "PROPOSAL TO AWARD VARIABLE REMUNERATION FOR PERFORMANCE YEAR 2022 TO CO-CEOS" The Board of Directors took note of the statements of Mr Tony De Pauw and Joost Uwents pursuant to Article 7:96 of the CCA, regarding the interest of a patrimonial nature that could conflict with the decisions mentioned under this agenda item. Tony De Pauw and Joost Uwents refer in their respective statements to the potential conflict of interest of a patrimonial nature in the context of the allocation of the variable remuneration for performance year 2022 and the determination of the remuneration for performance year 2023. Copies of the statements of Tony De Pauw and Joost Uwents are attached to these minutes. Tony De Pauw and Joost Uwents left the meeting before the discussion and decision on this item began. The chairmen of the Remuneration Committee and the Nomination Committee respectively explained their proposals regarding the allocation of the variable remuneration for performance year 2022 to the co-CEOs, as well as regarding the fixed (and resulting variable) remuneration for performance year 2023 with the corresponding short- and long-term performance targets. After discussion, the Board of Directors decided on: 1 Awarding a variable short-term remuneration for performance year 2022 in line with the remuneration policy in the amount of 476,000 euros for Joost Uwents and in the amount of 238,000 euros for Tony De Pauw; hereby taking into account the achievement of short-term performance targets where the CEOs achieved above target. 1 Setting the following performance targets for performance year 2023: EPS, portfolio growth, occupancy rate, and other quantitative and qualitative performance targets. 1 Setting the fixed remuneration for performance year 2023 at 388,780 euros (i.e. 350,000 indexed at 11.08% as approved by the Board of Directors under agenda item 6) for Tony De Pauw (and thus 388,780 euros variable as target amount, i.e. 100% of fixed remuneration) and at 777,560 euros (i.e. 700,000 indexed at 11.08% as approved by the Board of Directors under agenda item 6) for Joost Uwents (and thus 777,560 euros variable as target amount, i.e. 100% of fixed remuneration). Conflicts of interest involving transactions with affiliates (Article 7:97 CCA) IN 2023 | Capital increase via an exempt private placement The procedure pursuant to Article 7:97 CCA was applied within the context of the exempted accelerated private placement with international qualified and/or institutional investors with composition of an order book (accelerated book building) dated 29 November 20233 within the authorised capital with cancellation of the preferential right partly in favour of the current reference shareholder of WDP, the Jos De Pauw Family, and without application of the irreducible allocation right (the Capital Increase). The Jos De Pauw Family is a party related to WDP in the sense of Article 7:97 CCA. In accordance with Article 7:97 CCA, a committee of independent directors of the Company was asked to issue a written and detailed motivated opinion on the Capital Increase. The committee 3 As also stated in the press release dated 29 November 2023. Annual accounts Governance Results Performance Strategy and value creation This is WDP ESG WDP 2023 Annual Report 145
CORPORATE GOVERNANCE STATEMENT Rules in the area of confidentiality The WDP Corporate Governance Charter states very clearly that the members of the Board of Directors, as well as the members of the Management Committee, must exercise the required discretion and, in cases of insider information, the required confidentiality with regard to all information and documentation obtained in the context of their role as a member of the Board of Directors and/or the Management Committee. Rules to prevent market abuse The code of conduct for financial transactions are included in a separate business code: the Dealing Code. The Dealing Code is intended to inform its readers of the regulations on market abuse and the resulting obligations on (i) WDP in its capacity as the issuer of financial instruments and (ii) everyone carrying out activities within or for the WDP Group who have access to sensitive information. With this policy, WDP strives to prevent market abuse by the persons in question. Each employee, director or member of the Management Committee who fulfils a role in or on behalf of WDP receives an explanation of this Dealing Code from the compliance officer, as part of the onboarding procedure, and is also asked to sign this Dealing Code as read and agreed. It is also the compliance officer who must ensure compliance with these rules to limit the risk of market abuse with insider information. For this purpose, the officer maintains insider lists as specified in European regulations and follows the procedures for reporting transactions by supervisors or the questions for trading during blocked or closed periods. The officer does this in consultation with the Market Disclosure Committee. The Corporate Governance Charter also provides for a reporting procedure in case someone would like to report an actual or potential breach of the Dealing Code or other regulations. IN 2023 | Application of these rules did not result in any kind of difficulties. of independent directors came to the joint conclusion that the intended Capital Increase was in the best interests of WDP and its shareholders. Functional conflicts of interest within the context of Article 37 of the GVV/SIR Act IN 2023 | Optional dividend Potential functional conflicts of interest arose, particularly in the context of the optional dividend offered on 26 April 2022 to the shareholders and under which certain directors as well as the Reference Shareholder derived some capital benefit from it, because of their capacity as shareholders of WDP. The Board of Directors approved the optional dividend, given that this transaction was in the interest of WDP (the capital increase accompanying the transaction boosted WDP shareholders' equity and, consequently, reduced its gearing ratio, which is limited by law). This transaction was also carried out under normal market conditions, with all shareholders treated equally.4 IN 2023 | Acquisition of 21% shares in Belgian joint venture Functional conflicts of interest may have arisen, in particular in the context of WDP NV's acquisition of 21% shares in WDPort of Ghent Big Box NV, as a result of which WDP NV's share in the joint venture WDPort of Ghent Big Box NV is 50%. A conflict of interest exists as Sakolaki NV – a co-shareholder in a perimeter company of WDP – is acting as counterparty in the share transfer described above. The acquisition of the shares took place on 3 August 2023 on normal market terms and in accordance with the terms and conditions set out in the joint venture agreement dated 27 November 2020. 4 As communicated in the press release dated 17 May 2023. Annual accounts Governance Results Performance Strategy and value creation This is WDP ESG WDP 2023 Annual Report 146
CORPORATE GOVERNANCE STATEMENT Ethics The WDP Employee Code of Conduct defines the expectations of staff regarding their actions for or on behalf of the company. The Code of Conduct, in conjunction with the Human rights policy and the Anti-Bribery and corruption policy, reinforces the commitment of everyone within #TeamWDP, regardless of contract type or work location, to help build a strong company culture. A culture built on mutual respect, integrity and ethics. Grievance mechanism WDP maintains a Grievance Management Procedure to properly address formal grievances raised by stakeholders about WDP, our property, our services, or any processes we use. A #SpeakUp procedure is used for people within the WDP group, including employees and members of the Board of Directors or Management Committee. Concerns can be reported here about (possible) violations of the law, ethical standards or procedures, such as the Corporate Governance Charter, the Employee Code of Conduct, the Supplier Code of Conduct, the Human Rights Policy, etc. In 2023, the Company made the necessary adjustments to these procedures to comply with the requirements of the European Whistleblowing Directive. Risk management and internal control Framework WDP organises its internal control and risk management based on the principles of the Enterprise Risk Management (ERM) model developed by COSO (Committee of Sponsoring Organisations of the Treadway Commission). This involves mapping out a control environment, conducting an analysis of the risks to which WDP is exposed, estimating their impact on WDP and determining the degree to which WDP has control over these risks and the actions the company is taking to mitigate these risks. Finally, internal control is assessed annually. Methodology When it comes to risk management, WDP applies an integrated approach based on the 'three lines of defence model'. This model determines how specific responsibilities can be assigned within WDP's organisation with a view to achieving WDP's objectives and control of the associated risks. This methodology contributes to reinforcing the risk culture, taking responsibility for managing risks and internal control and continued optimisation and integration of independent control functions (risk management, compliance, internal audit). First line – ownership and management of risks and control Business itself is responsible for all risks of its own processes and must ensure their identification and effective controls. Here, business ensures that the right controls are conducted properly, that the self-assessment by the business is qualitatively adequate, that risk awareness is sufficient, and that adequate capacity is allocated to risk matters. Risk management is an integral part of running the company. It ranges from day-to-day financial and operational management – including the four-eyes principle – analysis of new investment files and formulation of strategy and objectives, to strictly and firmly established decision-making procedures. For this reason, risk management is the responsibility of the entire WDP Group, i.e. across all layers of the organisation, with different responsibilities at each level. Second line – continuous monitoring of risks and control These functions offer support to business and management by applying expertise and formulating an opinion independently of business with regard to the risks facing WDP: risk management function, compliance function, financial control function, IT security function. These functions offer proper certainty that business itself (via first-line management) has its risks under control. The primary responsibility naturally still lies with the first line. For this, the second line functions serve to identify, measure and report risks. Annual accounts Governance Results Performance Strategy and value creation This is WDP ESG WDP 2023 Annual Report 147
CORPORATE GOVERNANCE STATEMENT Third line – provision of an independent control system The internal audit can be understood as an independent assessment function embedded in the organisation, focusing on examination and evaluation of proper functioning, effectiveness and efficiency of the processes, procedures and activities of WDP. This may involve areas such as operational matters (quality and suitability of systems and procedures, organisational structures, policy lines and methods and resources used to meet objectives), financial matters (reliability of accounting, annual accounts and the financial reporting process), the compliance with applicable accounting and other regulations, management matters (quality of the management function and staff services with respect to company objectives), as well as the compliance function and risk management function. Company organisation The Board of Directors set up an Audit Committee, Remuneration Committee, Nomination Committee and an ESG Committee. A Management Committee was also created in October 2019. WDP currently has three operational platforms: Belgium/Luxembourg/France, the Netherlands/Germany and Romania. Each platform performs the following functions: Sales & Business Development, Property Management, Contracting, Back Office. These teams can count on the support of the following services: Project Development, Finance, IT, Investor Relations, Legal, Marketing, Human Resources and Administration. This structure is explained in an organisational chart and features a clear internal segregation of duties. Notwithstanding the further professionalisation and considerable reinforcement of the teams in recent years – because of the growth of the company – the size of the team remains limited, where an overbearing structure and excessive formalism must be avoided, in view of factors such as the nature of the activities of the company. A certain degree of flexibility is still indispensable, with people on call to step in for others for specified tasks, according to the urgency of the case at hand. However, the responsibilities are strictly defined and current issues are monitored by means of ongoing daily consultations. The independent control functions, as also implemented by the GVV/SIR legislation, are fulfilled in a suitable and proportionate manner, and always in accordance with the nature, scope and complexity of WDP's activities. 1 The independent compliance function is performed by WDP General Counsel Johanna Vermeeren, appointed for an indefinite term. The compliance officer reports directly to the CEO, Joost Uwents. 1 At WDP, CFO Mickaël Van den Hauwe serves in the role of risk manager, appointed for an undetermined period. Threports directly to the Audit Committee. 1 WDP has entrusted the internal audit function to an external legal entity through the appointment of an independent consultant, namely BDO Advisory BV, permanently represented by a single natural person, Mr Christophe Quiévreux. In his role as manager bearing final responsibility for the internal audit, Rik Vandenberghe is responsible, on behalf of WDP, for supervision of the internal audit function assigned to the external internal auditor. The effective leaders (Joost Uwents, Tony De Pauw and Mickaël Van den Hauwe) are responsible for the organisation of internal control under the supervision of the Board of Directors of WDP. Organisation of internal control – Audit Committee Aside from general organisation of the internal audit structures, the Audit Committee has a special task with regard to internal audit. It supports the Board of Directors in the fulfilment of its monitoring responsibilities, ensuring control in the broadest sense, including risk control. The responsibilities, membership, powers and functioning of this Audit Committee are described in the Internal Rules of the Audit Committee, available in the Corporate Governance Charter. Annual accounts Governance Results Performance Strategy and value creation This is WDP ESG WDP 2023 Annual Report 148
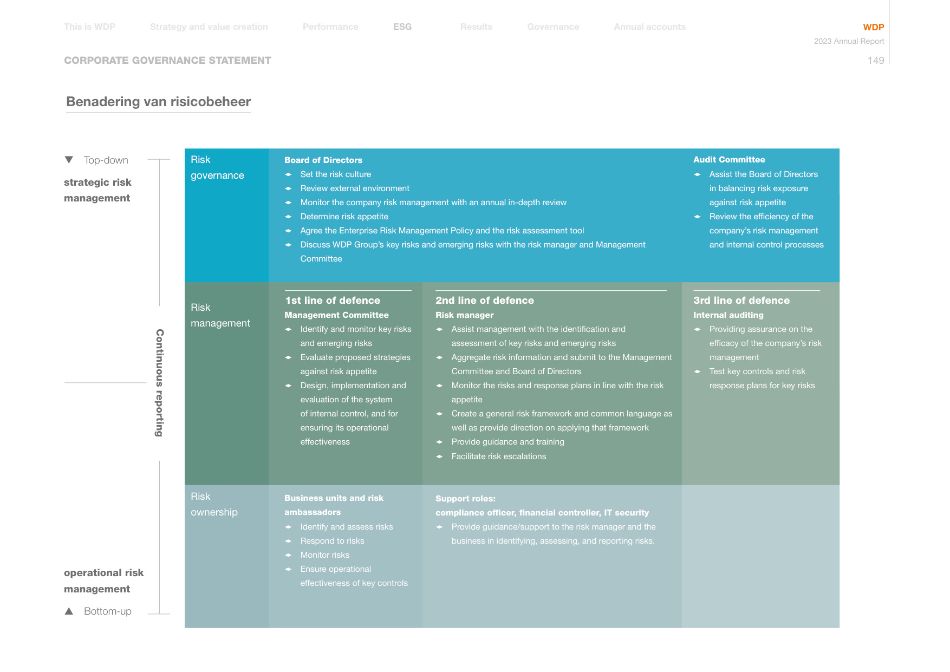
CORPORATE GOVERNANCE STATEMENT Benadering van risicobeheer Top-down strategic risk management Continuous reporting operational risk management Bottom-up Risk governance Risk management Risk ownership Business units and risk ambassadors 1 Identify and assess risks 1 Respond to risks 1 Monitor risks 1 Ensure operational effectiveness of key controls Management Committee 1 Identify and monitor key risks and emerging risks 1 Evaluate proposed strategies against risk appetite 1 Design, implementation and evaluation of the system of internal control, and for ensuring its operational effectiveness Audit Committee 1 Assist the Board of Directors in balancing risk exposure against risk appetite 1 Review the efficiency of the company's risk management and internal control processes Internal auditing 1 Providing assurance on the efficacy of the company's risk management 1 Test key controls and risk response plans for key risks Board of Directors 1 Set the risk culture 1 Review external environment 1 Monitor the company risk management with an annual in-depth review 1 Determine risk appetite 1 Agree the Enterprise Risk Management Policy and the risk assessment tool 1 Discuss WDP Group's key risks and emerging risks with the risk manager and Management Committee Support roles: compliance officer, financial controller, IT security 1 Provide guidance/support to the risk manager and the business in identifying, assessing, and reporting risks. Risk manager 1 Assist management with the identification and assessment of key risks and emerging risks 1 Aggregate risk information and submit to the Management Committee and Board of Directors 1 Monitor the risks and response plans in line with the risk appetite 1 Create a general risk framework and common language as well as provide direction on applying that framework 1 Provide guidance and training 1 Facilitate risk escalations 1st line of defence 3rd line of defence 2nd line of defence Annual accounts Governance Results Performance Strategy and value creation This is WDP ESG WDP 2023 Annual Report 149
CORPORATE GOVERNANCE STATEMENT The result of the quarterly analysis, the evaluation of the risks as well as the formulation of concrete recommendations to the other departments of WDP, is formalised in a risk dashboard under the supervision of the risk manager, which is discussed in detail in the Management Committee. Where necessary, the risk dashboard is further adjusted for subsequent submission by the risk manager to the Audit Committee and Board of Directors for pointing out the most significant risks affecting WDP's strategic goals. Taking into account the input of the risk manager, the Audit Committee and Board of Directors conduct quarterly evaluations of the risks to which WDP is exposed and take the necessary decisions based on these evaluations (such as with regard to setting the interest rate hedging strategy, evaluation of tenant risks, etc. WDP values transparency and thus communicates to its stakeholders on this topic of risk and risk management both on an ad hoc basis as through the periodic reporting in the quarterly press releases. The annual report also includes a list of specific and material risk factors with their description and an estimate of the potential impact of these risks, as well as the mitigating factors and some examples of key risk indicators. Control activities The various departments of the Company perform checks in response to the identified risks, as shown in Chapter 9. Risk factors. Operational control activities 1 Lease: constant monitoring of the lease vacancy rate, end dates of lease agreements and the risks and opportunities related to rental income, constant monitoring of the client portfolio and regular analysis of customer solvency. Monthly screening of the amounts and validity of the lease deposits of all tenants. 1 Property portfolio: maintenance of a healthy portfolio diversity in various dimensions, such as customers, building types, locations and also continuous monitoring of portfolio quality and sustainability. This is managed based on frequent internal reporting as well as collaboration with renowned construction partners, architects and engineering firms. Enterprise Risk Management WDP is convinced that risk management should be an integral part of the company culture to foster an environment in which people are motivated to identify and address risks and ensure the necessary transparency with regard to any possible risks. To this end, WDP has drawn up and implemented a risk management policy that applies equally and fully to its entire operations (i.e. across all WDP entities, geographies, operations, etc.). A detailed explanation is given in the WDP Enterprise Risk Management Policy. Risk identification | risk evaluation | risk management | risk monitoring | risk reporting Every quarter, the CFO, acting as the risk manager, conducts an analysis and evaluation of the risks that the company may face across departments and different countries with attention to the potential negative impact, the expected value in terms of the realisation of the risk, as well as the degree of control of the risk. This analysis is done in collaboration with the compliance officer and the different risk ambassadors across the business, supported where necessary by specialised (external) advisors. WDP uses a risk assessment tool to ensure risks are evaluated consistently. Within this context, a scenario analysis is also drawn up based on the expected value of each scenario and the possibilities to avoid or remediate a risk, insofar as this can be influenced. Based on the above evaluation, the implementation of risk management can be done through different methods: prevent, mitigate, share, preserve. Risk monitoring is embedded in the process of enterprise risk management and the responsibility for monitoring is at the different levels of the organisation: #TeamWDP, the Management Committee, the Board of Directors. Annual accounts Governance Results Performance Strategy and value creation This is WDP ESG WDP 2023 Annual Report 150
CORPORATE GOVERNANCE STATEMENT 1 For each commitment of the company towards third parties, the double signature principle (the four-eyes principle) is applied within the limits of the delegation of powers, for the purchase of property, leases, all types of orders and approval of invoices and payments. 1 Operational processes, both for the existing portfolio and for new investments, are based on workflows that are harmonised within the WDP Group and are audited regularly. Financial control activities 1 Budget: conducting an extensive quarterly variation analysis (actual versus the preceding period) and updating of this by the Audit Committee and Board of Directors. 1 Purchasing policy: all orders must be preceded by a purchase order and must then be approved by validation of the invoice via a digital approval flow with audit log and application of the four-eyes principle. 1 ERP package: WDP uses SAP Real Estate for accounting, controlling and reporting. SAP contains all accounting and financial aspects and all aspects related to WDP property activities (such as follow-up on lease agreements, settlement of charges, orders, purchases, budget follow-up for new construction projects, etc.). 1 Financing cost: follow-up on the sensitivity of the cost of debts associated with the interest rates based on internal models and using software. Financial reporting control activities The process for preparing the financial information is structured based on predefined tasks to perform and respective schedules. WDP uses a detailed checklist of all tasks and sub-tasks to perform for closure of the annual, semi-annual and quarterly accounts of WDP (individually for each entity and consolidated for the Group). Each task is assigned to a manager in the finance department and a mandatory timeframe. Based on this checklist, everyone at the finance department knows what tasks to perform and by when. This checklist is built around the following dimensions: 1 the types of activity are divided up as follows: pre-closing, closing, consolidation, internal and external reporting and audit; 1 subsequently, for the actual closing and consolidation process, a specific task is linked to each account of the balance sheet and earnings statement, with a SAP transaction code and a description; 1 wherever possible, the tasks are deduplicated and linked to specific deadlines with a responsible person (as well as a backup) in the Finance Department for each task. Moreover, every attempt is made to move tasks forward wherever possible, i.e. before the actual balance sheet date, to guarantee process speed and especially process quality; 1 the above is also linked to standardised templates that serve for control and as a basis for the audit files. 1 WDP and its subsidiaries follow the above procedure. For efficient performance of the audit process, before the balance sheet date a pre-audit meeting is always held with the statutory auditor, with discussion of all significant trends and special points needing attention over the past period. Once all accounting tasks are complete and have been processed in the consolidation and reporting set, the figures are checked by the CFO. This control mainly consists of: 1 a variance analysis between the actual and budgeted figures (the budgeted figures are prepared once a year and updated quarterly 1 based on a forecast);a variance analysis between the actual and historical figures, and 1 an ad hoc analysis of all material amounts and entries. Once these checks are complete, the figures are submitted to the CEOs of WDP and adopted in mutual consultation with the CFO. The quarterly, semi-annual and annual reports, including corresponding press releases, are submitted to and analysed by the Audit Committee and Board of Directors, which approve them for publication. Annual accounts Governance Results Performance Strategy and value creation This is WDP ESG WDP 2023 Annual Report 151
CORPORATE GOVERNANCE STATEMENT The financial reporting is drawn up in accordance with the IFRS (International Financial Reporting Standards) as adopted in the European Union and with the legal and administrative regulations applicable in Belgium. These standards include all new and revised standards and interpretations published by the International Accounting Standards Board (IASB) and the International Financial Reporting Interpretations Committee (IFRIC). Regular discussions are scheduled with the statutory auditor and the required training is arranged for the responsible persons in the organisation in order to meet the accounting standards in their latest versions. The statutory auditor audits the annual accounts (full scope) and semi-annual figures (limited scope). The statutory auditor does not audit quarterly figures. Stakeholders in the evaluation of internal control Over the course of the financial year, the quality of the internal control is assessed by: 1 the statutory auditor: on the one hand within the framework of the audit of the semi- annual and annual accounts, and, on the other hand, within the framework of the annual review of underlying processes and procedures. Furthermore, we refer to the statutory auditor's report (see Chapter 12. Annexes on p. 272). The internal control systems for the key audit matters, i.e. the valuation of the property investments, have been analysed. Based on the recommendations of the statutory auditor, the process is adjusted as needed; 1 the Audit Committee: as indicated above, the Audit Committee performs a special task with regard to internal control and risk management for WDP. The Board of Directors supervises the performance of the tasks of the Audit Committee, using tools such as reports from the Audit Committee to the complete Board of Directors, and 1 internal audit: the company has hired an external internal auditor as a third-line function in the internal audit structure. All critical business processes are audited as part of a three-year cycle. In addition, the compliance function, the risk management function and at least one additional specific process are subject to an annual internal audit. In 2023, an internal audit was carried out on the processes and internal controls related to the HR process. Information as per Article 34 of the Belgian Royal Decree of 14 November 2007 In accordance with Article 34 of the Belgian Royal Decree of 14 November 2007 on obligations on issuers of financial instruments admitted for trading on a regulated market, WDP gives a summary and, if applicable, explanation of the following items, to the extent that these items, due to their nature, will have an impact in cases of a public acquisition bid. The capital structure As of 31 December 2023, the capital of WDP comes to 251,407,552.69 euros, represented by 219,433,809 ordinary shares, each representing 1/219,433,809th of the capital. All shares are fully paid up and are either registered or dematerialised. None of these shares provides special voting or other rights. Each share confers the right to one vote at the General Meeting. Share transfer provisions under the law, the Articles of Association or by convention The transfer of shares in WDP is not subject to any provisions under the law or the Articles of Association. All WDP shares are listed on Euronext Brussels and Amsterdam. Special rights of control Special rights of control are not granted to any (categories of) shareholders. Mechanism for auditing a share scheme for employees when rights of control are not exercised directly by employees WDP does not have a share scheme for employees. Annual accounts Governance Results Performance Strategy and value creation This is WDP ESG WDP 2023 Annual Report 152
CORPORATE GOVERNANCE STATEMENT Voting restrictions under the law or the Articles of Association The law and the Articles of Association do not set any restrictions on voting rights. Shareholder agreements known to WDP that may give rise to restrictions on share transfers and/or voting rights As far as WDP is aware, no shareholder agreements exist which could result in restrictions on share transfers or voting rights. Rules for appointment and replacement of members of the management body and for the amendment of the Articles of Association of WDP For rules on appointment and replacement of members of the Board of Directors, please refer to the explanatory note in Chapter 8. Corporate Governance Statement, as well as to Article 14 of the Articles of Association of the company, which states that directors are appointed by the General Meeting for a period of four years in principle and that the General Meeting may remove them at any time. Where applicable, the binding nomination right of the Reference Shareholder(s) must be applied in the nomination, as per Article 15 of the Articles of Association. With regard to the amendment of the Articles of Association of the company, please refer to the GVV/SIR legislation, which provides that any draft amendment of the Articles of Association must be submitted to the FSMA for approval in advance. Moreover, Article 31 of the Articles of Association and the provisions of the Code of Companies and Associations apply. The powers of the management body, particularly with regard to the option to issue or purchase shares In accordance with Article 8 of the Articles of Association of the Company, the Board of Directors is authorised, within the constraints of the mandatory provisions contained in the applicable company law, to increase the share capital on the dates and subject to the conditions that it specifies, in one or more increments, up to a maximum amount of: 1 I. 116,851,191.00 euros, if the capital increase to be realised is a capital increase by cash with the possibility for the shareholders of the company to exercise their preferential right or the irreducible allocation right (as referred to in the GVV/SIR legislation); and 1 II. 116,851,191.00 euros if this capital increase is performed in the context of paying an optional dividend; and 1 III. 23,370,238.20 euros, if the capital increase to be realised (a) is a capital increase via a contribution in kind, or (b) a capital increase in cash without the possibility for the Company's shareholders to exercise the preferential right or the irreducible allocation right (as referred to in the GVV/SIR legislation), or (c) any other form of capital increase; with the proviso that the capital under this authorisation may not be increased by an amount higher than the amount of the capital on the date of the Extraordinary General Meeting which approves the authorisation, being 2 February 2023. This authorisation is renewable. Up to the date of this annual report, the Board of Directors has used the authorisation granted to it three times to increase the capital, and thus the available balance of the authorised capital still amounts to: 1 I. 116,851,191.00 euros, if the capital increase to be realised is a capital increase in cash with the option of the company's shareholders to exercise their preferential right or irreducible allocation right (as referred to in the GVV/SIR legislation); 1 II. 113,256,292.67 euros if this capital increase is performed in the context of paying an optional dividend; 1 III. 9,259,965.84 euros if this capital increase is (a) performed by a contribution in kind or (b) performed by a contribution in cash without the option for company shareholders to exercise their statutory preferential rights or irreducible allocation rights (as referred to in the GVV/SIR legislation) or (c) any other form of a capital increase; with the understanding that in the context of the authorised capital, for the five- year authorisation period, the capital can never be increased beyond an amount of 233,702,382.00 euros. Annual accounts Governance Results Performance Strategy and value creation This is WDP ESG WDP 2023 Annual Report 153
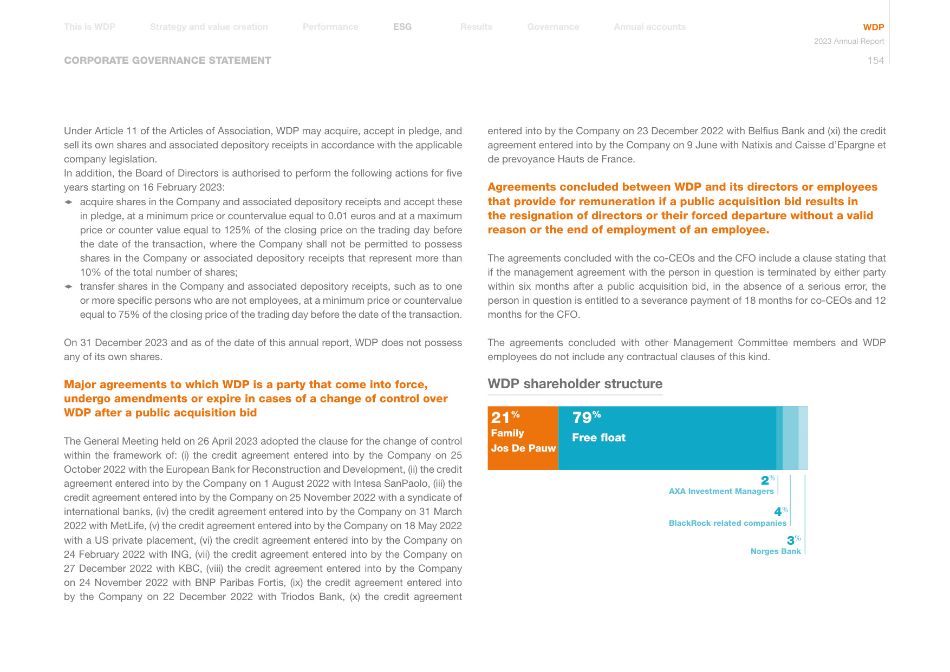
CORPORATE GOVERNANCE STATEMENT Under Article 11 of the Articles of Association, WDP may acquire, accept in pledge, and sell its own shares and associated depository receipts in accordance with the applicable company legislation. In addition, the Board of Directors is authorised to perform the following actions for five years starting on 16 February 2023: 1 acquire shares in the Company and associated depository receipts and accept these in pledge, at a minimum price or countervalue equal to 0.01 euros and at a maximum price or counter value equal to 125% of the closing price on the trading day before the date of the transaction, where the Company shall not be permitted to possess shares in the Company or associated depository receipts that represent more than 10% of the total number of shares; 1 transfer shares in the Company and associated depository receipts, such as to one or more specific persons who are not employees, at a minimum price or countervalue equal to 75% of the closing price of the trading day before the date of the transaction. On 31 December 2023 and as of the date of this annual report, WDP does not possess any of its own shares. Major agreements to which WDP is a party that come into force, undergo amendments or expire in cases of a change of control over WDP after a public acquisition bid The General Meeting held on 26 April 2023 adopted the clause for the change of control within the framework of: (i) the credit agreement entered into by the Company on 25 October 2022 with the European Bank for Reconstruction and Development, (ii) the credit agreement entered into by the Company on 1 August 2022 with Intesa SanPaolo, (iii) the credit agreement entered into by the Company on 25 November 2022 with a syndicate of international banks, (iv) the credit agreement entered into by the Company on 31 March 2022 with MetLife, (v) the credit agreement entered into by the Company on 18 May 2022 with a US private placement, (vi) the credit agreement entered into by the Company on 24 February 2022 with ING, (vii) the credit agreement entered into by the Company on 27 December 2022 with KBC, (viii) the credit agreement entered into by the Company on 24 November 2022 with BNP Paribas Fortis, (ix) the credit agreement entered into by the Company on 22 December 2022 with Triodos Bank, (x) the credit agreement entered into by the Company on 23 December 2022 with Belfius Bank and (xi) the credit agreement entered into by the Company on 9 June with Natixis and Caisse d'Epargne et de prevoyance Hauts de France. Agreements concluded between WDP and its directors or employees that provide for remuneration if a public acquisition bid results in the resignation of directors or their forced departure without a valid reason or the end of employment of an employee. The agreements concluded with the co-CEOs and the CFO include a clause stating that if the management agreement with the person in question is terminated by either party within six months after a public acquisition bid, in the absence of a serious error, the person in question is entitled to a severance payment of 18 months for co-CEOs and 12 months for the CFO. The agreements concluded with other Management Committee members and WDP employees do not include any contractual clauses of this kind. WDP shareholder structure 79% 21% 2% AXA Investment Managers 4% BlackRock related companies 3% Norges Bank Family Jos De Pauw Free float Annual accounts Governance Results Performance Strategy and value creation This is WDP ESG WDP 2023 Annual Report 154
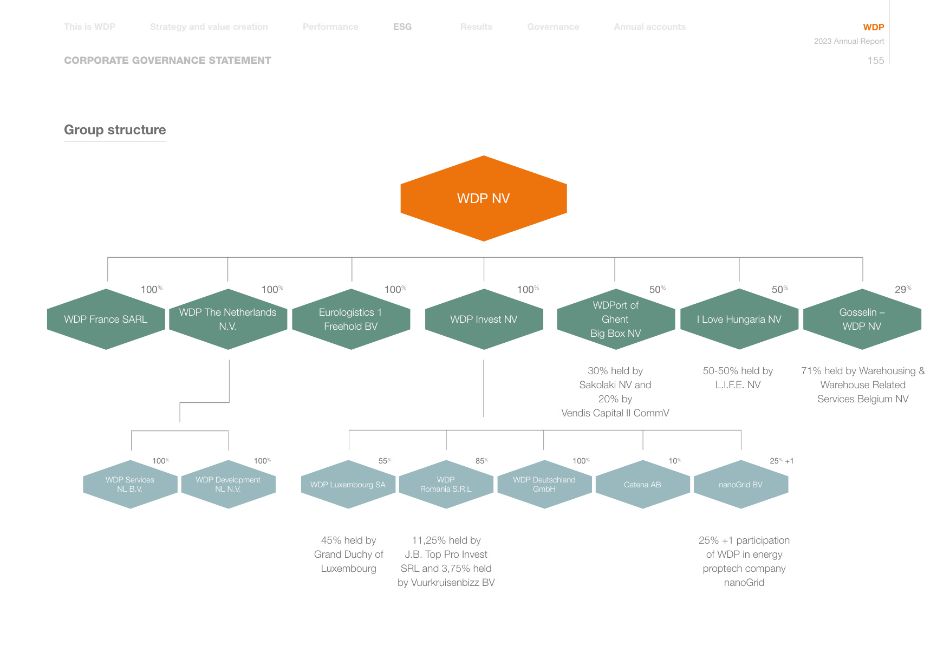
CORPORATE GOVERNANCE STATEMENT WDP NV WDP Romania S.R.L WDP Deutschland GmbH WDP Luxembourg SA WDP Development NL N.V. WDP France SARL 100% WDP The Netherlands N.V. 100% WDP Invest NV 100% 45% held by Grand Duchy of Luxembourg 11,25% held by J.B. Top Pro Invest SRL and 3,75% held by Vuurkruisenbizz BV 50-50% held by L.I.F.E. NV 71% held by Warehousing & Warehouse Related Services Belgium NV WDPort of Ghent Big Box NV 50% Gosselin – WDP NV 29% Catena AB 30% held by Sakolaki NV and 20% by Vendis Capital II CommV 50% 25% +1 participation of WDP in energy proptech company nanoGrid nanoGrid BV Eurologistics 1 Freehold BV 100% Group structure 100% 55% 85% 100% 10% 25% +1 I Love Hungaria NV WDP Services NL B.V. 100% Annual accounts Governance Results Performance Strategy and value creation This is WDP ESG WDP 2023 Annual Report 155
09 RISK FACTORS
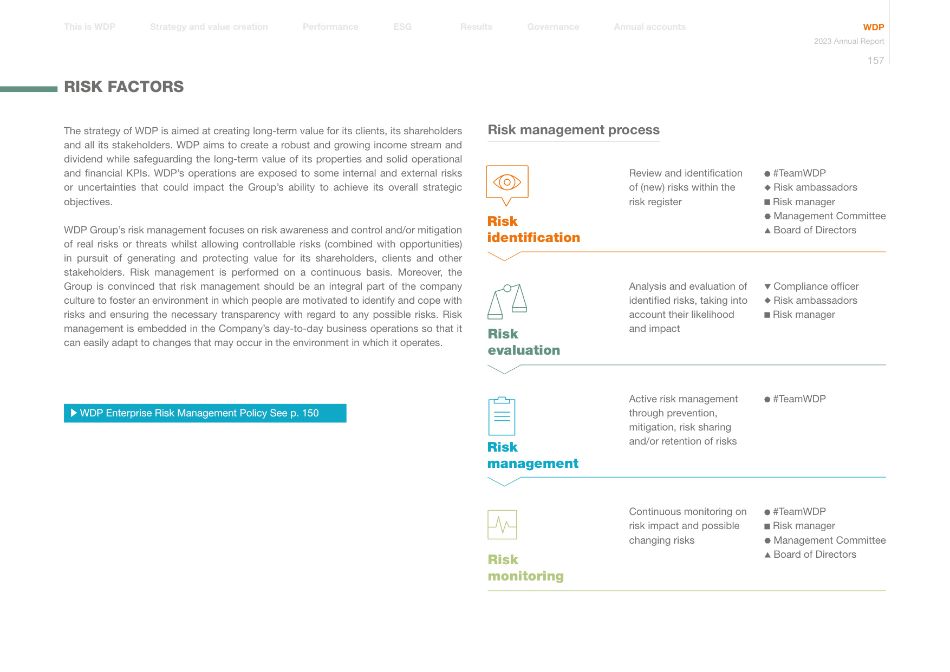
The strategy of WDP is aimed at creating long-term value for its clients, its shareholders and all its stakeholders. WDP aims to create a robust and growing income stream and dividend while safeguarding the long-term value of its properties and solid operational and financial KPIs. WDP's operations are exposed to some internal and external risks or uncertainties that could impact the Group's ability to achieve its overall strategic objectives. WDP Group's risk management focuses on risk awareness and control and/or mitigation of real risks or threats whilst allowing controllable risks (combined with opportunities) in pursuit of generating and protecting value for its shareholders, clients and other stakeholders. Risk management is performed on a continuous basis. Moreover, the Group is convinced that risk management should be an integral part of the company culture to foster an environment in which people are motivated to identify and cope with risks and ensuring the necessary transparency with regard to any possible risks. Risk management is embedded in the Company's day-to-day business operations so that it can easily adapt to changes that may occur in the environment in which it operates. Risk monitoring Continuous monitoring on risk impact and possible changing risks #TeamWDP Risk manager Management Committee Board of Directors Risk management Active risk management through prevention, mitigation, risk sharing and/or retention of risks #TeamWDP Risk management process Risk evaluation Analysis and evaluation of identified risks, taking into account their likelihood and impact Compliance officer Risk ambassadors Risk manager Risk identification Review and identification of (new) risks within the risk register #TeamWDP Risk ambassadors Risk manager Management Committee Board of Directors WDP Enterprise Risk Management Policy See p. 150 RISK FACTORS Annual accounts Governance Results Performance Strategy and value creation This is WDP ESG WDP 2023 Annual Report 157
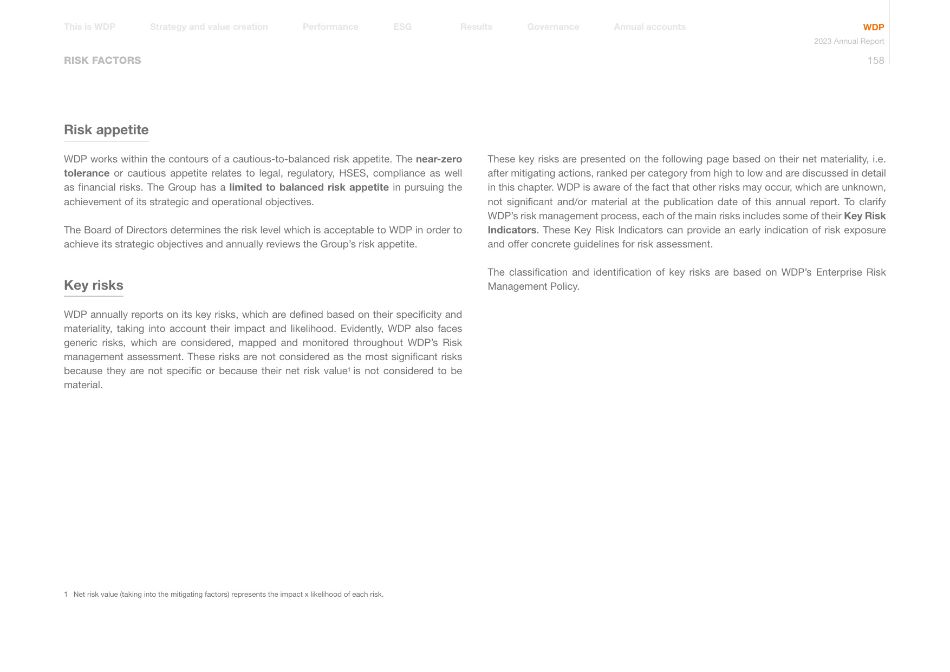
RISK FACTORS Risk appetite WDP works within the contours of a cautious-to-balanced risk appetite. The near-zero tolerance or cautious appetite relates to legal, regulatory, HSES, compliance as well as financial risks. The Group has a limited to balanced risk appetite in pursuing the achievement of its strategic and operational objectives. The Board of Directors determines the risk level which is acceptable to WDP in order to achieve its strategic objectives and annually reviews the Group's risk appetite. Key risks WDP annually reports on its key risks, which are defined based on their specificity and materiality, taking into account their impact and likelihood. Evidently, WDP also faces generic risks, which are considered, mapped and monitored throughout WDP's Risk management assessment. These risks are not considered as the most significant risks because they are not specific or because their net risk value1 is not considered to be material. These key risks are presented on the following page based on their net materiality, i.e. after mitigating actions, ranked per category from high to low and are discussed in detail in this chapter. WDP is aware of the fact that other risks may occur, which are unknown, not significant and/or material at the publication date of this annual report. To clarify WDP's risk management process, each of the main risks includes some of their Key Risk Indicators. These Key Risk Indicators can provide an early indication of risk exposure and offer concrete guidelines for risk assessment. The classification and identification of key risks are based on WDP's Enterprise Risk Management Policy. 1 Net risk value (taking into the mitigating factors) represents the impact x likelihood of each risk. Annual accounts Governance Results Performance Strategy and value creation This is WDP ESG WDP 2023 Annual Report 158
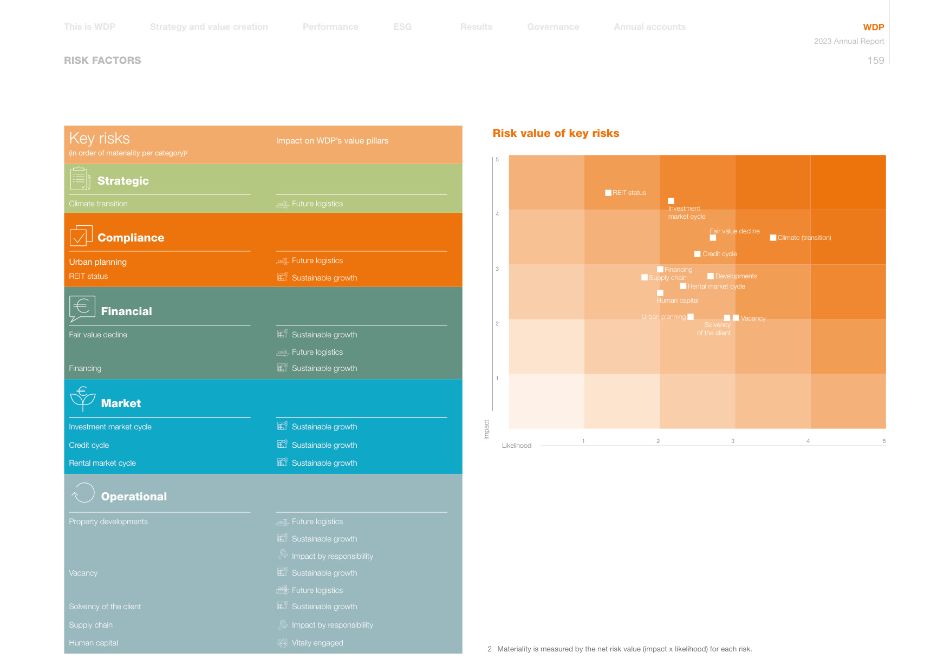
RISK FACTORS Risk value of key risks Likelihood Impact Key risks (in order of materiality per category)2 Impact on WDP's value pillars Strategic Climate transition Future logistics Compliance Urban planning REIT status Future logistics Sustainable growth Financial Fair value decline Sustainable growth Future logistics Financing Sustainable growth Market Investment market cycle Sustainable growth Credit cycle Sustainable growth Rental market cycle Sustainable growth Operational Property developments Future logistics Sustainable growth Impact by responsiblility Vacancy Sustainable growth Future logistics Solvency of the client Sustainable growth Supply chain Impact by responsiblility Human capital Vitally engaged 2 Materiality is measured by the net risk value (impact x likelihood) for each risk. 1 2 3 4 5 1 2 3 4 5 REIT-status Climate (transition) Fair value decline Investment market cycle Rental market cycle Vacancy Financing Solvency of the client Developments Credit cycle Urban planning Human capital Supply chain Annual accounts Governance Results Performance Strategy and value creation This is WDP ESG WDP 2023 Annual Report 159
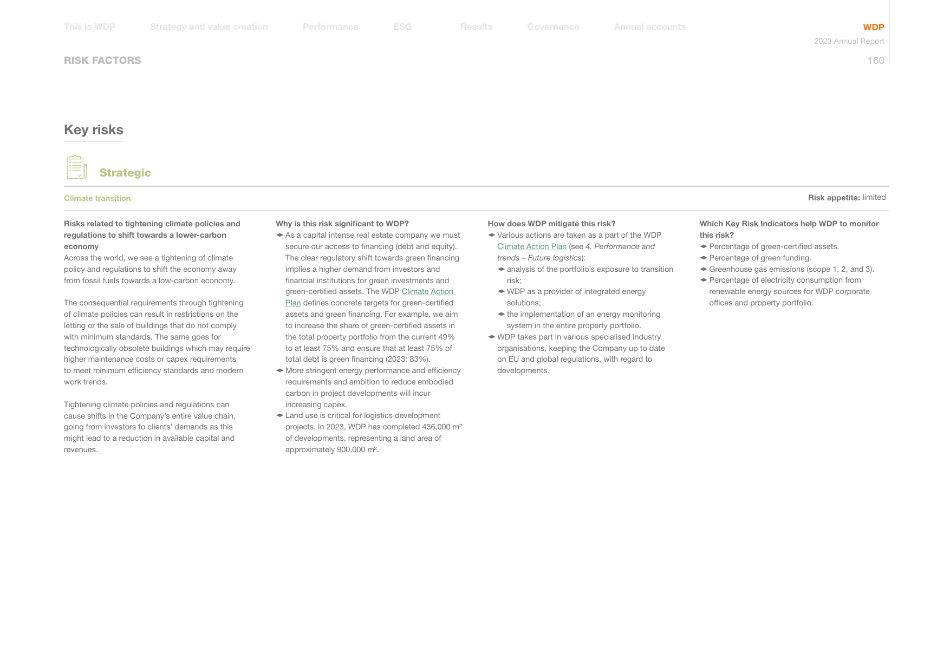
RISK FACTORS Key risks Strategic Climate transition Risk appetite: limited Risks related to tightening climate policies and regulations to shift towards a lower-carbon economy Across the world, we see a tightening of climate policy and regulations to shift the economy away from fossil fuels towards a low-carbon economy. The consequential requirements through tightening of climate policies can result in restrictions on the letting or the sale of buildings that do not comply with minimum standards. The same goes for technologically obsolete buildings which may require higher maintenance costs or capex requirements to meet minimum efficiency standards and modern work trends. Tightening climate policies and regulations can cause shifts in the Company's entire value chain, going from investors to clients' demands as this might lead to a reduction in available capital and revenues. Why is this risk significant to WDP? 1 As a capital intense real estate company we must secure our access to financing (debt and equity). The clear regulatory shift towards green financing implies a higher demand from investors and financial institutions for green investments and green-certified assets. The WDP Climate Action Plan defines concrete targets for green-certified assets and green financing. For example, we aim to increase the share of green-certified assets in the total property portfolio from the current 49% to at least 75% and ensure that at least 75% of total debt is green financing (2023: 83%). 1 More stringent energy performance and efficiency requirements and ambition to reduce embodied carbon in project developments will incur increasing capex. 1 Land use is critical for logistics development projects. In 2023, WDP has completed 436,000 m² of developments, representing a land area of approximately 900,000 m². How does WDP mitigate this risk? 1 Various actions are taken as a part of the WDP Climate Action Plan (see 4. Performance and trends – Future logistics): 1 analysis of the portfolio's exposure to transition risk; 1 WDP as a provider of integrated energy solutions; 1 the implementation of an energy monitoring system in the entire property portfolio. 1 WDP takes part in various specialised industry organisations, keeping the Company up to date on EU and global regulations, with regard to developments. Which Key Risk Indicators help WDP to monitor this risk? 1 Percentage of green-certified assets. 1 Percentage of green funding. 1 Greenhouse gas emissions (scope 1, 2, and 3). 1 Percentage of electricity consumption from renewable energy sources for WDP corporate offices and property portfolio. Annual accounts Governance Results Performance Strategy and value creation This is WDP ESG WDP 2023 Annual Report 160
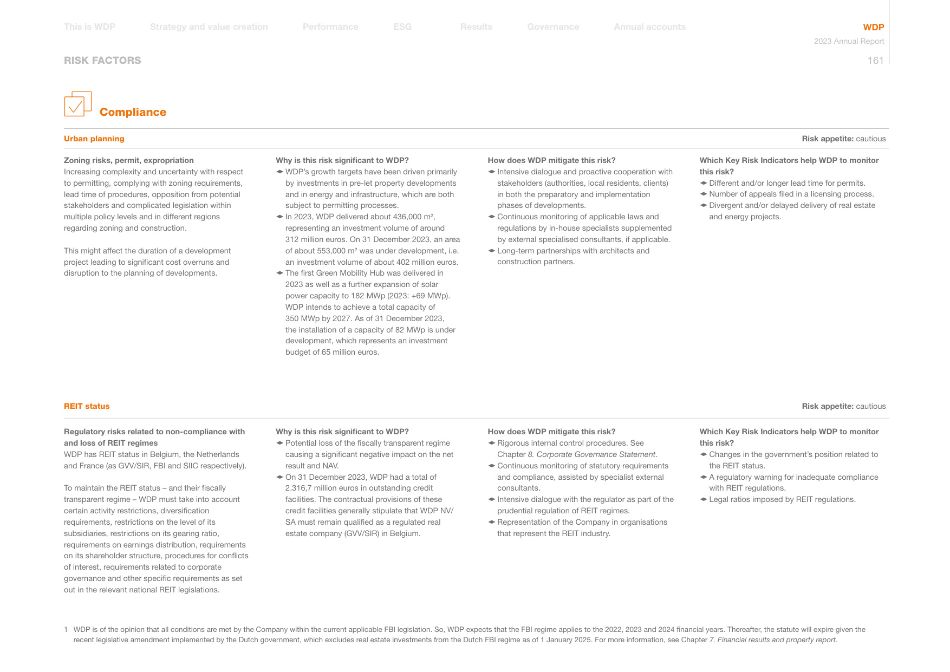
RISK FACTORS Zoning risks, permit, expropriation Increasing complexity and uncertainty with respect to permitting, complying with zoning requirements, lead time of procedures, opposition from potential stakeholders and complicated legislation within multiple policy levels and in different regions regarding zoning and construction. This might affect the duration of a development project leading to significant cost overruns and disruption to the planning of developments. Why is this risk significant to WDP? 1 WDP's growth targets have been driven primarily by investments in pre-let property developments and in energy and infrastructure, which are both subject to permitting processes. 1 In 2023, WDP delivered about 436,000 m², representing an investment volume of around 312 million euros. On 31 December 2023, an area of about 553,000 m² was under development, i.e. an investment volume of about 402 million euros. 1 The first Green Mobility Hub was delivered in 2023 as well as a further expansion of solar power capacity to 182 MWp (2023: +69 MWp). WDP intends to achieve a total capacity of 350 MWp by 2027. As of 31 December 2023, the installation of a capacity of 82 MWp is under development, which represents an investment budget of 65 million euros. How does WDP mitigate this risk? 1 Intensive dialogue and proactive cooperation with stakeholders (authorities, local residents, clients) in both the preparatory and implementation phases of developments. 1 Continuous monitoring of applicable laws and regulations by in-house specialists supplemented by external specialised consultants, if applicable. 1 Long-term partnerships with architects and construction partners. Which Key Risk Indicators help WDP to monitor this risk? 1 Different and/or longer lead time for permits. 1 Number of appeals filed in a licensing process. 1 Divergent and/or delayed delivery of real estate and energy projects. Risk appetite: cautious Urban planning Compliance Regulatory risks related to non-compliance with and loss of REIT regimes WDP has REIT status in Belgium, the Netherlands and France (as GVV/SIR, FBI and SIIC respectively). To maintain the REIT status – and their fiscally transparent regime – WDP must take into account certain activity restrictions, diversification requirements, restrictions on the level of its subsidiaries, restrictions on its gearing ratio, requirements on earnings distribution, requirements on its shareholder structure, procedures for conflicts of interest, requirements related to corporate governance and other specific requirements as set out in the relevant national REIT legislations. Why is this risk significant to WDP? 1 Potential loss of the fiscally transparent regime causing a significant negative impact on the net result and NAV. 1 On 31 December 2023, WDP had a total of 2.316,7 million euros in outstanding credit facilities. The contractual provisions of these credit facilities generally stipulate that WDP NV/ SA must remain qualified as a regulated real estate company (GVV/SIR) in Belgium. How does WDP mitigate this risk? 1 Rigorous internal control procedures. See Chapter 8. Corporate Governance Statement. 1 Continuous monitoring of statutory requirements and compliance, assisted by specialist external consultants. 1 Intensive dialogue with the regulator as part of the prudential regulation of REIT regimes. 1 Representation of the Company in organisations that represent the REIT industry. Which Key Risk Indicators help WDP to monitor this risk? 1 Changes in the government's position related to the REIT status. 1 A regulatory warning for inadequate compliance with REIT regulations. 1 Legal ratios imposed by REIT regulations. Risk appetite: cautious REIT status 1 WDP is of the opinion that all conditions are met by the Company within the current applicable FBI legislation. So, WDP expects that the FBI regime applies to the 2022, 2023 and 2024 financial years. Thereafter, the statute will expire given the recent legislative amendment implemented by the Dutch government, which excludes real estate investments from the Dutch FBI regime as of 1 January 2025. For more information, see Chapter 7. Financial results and property report. Annual accounts Governance Results Performance Strategy and value creation This is WDP ESG WDP 2023 Annual Report 161
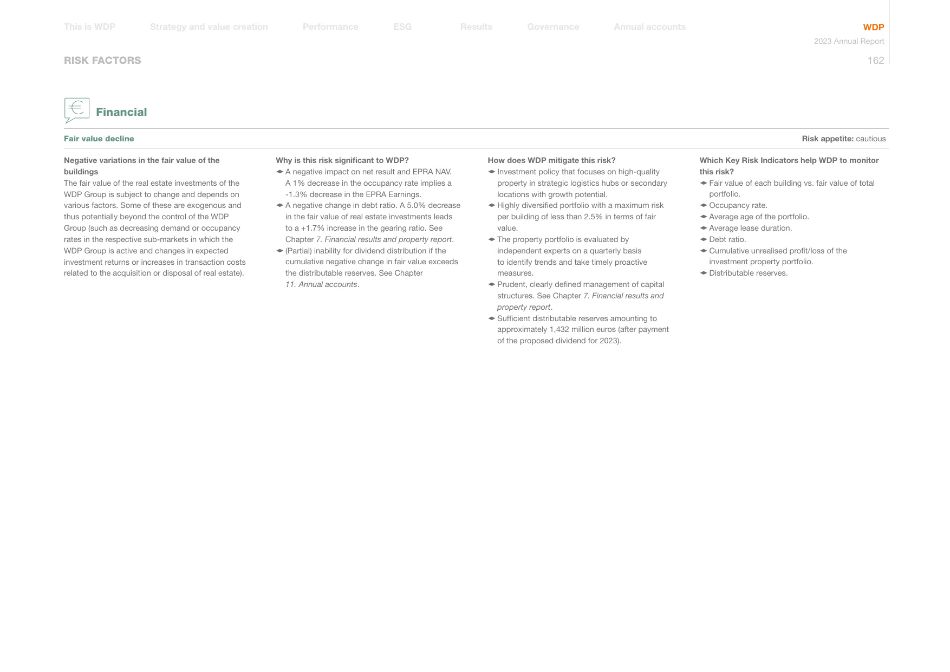
RISK FACTORS Negative variations in the fair value of the buildings The fair value of the real estate investments of the WDP Group is subject to change and depends on various factors. Some of these are exogenous and thus potentially beyond the control of the WDP Group (such as decreasing demand or occupancy rates in the respective sub-markets in which the WDP Group is active and changes in expected investment returns or increases in transaction costs related to the acquisition or disposal of real estate). Why is this risk significant to WDP? 1 A negative impact on net result and EPRA NAV. A 1% decrease in the occupancy rate implies a -1.3% decrease in the EPRA Earnings. 1 A negative change in debt ratio. A 5.0% decrease in the fair value of real estate investments leads to a +1.7% increase in the gearing ratio. See Chapter 7. Financial results and property report. 1 (Partial) inability for dividend distribution if the cumulative negative change in fair value exceeds the distributable reserves. See Chapter 11. Annual accounts. How does WDP mitigate this risk? 1 Investment policy that focuses on high-quality property in strategic logistics hubs or secondary locations with growth potential. 1 Highly diversified portfolio with a maximum risk per building of less than 2.5% in terms of fair value. 1 The property portfolio is evaluated by independent experts on a quarterly basis to identify trends and take timely proactive measures. 1 Prudent, clearly defined management of capital structures. See Chapter 7. Financial results and property report. 1 Sufficient distributable reserves amounting to approximately 1,432 million euros (after payment of the proposed dividend for 2023). Which Key Risk Indicators help WDP to monitor this risk? 1 Fair value of each building vs. fair value of total portfolio. 1 Occupancy rate. 1 Average age of the portfolio. 1 Average lease duration. 1 Debt ratio. 1 Cumulative unrealised profit/loss of the investment property portfolio. 1 Distributable reserves. Risk appetite: cautious Fair value decline Financial Annual accounts Governance Results Performance Strategy and value creation This is WDP ESG WDP 2023 Annual Report 162
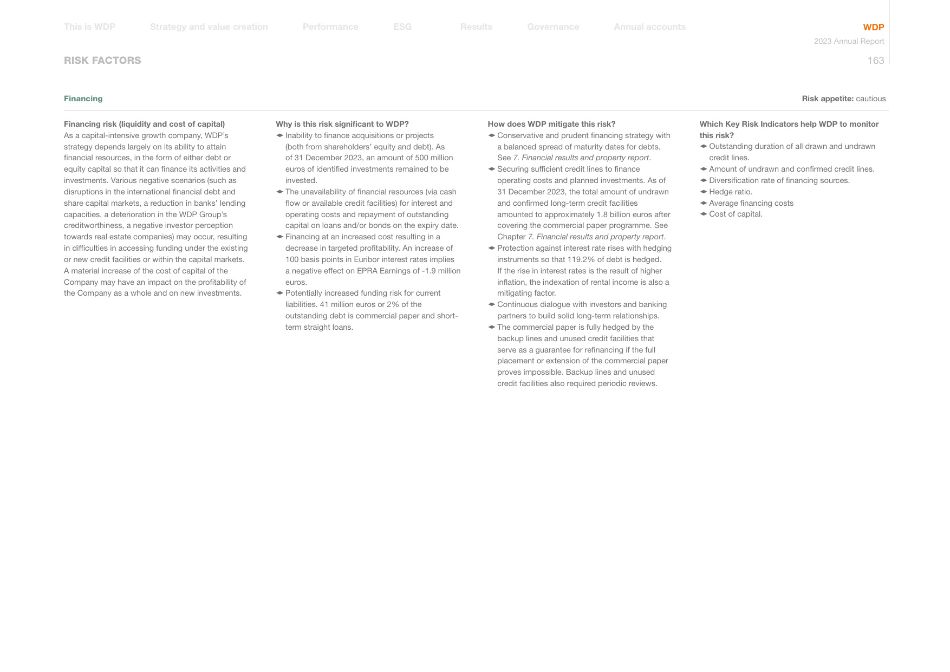
RISK FACTORS Financing risk (liquidity and cost of capital) As a capital-intensive growth company, WDP's strategy depends largely on its ability to attain financial resources, in the form of either debt or equity capital so that it can finance its activities and investments. Various negative scenarios (such as disruptions in the international financial debt and share capital markets, a reduction in banks' lending capacities, a deterioration in the WDP Group's creditworthiness, a negative investor perception towards real estate companies) may occur, resulting in difficulties in accessing funding under the existing or new credit facilities or within the capital markets. A material increase of the cost of capital of the Company may have an impact on the profitability of the Company as a whole and on new investments. Why is this risk significant to WDP? 1 Inability to finance acquisitions or projects (both from shareholders' equity and debt). As of 31 December 2023, an amount of 500 million euros of identified investments remained to be invested. 1 The unavailability of financial resources (via cash flow or available credit facilities) for interest and operating costs and repayment of outstanding capital on loans and/or bonds on the expiry date. 1 Financing at an increased cost resulting in a decrease in targeted profitability. An increase of 100 basis points in Euribor interest rates implies a negative effect on EPRA Earnings of -1.9 million euros. 1 Potentially increased funding risk for current liabilities. 41 million euros or 2% of the outstanding debt is commercial paper and short- term straight loans. How does WDP mitigate this risk? 1 Conservative and prudent financing strategy with a balanced spread of maturity dates for debts. See 7. Financial results and property report. 1 Securing sufficient credit lines to finance operating costs and planned investments. As of 31 December 2023, the total amount of undrawn and confirmed long-term credit facilities amounted to approximately 1.8 billion euros after covering the commercial paper programme. See Chapter 7. Financial results and property report. 1 Protection against interest rate rises with hedging instruments so that 119.2% of debt is hedged. If the rise in interest rates is the result of higher inflation, the indexation of rental income is also a mitigating factor. 1 Continuous dialogue with investors and banking partners to build solid long-term relationships. 1 The commercial paper is fully hedged by the backup lines and unused credit facilities that serve as a guarantee for refinancing if the full placement or extension of the commercial paper proves impossible. Backup lines and unused credit facilities also required periodic reviews. Which Key Risk Indicators help WDP to monitor this risk? 1 Outstanding duration of all drawn and undrawn credit lines. 1 Amount of undrawn and confirmed credit lines. 1 Diversification rate of financing sources. 1 Hedge ratio. 1 Average financing costs 1 Cost of capital. Risk appetite: cautious Financing Annual accounts Governance Results Performance Strategy and value creation This is WDP ESG WDP 2023 Annual Report 163
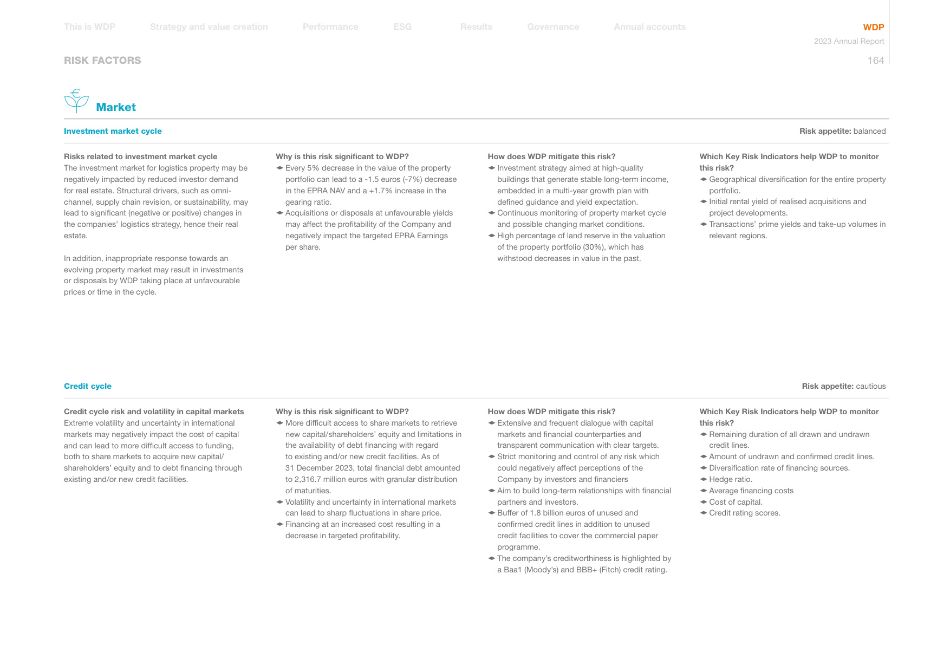
RISK FACTORS Market Risks related to investment market cycle The investment market for logistics property may be negatively impacted by reduced investor demand for real estate. Structural drivers, such as omni- channel, supply chain revision, or sustainability, may lead to significant (negative or positive) changes in the companies' logistics strategy, hence their real estate. In addition, inappropriate response towards an evolving property market may result in investments or disposals by WDP taking place at unfavourable prices or time in the cycle. Why is this risk significant to WDP? 1 Every 5% decrease in the value of the property portfolio can lead to a -1.5 euros (-7%) decrease in the EPRA NAV and a +1.7% increase in the gearing ratio. 1 Acquisitions or disposals at unfavourable yields may affect the profitability of the Company and negatively impact the targeted EPRA Earnings per share. How does WDP mitigate this risk? 1 Investment strategy aimed at high-quality buildings that generate stable long-term income, embedded in a multi-year growth plan with defined guidance and yield expectation. 1 Continuous monitoring of property market cycle and possible changing market conditions. 1 High percentage of land reserve in the valuation of the property portfolio (30%), which has withstood decreases in value in the past. Which Key Risk Indicators help WDP to monitor this risk? 1 Geographical diversification for the entire property portfolio. 1 Initial rental yield of realised acquisitions and project developments. 1 Transactions' prime yields and take-up volumes in relevant regions. Investment market cycle Risk appetite: balanced Credit cycle risk and volatility in capital markets Extreme volatility and uncertainty in international markets may negatively impact the cost of capital and can lead to more difficult access to funding, both to share markets to acquire new capital/ shareholders' equity and to debt financing through existing and/or new credit facilities. Why is this risk significant to WDP? 1 More difficult access to share markets to retrieve new capital/shareholders' equity and limitations in the availability of debt financing with regard to existing and/or new credit facilities. As of 31 December 2023, total financial debt amounted to 2,316.7 million euros with granular distribution of maturities. 1 Volatility and uncertainty in international markets can lead to sharp fluctuations in share price. 1 Financing at an increased cost resulting in a decrease in targeted profitability. How does WDP mitigate this risk? 1 Extensive and frequent dialogue with capital markets and financial counterparties and transparent communication with clear targets. 1 Strict monitoring and control of any risk which could negatively affect perceptions of the Company by investors and financiers 1 Aim to build long-term relationships with financial partners and investors. 1 Buffer of 1.8 billion euros of unused and confirmed credit lines in addition to unused credit facilities to cover the commercial paper programme. 1 The company's creditworthiness is highlighted by a Baa1 (Moody's) and BBB+ (Fitch) credit rating. Which Key Risk Indicators help WDP to monitor this risk? 1 Remaining duration of all drawn and undrawn credit lines. 1 Amount of undrawn and confirmed credit lines. 1 Diversification rate of financing sources. 1 Hedge ratio. 1 Average financing costs 1 Cost of capital. 1 Credit rating scores. Risk appetite: cautious Credit cycle Annual accounts Governance Results Performance Strategy and value creation This is WDP ESG WDP 2023 Annual Report 164
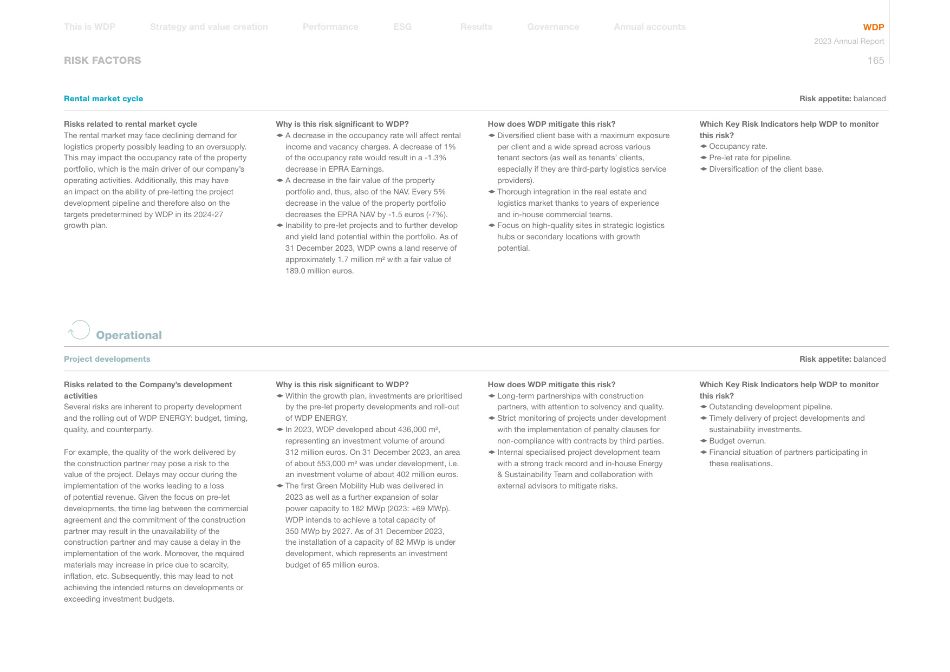
RISK FACTORS Risks related to rental market cycle The rental market may face declining demand for logistics property possibly leading to an oversupply. This may impact the occupancy rate of the property portfolio, which is the main driver of our company's operating activities. Additionally, this may have an impact on the ability of pre-letting the project development pipeline and therefore also on the targets predetermined by WDP in its 2024-27 growth plan. Why is this risk significant to WDP? 1 A decrease in the occupancy rate will affect rental income and vacancy charges. A decrease of 1% of the occupancy rate would result in a -1.3% decrease in EPRA Earnings. 1 A decrease in the fair value of the property portfolio and, thus, also of the NAV. Every 5% decrease in the value of the property portfolio decreases the EPRA NAV by -1.5 euros (-7%). 1 Inability to pre-let projects and to further develop and yield land potential within the portfolio. As of 31 December 2023, WDP owns a land reserve of approximately 1.7 million m² with a fair value of 189.0 million euros. How does WDP mitigate this risk? 1 Diversified client base with a maximum exposure per client and a wide spread across various tenant sectors (as well as tenants' clients, especially if they are third-party logistics service providers). 1 Thorough integration in the real estate and logistics market thanks to years of experience and in-house commercial teams. 1 Focus on high-quality sites in strategic logistics hubs or secondary locations with growth potential. Which Key Risk Indicators help WDP to monitor this risk? 1 Occupancy rate. 1 Pre-let rate for pipeline. 1 Diversification of the client base. Risk appetite: balanced Rental market cycle Risks related to the Company's development activities Several risks are inherent to property development and the rolling out of WDP ENERGY: budget, timing, quality, and counterparty. For example, the quality of the work delivered by the construction partner may pose a risk to the value of the project. Delays may occur during the implementation of the works leading to a loss of potential revenue. Given the focus on pre-let developments, the time lag between the commercial agreement and the commitment of the construction partner may result in the unavailability of the construction partner and may cause a delay in the implementation of the work. Moreover, the required materials may increase in price due to scarcity, inflation, etc. Subsequently, this may lead to not achieving the intended returns on developments or exceeding investment budgets. Why is this risk significant to WDP? 1 Within the growth plan, investments are prioritised by the pre-let property developments and roll-out of WDP ENERGY. 1 In 2023, WDP developed about 436,000 m², representing an investment volume of around 312 million euros. On 31 December 2023, an area of about 553,000 m² was under development, i.e. an investment volume of about 402 million euros. 1 The first Green Mobility Hub was delivered in 2023 as well as a further expansion of solar power capacity to 182 MWp (2023: +69 MWp). WDP intends to achieve a total capacity of 350 MWp by 2027. As of 31 December 2023, the installation of a capacity of 82 MWp is under development, which represents an investment budget of 65 million euros. How does WDP mitigate this risk? 1 Long-term partnerships with construction partners, with attention to solvency and quality. 1 Strict monitoring of projects under development with the implementation of penalty clauses for non-compliance with contracts by third parties. 1 Internal specialised project development team with a strong track record and in-house Energy & Sustainability Team and collaboration with external advisors to mitigate risks. Which Key Risk Indicators help WDP to monitor this risk? 1 Outstanding development pipeline. 1 Timely delivery of project developments and sustainability investments. 1 Budget overrun. 1 Financial situation of partners participating in these realisations. Risk appetite: balanced Project developments Operational Annual accounts Governance Results Performance Strategy and value creation This is WDP ESG WDP 2023 Annual Report 165
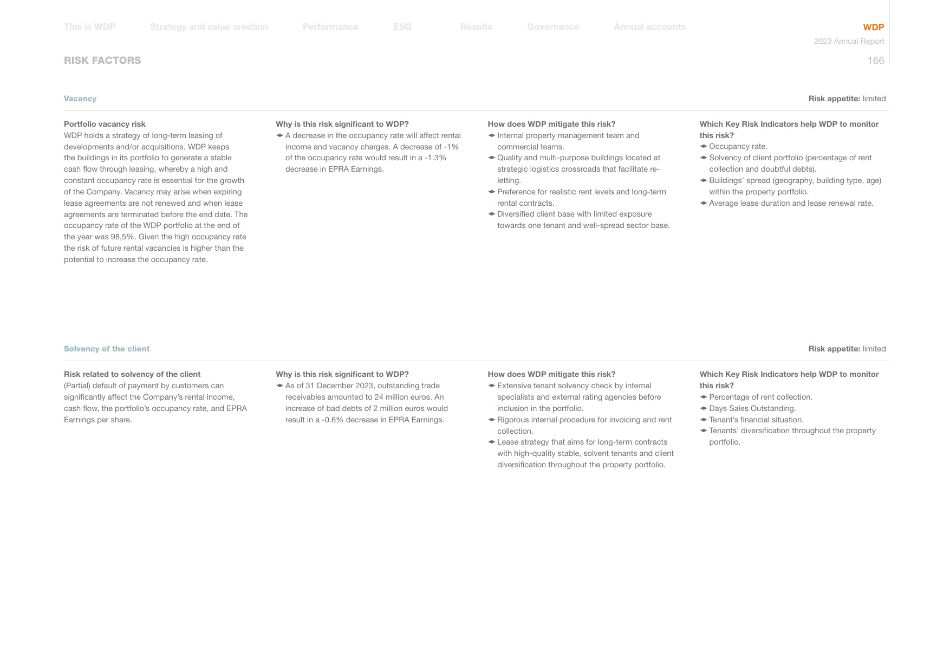
RISK FACTORS Portfolio vacancy risk WDP holds a strategy of long-term leasing of developments and/or acquisitions. WDP keeps the buildings in its portfolio to generate a stable cash flow through leasing, whereby a high and constant occupancy rate is essential for the growth of the Company. Vacancy may arise when expiring lease agreements are not renewed and when lease agreements are terminated before the end date. The occupancy rate of the WDP portfolio at the end of the year was 98,5%. Given the high occupancy rate the risk of future rental vacancies is higher than the potential to increase the occupancy rate. Why is this risk significant to WDP? 1 A decrease in the occupancy rate will affect rental income and vacancy charges. A decrease of -1% of the occupancy rate would result in a -1.3% decrease in EPRA Earnings. How does WDP mitigate this risk? 1 Internal property management team and commercial teams. 1 Quality and multi-purpose buildings located at strategic logistics crossroads that facilitate re- letting. 1 Preference for realistic rent levels and long-term rental contracts. 1 Diversified client base with limited exposure towards one tenant and well-spread sector base. Which Key Risk Indicators help WDP to monitor this risk? 1 Occupancy rate. 1 Solvency of client portfolio (percentage of rent collection and doubtful debts). 1 Buildings' spread (geography, building type, age) within the property portfolio. 1 Average lease duration and lease renewal rate. Risk appetite: limited Vacancy Risk related to solvency of the client (Partial) default of payment by customers can significantly affect the Company's rental income, cash flow, the portfolio's occupancy rate, and EPRA Earnings per share. Why is this risk significant to WDP? 1 As of 31 December 2023, outstanding trade receivables amounted to 24 million euros. An increase of bad debts of 2 million euros would result in a -0.6% decrease in EPRA Earnings. How does WDP mitigate this risk? 1 Extensive tenant solvency check by internal specialists and external rating agencies before inclusion in the portfolio. 1 Rigorous internal procedure for invoicing and rent collection. 1 Lease strategy that aims for long-term contracts with high-quality stable, solvent tenants and client diversification throughout the property portfolio. Which Key Risk Indicators help WDP to monitor this risk? 1 Percentage of rent collection. 1 Days Sales Outstanding. 1 Tenant's financial situation. 1 Tenants' diversification throughout the property portfolio. Risk appetite: limited Solvency of the client Annual accounts Governance Results Performance Strategy and value creation This is WDP ESG WDP 2023 Annual Report 166
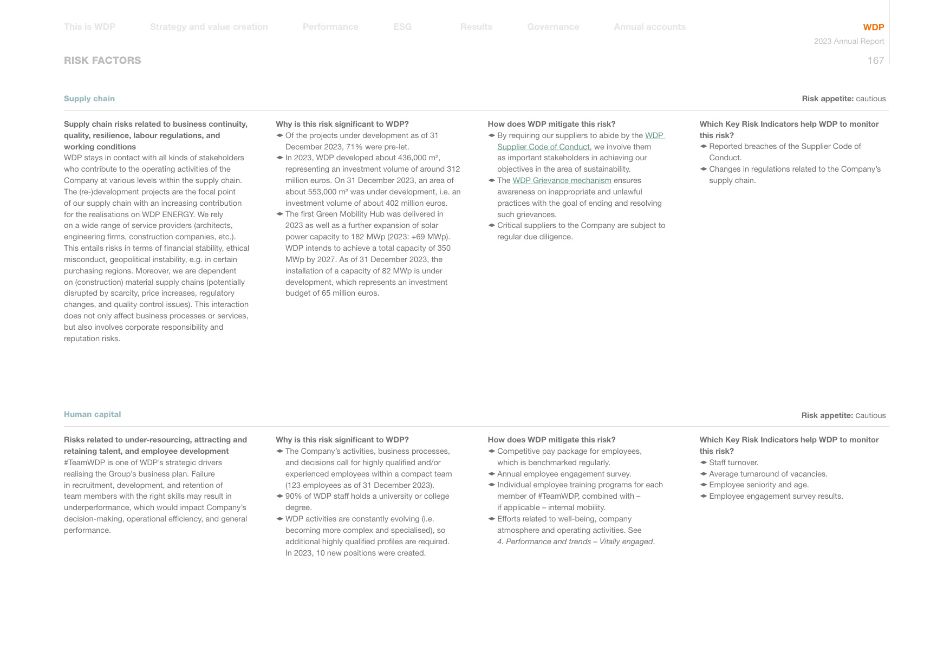
RISK FACTORS Risks related to under-resourcing, attracting and retaining talent, and employee development #TeamWDP is one of WDP's strategic drivers realising the Group's business plan. Failure in recruitment, development, and retention of team members with the right skills may result in underperformance, which would impact Company's decision-making, operational efficiency, and general performance. Why is this risk significant to WDP? 1 The Company's activities, business processes, and decisions call for highly qualified and/or experienced employees within a compact team (123 employees as of 31 December 2023). 1 90% of WDP staff holds a university or college degree. 1 WDP activities are constantly evolving (i.e. becoming more complex and specialised), so additional highly qualified profiles are required. In 2023, 10 new positions were created. How does WDP mitigate this risk? 1 Competitive pay package for employees, which is benchmarked regularly. 1 Annual employee engagement survey. 1 Individual employee training programs for each member of #TeamWDP, combined with – if applicable – internal mobility. 1 Efforts related to well-being, company atmosphere and operating activities. See 4. Performance and trends – Vitally engaged. Which Key Risk Indicators help WDP to monitor this risk? 1 Staff turnover. 1 Average turnaround of vacancies. 1 Employee seniority and age. 1 Employee engagement survey results. Risk appetite: cautious Human capital Supply chain risks related to business continuity, quality, resilience, labour regulations, and working conditions WDP stays in contact with all kinds of stakeholders who contribute to the operating activities of the Company at various levels within the supply chain. The (re-)development projects are the focal point of our supply chain with an increasing contribution for the realisations on WDP ENERGY. We rely on a wide range of service providers (architects, engineering firms, construction companies, etc.). This entails risks in terms of financial stability, ethical misconduct, geopolitical instability, e.g. in certain purchasing regions. Moreover, we are dependent on (construction) material supply chains (potentially disrupted by scarcity, price increases, regulatory changes, and quality control issues). This interaction does not only affect business processes or services, but also involves corporate responsibility and reputation risks. Why is this risk significant to WDP? 1 Of the projects under development as of 31 December 2023, 71% were pre-let. 1 In 2023, WDP developed about 436,000 m², representing an investment volume of around 312 million euros. On 31 December 2023, an area of about 553,000 m² was under development, i.e. an investment volume of about 402 million euros. 1 The first Green Mobility Hub was delivered in 2023 as well as a further expansion of solar power capacity to 182 MWp (2023: +69 MWp). WDP intends to achieve a total capacity of 350 MWp by 2027. As of 31 December 2023, the installation of a capacity of 82 MWp is under development, which represents an investment budget of 65 million euros. How does WDP mitigate this risk? 1 By requiring our suppliers to abide by the WDP Supplier Code of Conduct, we involve them as important stakeholders in achieving our objectives in the area of sustainability. 1 The WDP Grievance mechanism ensures awareness on inappropriate and unlawful practices with the goal of ending and resolving such grievances. 1 Critical suppliers to the Company are subject to regular due diligence. Which Key Risk Indicators help WDP to monitor this risk? 1 Reported breaches of the Supplier Code of Conduct. 1 Changes in regulations related to the Company's supply chain. Risk appetite: cautious Supply chain Annual accounts Governance Results Performance Strategy and value creation This is WDP ESG WDP 2023 Annual Report 167
10 REPORTING ACCORDING TO RECOGNISED STANDARDS
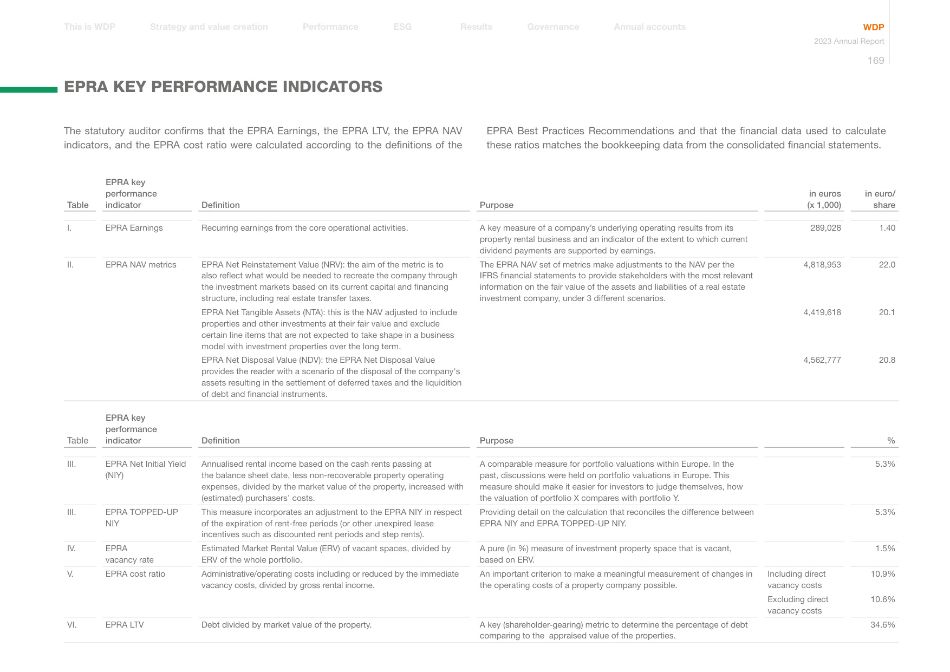
The statutory auditor confirms that the EPRA Earnings, the EPRA LTV, the EPRA NAV indicators, and the EPRA cost ratio were calculated according to the definitions of the EPRA Best Practices Recommendations and that the financial data used to calculate these ratios matches the bookkeeping data from the consolidated financial statements. Table EPRA key performance indicator Definition Purpose in euros (x 1,000) in euro/ share I. EPRA Earnings Recurring earnings from the core operational activities. A key measure of a company's underlying operating results from its property rental business and an indicator of the extent to which current dividend payments are supported by earnings. 289,028 1.40 II. EPRA NAV metrics EPRA Net Reinstatement Value (NRV): the aim of the metric is to also reflect what would be needed to recreate the company through the investment markets based on its current capital and financing structure, including real estate transfer taxes. The EPRA NAV set of metrics make adjustments to the NAV per the IFRS financial statements to provide stakeholders with the most relevant information on the fair value of the assets and liabilities of a real estate investment company, under 3 different scenarios. 4,818,953 22.0 EPRA Net Tangible Assets (NTA): this is the NAV adjusted to include properties and other investments at their fair value and exclude certain line items that are not expected to take shape in a business model with investment properties over the long term. 4,419,618 20.1 EPRA Net Disposal Value (NDV): the EPRA Net Disposal Value provides the reader with a scenario of the disposal of the company's assets resulting in the settlement of deferred taxes and the liquidition of debt and financial instruments. 4,562,777 20.8 Table EPRA key performance indicator Definition Purpose % III. EPRA Net Initial Yield (NIY) Annualised rental income based on the cash rents passing at the balance sheet date, less non-recoverable property operating expenses, divided by the market value of the property, increased with (estimated) purchasers' costs. A comparable measure for portfolio valuations within Europe. In the past, discussions were held on portfolio valuations in Europe. This measure should make it easier for investors to judge themselves, how the valuation of portfolio X compares with portfolio Y. 5.3% III. EPRA TOPPED-UP NIY This measure incorporates an adjustment to the EPRA NIY in respect of the expiration of rent-free periods (or other unexpired lease incentives such as discounted rent periods and step rents). Providing detail on the calculation that reconciles the difference between EPRA NIY and EPRA TOPPED-UP NIY. 5.3% IV. EPRA vacancy rate Estimated Market Rental Value (ERV) of vacant spaces, divided by ERV of the whole portfolio. A pure (in %) measure of investment property space that is vacant, based on ERV. 1.5% V. EPRA cost ratio Administrative/operating costs including or reduced by the immediate vacancy costs, divided by gross rental income. An important criterion to make a meaningful measurement of changes in the operating costs of a property company possible. Including direct vacancy costs 10.9% Excluding direct vacancy costs 10.6% VI. EPRA LTV Debt divided by market value of the property. A key (shareholder-gearing) metric to determine the percentage of debt comparing to the appraised value of the properties. 34.6% Annual accounts Governance Results Performance Strategy and value creation This is WDP ESG WDP 2023 Annual Report 169 EPRA KEY PERFORMANCE INDICATORS
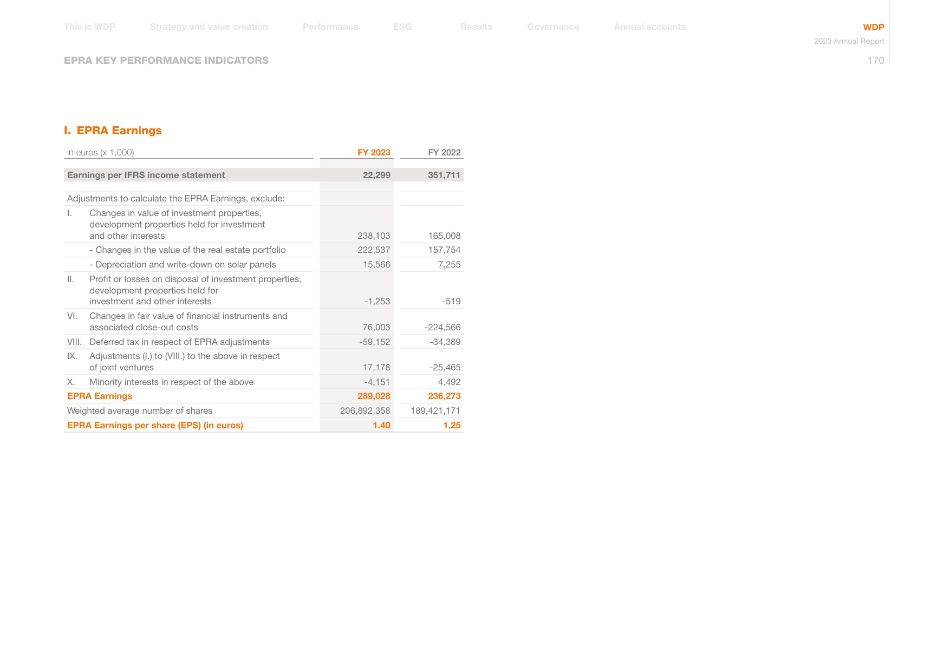
EPRA KEY PERFORMANCE INDICATORS I. EPRA Earnings in euros (x 1,000) FY 2023 FY 2022 Earnings per IFRS income statement 22,299 351,711 Adjustments to calculate the EPRA Earnings, exclude: I. Changes in value of investment properties, development properties held for investment and other interests 238,103 165,008 - Changes in the value of the real estate portfolio 222,537 157,754 - Depreciation and write-down on solar panels 15,566 7,255 II. Profit or losses on disposal of investment properties, development properties held for investment and other interests -1,253 -519 VI. Changes in fair value of financial instruments and associated close-out costs 76,003 -224,566 VIII. Deferred tax in respect of EPRA adjustments -59,152 -34,389 IX. Adjustments (I.) to (VIII.) to the above in respect of joint ventures 17,178 -25,465 X. Minority interests in respect of the above -4,151 4,492 EPRA Earnings 289,028 236,273 Weighted average number of shares 206,892,358 189,421,171 EPRA Earnings per share (EPS) (in euros) 1.40 1.25 Annual accounts Governance Results Performance Strategy and value creation This is WDP ESG WDP 2023 Annual Report 170
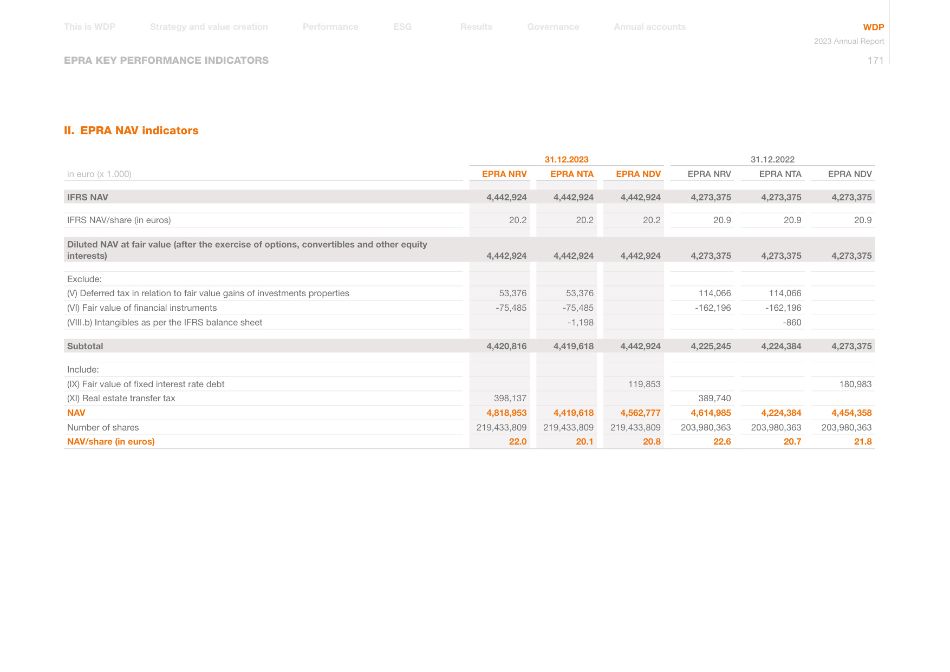
EPRA KEY PERFORMANCE INDICATORS II. EPRA NAV indicators 31.12.2023 31.12.2022 in euro (x 1.000) EPRA NRV EPRA NTA EPRA NDV EPRA NRV EPRA NTA EPRA NDV IFRS NAV 4,442,924 4,442,924 4,442,924 4,273,375 4,273,375 4,273,375 IFRS NAV/share (in euros) 20.2 20.2 20.2 20.9 20.9 20.9 Diluted NAV at fair value (after the exercise of options, convertibles and other equity interests) 4,442,924 4,442,924 4,442,924 4,273,375 4,273,375 4,273,375 Exclude: (V) Deferred tax in relation to fair value gains of investments properties 53,376 53,376 114,066 114,066 (VI) Fair value of financial instruments -75,485 -75,485 -162,196 -162,196 (VIII.b) Intangibles as per the IFRS balance sheet -1,198 -860 Subtotal 4,420,816 4,419,618 4,442,924 4,225,245 4,224,384 4,273,375 Include: (IX) Fair value of fixed interest rate debt 119,853 180,983 (XI) Real estate transfer tax 398,137 389,740 NAV 4,818,953 4,419,618 4,562,777 4,614,985 4,224,384 4,454,358 Number of shares 219,433,809 219,433,809 219,433,809 203,980,363 203,980,363 203,980,363 NAV/share (in euros) 22.0 20.1 20.8 22.6 20.7 21.8 Annual accounts Governance Results Performance Strategy and value creation This is WDP ESG WDP 2023 Annual Report 171
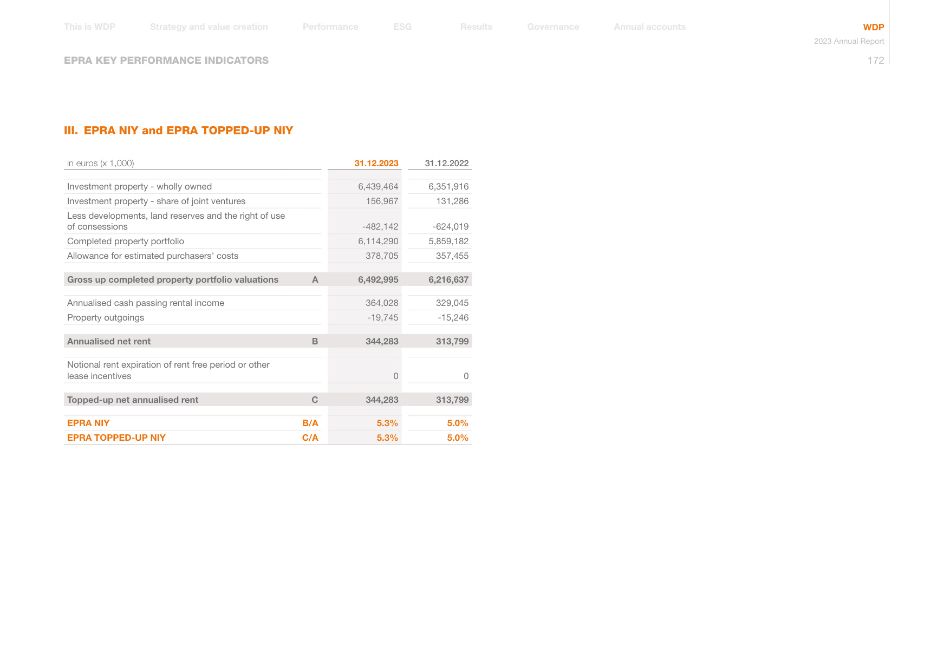
EPRA KEY PERFORMANCE INDICATORS III. EPRA NIY and EPRA TOPPED-UP NIY in euros (x 1,000) 31.12.2023 31.12.2022 Investment property - wholly owned 6,439,464 6,351,916 Investment property - share of joint ventures 156,967 131,286 Less developments, land reserves and the right of use of consessions -482,142 -624,019 Completed property portfolio 6,114,290 5,859,182 Allowance for estimated purchasers' costs 378,705 357,455 Gross up completed property portfolio valuations A 6,492,995 6,216,637 Annualised cash passing rental income 364,028 329,045 Property outgoings -19,745 -15,246 Annualised net rent B 344,283 313,799 Notional rent expiration of rent free period or other lease incentives 0 0 Topped-up net annualised rent C 344,283 313,799 EPRA NIY B/A 5.3% 5.0% EPRA TOPPED-UP NIY C/A 5.3% 5.0% Annual accounts Governance Results Performance Strategy and value creation This is WDP ESG WDP 2023 Annual Report 172
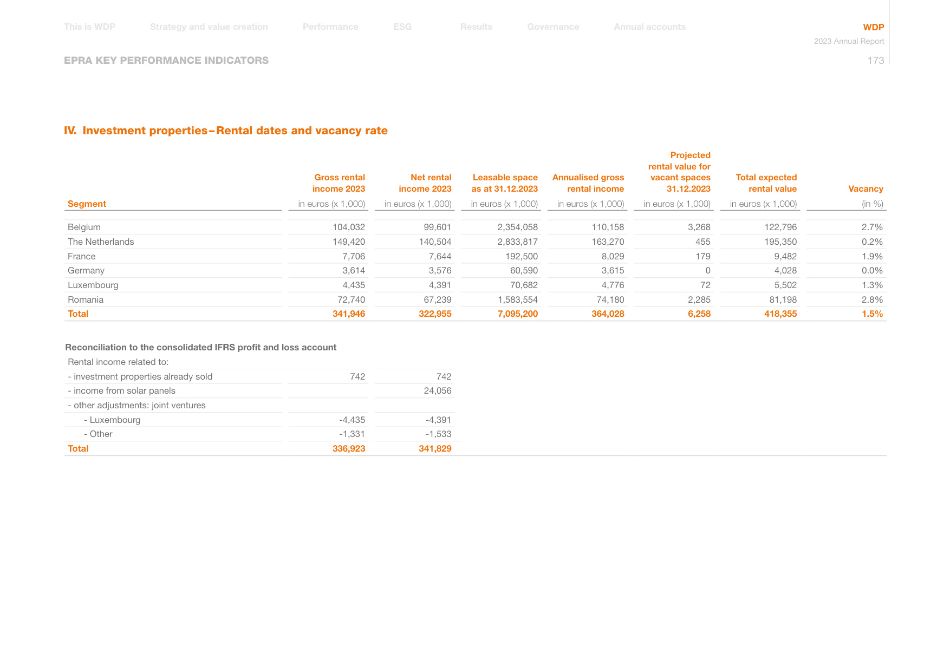
EPRA KEY PERFORMANCE INDICATORS IV. Investment properties – Rental dates and vacancy rate Gross rental income 2023 Net rental income 2023 Leasable space as at 31.12.2023 Annualised gross rental income Projected rental value for vacant spaces 31.12.2023 Total expected rental value Vacancy Segment in euros (x 1,000) in euros (x 1,000) in euros (x 1,000) in euros (x 1,000) in euros (x 1,000) in euros (x 1,000) (in %) Belgium 104,032 99,601 2,354,058 110,158 3,268 122,796 2.7% The Netherlands 149,420 140,504 2,833,817 163,270 455 195,350 0.2% France 7,706 7,644 192,500 8,029 179 9,482 1.9% Germany 3,614 3,576 60,590 3,615 0 4,028 0.0% Luxembourg 4,435 4,391 70,682 4,776 72 5,502 1.3% Romania 72,740 67,239 1,583,554 74,180 2,285 81,198 2.8% Total 341,946 322,955 7,095,200 364,028 6,258 418,355 1.5% Reconciliation to the consolidated IFRS profit and loss account Rental income related to: - investment properties already sold 742 742 - income from solar panels 24,056 - other adjustments: joint ventures - Luxembourg -4,435 -4,391 - Other -1,331 -1,533 Total 336,923 341,829 Annual accounts Governance Results Performance Strategy and value creation This is WDP ESG WDP 2023 Annual Report 173
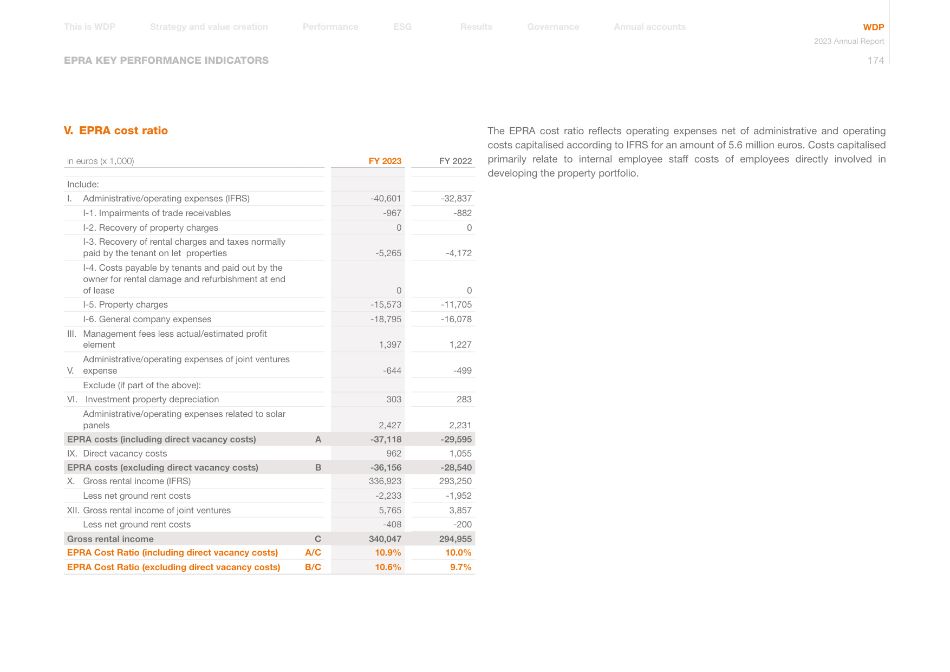
EPRA KEY PERFORMANCE INDICATORS V. EPRA cost ratio in euros (x 1,000) FY 2023 FY 2022 Include: I. Administrative/operating expenses (IFRS) -40,601 -32,837 I-1. Impairments of trade receivables -967 -882 I-2. Recovery of property charges 0 0 I-3. Recovery of rental charges and taxes normally paid by the tenant on let properties -5,265 -4,172 I-4. Costs payable by tenants and paid out by the owner for rental damage and refurbishment at end of lease 0 0 I-5. Property charges -15,573 -11,705 I-6. General company expenses -18,795 -16,078 III. Management fees less actual/estimated profit element 1,397 1,227 V. Administrative/operating expenses of joint ventures expense -644 -499 Exclude (if part of the above): VI. Investment property depreciation 303 283 Administrative/operating expenses related to solar panels 2,427 2,231 EPRA costs (including direct vacancy costs) A -37,118 -29,595 IX. Direct vacancy costs 962 1,055 EPRA costs (excluding direct vacancy costs) B -36,156 -28,540 X. Gross rental income (IFRS) 336,923 293,250 Less net ground rent costs -2,233 -1,952 XII. Gross rental income of joint ventures 5,765 3,857 Less net ground rent costs -408 -200 Gross rental income C 340,047 294,955 EPRA Cost Ratio (including direct vacancy costs) A/C 10.9% 10.0% EPRA Cost Ratio (excluding direct vacancy costs) B/C 10.6% 9.7% The EPRA cost ratio reflects operating expenses net of administrative and operating costs capitalised according to IFRS for an amount of 5.6 million euros. Costs capitalised primarily relate to internal employee staff costs of employees directly involved in developing the property portfolio. Annual accounts Governance Results Performance Strategy and value creation This is WDP ESG WDP 2023 Annual Report 174
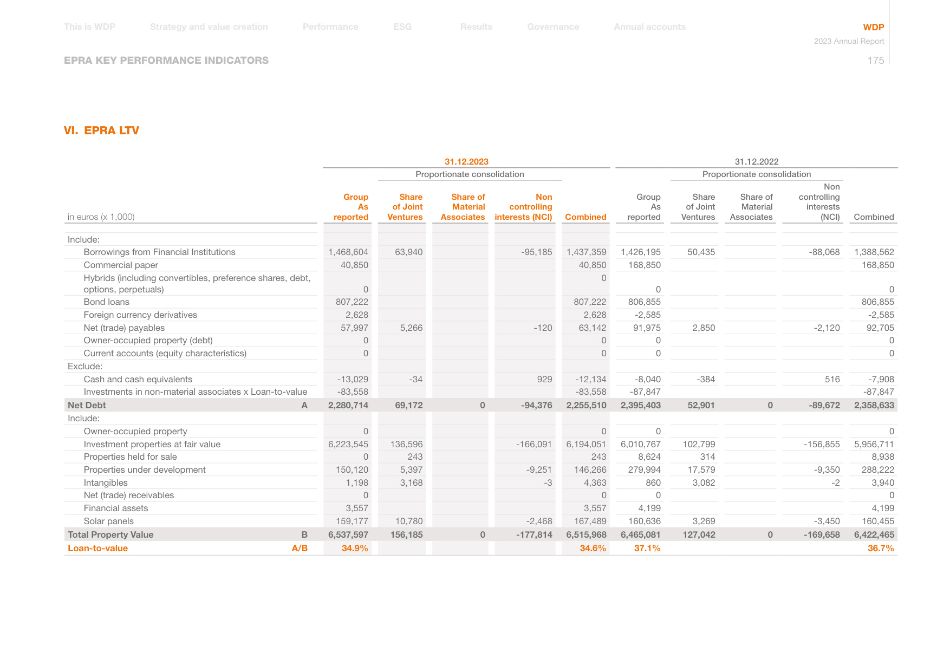
EPRA KEY PERFORMANCE INDICATORS VI. EPRA LTV 31.12.2023 31.12.2022 Proportionate consolidation Proportionate consolidation in euros (x 1,000) Group As reported Share of Joint Ventures Share of Material Associates Non controlling interests (NCI) Combined Group As reported Share of Joint Ventures Share of Material Associates Non controlling interests (NCI) Combined Include: Borrowings from Financial Institutions 1,468,604 63,940 -95,185 1,437,359 1,426,195 50,435 -88,068 1,388,562 Commercial paper 40,850 40,850 168,850 168,850 Hybrids (including convertibles, preference shares, debt, options, perpetuals) 0 0 0 0 Bond loans 807,222 807,222 806,855 806,855 Foreign currency derivatives 2,628 2,628 -2,585 -2,585 Net (trade) payables 57,997 5,266 -120 63,142 91,975 2,850 -2,120 92,705 Owner-occupied property (debt) 0 0 0 0 Current accounts (equity characteristics) 0 0 0 0 Exclude: Cash and cash equivalents -13,029 -34 929 -12,134 -8,040 -384 516 -7,908 Investments in non-material associates x Loan-to-value -83,558 -83,558 -87,847 -87,847 Net Debt A 2,280,714 69,172 0 -94,376 2,255,510 2,395,403 52,901 0 -89,672 2,358,633 Include: Owner-occupied property 0 0 0 0 Investment properties at fair value 6,223,545 136,596 -166,091 6,194,051 6,010,767 102,799 -156,855 5,956,711 Properties held for sale 0 243 243 8,624 314 8,938 Properties under development 150,120 5,397 -9,251 146,266 279,994 17,579 -9,350 288,222 Intangibles 1,198 3,168 -3 4,363 860 3,082 -2 3,940 Net (trade) receivables 0 0 0 0 Financial assets 3,557 3,557 4,199 4,199 Solar panels 159,177 10,780 -2,468 167,489 160,636 3,269 -3,450 160,455 Total Property Value B 6,537,597 156,185 0 -177,814 6,515,968 6,465,081 127,042 0 -169,658 6,422,465 Loan-to-value A/B 34.9% 34.6% 37.1% 36.7% Annual accounts Governance Results Performance Strategy and value creation This is WDP ESG WDP 2023 Annual Report 175
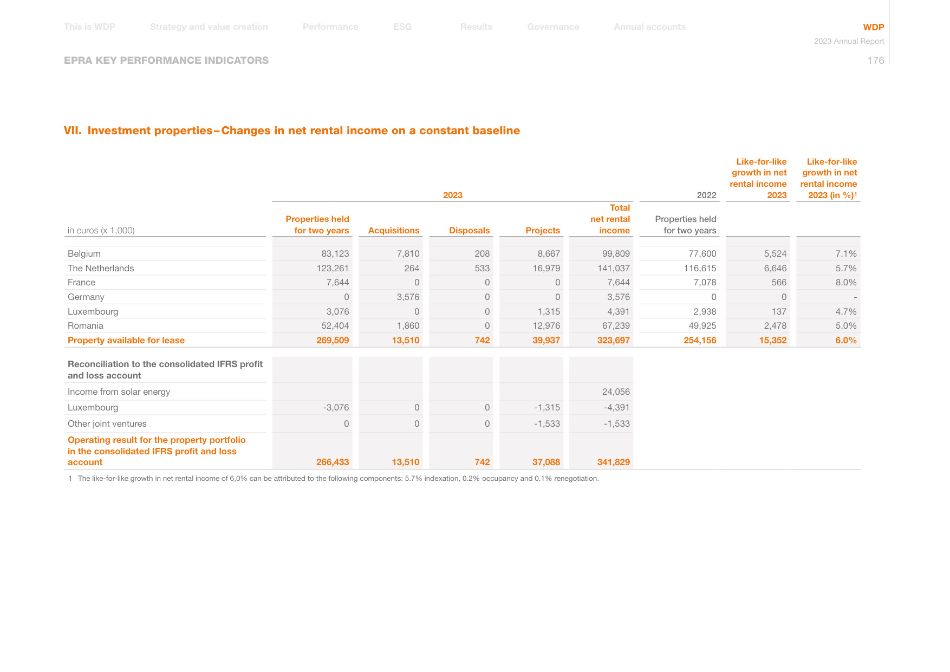
EPRA KEY PERFORMANCE INDICATORS VII. Investment properties – Changes in net rental income on a constant baseline 2023 2022 Like-for-like growth in net rental income 2023 Like-for-like growth in net rental income 2023 (in %)¹ in euros (x 1,000) Properties held for two years Acquisitions Disposals Projects Total net rental income Properties held for two years Belgium 83,123 7,810 208 8,667 99,809 77,600 5,524 7.1% The Netherlands 123,261 264 533 16,979 141,037 116,615 6,646 5.7% France 7,644 0 0 0 7,644 7,078 566 8.0% Germany 0 3,576 0 0 3,576 0 0 - Luxembourg 3,076 0 0 1,315 4,391 2,938 137 4.7% Romania 52,404 1,860 0 12,976 67,239 49,925 2,478 5.0% Property available for lease 269,509 13,510 742 39,937 323,697 254,156 15,352 6.0% Reconciliation to the consolidated IFRS profit and loss account Income from solar energy 24,056 Luxembourg -3,076 0 0 -1,315 -4,391 Other joint ventures 0 0 0 -1,533 -1,533 Operating result for the property portfolio in the consolidated IFRS profit and loss account 266,433 13,510 742 37,088 341,829 1 The like-for-like growth in net rental income of 6,0% can be attributed to the following components: 5.7% indexation, 0.2% occupancy and 0.1% renegotiation. Annual accounts Governance Results Performance Strategy and value creation This is WDP ESG WDP 2023 Annual Report 176
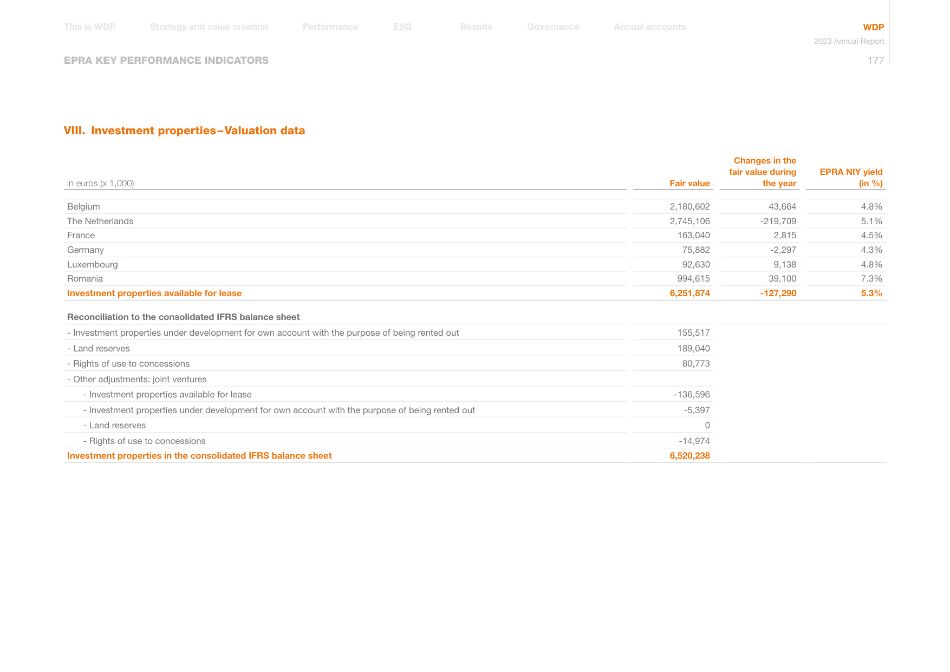
EPRA KEY PERFORMANCE INDICATORS VIII. Investment properties – Valuation data in euros (x 1,000) Fair value Changes in the fair value during the year EPRA NIY yield (in %) Belgium 2,180,602 43,664 4.8% The Netherlands 2,745,106 -219,709 5.1% France 163,040 2,815 4.5% Germany 75,882 -2,297 4.3% Luxembourg 92,630 9,138 4.8% Romania 994,615 39,100 7.3% Investment properties available for lease 6,251,874 -127,290 5.3% Reconciliation to the consolidated IFRS balance sheet - Investment properties under development for own account with the purpose of being rented out 155,517 - Land reserves 189,040 - Rights of use to concessions 80,773 - Other adjustments: joint ventures - Investment properties available for lease -136,596 - Investment properties under development for own account with the purpose of being rented out -5,397 - Land reserves 0 - Rights of use to concessions -14,974 Investment properties in the consolidated IFRS balance sheet 6,520,238 Annual accounts Governance Results Performance Strategy and value creation This is WDP ESG WDP 2023 Annual Report 177
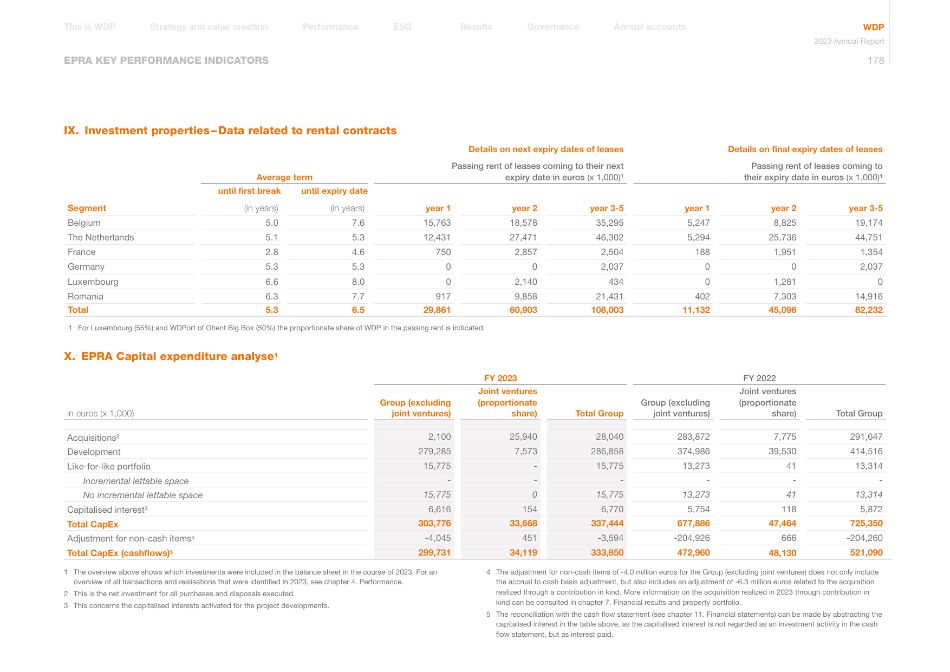
EPRA KEY PERFORMANCE INDICATORS IX. Investment properties – Data related to rental contracts Details on next expiry dates of leases Details on final expiry dates of leases Passing rent of leases coming to their next expiry date in euros (x 1,000)¹ Passing rent of leases coming to their expiry date in euros (x 1.000)¹ Average term until first break until expiry date Segment (in years) (in years) year 1 year 2 year 3-5 year 1 year 2 year 3-5 Belgium 5.0 7.6 15,763 18,578 35,295 5,247 8,825 19,174 The Netherlands 5.1 5.3 12,431 27,471 46,302 5,294 25,736 44,751 France 2.8 4.6 750 2,857 2,504 188 1,951 1,354 Germany 5.3 5.3 0 0 2,037 0 0 2,037 Luxembourg 6.6 8.0 0 2,140 434 0 1,281 0 Romania 6.3 7.7 917 9,858 21,431 402 7,303 14,916 Total 5.3 6.5 29,861 60,903 108,003 11,132 45,096 82,232 1 For Luxembourg (55%) and WDPort of Ghent Big Box (50%) the proportionate share of WDP in the passing rent is indicated. X. EPRA Capital expenditure analyse1 FY 2023 FY 2022 in euros (x 1,000) Group (excluding joint ventures) Joint ventures (proportionate share) Total Group Group (excluding joint ventures) Joint ventures (proportionate share) Total Group Acquisitions² 2,100 25,940 28,040 283,872 7,775 291,647 Development 279,285 7,573 286,858 374,986 39,530 414,516 Like-for-like portfolio 15,775 - 15,775 13,273 41 13,314 Incremental lettable space - - - - - - No incremental lettable space 15,775 0 15,775 13,273 41 13,314 Capitalised interest³ 6,616 154 6,770 5,754 118 5,872 Total CapEx 303,776 33,668 337,444 677,886 47,464 725,350 Adjustment for non-cash items4 -4,045 451 -3,594 -204,926 666 -204,260 Total CapEx (cashflows)5 299,731 34,119 333,850 472,960 48,130 521,090 1 The overview above shows which investments were included in the balance sheet in the course of 2023. For an overview of all transactions and realisations that were identified in 2023, see chapter 4. Performance. 2 This is the net investment for all purchases and disposals executed. 3 This concerns the capitalised interests activated for the project developments. 4 The adjustment for non-cash items of -4.0 million euros for the Group (excluding joint ventures) does not only include the accrual to cash basis adjustment, but also includes an adjustment of -6.3 million euros related to the acquisition realized through a contribution in kind. More information on the acquisition realized in 2023 through contribution in kind can be consulted in chapter 7. Financial results and property portfolio. 5 The reconciliation with the cash flow statement (see chapter 11. Financial statements) can be made by abstracting the capitalised interest in the table above, as the capitalised interest is not regarded as an investment activity in the cash flow statement, but as interest paid. Annual accounts Governance Results Performance Strategy and value creation This is WDP ESG WDP 2023 Annual Report 178
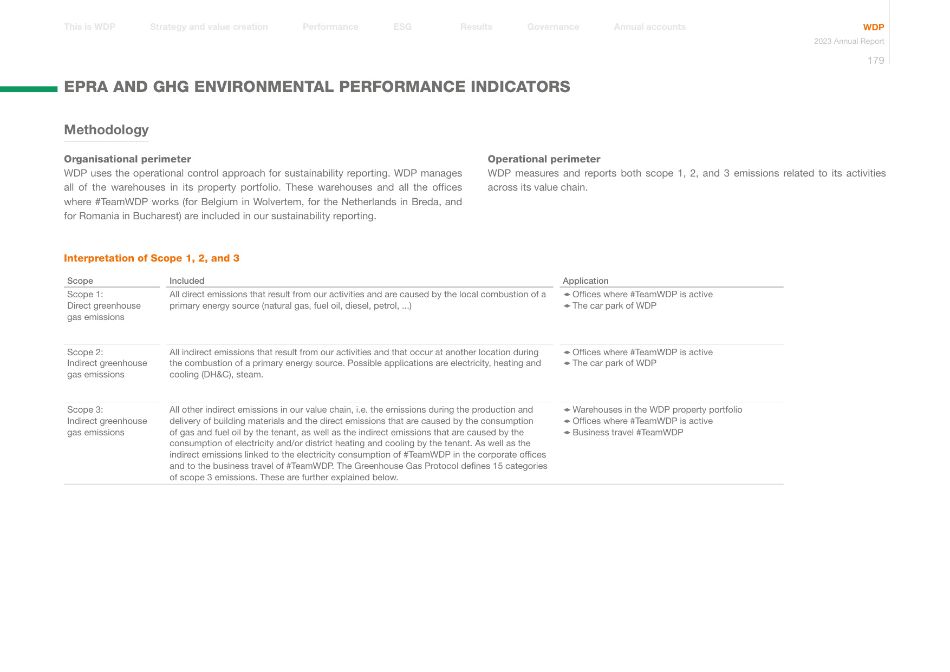
Methodology Organisational perimeter WDP uses the operational control approach for sustainability reporting. WDP manages all of the warehouses in its property portfolio. These warehouses and all the offices where #TeamWDP works (for Belgium in Wolvertem, for the Netherlands in Breda, and for Romania in Bucharest) are included in our sustainability reporting. EPRA AND GHG ENVIRONMENTAL PERFORMANCE INDICATORS Operational perimeter WDP measures and reports both scope 1, 2, and 3 emissions related to its activities across its value chain. Interpretation of Scope 1, 2, and 3 Scope Included Application Scope 1: Direct greenhouse gas emissions All direct emissions that result from our activities and are caused by the local combustion of a primary energy source (natural gas, fuel oil, diesel, petrol, ...) 1 Offices where #TeamWDP is active 1 The car park of WDP Scope 2: Indirect greenhouse gas emissions All indirect emissions that result from our activities and that occur at another location during the combustion of a primary energy source. Possible applications are electricity, heating and cooling (DH&C), steam. 1 Offices where #TeamWDP is active 1 The car park of WDP Scope 3: Indirect greenhouse gas emissions All other indirect emissions in our value chain, i.e. the emissions during the production and delivery of building materials and the direct emissions that are caused by the consumption of gas and fuel oil by the tenant, as well as the indirect emissions that are caused by the consumption of electricity and/or district heating and cooling by the tenant. As well as the indirect emissions linked to the electricity consumption of #TeamWDP in the corporate offices and to the business travel of #TeamWDP. The Greenhouse Gas Protocol defines 15 categories of scope 3 emissions. These are further explained below. 1 Warehouses in the WDP property portfolio 1 Offices where #TeamWDP is active 1 Business travel #TeamWDP Annual accounts Governance Results Performance Strategy and value creation This is WDP ESG WDP 2023 Annual Report 179
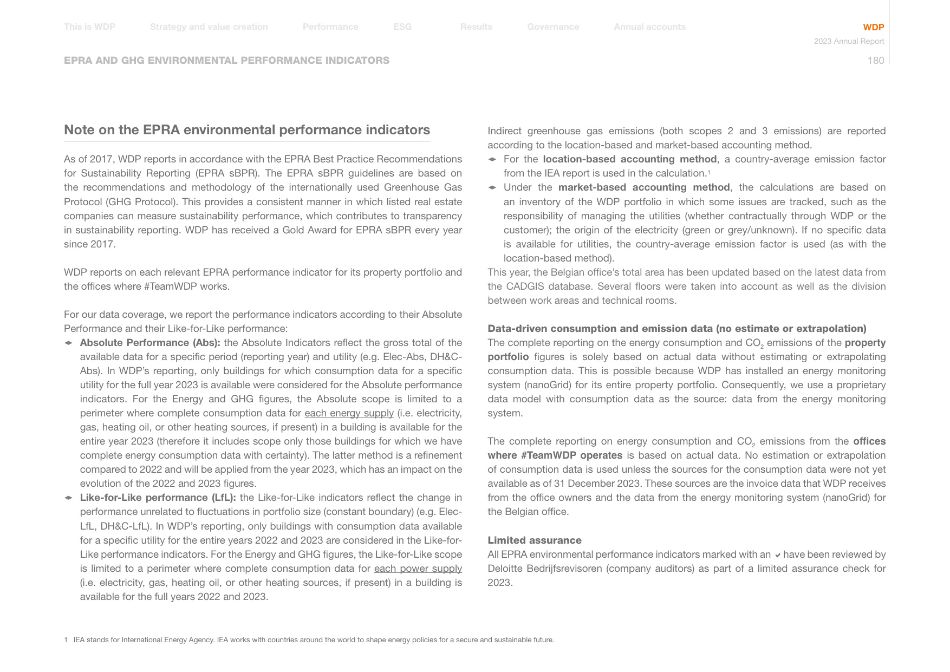
EPRA AND GHG ENVIRONMENTAL PERFORMANCE INDICATORS Note on the EPRA environmental performance indicators As of 2017, WDP reports in accordance with the EPRA Best Practice Recommendations for Sustainability Reporting (EPRA sBPR). The EPRA sBPR guidelines are based on the recommendations and methodology of the internationally used Greenhouse Gas Protocol (GHG Protocol). This provides a consistent manner in which listed real estate companies can measure sustainability performance, which contributes to transparency in sustainability reporting. WDP has received a Gold Award for EPRA sBPR every year since 2017. WDP reports on each relevant EPRA performance indicator for its property portfolio and the offices where #TeamWDP works. For our data coverage, we report the performance indicators according to their Absolute Performance and their Like-for-Like performance: 1 Absolute Performance (Abs): the Absolute Indicators reflect the gross total of the available data for a specific period (reporting year) and utility (e.g. Elec-Abs, DH&C- Abs). In WDP's reporting, only buildings for which consumption data for a specific utility for the full year 2023 is available were considered for the Absolute performance indicators. For the Energy and GHG figures, the Absolute scope is limited to a perimeter where complete consumption data for each energy supply (i.e. electricity, gas, heating oil, or other heating sources, if present) in a building is available for the entire year 2023 (therefore it includes scope only those buildings for which we have complete energy consumption data with certainty). The latter method is a refinement compared to 2022 and will be applied from the year 2023, which has an impact on the evolution of the 2022 and 2023 figures. 1 Like-for-Like performance (LfL): the Like-for-Like indicators reflect the change in performance unrelated to fluctuations in portfolio size (constant boundary) (e.g. Elec- LfL, DH&C-LfL). In WDP's reporting, only buildings with consumption data available for a specific utility for the entire years 2022 and 2023 are considered in the Like-for- Like performance indicators. For the Energy and GHG figures, the Like-for-Like scope is limited to a perimeter where complete consumption data for each power supply (i.e. electricity, gas, heating oil, or other heating sources, if present) in a building is available for the full years 2022 and 2023. 1 IEA stands for International Energy Agency. IEA works with countries around the world to shape energy policies for a secure and sustainable future. Indirect greenhouse gas emissions (both scopes 2 and 3 emissions) are reported according to the location-based and market-based accounting method. 1 For the location-based accounting method, a country-average emission factor from the IEA report is used in the calculation.1 1 Under the market-based accounting method, the calculations are based on an inventory of the WDP portfolio in which some issues are tracked, such as the responsibility of managing the utilities (whether contractually through WDP or the customer); the origin of the electricity (green or grey/unknown). If no specific data is available for utilities, the country-average emission factor is used (as with the location-based method). This year, the Belgian office's total area has been updated based on the latest data from the CADGIS database. Several floors were taken into account as well as the division between work areas and technical rooms. Data-driven consumption and emission data (no estimate or extrapolation) The complete reporting on the energy consumption and CO2 emissions of the property portfolio figures is solely based on actual data without estimating or extrapolating consumption data. This is possible because WDP has installed an energy monitoring system (nanoGrid) for its entire property portfolio. Consequently, we use a proprietary data model with consumption data as the source: data from the energy monitoring system. The complete reporting on energy consumption and CO2 emissions from the offices where #TeamWDP operates is based on actual data. No estimation or extrapolation of consumption data is used unless the sources for the consumption data were not yet available as of 31 December 2023. These sources are the invoice data that WDP receives from the office owners and the data from the energy monitoring system (nanoGrid) for the Belgian office. Limited assurance All EPRA environmental performance indicators marked with an ahave been reviewed by Deloitte Bedrijfsrevisoren (company auditors) as part of a limited assurance check for 2023. Annual accounts Governance Results Performance Strategy and value creation This is WDP ESG WDP 2023 Annual Report 180
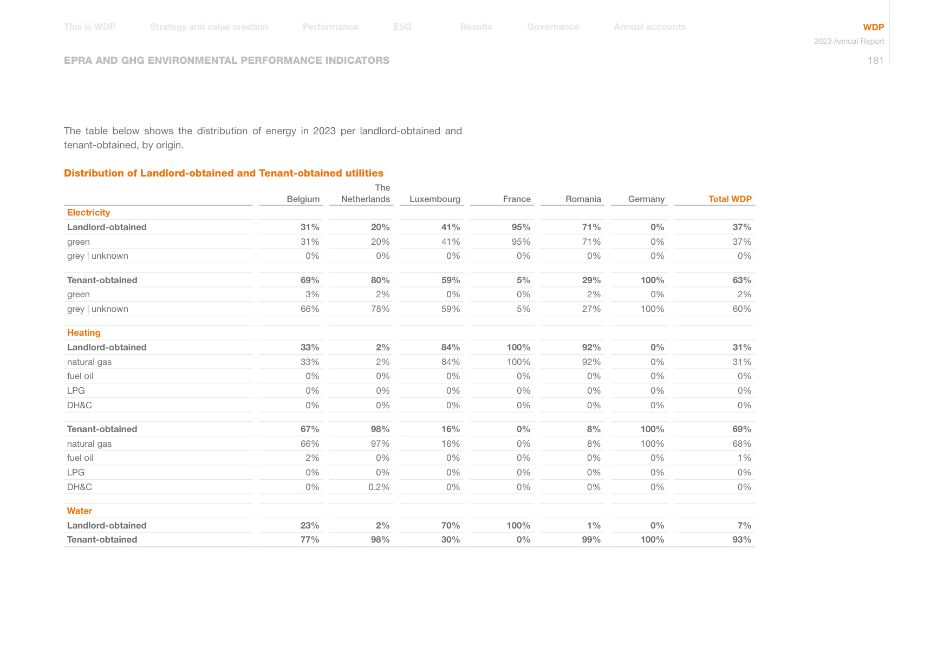
EPRA AND GHG ENVIRONMENTAL PERFORMANCE INDICATORS The table below shows the distribution of energy in 2023 per landlord-obtained and tenant-obtained, by origin. Distribution of Landlord-obtained and Tenant-obtained utilities Belgium The Netherlands Luxembourg France Romania Germany Total WDP Electricity Landlord-obtained 31% 20% 41% 95% 71% 0% 37% green 31% 20% 41% 95% 71% 0% 37% grey | unknown 0% 0% 0% 0% 0% 0% 0% Tenant-obtained 69% 80% 59% 5% 29% 100% 63% green 3% 2% 0% 0% 2% 0% 2% grey | unknown 66% 78% 59% 5% 27% 100% 60% Heating Landlord-obtained 33% 2% 84% 100% 92% 0% 31% natural gas 33% 2% 84% 100% 92% 0% 31% fuel oil 0% 0% 0% 0% 0% 0% 0% LPG 0% 0% 0% 0% 0% 0% 0% DH&C 0% 0% 0% 0% 0% 0% 0% Tenant-obtained 67% 98% 16% 0% 8% 100% 69% natural gas 66% 97% 16% 0% 8% 100% 68% fuel oil 2% 0% 0% 0% 0% 0% 1% LPG 0% 0% 0% 0% 0% 0% 0% DH&C 0% 0.2% 0% 0% 0% 0% 0% Water Landlord-obtained 23% 2% 70% 100% 1% 0% 7% Tenant-obtained 77% 98% 30% 0% 99% 100% 93% Annual accounts Governance Results Performance Strategy and value creation This is WDP ESG WDP 2023 Annual Report 181
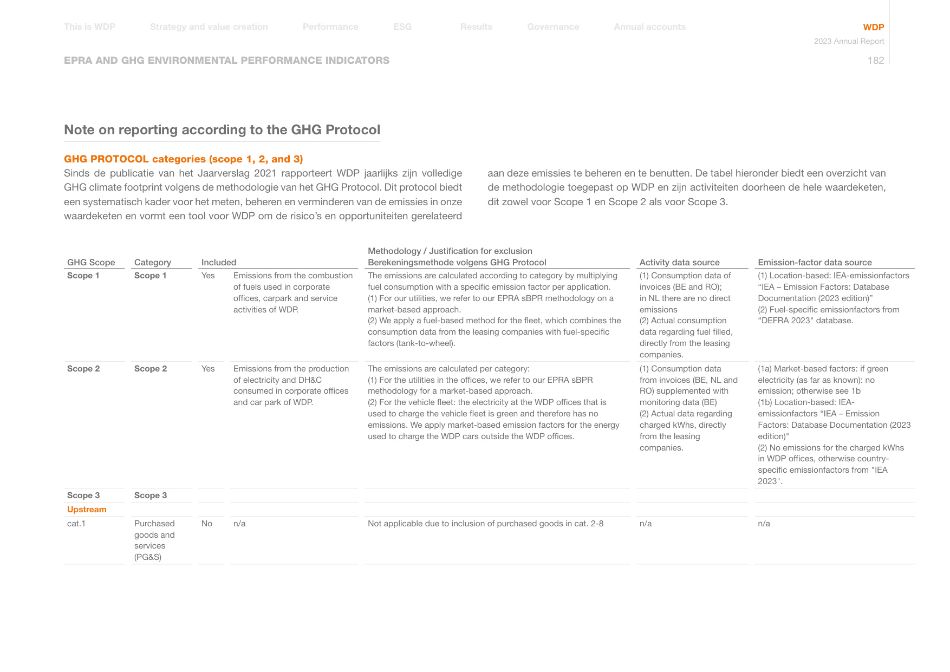
EPRA AND GHG ENVIRONMENTAL PERFORMANCE INDICATORS Note on reporting according to the GHG Protocol GHG PROTOCOL categories (scope 1, 2, and 3) Sinds de publicatie van het Jaarverslag 2021 rapporteert WDP jaarlijks zijn volledige GHG climate footprint volgens de methodologie van het GHG Protocol. Dit protocol biedt een systematisch kader voor het meten, beheren en verminderen van de emissies in onze waardeketen en vormt een tool voor WDP om de risico's en opportuniteiten gerelateerd aan deze emissies te beheren en te benutten. De tabel hieronder biedt een overzicht van de methodologie toegepast op WDP en zijn activiteiten doorheen de hele waardeketen, dit zowel voor Scope 1 en Scope 2 als voor Scope 3. GHG Scope Category Included Methodology / Justification for exclusion Berekeningsmethode volgens GHG Protocol Activity data source Emission-factor data source Scope 1 Scope 1 Yes Emissions from the combustion of fuels used in corporate offices, carpark and service activities of WDP. The emissions are calculated according to category by multiplying fuel consumption with a specific emission factor per application. (1) For our utilities, we refer to our EPRA sBPR methodology on a market-based approach. (2) We apply a fuel-based method for the fleet, which combines the consumption data from the leasing companies with fuel-specific factors (tank-to-wheel). (1) Consumption data of invoices (BE and RO); in NL there are no direct emissions (2) Actual consumption data regarding fuel filled, directly from the leasing companies. (1) Location-based: IEA-emissionfactors "IEA – Emission Factors: Database Documentation (2023 edition)" (2) Fuel-specific emissionfactors from "DEFRA 2023" database. Scope 2 Scope 2 Yes Emissions from the production of electricity and DH&C consumed in corporate offices and car park of WDP. The emissions are calculated per category: (1) For the utilities in the offices, we refer to our EPRA sBPR methodology for a market-based approach. (2) For the vehicle fleet: the electricity at the WDP offices that is used to charge the vehicle fleet is green and therefore has no emissions. We apply market-based emission factors for the energy used to charge the WDP cars outside the WDP offices. (1) Consumption data from invoices (BE, NL and RO) supplemented with monitoring data (BE) (2) Actual data regarding charged kWhs, directly from the leasing companies. (1a) Market-based factors: if green electricity (as far as known): no emission; otherwise see 1b (1b) Location-based: IEA- emissionfactors "IEA – Emission Factors: Database Documentation (2023 edition)" (2) No emissions for the charged kWhs in WDP offices, otherwise country- specific emissionfactors from "IEA 2023". Scope 3 Scope 3 Upstream cat.1 Purchased goods and services (PG&S) No n/a Not applicable due to inclusion of purchased goods in cat. 2-8 n/a n/a Annual accounts Governance Results Performance Strategy and value creation This is WDP ESG WDP 2023 Annual Report 182
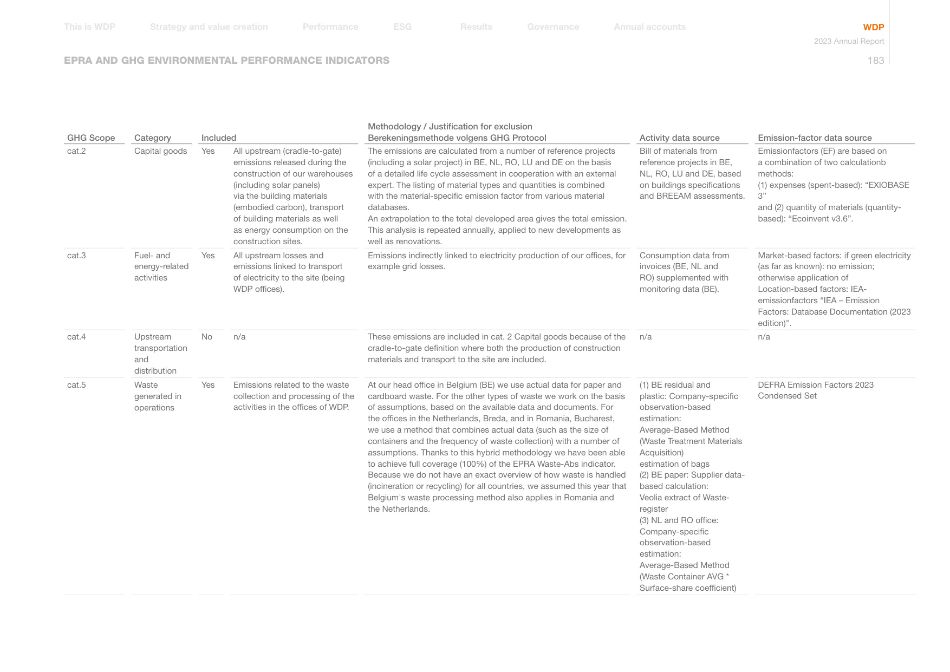
EPRA AND GHG ENVIRONMENTAL PERFORMANCE INDICATORS GHG Scope Category Included Methodology / Justification for exclusion Berekeningsmethode volgens GHG Protocol Activity data source Emission-factor data source cat.2 Capital goods Yes All upstream (cradle-to-gate) emissions released during the construction of our warehouses (including solar panels) via the building materials (embodied carbon), transport of building materials as well as energy consumption on the construction sites. The emissions are calculated from a number of reference projects (including a solar project) in BE, NL, RO, LU and DE on the basis of a detailed life cycle assessment in cooperation with an external expert. The listing of material types and quantities is combined with the material-specific emission factor from various material databases. An extrapolation to the total developed area gives the total emission. This analysis is repeated annually, applied to new developments as well as renovations. Bill of materials from reference projects in BE, NL, RO, LU and DE, based on buildings specifications and BREEAM assessments. Emissionfactors (EF) are based on a combination of two calculationb methods: (1) expenses (spent-based): "EXIOBASE 3" and (2) quantity of materials (quantity- based): "Ecoinvent v3.6". cat.3 Fuel- and energy-related activities Yes All upstream losses and emissions linked to transport of electricity to the site (being WDP offices). Emissions indirectly linked to electricity production of our offices, for example grid losses. Consumption data from invoices (BE, NL and RO) supplemented with monitoring data (BE). Market-based factors: if green electricity (as far as known): no emission; otherwise application of Location-based factors: IEA- emissionfactors "IEA – Emission Factors: Database Documentation (2023 edition)". cat.4 Upstream transportation and distribution No n/a These emissions are included in cat. 2 Capital goods because of the cradle-to-gate definition where both the production of construction materials and transport to the site are included. n/a n/a cat.5 Waste generated in operations Yes Emissions related to the waste collection and processing of the activities in the offices of WDP. At our head office in Belgium (BE) we use actual data for paper and cardboard waste. For the other types of waste we work on the basis of assumptions, based on the available data and documents. For the offices in the Netherlands, Breda, and in Romania, Bucharest, we use a method that combines actual data (such as the size of containers and the frequency of waste collection) with a number of assumptions. Thanks to this hybrid methodology we have been able to achieve full coverage (100%) of the EPRA Waste-Abs indicator. Because we do not have an exact overview of how waste is handled (incineration or recycling) for all countries, we assumed this year that Belgium's waste processing method also applies in Romania and the Netherlands. (1) BE residual and plastic: Company-specific observation-based estimation: Average-Based Method (Waste Treatment Materials Acquisition) estimation of bags (2) BE paper: Supplier data- based calculation: Veolia extract of Waste- register (3) NL and RO office: Company-specific observation-based estimation: Average-Based Method (Waste Container AVG * Surface-share coefficient) DEFRA Emission Factors 2023 Condensed Set Annual accounts Governance Results Performance Strategy and value creation This is WDP ESG WDP 2023 Annual Report 183
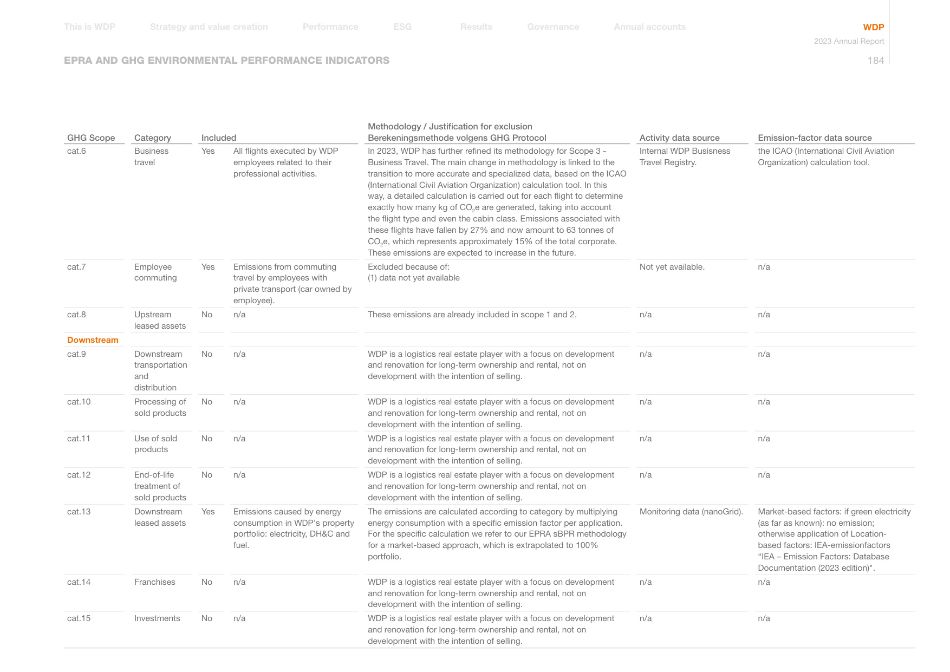
EPRA AND GHG ENVIRONMENTAL PERFORMANCE INDICATORS GHG Scope Category Included Methodology / Justification for exclusion Berekeningsmethode volgens GHG Protocol Activity data source Emission-factor data source cat.6 Business travel Yes All flights executed by WDP employees related to their professional activities. In 2023, WDP has further refined its methodology for Scope 3 - Business Travel. The main change in methodology is linked to the transition to more accurate and specialized data, based on the ICAO (International Civil Aviation Organization) calculation tool. In this way, a detailed calculation is carried out for each flight to determine exactly how many kg of CO2e are generated, taking into account the flight type and even the cabin class. Emissions associated with these flights have fallen by 27% and now amount to 63 tonnes of CO2e, which represents approximately 15% of the total corporate. These emissions are expected to increase in the future. Internal WDP Busisness Travel Registry. the ICAO (International Civil Aviation Organization) calculation tool. cat.7 Employee commuting Yes Emissions from commuting travel by employees with private transport (car owned by employee). Excluded because of: (1) data not yet available Not yet available. n/a cat.8 Upstream leased assets No n/a These emissions are already included in scope 1 and 2. n/a n/a Downstream cat.9 Downstream transportation and distribution No n/a WDP is a logistics real estate player with a focus on development and renovation for long-term ownership and rental, not on development with the intention of selling. n/a n/a cat.10 Processing of sold products No n/a WDP is a logistics real estate player with a focus on development and renovation for long-term ownership and rental, not on development with the intention of selling. n/a n/a cat.11 Use of sold products No n/a WDP is a logistics real estate player with a focus on development and renovation for long-term ownership and rental, not on development with the intention of selling. n/a n/a cat.12 End-of-life treatment of sold products No n/a WDP is a logistics real estate player with a focus on development and renovation for long-term ownership and rental, not on development with the intention of selling. n/a n/a cat.13 Downstream leased assets Yes Emissions caused by energy consumption in WDP's property portfolio: electricity, DH&C and fuel. The emissions are calculated according to category by multiplying energy consumption with a specific emission factor per application. For the specific calculation we refer to our EPRA sBPR methodology for a market-based approach, which is extrapolated to 100% portfolio. Monitoring data (nanoGrid). Market-based factors: if green electricity (as far as known): no emission; otherwise application of Location- based factors: IEA-emissionfactors "IEA – Emission Factors: Database Documentation (2023 edition)". cat.14 Franchises No n/a WDP is a logistics real estate player with a focus on development and renovation for long-term ownership and rental, not on development with the intention of selling. n/a n/a cat.15 Investments No n/a WDP is a logistics real estate player with a focus on development and renovation for long-term ownership and rental, not on development with the intention of selling. n/a n/a Annual accounts Governance Results Performance Strategy and value creation This is WDP ESG WDP 2023 Annual Report 184
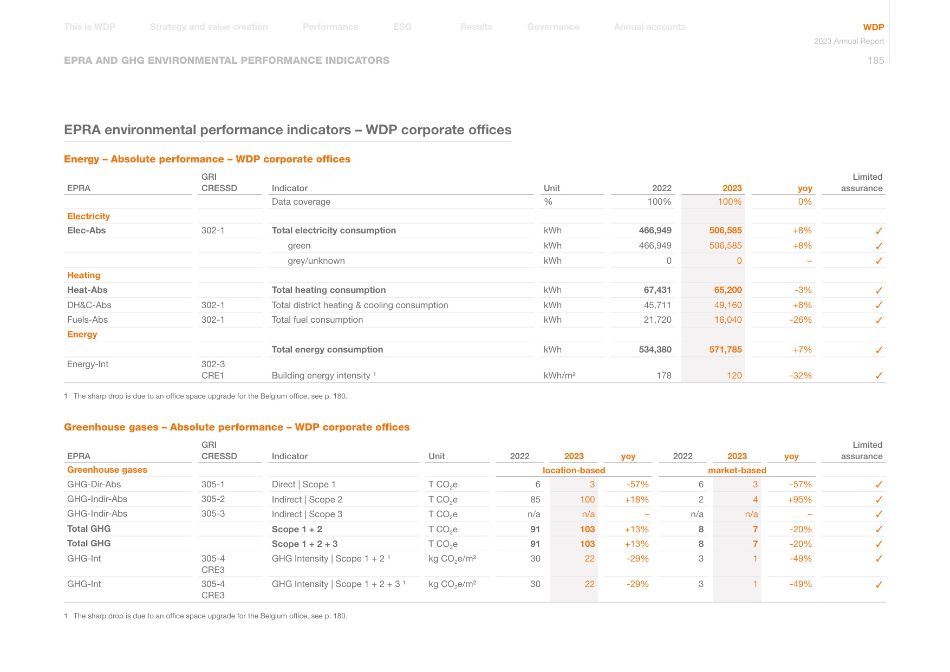
EPRA AND GHG ENVIRONMENTAL PERFORMANCE INDICATORS EPRA environmental performance indicators – WDP corporate offices Energy – Absolute performance – WDP corporate offices EPRA GRI CRESSD Indicator Unit 2022 2023 yoy Limited assurance Data coverage % 100% 100% 0% Electricity Elec-Abs 302-1 Total electricity consumption kWh 466,949 506,585 +8% ✓ green kWh 466,949 506,585 +8% ✓ grey/unknown kWh 0 0 – ✓ Heating Heat-Abs Total heating consumption kWh 67,431 65,200 -3% ✓ DH&C-Abs 302-1 Total district heating & cooling consumption kWh 45,711 49,160 +8% ✓ Fuels-Abs 302-1 Total fuel consumption kWh 21,720 16,040 -26% ✓ Energy Total energy consumption kWh 534,380 571,785 +7% ✓ Energy-Int 302-3 CRE1 Building energy intensity ¹ kWh/m² 178 120 -32% ✓ 1 The sharp drop is due to an office space upgrade for the Belgium office, see p. 180. Greenhouse gases – Absolute performance – WDP corporate offices EPRA GRI CRESSD Indicator Unit 2022 2023 yoy 2022 2023 yoy Limited assurance Greenhouse gases location-based market-based GHG-Dir-Abs 305-1 Direct | Scope 1 T CO2e 6 3 -57% 6 3 -57% ✓ GHG-Indir-Abs 305-2 Indirect | Scope 2 T CO2e 85 100 +18% 2 4 +95% ✓ GHG-Indir-Abs 305-3 Indirect | Scope 3 T CO2e n/a n/a – n/a n/a – ✓ Total GHG Scope 1 + 2 T CO2e 91 103 +13% 8 7 -20% ✓ Total GHG Scope 1 + 2 + 3 T CO2e 91 103 +13% 8 7 -20% ✓ GHG-Int 305-4 CRE3 GHG Intensity | Scope 1 + 2 ¹ kg CO2e/m² 30 22 -29% 3 1 -49% ✓ GHG-Int 305-4 CRE3 GHG Intensity | Scope 1 + 2 + 3 ¹ kg CO2e/m² 30 22 -29% 3 1 -49% ✓ 1 The sharp drop is due to an office space upgrade for the Belgium office, see p. 180. Annual accounts Governance Results Performance Strategy and value creation This is WDP ESG WDP 2023 Annual Report 185
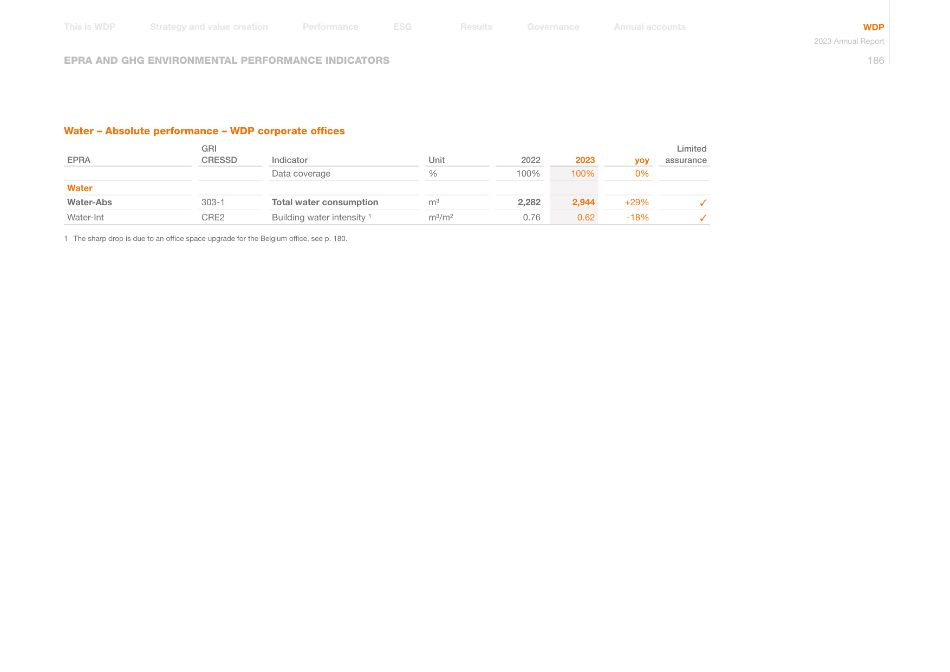
EPRA AND GHG ENVIRONMENTAL PERFORMANCE INDICATORS Water – Absolute performance – WDP corporate offices EPRA GRI CRESSD Indicator Unit 2022 2023 yoy Limited assurance Data coverage % 100% 100% 0% Water Water-Abs 303-1 Total water consumption m³ 2,282 2,944 +29% ✓ Water-Int CRE2 Building water intensity ¹ m³/m² 0.76 0.62 -18% ✓ 1 The sharp drop is due to an office space upgrade for the Belgium office, see p. 180. Annual accounts Governance Results Performance Strategy and value creation This is WDP ESG WDP 2023 Annual Report 186
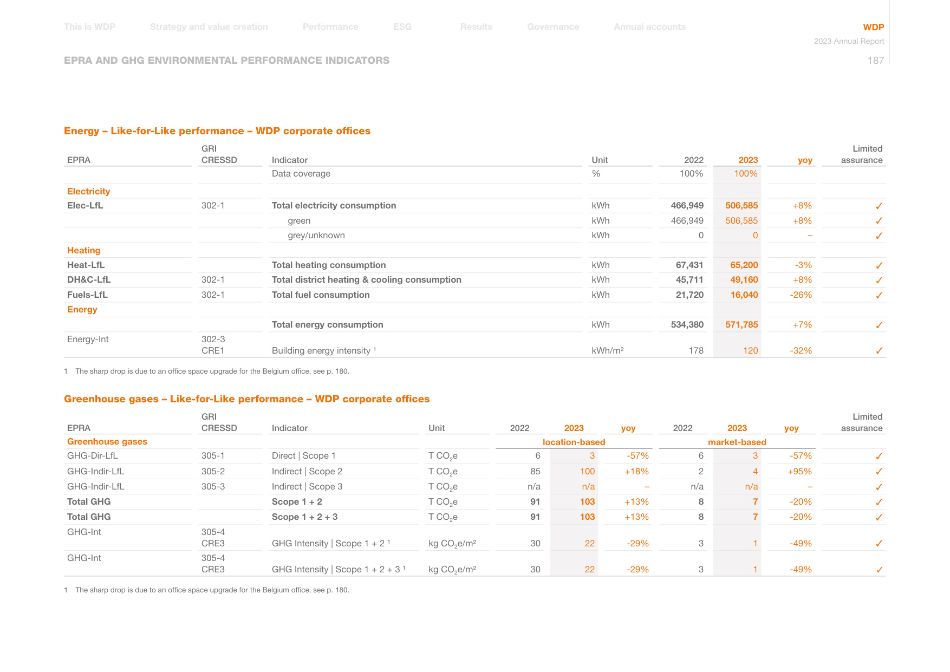
EPRA AND GHG ENVIRONMENTAL PERFORMANCE INDICATORS Energy – Like-for-Like performance – WDP corporate offices EPRA GRI CRESSD Indicator Unit 2022 2023 yoy Limited assurance Data coverage % 100% 100% Electricity Elec-LfL 302-1 Total electricity consumption kWh 466,949 506,585 +8% ✓ green kWh 466,949 506,585 +8% ✓ grey/unknown kWh 0 0 – ✓ Heating Heat-LfL Total heating consumption kWh 67,431 65,200 -3% ✓ DH&C-LfL 302-1 Total district heating & cooling consumption kWh 45,711 49,160 +8% ✓ Fuels-LfL 302-1 Total fuel consumption kWh 21,720 16,040 -26% ✓ Energy Total energy consumption kWh 534,380 571,785 +7% ✓ Energy-Int 302-3 CRE1 Building energy intensity ¹ kWh/m² 178 120 -32% ✓ 1 The sharp drop is due to an office space upgrade for the Belgium office, see p. 180. Greenhouse gases – Like-for-Like performance – WDP corporate offices EPRA GRI CRESSD Indicator Unit 2022 2023 yoy 2022 2023 yoy Limited assurance Greenhouse gases location-based market-based GHG-Dir-LfL 305-1 Direct | Scope 1 T CO2e 6 3 -57% 6 3 -57% ✓ GHG-Indir-LfL 305-2 Indirect | Scope 2 T CO2e 85 100 +18% 2 4 +95% ✓ GHG-Indir-LfL 305-3 Indirect | Scope 3 T CO2e n/a n/a – n/a n/a – ✓ Total GHG Scope 1 + 2 T CO2e 91 103 +13% 8 7 -20% ✓ Total GHG Scope 1 + 2 + 3 T CO2e 91 103 +13% 8 7 -20% ✓ GHG-Int 305-4 CRE3 GHG Intensity | Scope 1 + 2 ¹ kg CO2e/m² 30 22 -29% 3 1 -49% ✓ GHG-Int 305-4 CRE3 GHG Intensity | Scope 1 + 2 + 3 ¹ kg CO2e/m² 30 22 -29% 3 1 -49% ✓ 1 The sharp drop is due to an office space upgrade for the Belgium office, see p. 180. Annual accounts Governance Results Performance Strategy and value creation This is WDP ESG WDP 2023 Annual Report 187
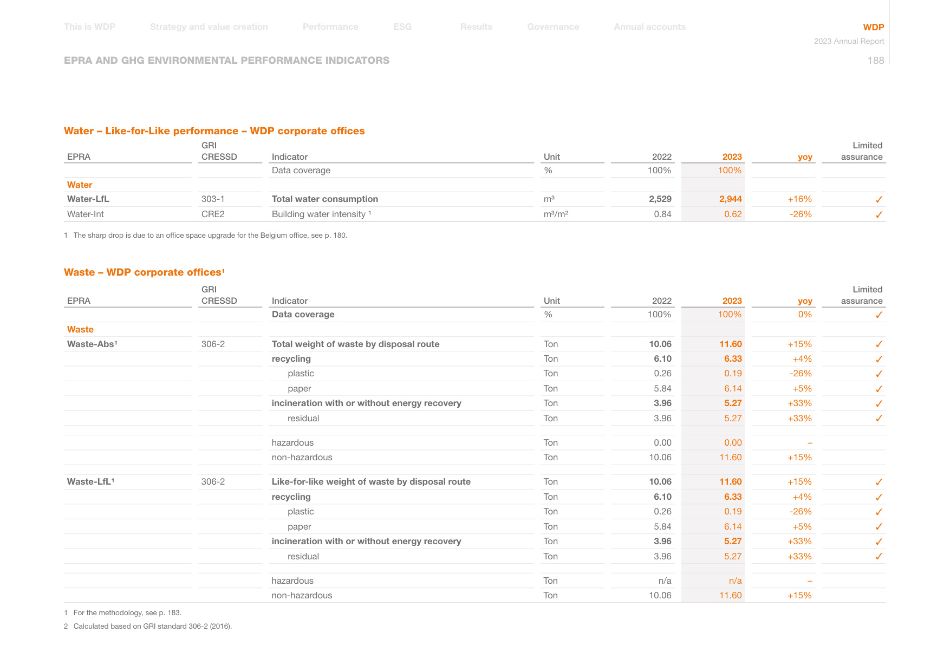
EPRA AND GHG ENVIRONMENTAL PERFORMANCE INDICATORS Water – Like-for-Like performance – WDP corporate offices EPRA GRI CRESSD Indicator Unit 2022 2023 yoy Limited assurance Data coverage % 100% 100% Water Water-LfL 303-1 Total water consumption m³ 2,529 2,944 +16% ✓ Water-Int CRE2 Building water intensity ¹ m³/m² 0.84 0.62 -26% ✓ 1 The sharp drop is due to an office space upgrade for the Belgium office, see p. 180. Waste – WDP corporate offices1 EPRA GRI CRESSD Indicator Unit 2022 2023 yoy Limited assurance Data coverage % 100% 100% 0% ✓ Waste Waste-Abs¹ 306-2 Total weight of waste by disposal route Ton 10.06 11.60 +15% ✓ recycling Ton 6.10 6.33 +4% ✓ plastic Ton 0.26 0.19 -26% ✓ paper Ton 5.84 6.14 +5% ✓ incineration with or without energy recovery Ton 3.96 5.27 +33% ✓ residual Ton 3.96 5.27 +33% ✓ hazardous Ton 0.00 0.00 – non-hazardous Ton 10.06 11.60 +15% Waste-LfL¹ 306-2 Like-for-like weight of waste by disposal route Ton 10.06 11.60 +15% ✓ recycling Ton 6.10 6.33 +4% ✓ plastic Ton 0.26 0.19 -26% ✓ paper Ton 5.84 6.14 +5% ✓ incineration with or without energy recovery Ton 3.96 5.27 +33% ✓ residual Ton 3.96 5.27 +33% ✓ hazardous Ton n/a n/a – non-hazardous Ton 10.06 11.60 +15% 1 For the methodology, see p. 183. 2 Calculated based on GRI standard 306-2 (2016). Annual accounts Governance Results Performance Strategy and value creation This is WDP ESG WDP 2023 Annual Report 188
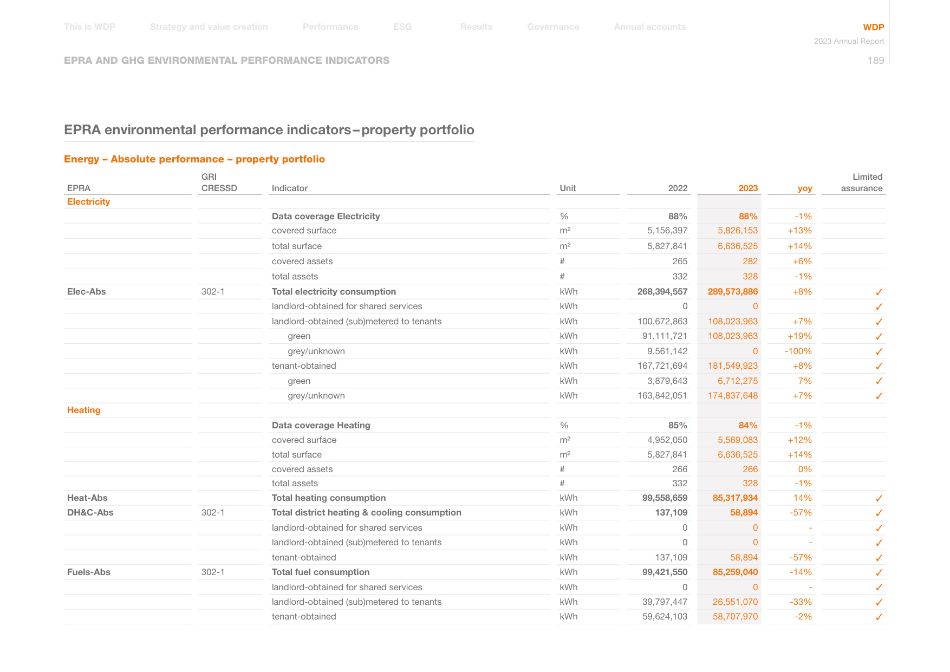
EPRA AND GHG ENVIRONMENTAL PERFORMANCE INDICATORS EPRA environmental performance indicators – property portfolio Energy – Absolute performance – property portfolio EPRA GRI CRESSD Indicator Unit 2022 2023 yoy Limited assurance Electricity Data coverage Electricity % 88% 88% -1% covered surface m² 5,156,397 5,826,153 +13% total surface m² 5,827,841 6,636,525 +14% covered assets # 265 282 +6% total assets # 332 328 -1% Elec-Abs 302-1 Total electricity consumption kWh 268,394,557 289,573,886 +8% ✓ landlord-obtained for shared services kWh 0 0 ✓ landlord-obtained (sub)metered to tenants kWh 100,672,863 108,023,963 +7% ✓ green kWh 91,111,721 108,023,963 +19% ✓ grey/unknown kWh 9,561,142 0 -100% ✓ tenant-obtained kWh 167,721,694 181,549,923 +8% ✓ green kWh 3,879,643 6,712,275 7% ✓ grey/unknown kWh 163,842,051 174,837,648 +7% ✓ Heating Data coverage Heating % 85% 84% -1% covered surface m² 4,952,050 5,569,083 +12% total surface m² 5,827,841 6,636,525 +14% covered assets # 266 266 0% total assets # 332 328 -1% Heat-Abs Total heating consumption kWh 99,558,659 85,317,934 14% ✓ DH&C-Abs 302-1 Total district heating & cooling consumption kWh 137,109 58,894 -57% ✓ landlord-obtained for shared services kWh 0 0 - ✓ landlord-obtained (sub)metered to tenants kWh 0 0 - ✓ tenant-obtained kWh 137,109 58,894 -57% ✓ Fuels-Abs 302-1 Total fuel consumption kWh 99,421,550 85,259,040 -14% ✓ landlord-obtained for shared services kWh 0 0 - ✓ landlord-obtained (sub)metered to tenants kWh 39,797,447 26,551,070 -33% ✓ tenant-obtained kWh 59,624,103 58,707,970 -2% ✓ Annual accounts Governance Results Performance Strategy and value creation This is WDP ESG WDP 2023 Annual Report 189
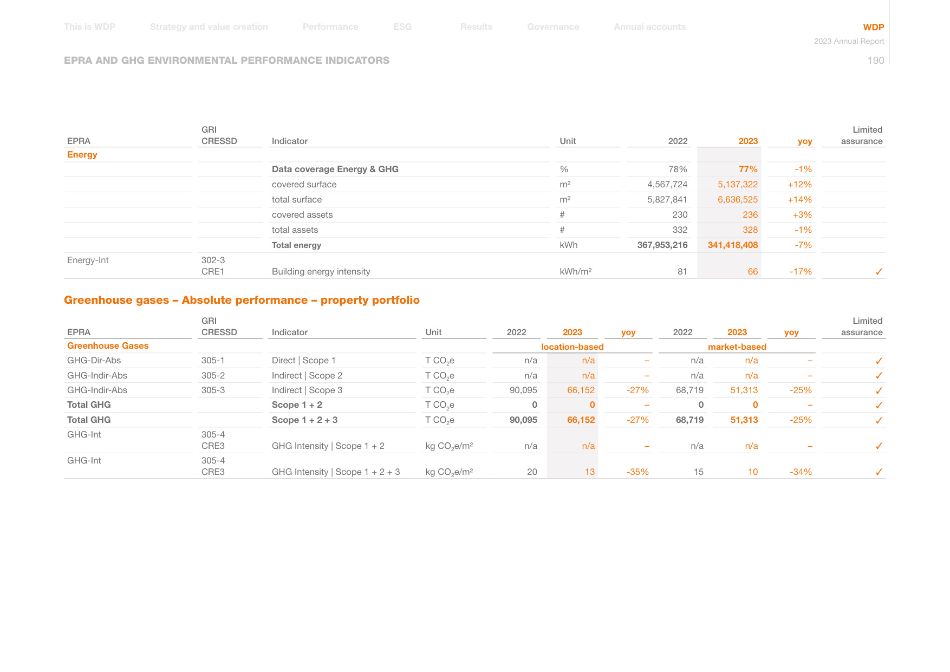
EPRA AND GHG ENVIRONMENTAL PERFORMANCE INDICATORS EPRA GRI CRESSD Indicator Unit 2022 2023 yoy Limited assurance Energy Data coverage Energy & GHG % 78% 77% -1% covered surface m² 4,567,724 5,137,322 +12% total surface m² 5,827,841 6,636,525 +14% covered assets # 230 236 +3% total assets # 332 328 -1% Total energy kWh 367,953,216 341,418,408 -7% Energy-Int 302-3 CRE1 Building energy intensity kWh/m² 81 66 -17% ✓ Greenhouse gases – Absolute performance – property portfolio EPRA GRI CRESSD Indicator Unit 2022 2023 yoy 2022 2023 yoy Limited assurance Greenhouse Gases location-based market-based GHG-Dir-Abs 305-1 Direct | Scope 1 T CO2e n/a n/a – n/a n/a – ✓ GHG-Indir-Abs 305-2 Indirect | Scope 2 T CO2e n/a n/a – n/a n/a – ✓ GHG-Indir-Abs 305-3 Indirect | Scope 3 T CO2e 90,095 66,152 -27% 68,719 51,313 -25% ✓ Total GHG Scope 1 + 2 T CO2e 0 0 – 0 0 – ✓ Total GHG Scope 1 + 2 + 3 T CO2e 90,095 66,152 -27% 68,719 51,313 -25% ✓ GHG-Int 305-4 CRE3 GHG Intensity | Scope 1 + 2 kg CO2e/m² n/a n/a – n/a n/a – ✓ GHG-Int 305-4 CRE3 GHG Intensity | Scope 1 + 2 + 3 kg CO2e/m² 20 13 -35% 15 10 -34% ✓ Annual accounts Governance Results Performance Strategy and value creation This is WDP ESG WDP 2023 Annual Report 190
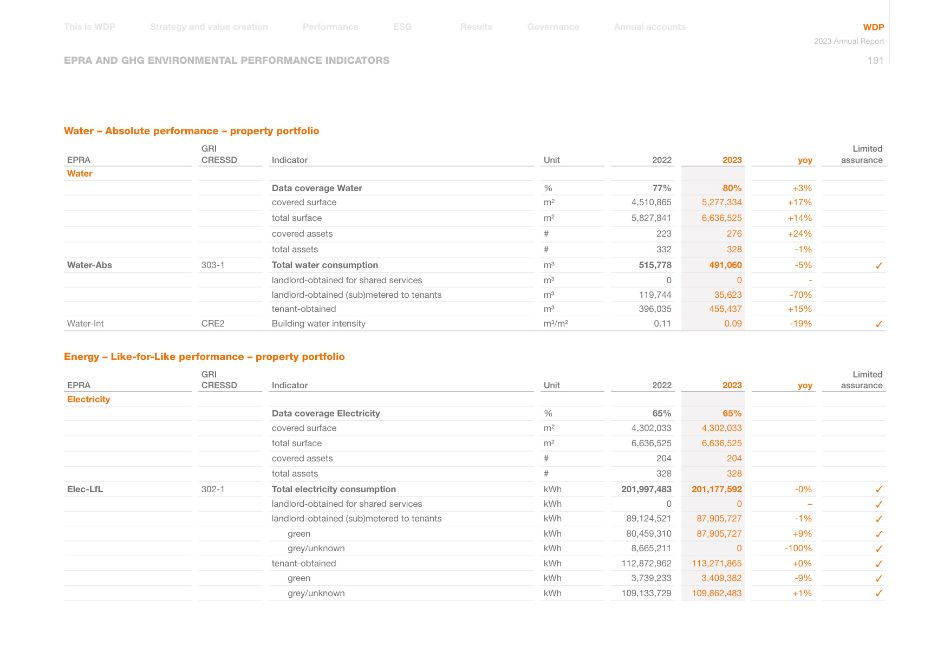
EPRA AND GHG ENVIRONMENTAL PERFORMANCE INDICATORS Water – Absolute performance – property portfolio EPRA GRI CRESSD Indicator Unit 2022 2023 yoy Limited assurance Water Data coverage Water % 77% 80% +3% covered surface m² 4,510,865 5,277,334 +17% total surface m² 5,827,841 6,636,525 +14% covered assets # 223 276 +24% total assets # 332 328 -1% Water-Abs 303-1 Total water consumption m³ 515,778 491,060 -5% ✓ landlord-obtained for shared services m³ 0 0 - landlord-obtained (sub)metered to tenants m³ 119,744 35,623 -70% tenant-obtained m³ 396,035 455,437 +15% Water-Int CRE2 Building water intensity m³/m² 0.11 0.09 -19% ✓ Energy – Like-for-Like performance – property portfolio EPRA GRI CRESSD Indicator Unit 2022 2023 yoy Limited assurance Electricity Data coverage Electricity % 65% 65% covered surface m² 4,302,033 4,302,033 total surface m² 6,636,525 6,636,525 covered assets # 204 204 total assets # 328 328 Elec-LfL 302-1 Total electricity consumption kWh 201,997,483 201,177,592 -0% ✓ landlord-obtained for shared services kWh 0 0 – ✓ landlord-obtained (sub)metered to tenants kWh 89,124,521 87,905,727 -1% ✓ green kWh 80,459,310 87,905,727 +9% ✓ grey/unknown kWh 8,665,211 0 -100% ✓ tenant-obtained kWh 112,872,962 113,271,865 +0% ✓ green kWh 3,739,233 3,409,382 -9% ✓ grey/unknown kWh 109,133,729 109,862,483 +1% ✓ Annual accounts Governance Results Performance Strategy and value creation This is WDP ESG WDP 2023 Annual Report 191
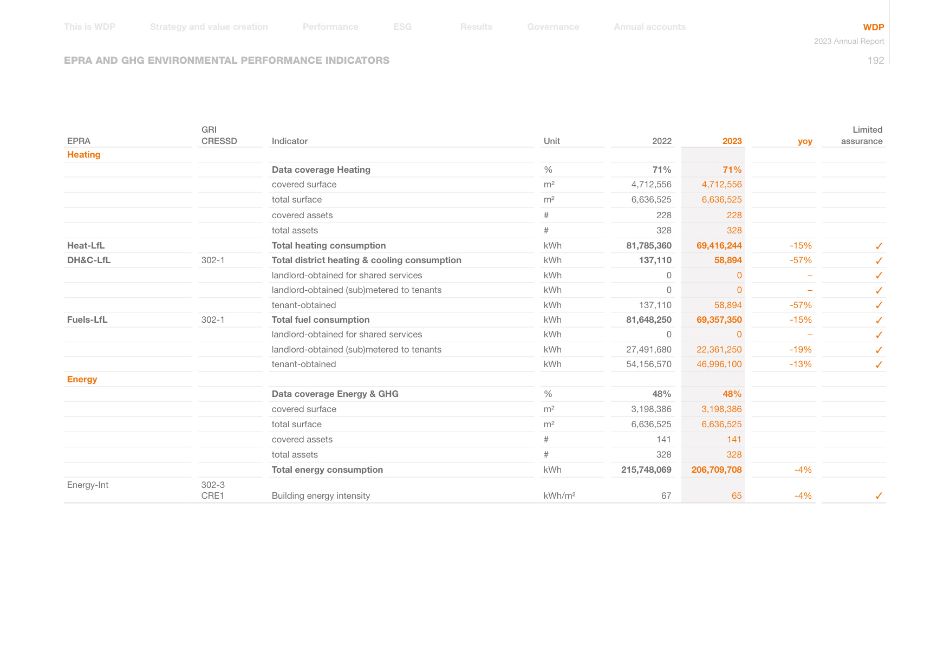
EPRA AND GHG ENVIRONMENTAL PERFORMANCE INDICATORS EPRA GRI CRESSD Indicator Unit 2022 2023 yoy Limited assurance Heating Data coverage Heating % 71% 71% covered surface m² 4,712,556 4,712,556 total surface m² 6,636,525 6,636,525 covered assets # 228 228 total assets # 328 328 Heat-LfL Total heating consumption kWh 81,785,360 69,416,244 -15% ✓ DH&C-LfL 302-1 Total district heating & cooling consumption kWh 137,110 58,894 -57% ✓ landlord-obtained for shared services kWh 0 0 – ✓ landlord-obtained (sub)metered to tenants kWh 0 0 – ✓ tenant-obtained kWh 137,110 58,894 -57% ✓ Fuels-LfL 302-1 Total fuel consumption kWh 81,648,250 69,357,350 -15% ✓ landlord-obtained for shared services kWh 0 0 – ✓ landlord-obtained (sub)metered to tenants kWh 27,491,680 22,361,250 -19% ✓ tenant-obtained kWh 54,156,570 46,996,100 -13% ✓ Energy Data coverage Energy & GHG % 48% 48% covered surface m² 3,198,386 3,198,386 total surface m² 6,636,525 6,636,525 covered assets # 141 141 total assets # 328 328 Total energy consumption kWh 215,748,069 206,709,708 -4% Energy-Int 302-3 CRE1 Building energy intensity kWh/m² 67 65 -4% ✓ Annual accounts Governance Results Performance Strategy and value creation This is WDP ESG WDP 2023 Annual Report 192
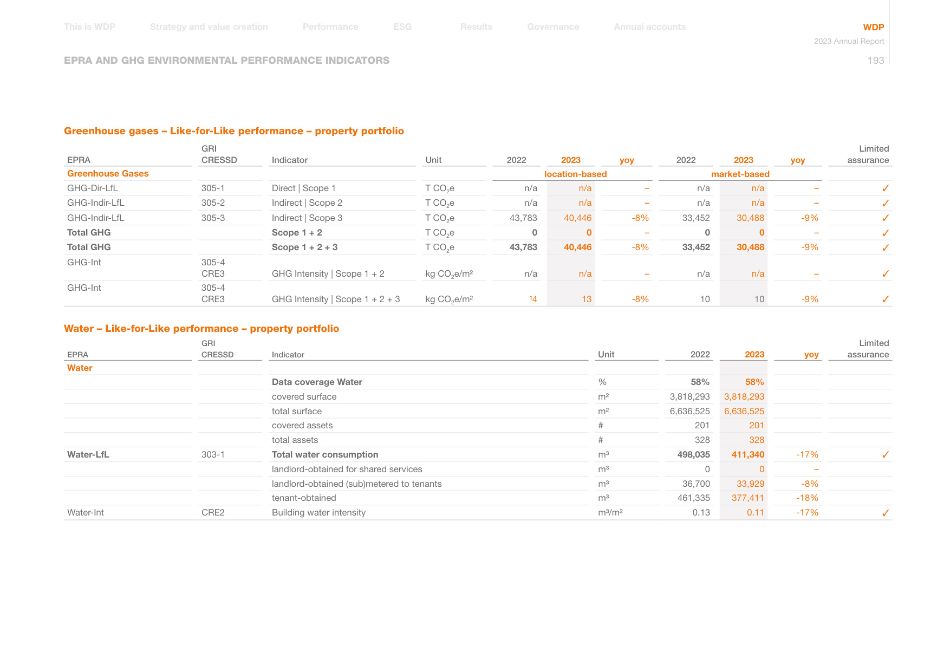
EPRA AND GHG ENVIRONMENTAL PERFORMANCE INDICATORS Greenhouse gases – Like-for-Like performance – property portfolio EPRA GRI CRESSD Indicator Unit 2022 2023 yoy 2022 2023 yoy Limited assurance Greenhouse Gases location-based market-based GHG-Dir-LfL 305-1 Direct | Scope 1 T CO2e n/a n/a – n/a n/a – ✓ GHG-Indir-LfL 305-2 Indirect | Scope 2 T CO2e n/a n/a – n/a n/a – ✓ GHG-Indir-LfL 305-3 Indirect | Scope 3 T CO2e 43,783 40,446 -8% 33,452 30,488 -9% ✓ Total GHG Scope 1 + 2 T CO2e 0 0 – 0 0 – ✓ Total GHG Scope 1 + 2 + 3 T CO2e 43,783 40,446 -8% 33,452 30,488 -9% ✓ GHG-Int 305-4 CRE3 GHG Intensity | Scope 1 + 2 kg CO2e/m² n/a n/a – n/a n/a – ✓ GHG-Int 305-4 CRE3 GHG Intensity | Scope 1 + 2 + 3 kg CO2e/m² 14 13 -8% 10 10 -9% ✓ Water – Like-for-Like performance – property portfolio EPRA GRI CRESSD Indicator Unit 2022 2023 yoy Limited assurance Water Data coverage Water % 58% 58% covered surface m² 3,818,293 3,818,293 total surface m² 6,636,525 6,636,525 covered assets # 201 201 total assets # 328 328 Water-LfL 303-1 Total water consumption m³ 498,035 411,340 -17% ✓ landlord-obtained for shared services m³ 0 0 – landlord-obtained (sub)metered to tenants m³ 36,700 33,929 -8% tenant-obtained m³ 461,335 377,411 -18% Water-Int CRE2 Building water intensity m³/m² 0.13 0.11 -17% ✓ Annual accounts Governance Results Performance Strategy and value creation This is WDP ESG WDP 2023 Annual Report 193
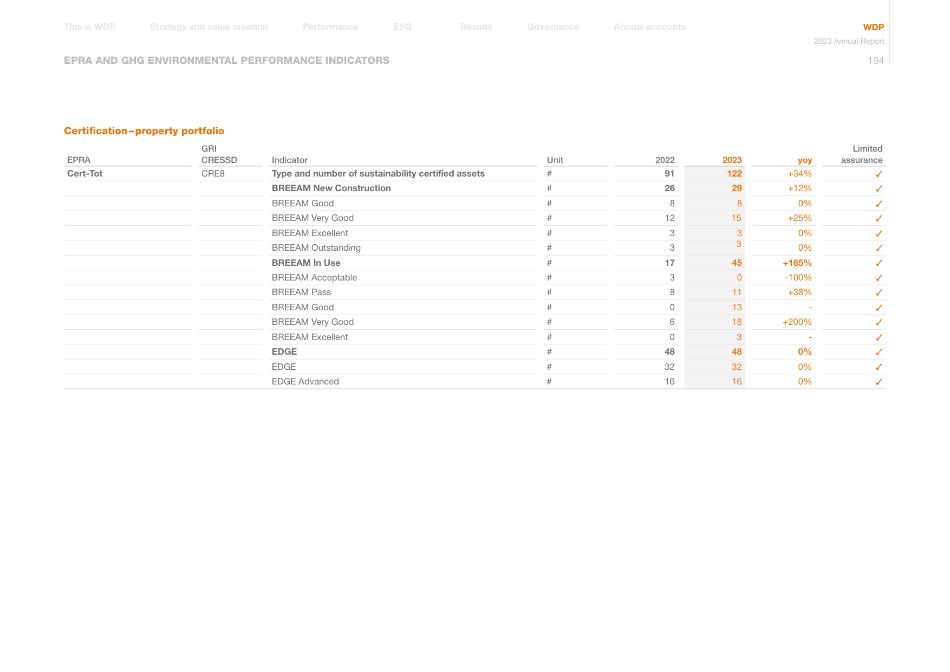
EPRA AND GHG ENVIRONMENTAL PERFORMANCE INDICATORS Certification – property portfolio EPRA GRI CRESSD Indicator Unit 2022 2023 yoy Limited assurance Cert-Tot CRE8 Type and number of sustainability certified assets # 91 122 +34% ✓ BREEAM New Construction # 26 29 +12% ✓ BREEAM Good # 8 8 0% ✓ BREEAM Very Good # 12 15 +25% ✓ BREEAM Excellent # 3 3 0% ✓ BREEAM Outstanding # 3 3 0% ✓ BREEAM In Use # 17 45 +165% ✓ BREEAM Acceptable # 3 0 -100% ✓ BREEAM Pass # 8 11 +38% ✓ BREEAM Good # 0 13 - ✓ BREEAM Very Good # 6 18 +200% ✓ BREEAM Excellent # 0 3 - ✓ EDGE # 48 48 0% ✓ EDGE # 32 32 0% ✓ EDGE Advanced # 16 16 0% ✓ Annual accounts Governance Results Performance Strategy and value creation This is WDP ESG WDP 2023 Annual Report 194
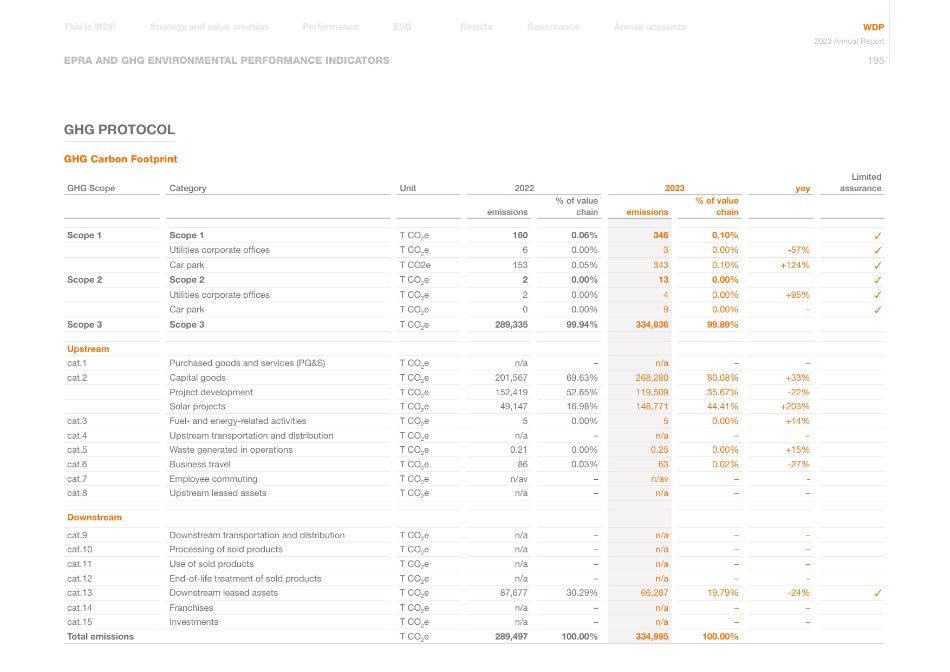
EPRA AND GHG ENVIRONMENTAL PERFORMANCE INDICATORS GHG PROTOCOL GHG Carbon Footprint GHG Scope Category Unit 2022 2023 yoy Limited assurance emissions % of value chain emissions % of value chain Scope 1 Scope 1 T CO2e 160 0.06% 346 0.10% ✓ Utilities corporate offices T CO2e 6 0.00% 3 0.00% -57% ✓ Car park T CO2e 153 0.05% 343 0.10% +124% ✓ Scope 2 Scope 2 T CO2e 2 0.00% 13 0.00% ✓ Utilities corporate offices T CO2e 2 0.00% 4 0.00% +95% ✓ Car park T CO2e 0 0.00% 9 0.00% – ✓ Scope 3 Scope 3 T CO2e 289,335 99.94% 334,636 99.89% Upstream cat.1 Purchased goods and services (PG&S) T CO2e n/a – n/a – – cat.2 Capital goods T CO2e 201,567 69.63% 268,280 80.08% +33% Project development T CO2e 152,419 52.65% 119,509 35.67% -22% Solar projects T CO2e 49,147 16.98% 148,771 44.41% +203% cat.3 Fuel- and energy-related activities T CO2e 5 0.00% 5 0.00% +14% cat.4 Upstream transportation and distribution T CO2e n/a – n/a – – cat.5 Waste generated in operations T CO2e 0.21 0.00% 0.25 0.00% +15% cat.6 Business travel T CO2e 86 0.03% 63 0.02% -27% cat.7 Employee commuting T CO2e n/av – n/av – - cat.8 Upstream leased assets T CO2e n/a – n/a – – Downstream cat.9 Downstream transportation and distribution T CO2e n/a – n/a – – cat.10 Processing of sold products T CO2e n/a – n/a – – cat.11 Use of sold products T CO2e n/a – n/a – – cat.12 End-of-life treatment of sold products T CO2e n/a – n/a – – cat.13 Downstream leased assets T CO2e 87,677 30.29% 66,287 19.79% -24% ✓ cat.14 Franchises T CO2e n/a – n/a – – cat.15 Investments T CO2e n/a – n/a – – Total emissions T CO2e 289,497 100.00% 334,995 100.00% Annual accounts Governance Results Performance Strategy and value creation This is WDP ESG WDP 2023 Annual Report 195
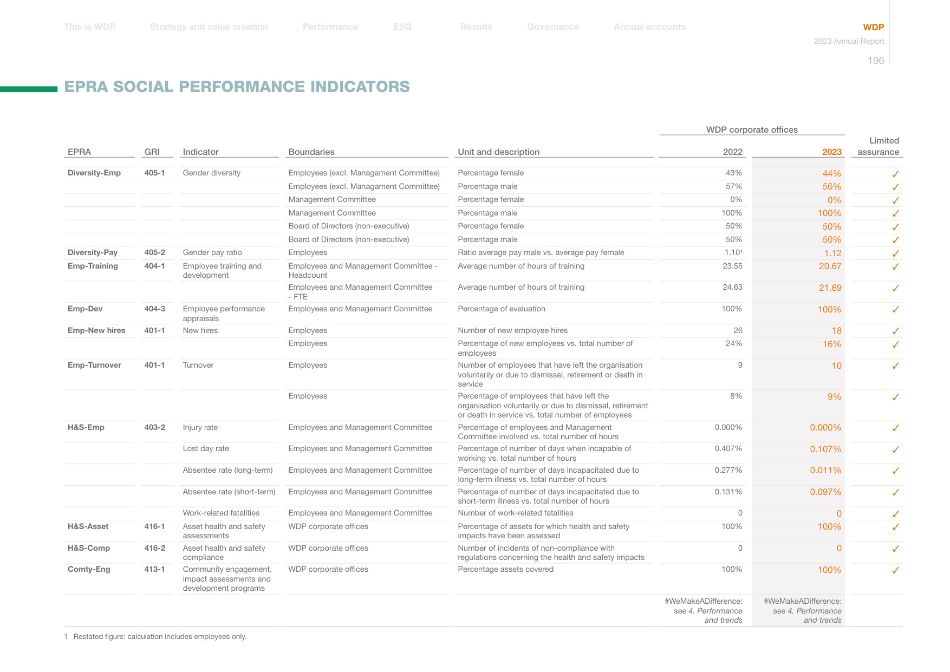
WDP corporate offices EPRA GRI Indicator Boundaries Unit and description 2022 2023 Limited assurance Diversity-Emp 405-1 Gender diversity Employees (excl. Managament Committee) Percentage female 43% 44% ✓ Employees (excl. Managament Committee) Percentage male 57% 56% ✓ Management Committee Percentage female 0% 0% ✓ Management Committee Percentage male 100% 100% ✓ Board of Directors (non-executive) Percentage female 50% 50% ✓ Board of Directors (non-executive) Percentage male 50% 50% ✓ Diversity-Pay 405-2 Gender pay ratio Employees Ratio average pay male vs. average pay female 1.101 1.12 ✓ Emp-Training 404-1 Employee training and development Employees and Management Committee - Headcount Average number of hours of training 23.55 20.67 ✓ Employees and Management Committee - FTE Average number of hours of training 24.63 21.69 ✓ Emp-Dev 404-3 Employee performance appraisals Employees and Management Committee Percentage of evaluation 100% 100% ✓ Emp-New hires 401-1 New hires Employees Number of new employee hires 26 18 ✓ Employees Percentage of new employees vs. total number of employees 24% 16% ✓ Emp-Turnover 401-1 Turnover Employees Number of employees that have left the organisation voluntarily or due to dismissal, retirement or death in service 9 10 ✓ Employees Percentage of employees that have left the organisation voluntarily or due to dismissal, retirement or death in service vs. total number of employees 8% 9% ✓ H&S-Emp 403-2 Injury rate Employees and Management Committee Percentage of employees and Management Committee involved vs. total number of hours 0.000% 0.000% ✓ Lost day rate Employees and Management Committee Percentage of number of days when incapable of working vs. total number of hours 0.407% 0.107% ✓ Absentee rate (long-term) Employees and Management Committee Percentage of number of days incapacitated due to long-term illness vs. total number of hours 0.277% 0.011% ✓ Absentee rate (short-term) Employees and Management Committee Percentage of number of days incapacitated due to short-term illness vs. total number of hours 0.131% 0.097% ✓ Work-related fatalities Employees and Management Committee Number of work-related fatalities 0 0 ✓ H&S-Asset 416-1 Asset health and safety assessments WDP corporate offices Percentage of assets for which health and safety impacts have been assessed 100% 100% ✓ H&S-Comp 416-2 Asset health and safety compliance WDP corporate offices Number of incidents of non-compliance with regulations concerning the health and safety impacts 0 0 ✓ Comty-Eng 413-1 Community engagement, impact assessments and development programs WDP corporate offices Percentage assets covered 100% 100% ✓ #WeMakeADifference: see 4. Performance and trends #WeMakeADifference: see 4. Performance and trends EPRA SOCIAL PERFORMANCE INDICATORS 1 Restated figure: calculation includes employees only. Annual accounts Governance Results Performance Strategy and value creation This is WDP ESG WDP 2023 Annual Report 196
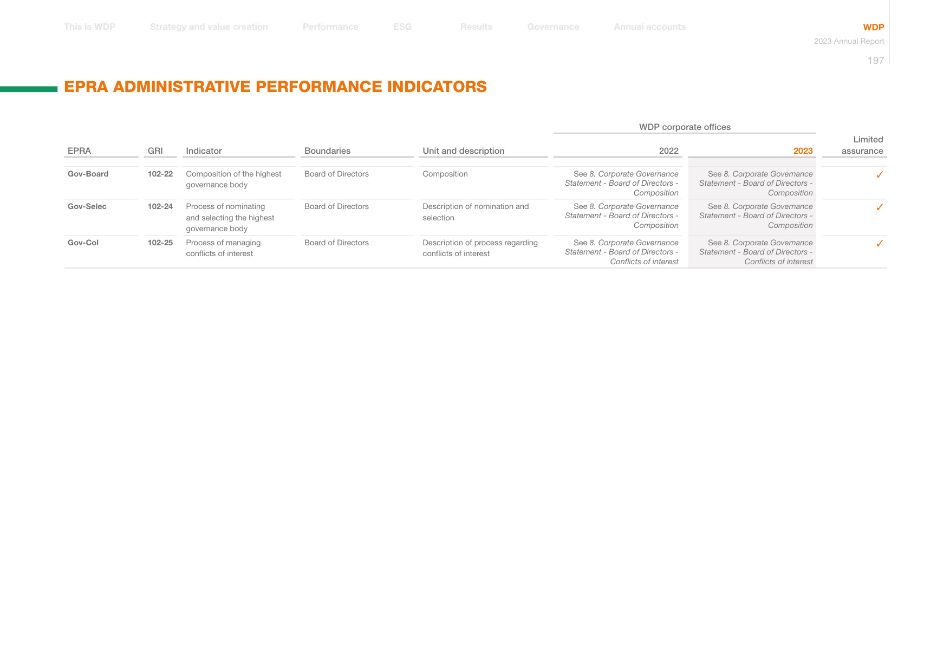
WDP corporate offices EPRA GRI Indicator Boundaries Unit and description 2022 2023 Limited assurance Gov-Board 102-22 Composition of the highest governance body Board of Directors Composition See 8. Corporate Governance Statement - Board of Directors - Composition See 8. Corporate Governance Statement - Board of Directors - Composition ✓ Gov-Selec 102-24 Process of nominating and selecting the highest governance body Board of Directors Description of nomination and selection See 8. Corporate Governance Statement - Board of Directors - Composition See 8. Corporate Governance Statement - Board of Directors - Composition ✓ Gov-Col 102-25 Process of managing conflicts of interest Board of Directors Description of process regarding conflicts of interest See 8. Corporate Governance Statement - Board of Directors - Conflicts of interest See 8. Corporate Governance Statement - Board of Directors - Conflicts of interest ✓ EPRA ADMINISTRATIVE PERFORMANCE INDICATORS Annual accounts Governance Results Performance Strategy and value creation This is WDP ESG WDP 2023 Annual Report 197
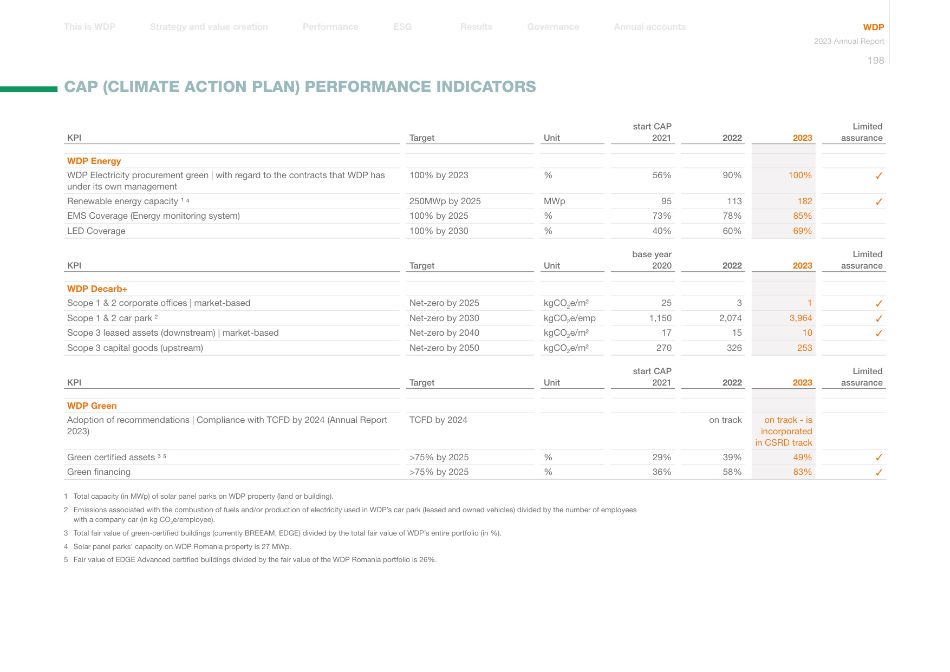
KPI Target Unit start CAP 2021 2022 2023 Limited assurance WDP Energy WDP Electricity procurement green | with regard to the contracts that WDP has under its own management 100% by 2023 % 56% 90% 100% ✓ Renewable energy capacity ¹ 4 250MWp by 2025 MWp 95 113 182 ✓ EMS Coverage (Energy monitoring system) 100% by 2025 % 73% 78% 85% LED Coverage 100% by 2030 % 40% 60% 69% KPI Target Unit base year 2020 2022 2023 Limited assurance WDP Decarb+ Scope 1 & 2 corporate offices | market-based Net-zero by 2025 kgCO2e/m² 25 3 1 ✓ Scope 1 & 2 car park ² Net-zero by 2030 kgCO2e/emp 1,150 2,074 3,964 ✓ Scope 3 leased assets (downstream) | market-based Net-zero by 2040 kgCO2e/m² 17 15 10 ✓ Scope 3 capital goods (upstream) Net-zero by 2050 kgCO2e/m² 270 326 253 KPI Target Unit start CAP 2021 2022 2023 Limited assurance WDP Green Adoption of recommendations | Compliance with TCFD by 2024 (Annual Report 2023) TCFD by 2024 on track on track - is incorporated in CSRD track Green certified assets ³ 5 >75% by 2025 % 29% 39% 49% ✓ Green financing >75% by 2025 % 36% 58% 83% ✓ 1 Total capacity (in MWp) of solar panel parks on WDP property (land or building). 2 Emissions associated with the combustion of fuels and/or production of electricity used in WDP's car park (leased and owned vehicles) divided by the number of employees with a company car (in kg CO2e/employee). 3 Total fair value of green-certified buildings (currently BREEAM, EDGE) divided by the total fair value of WDP's entire portfolio (in %). 4 Solar panel parks' capacity on WDP Romania property is 27 MWp. 5 Fair value of EDGE Advanced certified buildings divided by the fair value of the WDP Romania portfolio is 26%. CAP (CLIMATE ACTION PLAN) PERFORMANCE INDICATORS Annual accounts Governance Results Performance Strategy and value creation This is WDP ESG WDP 2023 Annual Report 198
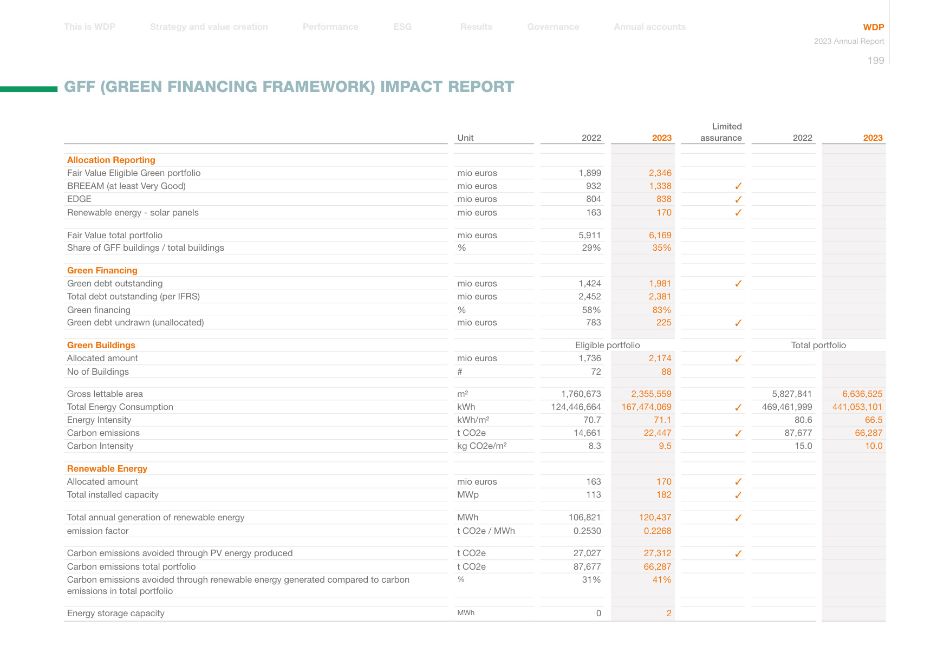
Unit 2022 2023 Limited assurance 2022 2023 Allocation Reporting Fair Value Eligible Green portfolio mio euros 1,899 2,346 BREEAM (at least Very Good) mio euros 932 1,338 ✓ EDGE mio euros 804 838 ✓ Renewable energy - solar panels mio euros 163 170 ✓ Fair Value total portfolio mio euros 5,911 6,169 Share of GFF buildings / total buildings % 29% 35% Green Financing Green debt outstanding mio euros 1,424 1,981 ✓ Total debt outstanding (per IFRS) mio euros 2,452 2,381 Green financing % 58% 83% Green debt undrawn (unallocated) mio euros 783 225 ✓ Green Buildings Eligible portfolio Total portfolio Allocated amount mio euros 1,736 2,174 ✓ No of Buildings # 72 88 Gross lettable area m² 1,760,673 2,355,559 5,827,841 6,636,525 Total Energy Consumption kWh 124,446,664 167,474,069 ✓ 469,461,999 441,053,101 Energy Intensity kWh/m² 70.7 71.1 80.6 66.5 Carbon emissions t CO2e 14,661 22,447 ✓ 87,677 66,287 Carbon Intensity kg CO2e/m² 8.3 9.5 15.0 10.0 Renewable Energy Allocated amount mio euros 163 170 ✓ Total installed capacity MWp 113 182 ✓ Total annual generation of renewable energy MWh 106,821 120,437 ✓ emission factor t CO2e / MWh 0.2530 0.2268 Carbon emissions avoided through PV energy produced t CO2e 27,027 27,312 ✓ Carbon emissions total portfolio t CO2e 87,677 66,287 Carbon emissions avoided through renewable energy generated compared to carbon emissions in total portfolio % 31% 41% Energy storage capacity MWh 0 2 GFF (GREEN FINANCING FRAMEWORK) IMPACT REPORT Annual accounts Governance Results Performance Strategy and value creation This is WDP ESG WDP 2023 Annual Report 199
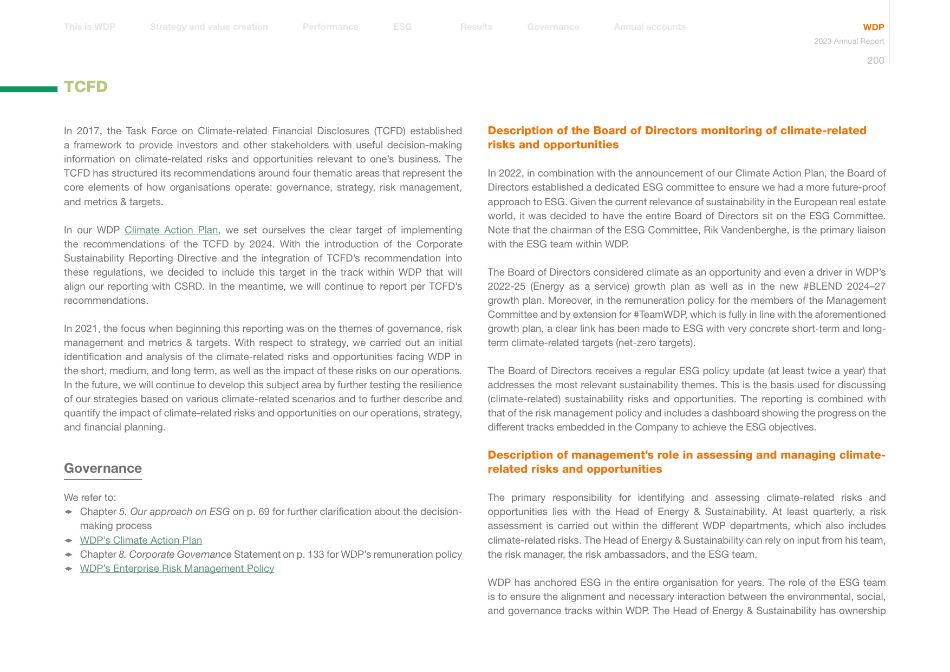
In 2017, the Task Force on Climate-related Financial Disclosures (TCFD) established a framework to provide investors and other stakeholders with useful decision-making information on climate-related risks and opportunities relevant to one's business. The TCFD has structured its recommendations around four thematic areas that represent the core elements of how organisations operate: governance, strategy, risk management, and metrics & targets. In our WDP Climate Action Plan, we set ourselves the clear target of implementing the recommendations of the TCFD by 2024. With the introduction of the Corporate Sustainability Reporting Directive and the integration of TCFD's recommendation into these regulations, we decided to include this target in the track within WDP that will align our reporting with CSRD. In the meantime, we will continue to report per TCFD's recommendations. In 2021, the focus when beginning this reporting was on the themes of governance, risk management and metrics & targets. With respect to strategy, we carried out an initial identification and analysis of the climate-related risks and opportunities facing WDP in the short, medium, and long term, as well as the impact of these risks on our operations. In the future, we will continue to develop this subject area by further testing the resilience of our strategies based on various climate-related scenarios and to further describe and quantify the impact of climate-related risks and opportunities on our operations, strategy, and financial planning. Governance We refer to: 1 Chapter 5. Our approach on ESG on p. 69 for further clarification about the decision- making process 1 WDP's Climate Action Plan 1 Chapter 8. Corporate Governance Statement on p. 133 for WDP's remuneration policy 1 WDP's Enterprise Risk Management Policy Description of the Board of Directors monitoring of climate-related risks and opportunities In 2022, in combination with the announcement of our Climate Action Plan, the Board of Directors established a dedicated ESG committee to ensure we had a more future-proof approach to ESG. Given the current relevance of sustainability in the European real estate world, it was decided to have the entire Board of Directors sit on the ESG Committee. Note that the chairman of the ESG Committee, Rik Vandenberghe, is the primary liaison with the ESG team within WDP. The Board of Directors considered climate as an opportunity and even a driver in WDP's 2022-25 (Energy as a service) growth plan as well as in the new #BLEND 2024–27 growth plan. Moreover, in the remuneration policy for the members of the Management Committee and by extension for #TeamWDP, which is fully in line with the aforementioned growth plan, a clear link has been made to ESG with very concrete short-term and long- term climate-related targets (net-zero targets). The Board of Directors receives a regular ESG policy update (at least twice a year) that addresses the most relevant sustainability themes. This is the basis used for discussing (climate-related) sustainability risks and opportunities. The reporting is combined with that of the risk management policy and includes a dashboard showing the progress on the different tracks embedded in the Company to achieve the ESG objectives. Description of management's role in assessing and managing climate- related risks and opportunities The primary responsibility for identifying and assessing climate-related risks and opportunities lies with the Head of Energy & Sustainability. At least quarterly, a risk assessment is carried out within the different WDP departments, which also includes climate-related risks. The Head of Energy & Sustainability can rely on input from his team, the risk manager, the risk ambassadors, and the ESG team. WDP has anchored ESG in the entire organisation for years. The role of the ESG team is to ensure the alignment and necessary interaction between the environmental, social, and governance tracks within WDP. The Head of Energy & Sustainability has ownership TCFD Annual accounts Governance Results Performance Strategy and value creation This is WDP ESG WDP 2023 Annual Report 200
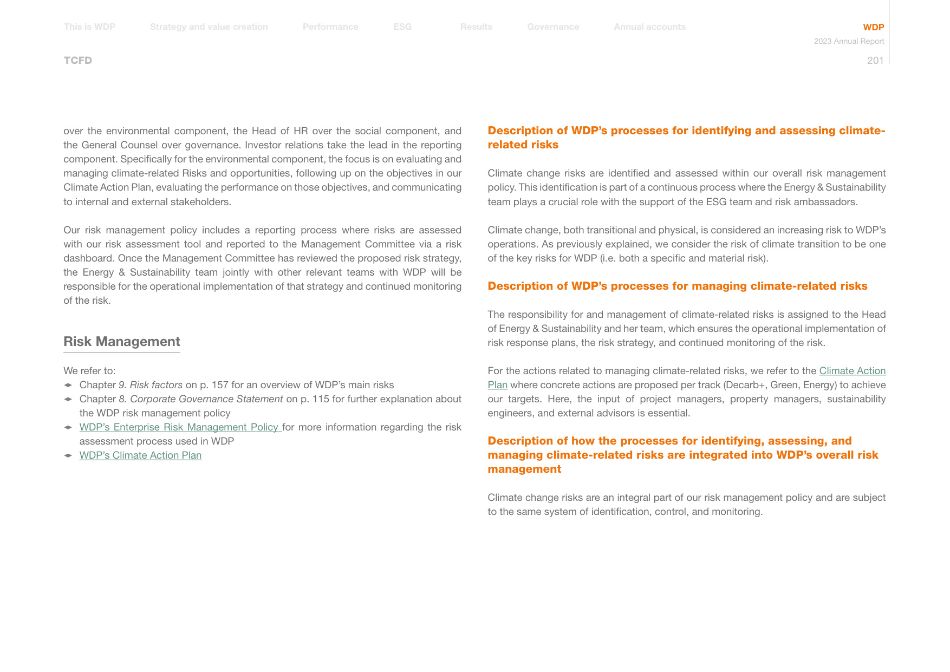
TCFD over the environmental component, the Head of HR over the social component, and the General Counsel over governance. Investor relations take the lead in the reporting component. Specifically for the environmental component, the focus is on evaluating and managing climate-related Risks and opportunities, following up on the objectives in our Climate Action Plan, evaluating the performance on those objectives, and communicating to internal and external stakeholders. Our risk management policy includes a reporting process where risks are assessed with our risk assessment tool and reported to the Management Committee via a risk dashboard. Once the Management Committee has reviewed the proposed risk strategy, the Energy & Sustainability team jointly with other relevant teams with WDP will be responsible for the operational implementation of that strategy and continued monitoring of the risk. Risk Management We refer to: 1 Chapter 9. Risk factors on p. 157 for an overview of WDP's main risks 1 Chapter 8. Corporate Governance Statement on p. 115 for further explanation about the WDP risk management policy 1 WDP's Enterprise Risk Management Policy for more information regarding the risk assessment process used in WDP 1 WDP's Climate Action Plan Description of WDP's processes for identifying and assessing climate- related risks Climate change risks are identified and assessed within our overall risk management policy. This identification is part of a continuous process where the Energy & Sustainability team plays a crucial role with the support of the ESG team and risk ambassadors. Climate change, both transitional and physical, is considered an increasing risk to WDP's operations. As previously explained, we consider the risk of climate transition to be one of the key risks for WDP (i.e. both a specific and material risk). Description of WDP's processes for managing climate-related risks The responsibility for and management of climate-related risks is assigned to the Head of Energy & Sustainability and her team, which ensures the operational implementation of risk response plans, the risk strategy, and continued monitoring of the risk. For the actions related to managing climate-related risks, we refer to the Climate Action Plan where concrete actions are proposed per track (Decarb+, Green, Energy) to achieve our targets. Here, the input of project managers, property managers, sustainability engineers, and external advisors is essential. Description of how the processes for identifying, assessing, and managing climate-related risks are integrated into WDP's overall risk management Climate change risks are an integral part of our risk management policy and are subject to the same system of identification, control, and monitoring. Annual accounts Governance Results Performance Strategy and value creation This is WDP ESG WDP 2023 Annual Report 201
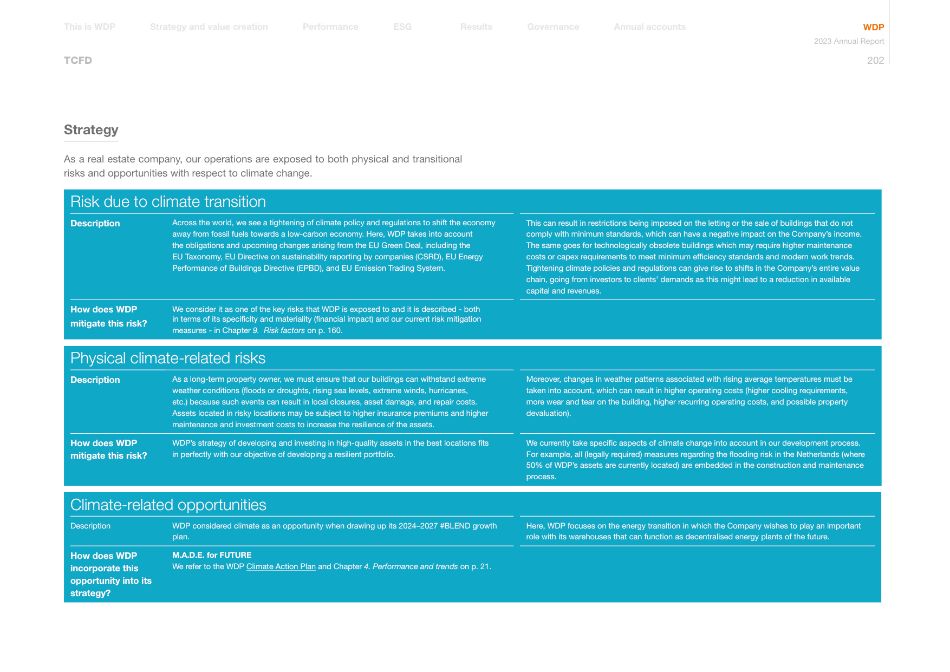
TCFD Strategy As a real estate company, our operations are exposed to both physical and transitional risks and opportunities with respect to climate change. Risk due to climate transition Description Across the world, we see a tightening of climate policy and regulations to shift the economy away from fossil fuels towards a low-carbon economy. Here, WDP takes into account the obligations and upcoming changes arising from the EU Green Deal, including the EU Taxonomy, EU Directive on sustainability reporting by companies (CSRD), EU Energy Performance of Buildings Directive (EPBD), and EU Emission Trading System. This can result in restrictions being imposed on the letting or the sale of buildings that do not comply with minimum standards, which can have a negative impact on the Company's income. The same goes for technologically obsolete buildings which may require higher maintenance costs or capex requirements to meet minimum efficiency standards and modern work trends. Tightening climate policies and regulations can give rise to shifts in the Company's entire value chain, going from investors to clients' demands as this might lead to a reduction in available capital and revenues. How does WDP mitigate this risk? We consider it as one of the key risks that WDP is exposed to and it is described - both in terms of its specificity and materiality (financial impact) and our current risk mitigation measures - in Chapter 9. Risk factors on p. 160. Physical climate-related risks Description As a long-term property owner, we must ensure that our buildings can withstand extreme weather conditions (floods or droughts, rising sea levels, extreme winds, hurricanes, etc.) because such events can result in local closures, asset damage, and repair costs. Assets located in risky locations may be subject to higher insurance premiums and higher maintenance and investment costs to increase the resilience of the assets. Moreover, changes in weather patterns associated with rising average temperatures must be taken into account, which can result in higher operating costs (higher cooling requirements, more wear and tear on the building, higher recurring operating costs, and possible property devaluation). How does WDP mitigate this risk? WDP's strategy of developing and investing in high-quality assets in the best locations fits in perfectly with our objective of developing a resilient portfolio. We currently take specific aspects of climate change into account in our development process. For example, all (legally required) measures regarding the flooding risk in the Netherlands (where 50% of WDP's assets are currently located) are embedded in the construction and maintenance process. Climate-related opportunities Description WDP considered climate as an opportunity when drawing up its 2024–2027 #BLEND growth plan. Here, WDP focuses on the energy transition in which the Company wishes to play an important role with its warehouses that can function as decentralised energy plants of the future. How does WDP incorporate this opportunity into its strategy? M.A.D.E. for FUTURE We refer to the WDP Climate Action Plan and Chapter 4. Performance and trends on p. 21. Annual accounts Governance Results Performance Strategy and value creation This is WDP ESG WDP 2023 Annual Report 202
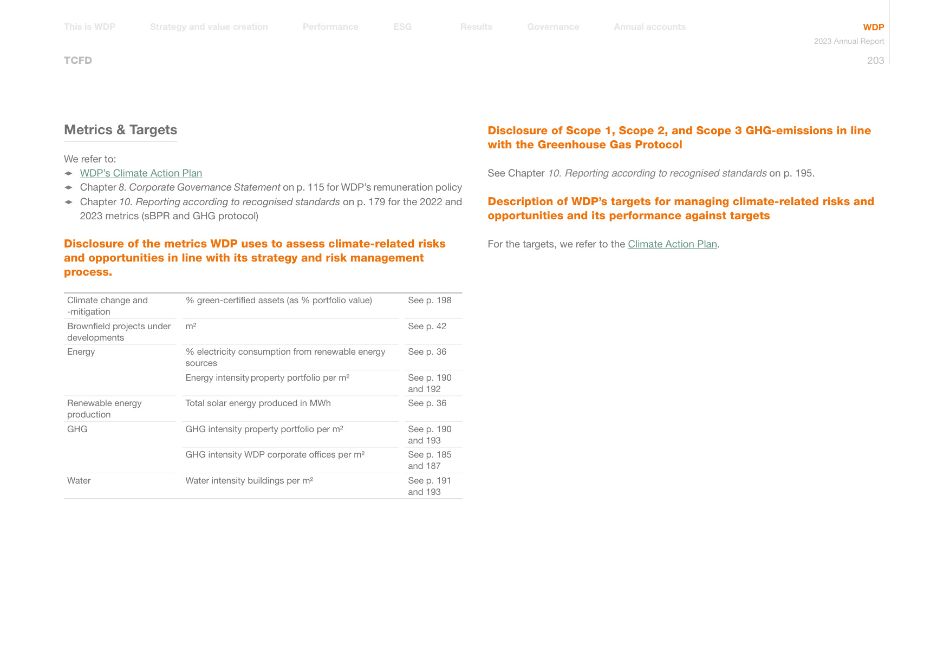
TCFD Metrics & Targets We refer to: 1 WDP's Climate Action Plan 1 Chapter 8. Corporate Governance Statement on p. 115 for WDP's remuneration policy 1 Chapter 10. Reporting according to recognised standards on p. 179 for the 2022 and 2023 metrics (sBPR and GHG protocol) Disclosure of the metrics WDP uses to assess climate-related risks and opportunities in line with its strategy and risk management process. Climate change and -mitigation % green-certified assets (as % portfolio value) See p. 198 Brownfield projects under developments m² See p. 42 Energy % electricity consumption from renewable energy sources See p. 36 Energy intensity property portfolio per m² See p. 190 and 192 Renewable energy production Total solar energy produced in MWh See p. 36 GHG GHG intensity property portfolio per m² See p. 190 and 193 GHG intensity WDP corporate offices per m² See p. 185 and 187 Water Water intensity buildings per m² See p. 191 and 193 Disclosure of Scope 1, Scope 2, and Scope 3 GHG-emissions in line with the Greenhouse Gas Protocol See Chapter 10. Reporting according to recognised standards on p. 195. Description of WDP's targets for managing climate-related risks and opportunities and its performance against targets For the targets, we refer to the Climate Action Plan. Annual accounts Governance Results Performance Strategy and value creation This is WDP ESG WDP 2023 Annual Report 203
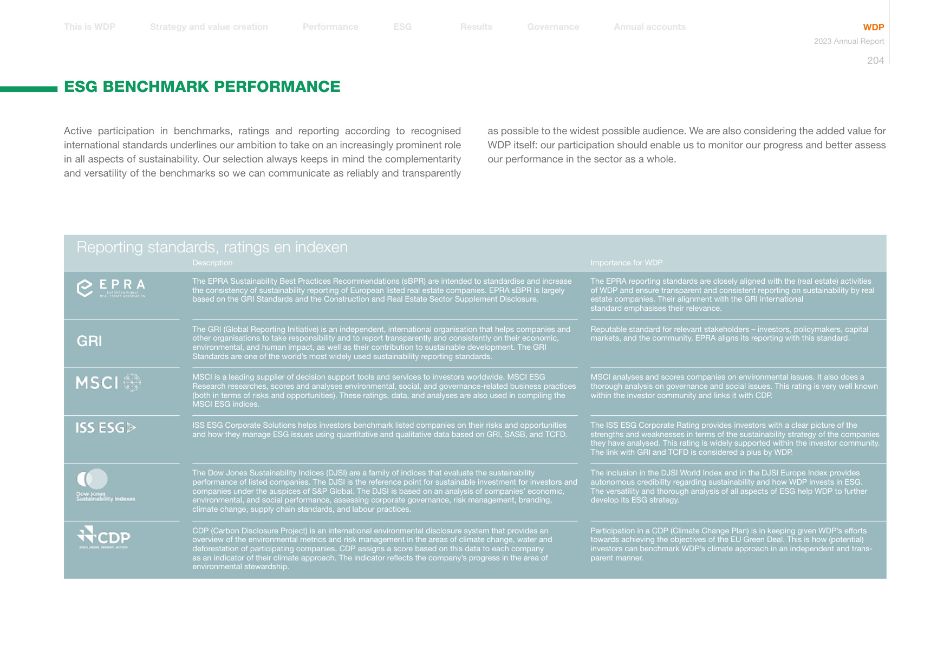
Active participation in benchmarks, ratings and reporting according to recognised international standards underlines our ambition to take on an increasingly prominent role in all aspects of sustainability. Our selection always keeps in mind the complementarity and versatility of the benchmarks so we can communicate as reliably and transparently ESG BENCHMARK PERFORMANCE as possible to the widest possible audience. We are also considering the added value for WDP itself: our participation should enable us to monitor our progress and better assess our performance in the sector as a whole. Reporting standards, ratings en indexen Description Importance for WDP The EPRA Sustainability Best Practices Recommendations (sBPR) are intended to standardise and increase the consistency of sustainability reporting of European listed real estate companies. EPRA sBPR is largely based on the GRI Standards and the Construction and Real Estate Sector Supplement Disclosure. The EPRA reporting standards are closely aligned with the (real estate) activities of WDP and ensure transparent and consistent reporting on sustainability by real estate companies. Their alignment with the GRI international standard emphasises their relevance. GRI The GRI (Global Reporting Initiative) is an independent, international organisation that helps companies and other organisations to take responsibility and to report transparently and consistently on their economic, environmental, and human impact, as well as their contribution to sustainable development. The GRI Standards are one of the world's most widely used sustainability reporting standards. Reputable standard for relevant stakeholders – investors, policymakers, capital markets, and the community. EPRA aligns its reporting with this standard. MSCI is a leading supplier of decision support tools and services to investors worldwide. MSCI ESG Research researches, scores and analyses environmental, social, and governance-related business practices (both in terms of risks and opportunities). These ratings, data, and analyses are also used in compiling the MSCI ESG indices. MSCI analyses and scores companies on environmental issues. It also does a thorough analysis on governance and social issues. This rating is very well known within the investor community and links it with CDP. ISS ESG Corporate Solutions helps investors benchmark listed companies on their risks and opportunities and how they manage ESG issues using quantitative and qualitative data based on GRI, SASB, and TCFD. The ISS ESG Corporate Rating provides investors with a clear picture of the strengths and weaknesses in terms of the sustainability strategy of the companies they have analysed. This rating is widely supported within the investor community. The link with GRI and TCFD is considered a plus by WDP. The Dow Jones Sustainability Indices (DJSI) are a family of indices that evaluate the sustainability performance of listed companies. The DJSI is the reference point for sustainable investment for investors and companies under the auspices of S&P Global. The DJSI is based on an analysis of companies' economic, environmental, and social performance, assessing corporate governance, risk management, branding, climate change, supply chain standards, and labour practices. The inclusion in the DJSI World Index and in the DJSI Europe Index provides autonomous credibility regarding sustainability and how WDP invests in ESG. The versatility and thorough analysis of all aspects of ESG help WDP to further develop its ESG strategy. CDP (Carbon Disclosure Project) is an international environmental disclosure system that provides an overview of the environmental metrics and risk management in the areas of climate change, water and deforestation of participating companies. CDP assigns a score based on this data to each company as an indicator of their climate approach. The indicator reflects the company's progress in the area of environmental stewardship. Participation in a CDP (Climate Change Plan) is in keeping given WDP's efforts towards achieving the objectives of the EU Green Deal. This is how (potential) investors can benchmark WDP's climate approach in an independent and trans parent manner. Annual accounts Governance Results Performance Strategy and value creation This is WDP ESG WDP 2023 Annual Report 204
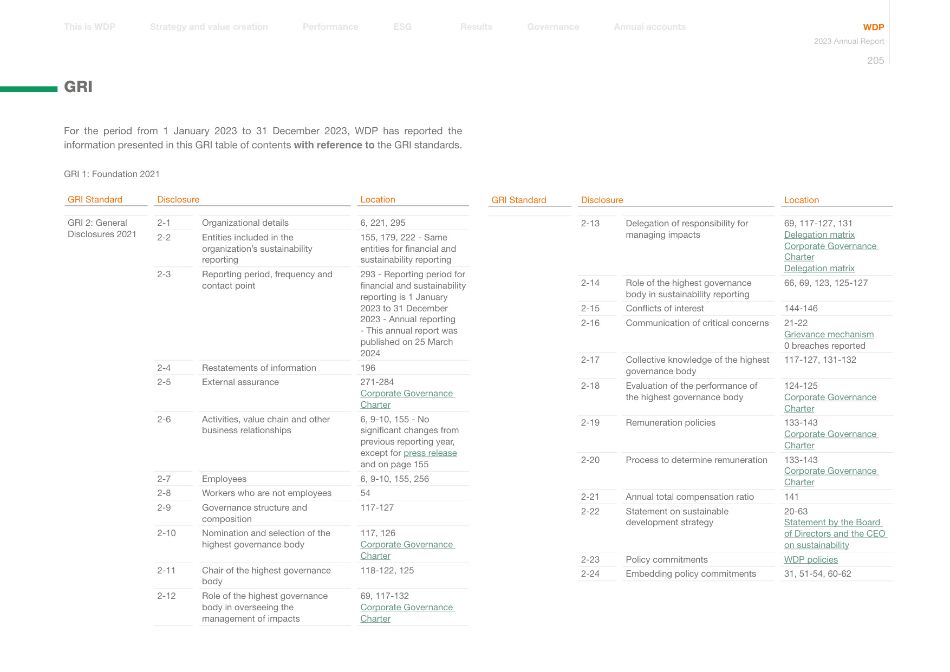
For the period from 1 January 2023 to 31 December 2023, WDP has reported the information presented in this GRI table of contents with reference to the GRI standards. GRI 1: Foundation 2021 GRI Standard Disclosure Location GRI 2: General Disclosures 2021 2-1 Organizational details 6, 221, 295 2-2 Entities included in the organization's sustainability reporting 155, 179, 222 - Same entities for financial and sustainability reporting 2-3 Reporting period, frequency and contact point 293 - Reporting period for financial and sustainability reporting is 1 January 2023 to 31 December 2023 - Annual reporting - This annual report was published on 25 March 2024 2-4 Restatements of information 196 2-5 External assurance 271-284 Corporate Governance Charter 2-6 Activities, value chain and other business relationships 6, 9-10, 155 - No significant changes from previous reporting year, except for press release and on page 155 2-7 Employees 6, 9-10, 155, 256 2-8 Workers who are not employees 54 2-9 Governance structure and composition 117-127 2-10 Nomination and selection of the highest governance body 117, 126 Corporate Governance Charter 2-11 Chair of the highest governance body 118-122, 125 2-12 Role of the highest governance body in overseeing the management of impacts 69, 117-132 Corporate Governance Charter GRI GRI Standard Disclosure Location 2-13 Delegation of responsibility for managing impacts 69, 117-127, 131 Delegation matrix Corporate Governance Charter Delegation matrix 2-14 Role of the highest governance body in sustainability reporting 66, 69, 123, 125-127 2-15 Conflicts of interest 144-146 2-16 Communication of critical concerns 21-22 Grievance mechanism 0 breaches reported 2-17 Collective knowledge of the highest governance body 117-127, 131-132 2-18 Evaluation of the performance of the highest governance body 124-125 Corporate Governance Charter 2-19 Remuneration policies 133-143 Corporate Governance Charter 2-20 Process to determine remuneration 133-143 Corporate Governance Charter 2-21 Annual total compensation ratio 141 2-22 Statement on sustainable development strategy 20-63 Statement by the Board of Directors and the CEO on sustainability 2-23 Policy commitments WDP policies 2-24 Embedding policy commitments 31, 51-54, 60-62 Annual accounts Governance Results Performance Strategy and value creation This is WDP ESG WDP 2023 Annual Report 205
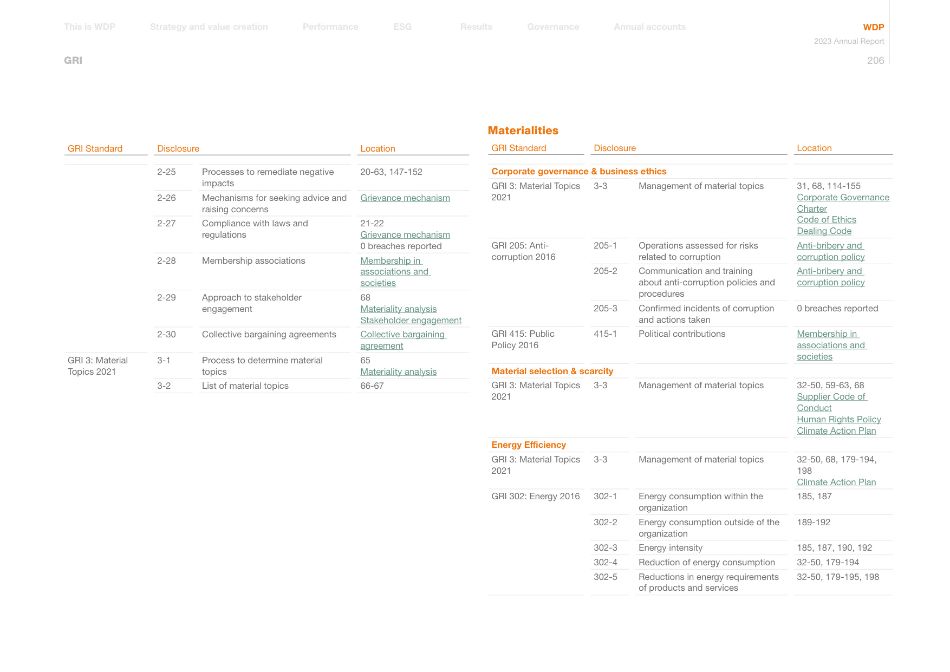
GRI GRI Standard Disclosure Location 2-25 Processes to remediate negative impacts 20-63, 147-152 2-26 Mechanisms for seeking advice and raising concerns Grievance mechanism 2-27 Compliance with laws and regulations 21-22 Grievance mechanism 0 breaches reported 2-28 Membership associations Membership in associations and societies 2-29 Approach to stakeholder engagement 68 Materiality analysis Stakeholder engagement 2-30 Collective bargaining agreements Collective bargaining agreement GRI 3: Material Topics 2021 3-1 Process to determine material topics 65 Materiality analysis 3-2 List of material topics 66-67 Materialities GRI Standard Disclosure Location Corporate governance & business ethics GRI 3: Material Topics 2021 3-3 Management of material topics 31, 68, 114-155 Corporate Governance Charter Code of Ethics Dealing Code GRI 205: Anti- corruption 2016 205-1 Operations assessed for risks related to corruption Anti-bribery and corruption policy 205-2 Communication and training about anti-corruption policies and procedures Anti-bribery and corruption policy 205-3 Confirmed incidents of corruption and actions taken 0 breaches reported GRI 415: Public Policy 2016 415-1 Political contributions Membership in associations and societies Material selection & scarcity GRI 3: Material Topics 2021 3-3 Management of material topics 32-50, 59-63, 68 Supplier Code of Conduct Human Rights Policy Climate Action Plan Energy Efficiency GRI 3: Material Topics 2021 3-3 Management of material topics 32-50, 68, 179-194, 198 Climate Action Plan GRI 302: Energy 2016 302-1 Energy consumption within the organization 185, 187 302-2 Energy consumption outside of the organization 189-192 302-3 Energy intensity 185, 187, 190, 192 302-4 Reduction of energy consumption 32-50, 179-194 302-5 Reductions in energy requirements of products and services 32-50, 179-195, 198 Annual accounts Governance Results Performance Strategy and value creation This is WDP ESG WDP 2023 Annual Report 206
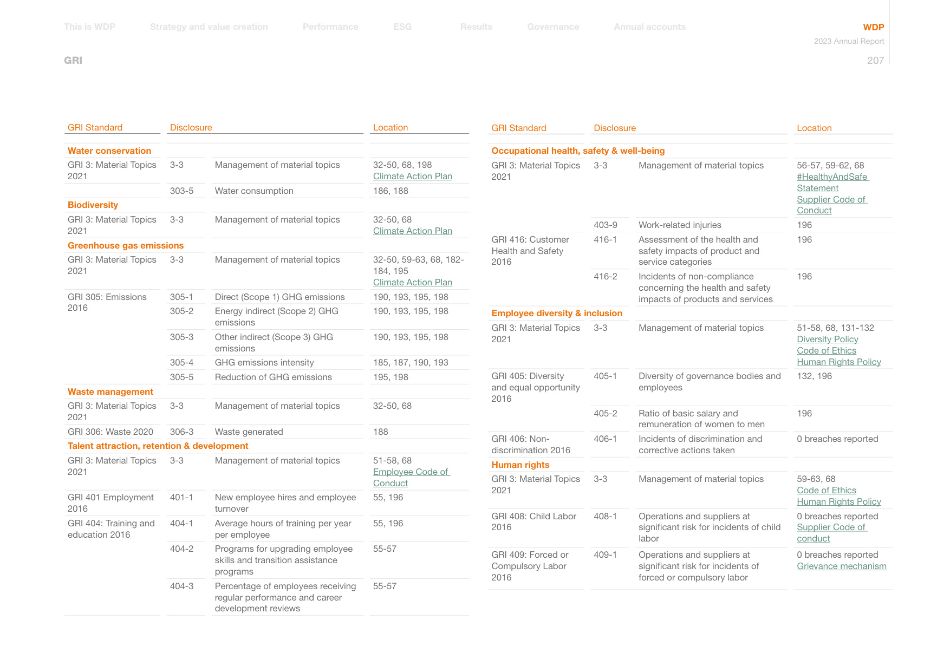
GRI GRI Standard Disclosure Location Water conservation GRI 3: Material Topics 2021 3-3 Management of material topics 32-50, 68, 198 Climate Action Plan 303-5 Water consumption 186, 188 Biodiversity GRI 3: Material Topics 2021 3-3 Management of material topics 32-50, 68 Climate Action Plan Greenhouse gas emissions GRI 3: Material Topics 2021 3-3 Management of material topics 32-50, 59-63, 68, 182- 184, 195 Climate Action Plan GRI 305: Emissions 2016 305-1 Direct (Scope 1) GHG emissions 190, 193, 195, 198 305-2 Energy indirect (Scope 2) GHG emissions 190, 193, 195, 198 305-3 Other indirect (Scope 3) GHG emissions 190, 193, 195, 198 305-4 GHG emissions intensity 185, 187, 190, 193 305-5 Reduction of GHG emissions 195, 198 Waste management GRI 3: Material Topics 2021 3-3 Management of material topics 32-50, 68 GRI 306: Waste 2020 306-3 Waste generated 188 Talent attraction, retention & development GRI 3: Material Topics 2021 3-3 Management of material topics 51-58, 68 Employee Code of Conduct GRI 401 Employment 2016 401-1 New employee hires and employee turnover 55, 196 GRI 404: Training and education 2016 404-1 Average hours of training per year per employee 55, 196 404-2 Programs for upgrading employee skills and transition assistance programs 55-57 404-3 Percentage of employees receiving regular performance and career development reviews 55-57 GRI Standard Disclosure Location Occupational health, safety & well-being GRI 3: Material Topics 2021 3-3 Management of material topics 56-57, 59-62, 68 #HealthyAndSafe Statement Supplier Code of Conduct 403-9 Work-related injuries 196 GRI 416: Customer Health and Safety 2016 416-1 Assessment of the health and safety impacts of product and service categories 196 416-2 Incidents of non-compliance concerning the health and safety impacts of products and services 196 Employee diversity & inclusion GRI 3: Material Topics 2021 3-3 Management of material topics 51-58, 68, 131-132 Diversity Policy Code of Ethics Human Rights Policy GRI 405: Diversity and equal opportunity 2016 405-1 Diversity of governance bodies and employees 132, 196 405-2 Ratio of basic salary and remuneration of women to men 196 GRI 406: Non- discrimination 2016 406-1 Incidents of discrimination and corrective actions taken 0 breaches reported Human rights GRI 3: Material Topics 2021 3-3 Management of material topics 59-63, 68 Code of Ethics Human Rights Policy GRI 408: Child Labor 2016 408-1 Operations and suppliers at significant risk for incidents of child labor 0 breaches reported Supplier Code of conduct GRI 409: Forced or Compulsory Labor 2016 409-1 Operations and suppliers at significant risk for incidents of forced or compulsory labor 0 breaches reported Grievance mechanism Annual accounts Governance Results Performance Strategy and value creation This is WDP ESG WDP 2023 Annual Report 207
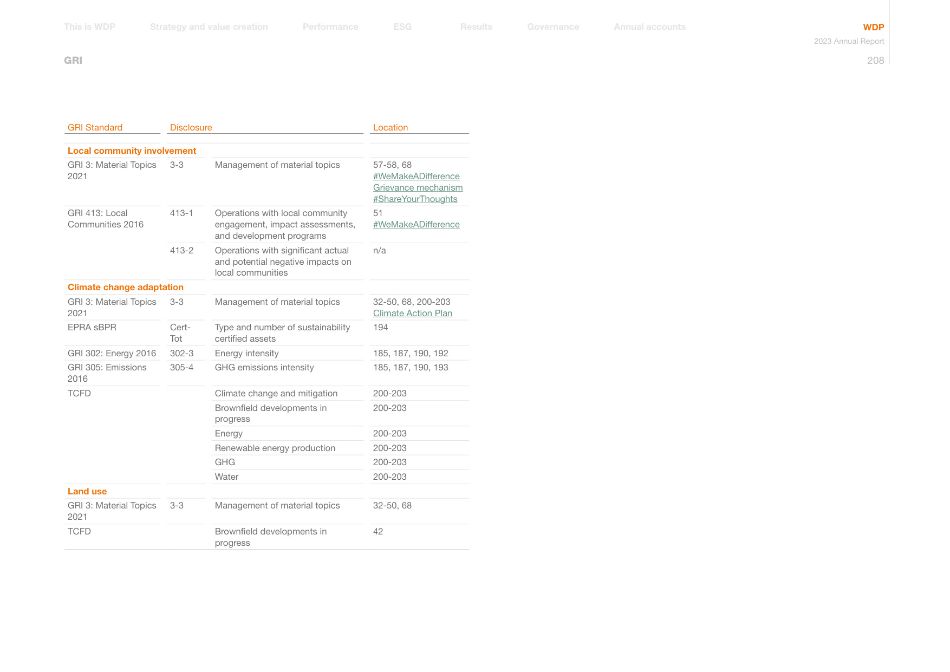
GRI GRI Standard Disclosure Location Local community involvement GRI 3: Material Topics 2021 3-3 Management of material topics 57-58, 68 #WeMakeADifference Grievance mechanism #ShareYourThoughts GRI 413: Local Communities 2016 413-1 Operations with local community engagement, impact assessments, and development programs 51 #WeMakeADifference 413-2 Operations with significant actual and potential negative impacts on local communities n/a Climate change adaptation GRI 3: Material Topics 2021 3-3 Management of material topics 32-50, 68, 200-203 Climate Action Plan EPRA sBPR Cert- Tot Type and number of sustainability certified assets 194 GRI 302: Energy 2016 302-3 Energy intensity 185, 187, 190, 192 GRI 305: Emissions 2016 305-4 GHG emissions intensity 185, 187, 190, 193 TCFD Climate change and mitigation 200-203 Brownfield developments in progress 200-203 Energy 200-203 Renewable energy production 200-203 GHG 200-203 Water 200-203 Land use GRI 3: Material Topics 2021 3-3 Management of material topics 32-50, 68 TCFD Brownfield developments in progress 42 Annual accounts Governance Results Performance Strategy and value creation This is WDP ESG WDP 2023 Annual Report 208
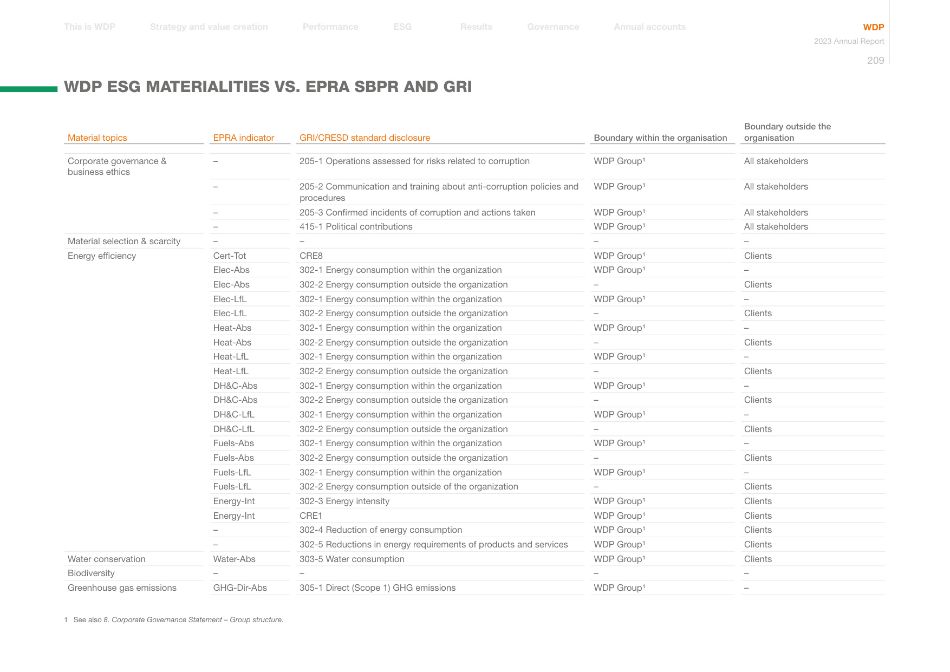
Material topics EPRA indicator GRI/CRESD standard disclosure Boundary within the organisation Boundary outside the organisation Corporate governance & business ethics – 205-1 Operations assessed for risks related to corruption WDP Group¹ All stakeholders – 205-2 Communication and training about anti-corruption policies and procedures WDP Group¹ All stakeholders – 205-3 Confirmed incidents of corruption and actions taken WDP Group¹ All stakeholders – 415-1 Political contributions WDP Group¹ All stakeholders Material selection & scarcity – – – – Energy efficiency Cert-Tot CRE8 WDP Group¹ Clients Elec-Abs 302-1 Energy consumption within the organization WDP Group¹ – Elec-Abs 302-2 Energy consumption outside the organization – Clients Elec-LfL 302-1 Energy consumption within the organization WDP Group¹ – Elec-LfL 302-2 Energy consumption outside the organization – Clients Heat-Abs 302-1 Energy consumption within the organization WDP Group¹ – Heat-Abs 302-2 Energy consumption outside the organization – Clients Heat-LfL 302-1 Energy consumption within the organization WDP Group¹ – Heat-LfL 302-2 Energy consumption outside the organization – Clients DH&C-Abs 302-1 Energy consumption within the organization WDP Group¹ – DH&C-Abs 302-2 Energy consumption outside the organization – Clients DH&C-LfL 302-1 Energy consumption within the organization WDP Group¹ – DH&C-LfL 302-2 Energy consumption outside the organization – Clients Fuels-Abs 302-1 Energy consumption within the organization WDP Group¹ – Fuels-Abs 302-2 Energy consumption outside the organization – Clients Fuels-LfL 302-1 Energy consumption within the organization WDP Group¹ – Fuels-LfL 302-2 Energy consumption outside of the organization – Clients Energy-Int 302-3 Energy intensity WDP Group¹ Clients Energy-Int CRE1 WDP Group¹ Clients – 302-4 Reduction of energy consumption WDP Group¹ Clients – 302-5 Reductions in energy requirements of products and services WDP Group¹ Clients Water conservation Water-Abs 303-5 Water consumption WDP Group¹ Clients Biodiversity – – – – Greenhouse gas emissions GHG-Dir-Abs 305-1 Direct (Scope 1) GHG emissions WDP Group¹ – WDP ESG MATERIALITIES VS. EPRA SBPR AND GRI 1 See also 8. Corporate Governance Statement – Group structure. Annual accounts Governance Results Performance Strategy and value creation This is WDP ESG WDP 2023 Annual Report 209
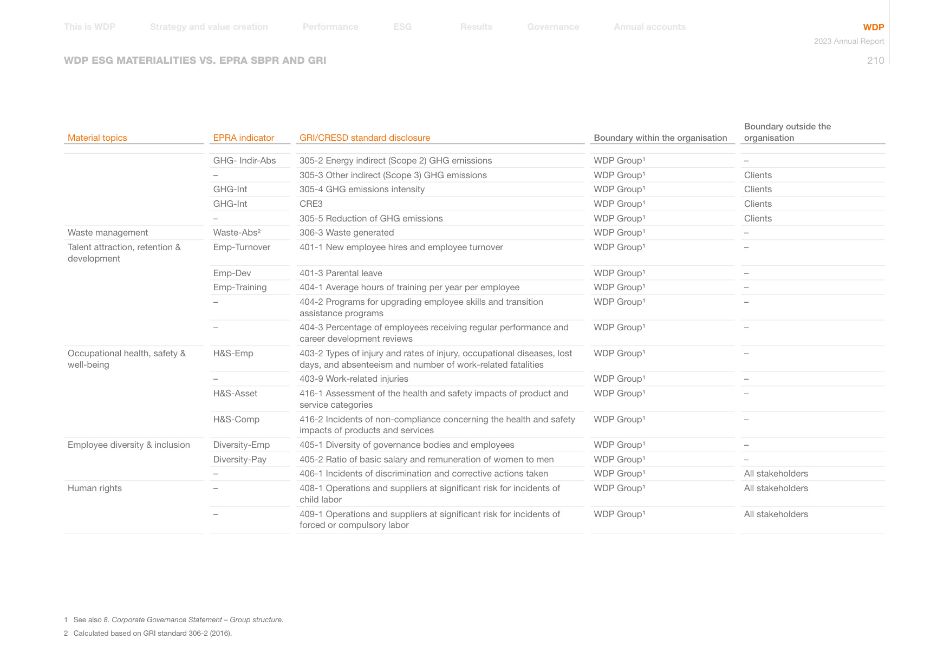
WDP ESG MATERIALITIES VS. EPRA SBPR AND GRI Material topics EPRA indicator GRI/CRESD standard disclosure Boundary within the organisation Boundary outside the organisation GHG- Indir-Abs 305-2 Energy indirect (Scope 2) GHG emissions WDP Group¹ – – 305-3 Other indirect (Scope 3) GHG emissions WDP Group¹ Clients GHG-Int 305-4 GHG emissions intensity WDP Group¹ Clients GHG-Int CRE3 WDP Group¹ Clients – 305-5 Reduction of GHG emissions WDP Group¹ Clients Waste management Waste-Abs² 306-3 Waste generated WDP Group¹ – Talent attraction, retention & development Emp-Turnover 401-1 New employee hires and employee turnover WDP Group¹ – Emp-Dev 401-3 Parental leave WDP Group¹ – Emp-Training 404-1 Average hours of training per year per employee WDP Group¹ – – 404-2 Programs for upgrading employee skills and transition assistance programs WDP Group¹ – – 404-3 Percentage of employees receiving regular performance and career development reviews WDP Group¹ – Occupational health, safety & well-being H&S-Emp 403-2 Types of injury and rates of injury, occupational diseases, lost days, and absenteeism and number of work-related fatalities WDP Group¹ – – 403-9 Work-related injuries WDP Group¹ – H&S-Asset 416-1 Assessment of the health and safety impacts of product and service categories WDP Group¹ – H&S-Comp 416-2 Incidents of non-compliance concerning the health and safety impacts of products and services WDP Group¹ – Employee diversity & inclusion Diversity-Emp 405-1 Diversity of governance bodies and employees WDP Group¹ – Diversity-Pay 405-2 Ratio of basic salary and remuneration of women to men WDP Group¹ – – 406-1 Incidents of discrimination and corrective actions taken WDP Group¹ All stakeholders Human rights – 408-1 Operations and suppliers at significant risk for incidents of child labor WDP Group¹ All stakeholders – 409-1 Operations and suppliers at significant risk for incidents of forced or compulsory labor WDP Group¹ All stakeholders 1 See also 8. Corporate Governance Statement – Group structure. 2 Calculated based on GRI standard 306-2 (2016). Annual accounts Governance Results Performance Strategy and value creation This is WDP ESG WDP 2023 Annual Report 210
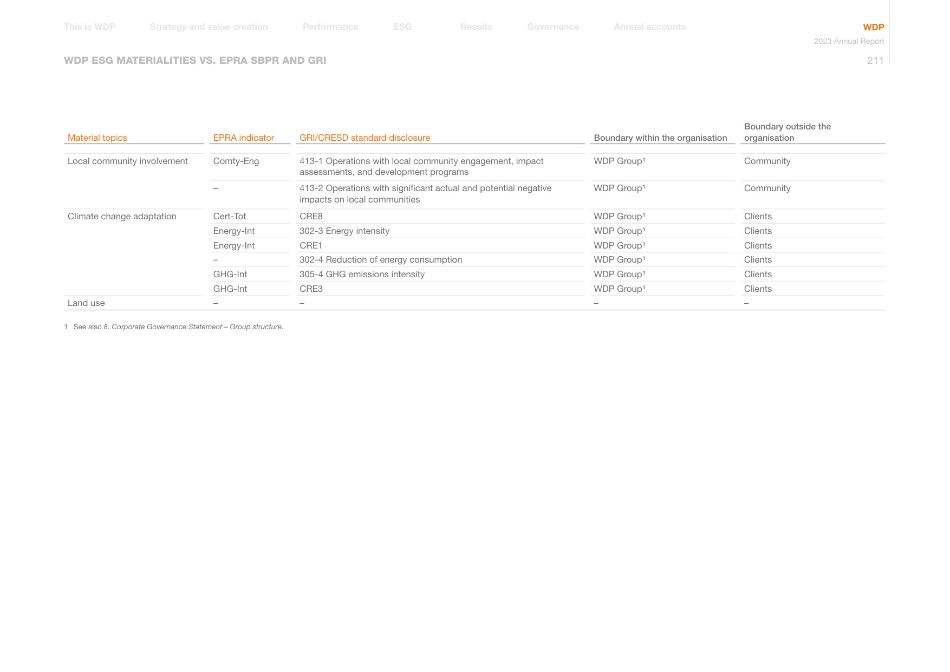
WDP ESG MATERIALITIES VS. EPRA SBPR AND GRI Material topics EPRA indicator GRI/CRESD standard disclosure Boundary within the organisation Boundary outside the organisation Local community involvement Comty-Eng 413-1 Operations with local community engagement, impact assessments, and development programs WDP Group¹ Community – 413-2 Operations with significant actual and potential negative impacts on local communities WDP Group¹ Community Climate change adaptation Cert-Tot CRE8 WDP Group¹ Clients Energy-Int 302-3 Energy intensity WDP Group¹ Clients Energy-Int CRE1 WDP Group¹ Clients – 302-4 Reduction of energy consumption WDP Group¹ Clients GHG-Int 305-4 GHG emissions intensity WDP Group¹ Clients GHG-Int CRE3 WDP Group¹ Clients Land use – – – – 1 See also 8. Corporate Governance Statement – Group structure. Annual accounts Governance Results Performance Strategy and value creation This is WDP ESG WDP 2023 Annual Report 211
11 ANNUAL ACCOUNTS
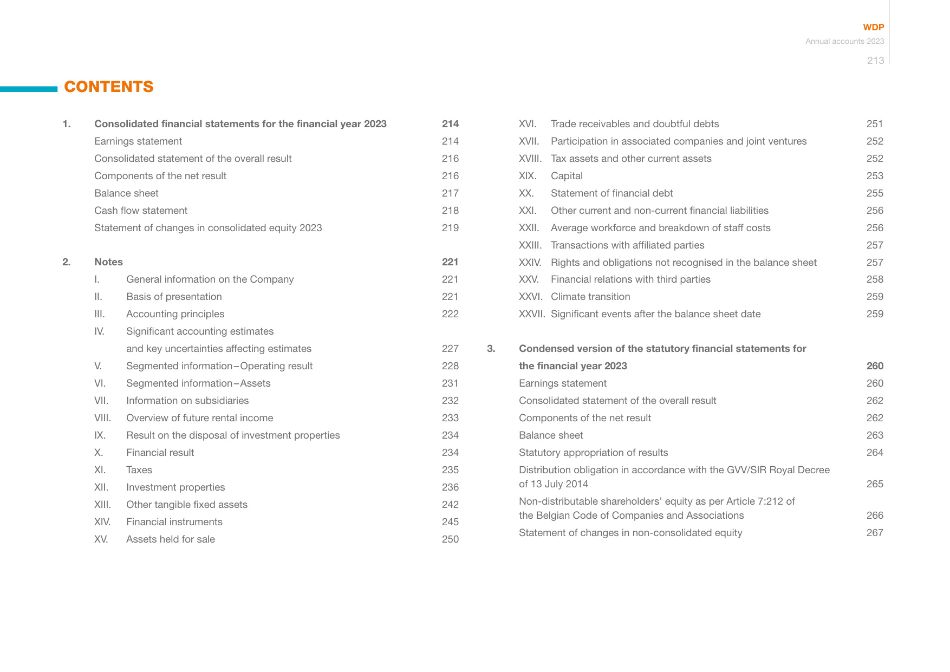
CONTENTS 1. Consolidated financial statements for the financial year 2023 214 Earnings statement 214 Consolidated statement of the overall result 216 Components of the net result 216 Balance sheet 217 Cash flow statement 218 Statement of changes in consolidated equity 2023 219 2. Notes 221 I. General information on the Company 221 II. Basis of presentation 221 III. Accounting principles 222 IV. Significant accounting estimates and key uncertainties affecting estimates 227 V. Segmented information – Operating result 228 VI. Segmented information – Assets 231 VII. Information on subsidiaries 232 VIII. Overview of future rental income 233 IX. Result on the disposal of investment properties 234 X. Financial result 234 XI. Taxes 235 XII. Investment properties 236 XIII. Other tangible fixed assets 242 XIV. Financial instruments 245 XV. Assets held for sale 250 XVI. Trade receivables and doubtful debts 251 XVII. Participation in associated companies and joint ventures 252 XVIII. Tax assets and other current assets 252 XIX. Capital 253 XX. Statement of financial debt 255 XXI. Other current and non-current financial liabilities 256 XXII. Average workforce and breakdown of staff costs 256 XXIII. Transactions with affiliated parties 257 XXIV. Rights and obligations not recognised in the balance sheet 257 XXV. Financial relations with third parties 258 XXVI. Climate transition 259 XXVII. Significant events after the balance sheet date 259 3. Condensed version of the statutory financial statements for the financial year 2023 260 Earnings statement 260 Consolidated statement of the overall result 262 Components of the net result 262 Balance sheet 263 Statutory appropriation of results 264 Distribution obligation in accordance with the GVV/SIR Royal Decree of 13 July 2014 265 Non-distributable shareholders' equity as per Article 7:212 of the Belgian Code of Companies and Associations 266 Statement of changes in non-consolidated equity 267 WDP Annual accounts 2023 213
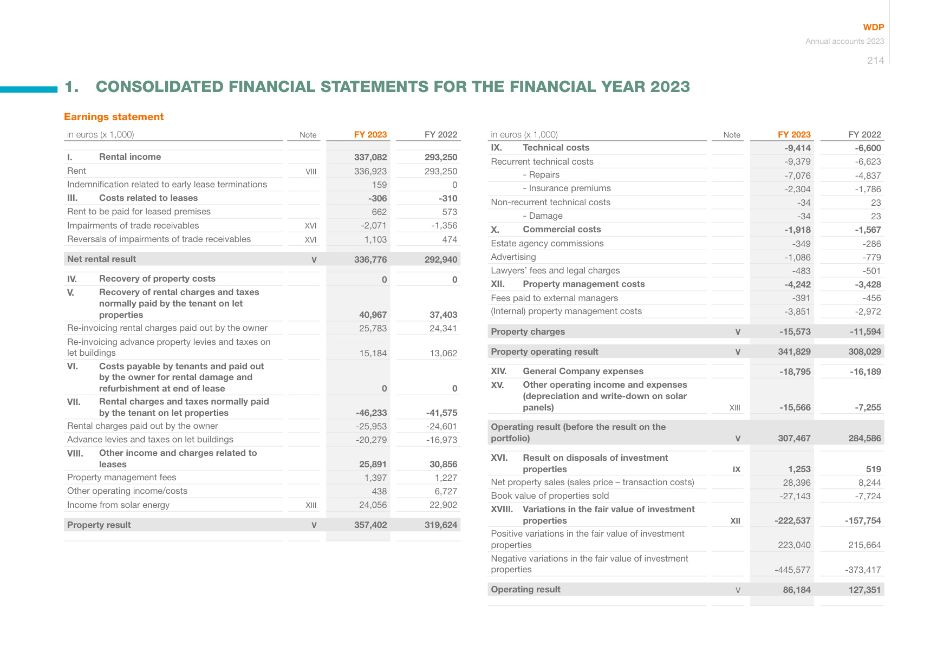
in euros (x 1,000) Note FY 2023 FY 2022 I. Rental income 337,082 293,250 Rent VIII 336,923 293,250 Indemnification related to early lease terminations 159 0 III. Costs related to leases -306 -310 Rent to be paid for leased premises 662 573 Impairments of trade receivables XVI -2,071 -1,356 Reversals of impairments of trade receivables XVI 1,103 474 Net rental result V 336,776 292,940 IV. Recovery of property costs 0 0 V. Recovery of rental charges and taxes normally paid by the tenant on let properties 40,967 37,403 Re-invoicing rental charges paid out by the owner 25,783 24,341 Re-invoicing advance property levies and taxes on let buildings 15,184 13,062 VI. Costs payable by tenants and paid out by the owner for rental damage and refurbishment at end of lease 0 0 VII. Rental charges and taxes normally paid by the tenant on let properties -46,233 -41,575 Rental charges paid out by the owner -25,953 -24,601 Advance levies and taxes on let buildings -20,279 -16,973 VIII. Other income and charges related to leases 25,891 30,856 Property management fees 1,397 1,227 Other operating income/costs 438 6,727 Income from solar energy XIII 24,056 22,902 Property result V 357,402 319,624 1. CONSOLIDATED FINANCIAL STATEMENTS FOR THE FINANCIAL YEAR 2023 in euros (x 1,000) Note FY 2023 FY 2022 IX. Technical costs -9,414 -6,600 Recurrent technical costs -9,379 -6,623 - Repairs -7,076 -4,837 - Insurance premiums -2,304 -1,786 Non-recurrent technical costs -34 23 - Damage -34 23 X. Commercial costs -1,918 -1,567 Estate agency commissions -349 -286 Advertising -1,086 -779 Lawyers' fees and legal charges -483 -501 XII. Property management costs -4,242 -3,428 Fees paid to external managers -391 -456 (Internal) property management costs -3,851 -2,972 Property charges V -15,573 -11,594 Property operating result V 341,829 308,029 XIV. General Company expenses -18,795 -16,189 XV. Other operating income and expenses (depreciation and write-down on solar panels) XIII -15,566 -7,255 Operating result (before the result on the portfolio) V 307,467 284,586 XVI. Result on disposals of investment properties IX 1,253 519 Net property sales (sales price – transaction costs) 28,396 8,244 Book value of properties sold -27,143 -7,724 XVIII. Variations in the fair value of investment properties XII -222,537 -157,754 Positive variations in the fair value of investment properties 223,040 215,664 Negative variations in the fair value of investment properties -445,577 -373,417 Operating result V 86,184 127,351 Earnings statement WDP Annual accounts 2023 214
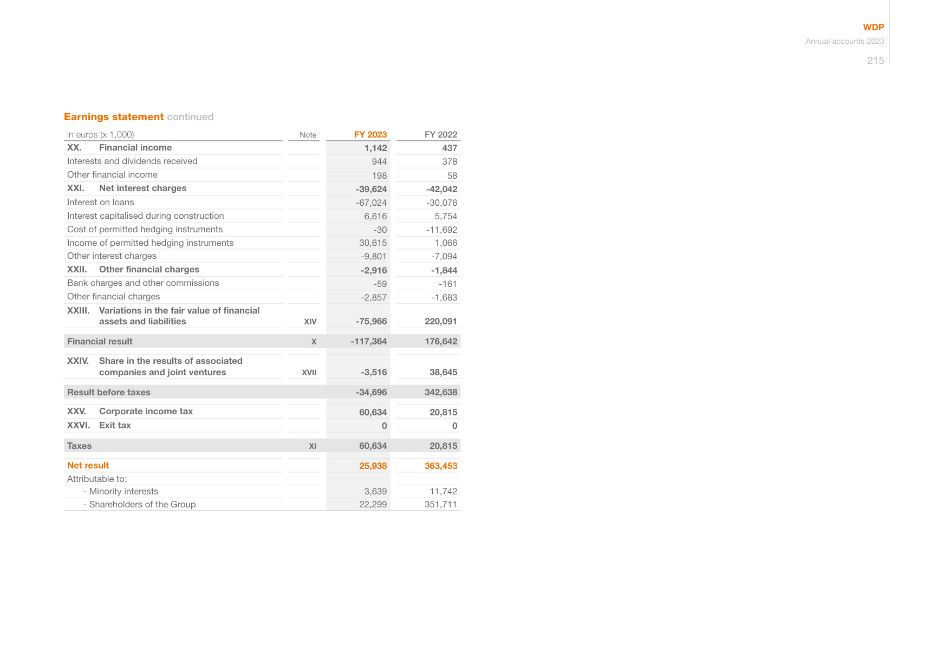
in euros (x 1,000) Note FY 2023 FY 2022 XX. Financial income 1,142 437 Interests and dividends received 944 378 Other financial income 198 58 XXI. Net interest charges -39,624 -42,042 Interest on loans -67,024 -30,076 Interest capitalised during construction 6,616 5,754 Cost of permitted hedging instruments -30 -11,692 Income of permitted hedging instruments 30,615 1,066 Other interest charges -9,801 -7,094 XXII. Other financial charges -2,916 -1,844 Bank charges and other commissions -59 -161 Other financial charges -2,857 -1,683 XXIII. Variations in the fair value of financial assets and liabilities XIV -75,966 220,091 Financial result X -117,364 176,642 XXIV. Share in the results of associated companies and joint ventures XVII -3,516 38,645 Result before taxes -34,696 342,638 XXV. Corporate income tax 60,634 20,815 XXVI. Exit tax 0 0 Taxes XI 60,634 20,815 Net result 25,938 363,453 Attributable to: - Minority interests 3,639 11,742 - Shareholders of the Group 22,299 351,711 Earnings statement continued WDP Annual accounts 2023 215
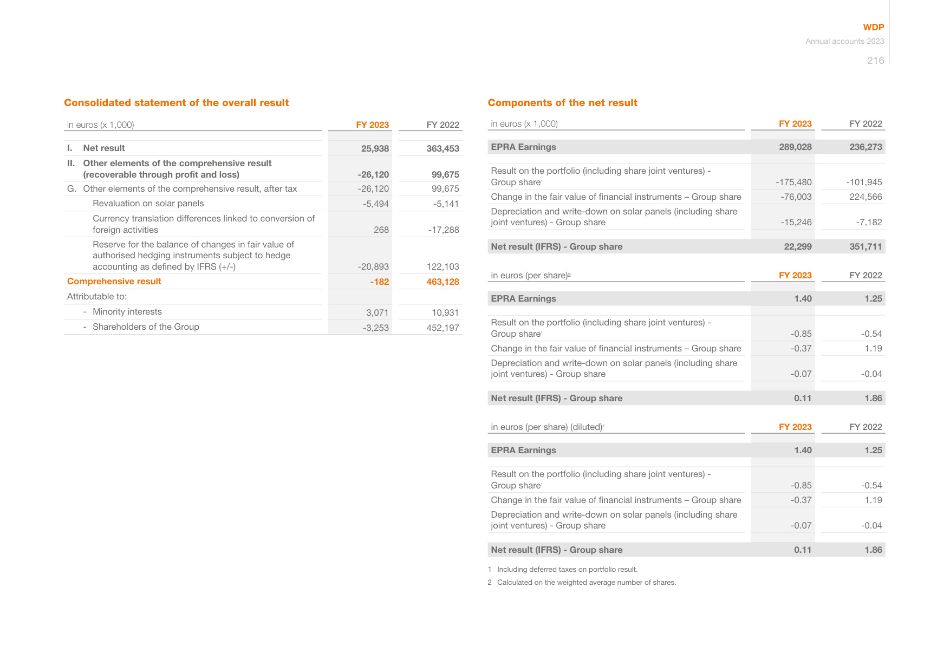
Components of the net result in euros (x 1,000) FY 2023 FY 2022 EPRA Earnings 289,028 236,273 Result on the portfolio (including share joint ventures) - Group share¹ -175,480 -101,945 Change in the fair value of financial instruments – Group share -76,003 224,566 Depreciation and write-down on solar panels (including share joint ventures) - Group share -15,246 -7,182 Net result (IFRS) - Group share 22,299 351,711 in euros (per share)2 FY 2023 FY 2022 EPRA Earnings 1.40 1.25 Result on the portfolio (including share joint ventures) - Group share¹ -0.85 -0.54 Change in the fair value of financial instruments – Group share -0.37 1.19 Depreciation and write-down on solar panels (including share joint ventures) - Group share -0.07 -0.04 Net result (IFRS) - Group share 0.11 1.86 in euros (per share) (diluted)² FY 2023 FY 2022 EPRA Earnings 1.40 1.25 Result on the portfolio (including share joint ventures) - Group share¹ -0.85 -0.54 Change in the fair value of financial instruments – Group share -0.37 1.19 Depreciation and write-down on solar panels (including share joint ventures) - Group share -0.07 -0.04 Net result (IFRS) - Group share 0.11 1.86 1 Including deferred taxes on portfolio result. 2 Calculated on the weighted average number of shares. Consolidated statement of the overall result in euros (x 1,000) FY 2023 FY 2022 I. Net result 25,938 363,453 II. Other elements of the comprehensive result (recoverable through profit and loss) -26,120 99,675 G. Other elements of the comprehensive result, after tax -26,120 99,675 Revaluation on solar panels -5,494 -5,141 Currency translation differences linked to conversion of foreign activities 268 -17,288 Reserve for the balance of changes in fair value of authorised hedging instruments subject to hedge accounting as defined by IFRS (+/-) -20,893 122,103 Comprehensive result -182 463,128 Attributable to: - Minority interests 3,071 10,931 - Shareholders of the Group -3,253 452,197 WDP Annual accounts 2023 216
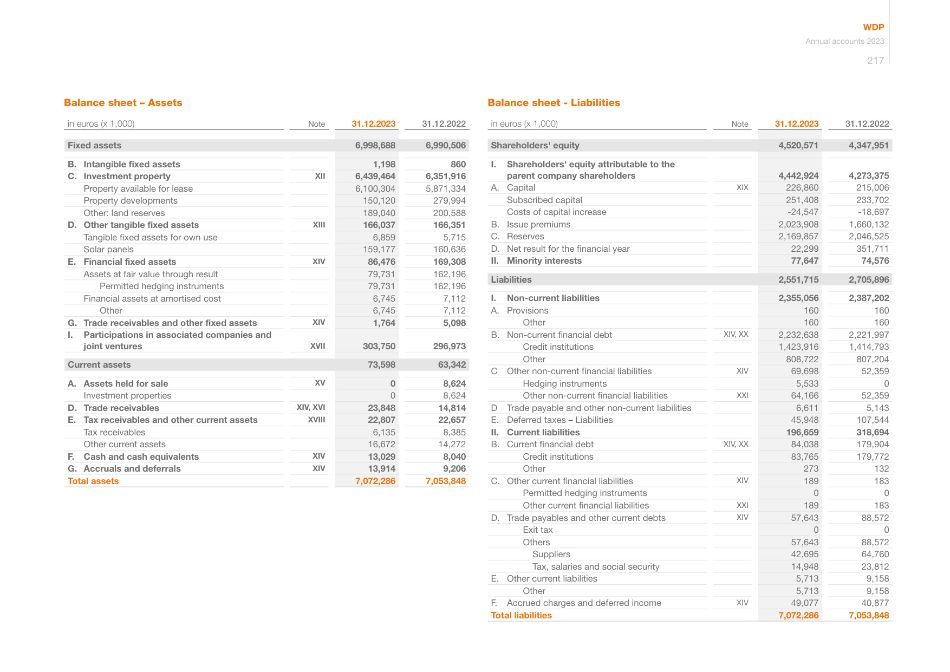
Balance sheet - Liabilities in euros (x 1,000) Note 31.12.2023 31.12.2022 Shareholders' equity 4,520,571 4,347,951 I. Shareholders' equity attributable to the parent company shareholders 4,442,924 4,273,375 A. Capital XIX 226,860 215,006 Subscribed capital 251,408 233,702 Costs of capital increase -24,547 -18,697 B. Issue premiums 2,023,908 1,660,132 C. Reserves 2,169,857 2,046,525 D. Net result for the financial year 22,299 351,711 II. Minority interests 77,647 74,576 Liabilities 2,551,715 2,705,896 I. Non-current liabilities 2,355,056 2,387,202 A. Provisions 160 160 Other 160 160 B. Non-current financial debt XIV, XX 2,232,638 2,221,997 Credit institutions 1,423,916 1,414,793 Other 808,722 807,204 C Other non-current financial liabilities XIV 69,698 52,359 Hedging instruments 5,533 0 Other non-current financial liabilities XXI 64,166 52,359 D Trade payable and other non-current liabilities 6,611 5,143 E. Deferred taxes – Liabilities 45,948 107,544 II. Current liabilities 196,659 318,694 B. Current financial debt XIV, XX 84,038 179,904 Credit institutions 83,765 179,772 Other 273 132 C. Other current financial liabilities XIV 189 183 Permitted hedging instruments 0 0 Other current financial liabilities XXI 189 183 D. Trade payables and other current debts XIV 57,643 88,572 Exit tax 0 0 Others 57,643 88,572 Suppliers 42,695 64,760 Tax, salaries and social security 14,948 23,812 E. Other current liabilities 5,713 9,158 Other 5,713 9,158 F. Accrued charges and deferred income XIV 49,077 40,877 Total liabilities 7,072,286 7,053,848 Balance sheet – Assets in euros (x 1,000) Note 31.12.2023 31.12.2022 Fixed assets 6,998,688 6,990,506 B. Intangible fixed assets 1,198 860 C. Investment property XII 6,439,464 6,351,916 Property available for lease 6,100,304 5,871,334 Property developments 150,120 279,994 Other: land reserves 189,040 200,588 D. Other tangible fixed assets XIII 166,037 166,351 Tangible fixed assets for own use 6,859 5,715 Solar panels 159,177 160,636 E. Financial fixed assets XIV 86,476 169,308 Assets at fair value through result 79,731 162,196 Permitted hedging instruments 79,731 162,196 Financial assets at amortised cost 6,745 7,112 Other 6,745 7,112 G. Trade receivables and other fixed assets XIV 1,764 5,098 I. Participations in associated companies and joint ventures XVII 303,750 296,973 Current assets 73,598 63,342 A. Assets held for sale XV 0 8,624 Investment properties 0 8,624 D. Trade receivables XIV, XVI 23,848 14,814 E. Tax receivables and other current assets XVIII 22,807 22,657 Tax receivables 6,135 8,385 Other current assets 16,672 14,272 F. Cash and cash equivalents XIV 13,029 8,040 G. Accruals and deferrals XIV 13,914 9,206 Total assets 7,072,286 7,053,848 WDP Annual accounts 2023 217
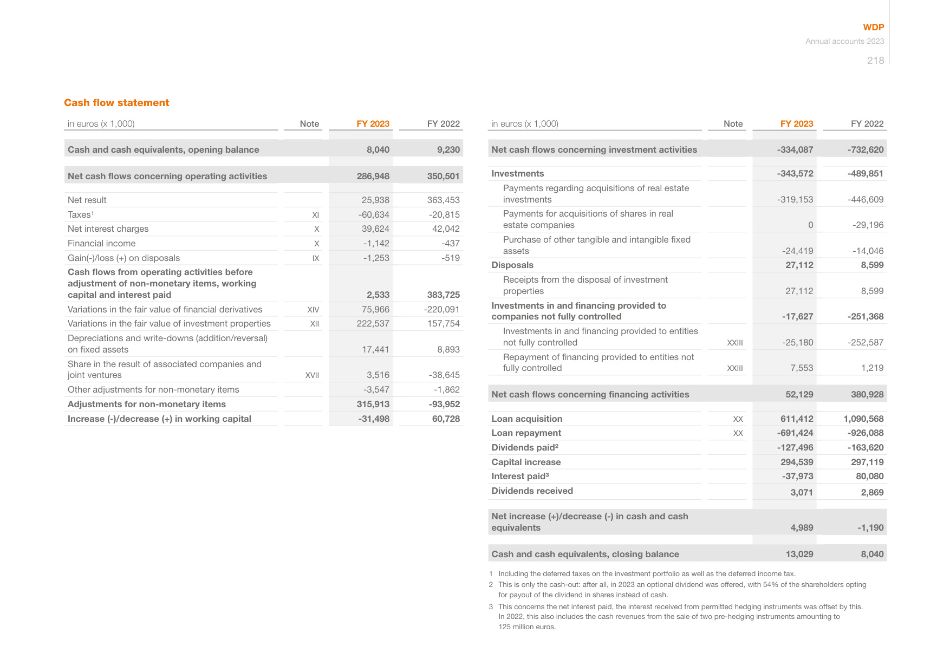
in euros (x 1,000) Note FY 2023 FY 2022 Net cash flows concerning investment activities -334,087 -732,620 Investments -343,572 -489,851 Payments regarding acquisitions of real estate investments -319,153 -446,609 Payments for acquisitions of shares in real estate companies 0 -29,196 Purchase of other tangible and intangible fixed assets -24,419 -14,046 Disposals 27,112 8,599 Receipts from the disposal of investment properties 27,112 8,599 Investments in and financing provided to companies not fully controlled -17,627 -251,368 Investments in and financing provided to entities not fully controlled XXIII -25,180 -252,587 Repayment of financing provided to entities not fully controlled XXIII 7,553 1,219 Net cash flows concerning financing activities 52,129 380,928 Loan acquisition XX 611,412 1,090,568 Loan repayment XX -691,424 -926,088 Dividends paid² -127,496 -163,620 Capital increase 294,539 297,119 Interest paid³ -37,973 80,080 Dividends received 3,071 2,869 Net increase (+)/decrease (-) in cash and cash equivalents 4,989 -1,190 Cash and cash equivalents, closing balance 13,029 8,040 1 Including the deferred taxes on the investment portfolio as well as the deferred income tax. 2 This is only the cash-out: after all, in 2023 an optional dividend was offered, with 54% of the shareholders opting for payout of the dividend in shares instead of cash. 3 This concerns the net interest paid, the interest received from permitted hedging instruments was offset by this. In 2022, this also includes the cash revenues from the sale of two pre-hedging instruments amounting to 125 million euros. Cash flow statement in euros (x 1,000) Note FY 2023 FY 2022 Cash and cash equivalents, opening balance 8,040 9,230 Net cash flows concerning operating activities 286,948 350,501 Net result 25,938 363,453 Taxes¹ XI -60,634 -20,815 Net interest charges X 39,624 42,042 Financial income X -1,142 -437 Gain(-)/loss (+) on disposals IX -1,253 -519 Cash flows from operating activities before adjustment of non-monetary items, working capital and interest paid 2,533 383,725 Variations in the fair value of financial derivatives XIV 75,966 -220,091 Variations in the fair value of investment properties XII 222,537 157,754 Depreciations and write-downs (addition/reversal) on fixed assets 17,441 8,893 Share in the result of associated companies and joint ventures XVII 3,516 -38,645 Other adjustments for non-monetary items -3,547 -1,862 Adjustments for non-monetary items 315,913 -93,952 Increase (-)/decrease (+) in working capital -31,498 60,728 WDP Annual accounts 2023 218
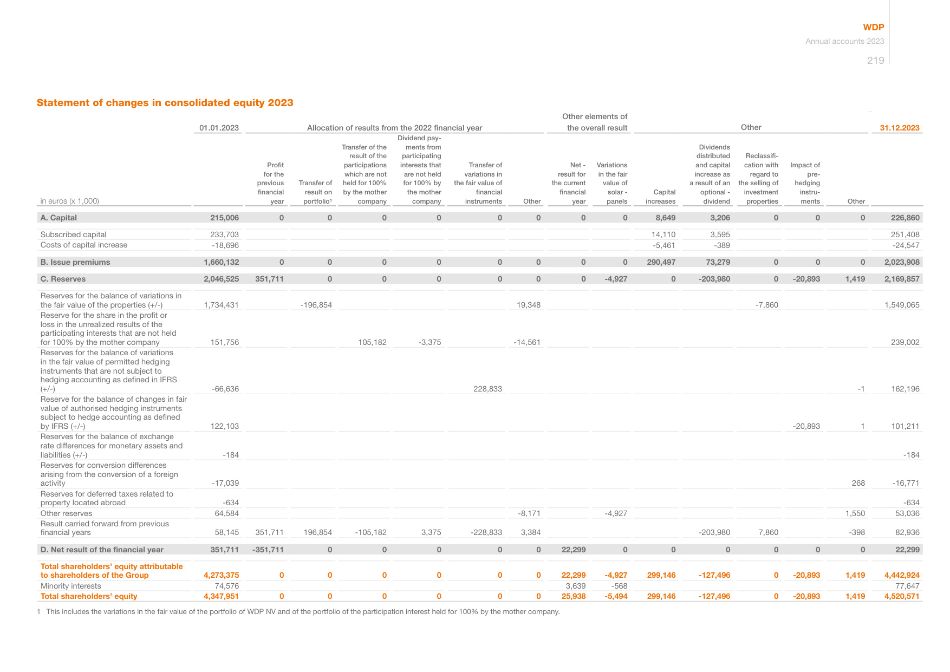
Statement of changes in consolidated equity 2023 in euros (x 1,000) 01.01.2023 Allocation of results from the 2022 financial year Other elements of the overall result Other 31.12.2023 Profit for the previous financial year Transfer of result on portfolio¹ Transfer of the result of the participations which are not held for 100% by the mother company Dividend pay- ments from participating interests that are not held for 100% by the mother company Transfer of variations in the fair value of financial instruments Other Net - result for the current financial year Variations in the fair value of solar - panels Capital increases Dividends distributed and capital increase as a result of an optional - dividend Reclassifi- cation with regard to the selling of investment properties Impact of pre- hedging instru- ments Other A. Capital 215,006 0 0 0 0 0 0 0 0 8,649 3,206 0 0 0 226,860 Subscribed capital 233,703 14,110 3,595 251,408 Costs of capital increase -18,696 -5,461 -389 -24,547 B. Issue premiums 1,660,132 0 0 0 0 0 0 0 0 290,497 73,279 0 0 0 2,023,908 C. Reserves 2,046,525 351,711 0 0 0 0 0 0 -4,927 0 -203,980 0 -20,893 1,419 2,169,857 Reserves for the balance of variations in the fair value of the properties (+/-) 1,734,431 -196,854 19,348 -7,860 1,549,065 Reserve for the share in the profit or loss in the unrealized results of the participating interests that are not held for 100% by the mother company 151,756 105,182 -3,375 -14,561 239,002 Reserves for the balance of variations in the fair value of permitted hedging instruments that are not subject to hedging accounting as defined in IFRS (+/-) -66,636 228,833 -1 162,196 Reserve for the balance of changes in fair value of authorised hedging instruments subject to hedge accounting as defined by IFRS (+/-) 122,103 -20,893 1 101,211 Reserves for the balance of exchange rate differences for monetary assets and liabilities (+/-) -184 -184 Reserves for conversion differences arising from the conversion of a foreign activity -17,039 268 -16,771 Reserves for deferred taxes related to property located abroad -634 -634 Other reserves 64,584 -8,171 -4,927 1,550 53,036 Result carried forward from previous financial years 58,145 351,711 196,854 -105,182 3,375 -228,833 3,384 -203,980 7,860 -398 82,936 D. Net result of the financial year 351,711 -351,711 0 0 0 0 0 22,299 0 0 0 0 0 0 22,299 Total shareholders' equity attributable to shareholders of the Group 4,273,375 0 0 0 0 0 0 22,299 -4,927 299,146 -127,496 0 -20,893 1,419 4,442,924 Minority interests 74,576 3,639 -568 77,647 Total shareholders' equity 4,347,951 0 0 0 0 0 0 25,938 -5,494 299,146 -127,496 0 -20,893 1,419 4,520,571 1 This includes the variations in the fair value of the portfolio of WDP NV and of the portfolio of the participation interest held for 100% by the mother company. WDP Annual accounts 2023 219
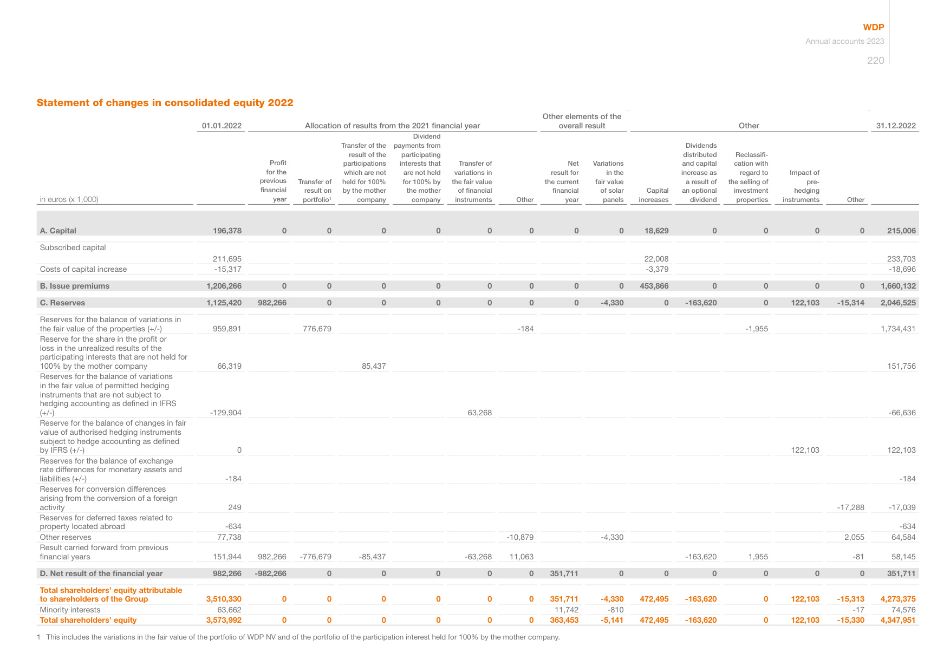
Statement of changes in consolidated equity 2022 in euros (x 1,000) 01.01.2022 Allocation of results from the 2021 financial year Other elements of the overall result Other 31.12.2022 Profit for the previous financial year Transfer of result on portfolio¹ Transfer of the result of the participations which are not held for 100% by the mother company Dividend payments from participating interests that are not held for 100% by the mother company Transfer of variations in the fair value of financial instruments Other Net result for the current financial year Variations in the fair value of solar panels Capital increases Dividends distributed and capital increase as a result of an optional dividend Reclassifi- cation with regard to the selling of investment properties Impact of pre- hedging instruments Other A. Capital 196,378 0 0 0 0 0 0 0 0 18,629 0 0 0 0 215,006 Subscribed capital 211,695 22,008 233,703 Costs of capital increase -15,317 -3,379 -18,696 B. Issue premiums 1,206,266 0 0 0 0 0 0 0 0 453,866 0 0 0 0 1,660,132 C. Reserves 1,125,420 982,266 0 0 0 0 0 0 -4,330 0 -163,620 0 122,103 -15,314 2,046,525 Reserves for the balance of variations in the fair value of the properties (+/-) 959,891 776,679 -184 -1,955 1,734,431 Reserve for the share in the profit or loss in the unrealized results of the participating interests that are not held for 100% by the mother company 66,319 85,437 151,756 Reserves for the balance of variations in the fair value of permitted hedging instruments that are not subject to hedging accounting as defined in IFRS (+/-) -129,904 63,268 -66,636 Reserve for the balance of changes in fair value of authorised hedging instruments subject to hedge accounting as defined by IFRS (+/-) 0 122,103 122,103 Reserves for the balance of exchange rate differences for monetary assets and liabilities (+/-) -184 -184 Reserves for conversion differences arising from the conversion of a foreign activity 249 -17,288 -17,039 Reserves for deferred taxes related to property located abroad -634 -634 Other reserves 77,738 -10,879 -4,330 2,055 64,584 Result carried forward from previous financial years 151,944 982,266 -776,679 -85,437 -63,268 11,063 -163,620 1,955 -81 58,145 D. Net result of the financial year 982,266 -982,266 0 0 0 0 0 351,711 0 0 0 0 0 0 351,711 Total shareholders' equity attributable to shareholders of the Group 3,510,330 0 0 0 0 0 0 351,711 -4,330 472,495 -163,620 0 122,103 -15,313 4,273,375 Minority interests 63,662 11,742 -810 -17 74,576 Total shareholders' equity 3,573,992 0 0 0 0 0 0 363,453 -5,141 472,495 -163,620 0 122,103 -15,330 4,347,951 1 This includes the variations in the fair value of the portfolio of WDP NV and of the portfolio of the participation interest held for 100% by the mother company. WDP Annual accounts 2023 220
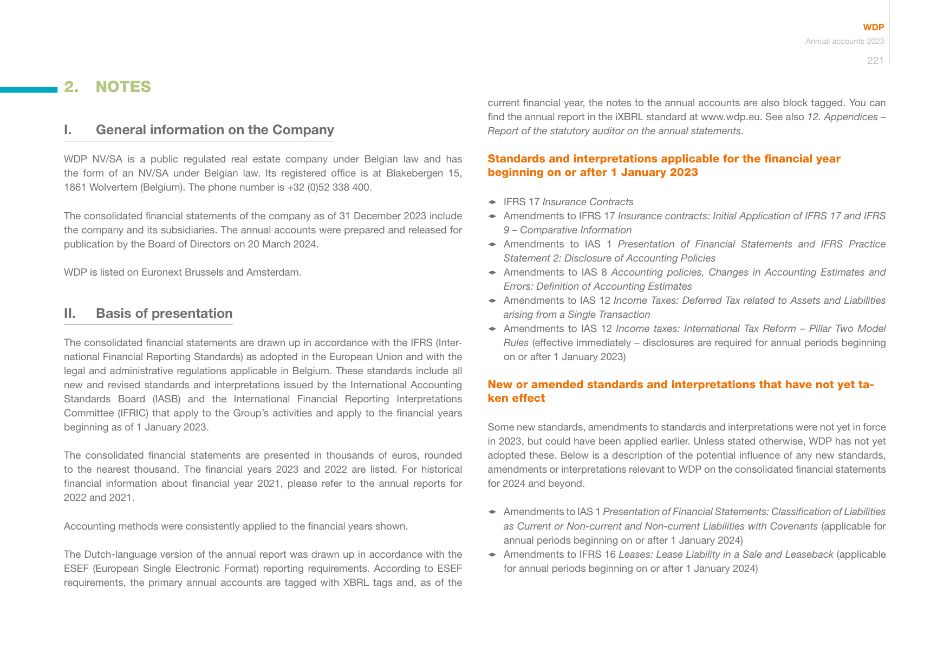
I. General information on the Company WDP NV/SA is a public regulated real estate company under Belgian law and has the form of an NV/SA under Belgian law. Its registered office is at Blakebergen 15, 1861 Wolvertem (Belgium). The phone number is +32 (0)52 338 400. The consolidated financial statements of the company as of 31 December 2023 include the company and its subsidiaries. The annual accounts were prepared and released for publication by the Board of Directors on 20 March 2024. WDP is listed on Euronext Brussels and Amsterdam. II. Basis of presentation The consolidated financial statements are drawn up in accordance with the IFRS (Inter- national Financial Reporting Standards) as adopted in the European Union and with the legal and administrative regulations applicable in Belgium. These standards include all new and revised standards and interpretations issued by the International Accounting Standards Board (IASB) and the International Financial Reporting Interpretations Committee (IFRIC) that apply to the Group's activities and apply to the financial years beginning as of 1 January 2023. The consolidated financial statements are presented in thousands of euros, rounded to the nearest thousand. The financial years 2023 and 2022 are listed. For historical financial information about financial year 2021, please refer to the annual reports for 2022 and 2021. Accounting methods were consistently applied to the financial years shown. The Dutch-language version of the annual report was drawn up in accordance with the ESEF (European Single Electronic Format) reporting requirements. According to ESEF requirements, the primary annual accounts are tagged with XBRL tags and, as of the current financial year, the notes to the annual accounts are also block tagged. You can find the annual report in the iXBRL standard at www.wdp.eu. See also 12. Appendices – Report of the statutory auditor on the annual statements. Standards and interpretations applicable for the financial year beginning on or after 1 January 2023 1 IFRS 17 Insurance Contracts 1 Amendments to IFRS 17 Insurance contracts: Initial Application of IFRS 17 and IFRS 9 – Comparative Information 1 Amendments to IAS 1 Presentation of Financial Statements and IFRS Practice Statement 2: Disclosure of Accounting Policies 1 Amendments to IAS 8 Accounting policies, Changes in Accounting Estimates and Errors: Definition of Accounting Estimates 1 Amendments to IAS 12 Income Taxes: Deferred Tax related to Assets and Liabilities arising from a Single Transaction 1 Amendments to IAS 12 Income taxes: International Tax Reform – Pillar Two Model Rules (effective immediately – disclosures are required for annual periods beginning on or after 1 January 2023) New or amended standards and interpretations that have not yet ta- ken effect Some new standards, amendments to standards and interpretations were not yet in force in 2023, but could have been applied earlier. Unless stated otherwise, WDP has not yet adopted these. Below is a description of the potential influence of any new standards, amendments or interpretations relevant to WDP on the consolidated financial statements for 2024 and beyond. 1 Amendments to IAS 1 Presentation of Financial Statements: Classification of Liabilities as Current or Non-current and Non-current Liabilities with Covenants (applicable for annual periods beginning on or after 1 January 2024) 1 Amendments to IFRS 16 Leases: Lease Liability in a Sale and Leaseback (applicable for annual periods beginning on or after 1 January 2024) 2. NOTES WDP Annual accounts 2023 221
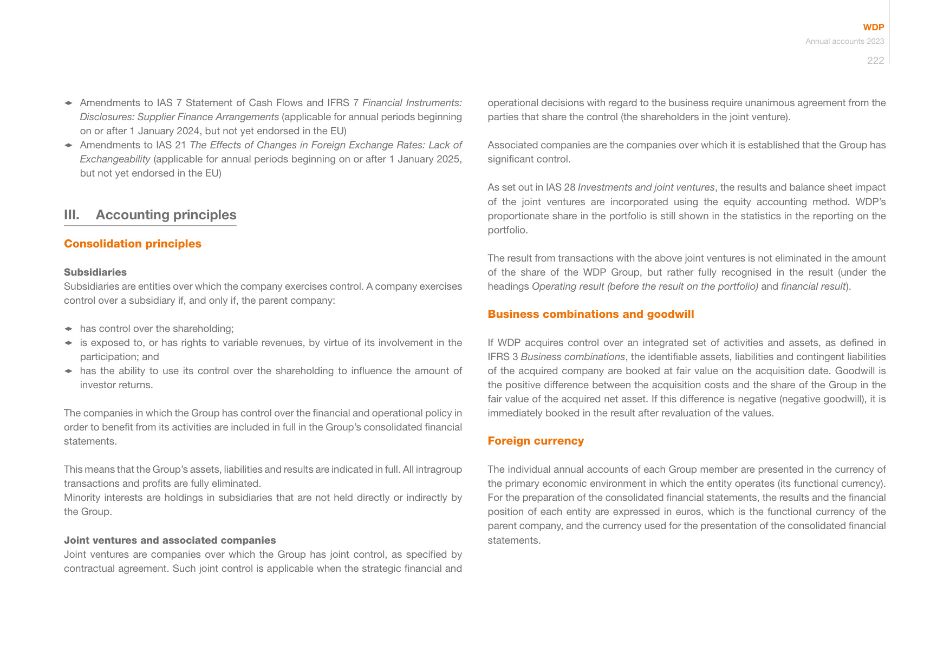
operational decisions with regard to the business require unanimous agreement from the parties that share the control (the shareholders in the joint venture). Associated companies are the companies over which it is established that the Group has significant control. As set out in IAS 28 Investments and joint ventures, the results and balance sheet impact of the joint ventures are incorporated using the equity accounting method. WDP's proportionate share in the portfolio is still shown in the statistics in the reporting on the portfolio. The result from transactions with the above joint ventures is not eliminated in the amount of the share of the WDP Group, but rather fully recognised in the result (under the headings Operating result (before the result on the portfolio) and financial result). Business combinations and goodwill If WDP acquires control over an integrated set of activities and assets, as defined in IFRS 3 Business combinations, the identifiable assets, liabilities and contingent liabilities of the acquired company are booked at fair value on the acquisition date. Goodwill is the positive difference between the acquisition costs and the share of the Group in the fair value of the acquired net asset. If this difference is negative (negative goodwill), it is immediately booked in the result after revaluation of the values. Foreign currency The individual annual accounts of each Group member are presented in the currency of the primary economic environment in which the entity operates (its functional currency). For the preparation of the consolidated financial statements, the results and the financial position of each entity are expressed in euros, which is the functional currency of the parent company, and the currency used for the presentation of the consolidated financial statements. 1 Amendments to IAS 7 Statement of Cash Flows and IFRS 7 Financial Instruments: Disclosures: Supplier Finance Arrangements (applicable for annual periods beginning on or after 1 January 2024, but not yet endorsed in the EU) 1 Amendments to IAS 21 The Effects of Changes in Foreign Exchange Rates: Lack of Exchangeability (applicable for annual periods beginning on or after 1 January 2025, but not yet endorsed in the EU) III. Accounting principles Consolidation principles Subsidiaries Subsidiaries are entities over which the company exercises control. A company exercises control over a subsidiary if, and only if, the parent company: 1 has control over the shareholding; 1 is exposed to, or has rights to variable revenues, by virtue of its involvement in the participation; and 1 has the ability to use its control over the shareholding to influence the amount of investor returns. The companies in which the Group has control over the financial and operational policy in order to benefit from its activities are included in full in the Group's consolidated financial statements. This means that the Group's assets, liabilities and results are indicated in full. All intragroup transactions and profits are fully eliminated. Minority interests are holdings in subsidiaries that are not held directly or indirectly by the Group. Joint ventures and associated companies Joint ventures are companies over which the Group has joint control, as specified by contractual agreement. Such joint control is applicable when the strategic financial and WDP Annual accounts 2023 222
After initial recognition, the investment properties are valued at fair value, in accordance with IAS 40. From the seller's perspective, the valuation is after the deduction of the registration fees. These transaction costs depend on the geographical area where these properties are located. This entails that the transaction costs are incorporated into the earnings statement as per IAS 40. According to the GVV/SIR Royal Decree, this must then be included in the designated reserves at the end of the financial year. After initial recognition, the projects are valued at fair value. The fair value takes substantial development risks into account. In this respect, the following criteria must be met: there must be a clear understanding of the project costs, all permits required for the project development must have been obtained and a substantial part of the project development must be pre-let (finalised and signed lease). This fair value measurement is based on the valuation by the independent property expert (in accordance with customary methods and assumptions) and takes into account costs to be incurred (including an estimate of unforeseen costs) before the project is finally completed. The profit/loss realised on the sale is included in the earnings statement under Result on disposals of investment properties. The result is determined as per IAS 40 and is the difference between the sale price and the fair value from the most recent valuation. This result achieved is recognised at the time of execution of the notarial deed for the sale. Other tangible fixed assets Solar panels These are valued under the revaluation model as per IAS 16 Tangible fixed assets. After initial recognition, assets whose fair value can be reliably established must be booked at the revalued value, which is the fair value at the time of the revaluation, less any subsequent accumulated depreciation and impairment losses. The fair value is determined based on the discounting method for future revenues. The useful life of the solar panels is estimated at thirty years, without taking into account any residual value. Foreign currency transactions Transactions in foreign currency are immediately booked at the exchange rate on the transaction date. Monetary assets and liabilities in foreign currency are converted at the closing price. Realised and unrealised exchange rate differences are recognised in the earnings statement, except when they relate to intra-group borrowing that meets the definition of a net investment in a foreign activity. In that case, the exchange rate differences are included in a separate component of shareholders' equity and recognised in the earnings statement after the disposal of a net investment. Foreign activities Assets and liabilities are converted at the closing price, except for properties, which are converted at the historical rate. The earnings statement is converted at the average rate over the financial year. The resulting currency conversion differences are included in a separate component of shareholders' equity. These currency conversion differences are included in the earnings statement when the foreign entity is disposed of, sold or liquidated. Investment properties Land and buildings held to generate (future) rental income over the long term are included as investment properties. On initial recognition, investment properties are valued at the purchase price, including transaction costs, financing costs (per IAS 23) and directly attributable expenses. Land held for the purposes of initiating property developments with a view to subsequent leasing and long-term increase in value, but for which no specific construction plans or project developments (as referred to in the definition of project development) have been initiated (land reserves), is also deemed to be investment property. The usage rights recognised in the balance sheet for the concession, ground lease, or similar leases (due to entry into force of IFRS 16) are also considered investment properties. WDP Annual accounts 2023 223
The residual right held by WDP will be recognised at its fair value on each balance sheet date. This value will increase every year and will correspond to the market value of the full right of ownership at the end of the lease. These increases will be recognised in Variations in the fair value of investment properties in the earnings statement. Financial instruments Financial assets All financial assets are recognised or no longer recognised in the balance sheet on the transaction date if the purchase or sale of a financial asset is based on a contract prescribing conditions for delivery of the asset within the term generally prescribed or agreed on the market in question and initially valued at fair value, plus transaction costs, except for financial assets at fair value with changes in value in the earnings statement, which are initially valued at fair value. The financial assets are classified in one of the categories provided for in IFRS 9 Financial instruments based on both the business model of the entity for management of the financial assets and the properties of the contractual cash flows of the financial assets and are recorded on their initial recognition. This classification determines the valuation of the financial assets on future balance sheet dates: amortised cost or fair value. Financial assets at fair value through earnings or loss Financial assets are classified at fair value with changes in value through earnings or loss if they are held for trading purposes. Financial assets at fair value with changes in value through earnings or loss are valued at fair value, with all resulting income and expenses recognised in the result. Derivatives are also included in the category at fair value with changes in value through earnings or loss, unless they are considered to be hedges and are effective. The capital gain when starting a new site is recognised in a separate component of shareholders' equity. Capital losses are also recognised in this component, unless they have been realised or the fair value drops below the original cost less cumulative depreciation. In the latter case, they are included in the result. Lease WDP as lessee At the start of the lease period, the leases (except for leases with a maximum term of twelve months and leases whose underlying assets are of low value) are recognised on the balance sheet as usage rights and lease liabilities at the present value of the future lease payments. Next, all usage rights that qualify as investment properties are valued at fair value, in accordance with the valuation rules detailed under Investment properties. The minimum lease payments are recognised in part as financing costs and in part as a settlement of the outstanding liability, in a manner resulting in a constant periodic interest rate on the remaining balance of the liability. The financial expenses are offset directly against the result. The cost of financing is offset directly against the result. Conditional lease payments are incorporated as expenses in the periods in which they were made. WDP as lessor If a lease meets the conditions of a finance lease (according to IFRS 16), WDP as the lessor will recognise the lease from its start date as a receivable in the balance sheet at an amount equal to the net investment in the lease. The difference between this latter amount and the book value of the leased property (exclusive of the value of the residual right held by WDP) at the start of the lease will be recognised in the earnings statement for that period. Each periodic payment made by the lessee will be partly recognised by WDP as a repayment of the capital and partly as financial income based on a constant periodic return for WDP. WDP Annual accounts 2023 224
Financial liabilities at fair value through shareholders' equity Financial liabilities are classified at fair value through shareholders' equity if these are held for hedge accounting. Financial liabilities at fair value through shareholders' equity are valued at fair value, with all resulting income or expenses recognised in shareholders' equity. Derivatives also belong to the category at fair value through shareholders' equity if these were designated as hedges and are effective. Financial liabilities valued at amortised cost Financial liabilities valued at amortised cost, including debts, are initially valued at fair value after the deduction of the transaction costs. After initial recognition, they are valued at amortised cost. The Group's financial liabilities valued at amortised cost include the non-current financial liabilities (bank debts, lease debts, bond loans), other non-current liabilities, current financial liabilities, accounts payable and payable dividends in the other current liabilities. Revaluations as a result of variations in the foreign currency of the financial obligations valued at amortised cost in foreign currency are a non-cash item and are considered unavailable as such. Equity instruments Equity instruments issued by the Group are classified based on the economic reality of the contractual agreements and the definitions of an equity instrument. An equity instrument is any contract that includes the remaining interest in the assets of the Group, after the deduction of all liabilities. The accounting policies with regard to equity instruments are described below. Equity instruments issued by the company are recognised for the sum of the amounts received (after the deduction of directly attributable issue costs). Financial assets at fair value through shareholders' equity Financial assets are classified at fair value with changes in value through shareholders' equity if they are held for hedge accounting. Financial assets at fair value with changes in value due to shareholders' equity are valued at fair value, with any resulting income or expenses recognised in shareholders' equity. Derivatives also belong to the category at fair value with changes in value through shareholders' equity if they were designated and effective as hedges. Financial assets at amortised cost Financial assets at amortised cost are not derivatives and are retained within a business model geared towards retaining financial assets to receive contractual cash flows (Held to collect) and on certain dates, the contractual conditions of the financial asset give rise to cash flows that are exclusively for the settlement of and interest payments on the outstanding principal (Solely Payments of Principal and Interest – SPPI). This category includes cash and cash equivalents, long-term receivables and trade receivables. Cash equivalents are short-term, very often liquid investments that can be immediately converted to cash of a known amount, have an original term of no more than three months and entail no significant risks of impairment. The cash equivalents held by WDP consist of bank deposits and are therefore fully valued at amortised cost. Financial liabilities Financial liabilities are classified as financial liabilities at fair value through earnings or loss or as financial liabilities at amortised cost. Financial liabilities at fair value through earnings or loss Financial liabilities are classified at fair value through earnings or loss if they are held for trading purposes. Specifically, for WDP, these are Interest Rate Swaps for which hedge accounting is not applied to the extent that they have a negative fair value. Financial liabilities at fair value through earnings or loss are valued at fair value, with all resulting income and expenses recognised in the result. A financial liability is included in this category if it is primarily acquired for sale in the short term. Derivatives are also included in the category at fair value through earnings or loss, unless they are considered to be hedges and are effective. WDP Annual accounts 2023 225
Costs Costs related to leases pertaining to impairments and reversal of impairments of trade receivables are recognised in the results when the book value is higher than the estimated realisation value and the rent to be paid on leased assets. Property costs, taxes and the recovery of these costs fall to the tenant or lessee by law or custom. Depending on the contractual agreements, the owner may or may not pass these charges on to the tenant. Other operating income and expenses include the passing of management fees on to tenants as well as other revenues that do not fall under rental income (including revenue from solar energy). The General Company expenses are expenses related to the management and general operation of WDP. This includes expenses such as general administrative costs, staff costs for general management, and depreciation of assets used for general management. Costs related to works performed in the buildings are booked in various ways depending on the type of work: 1 maintenance and repair: maintenance and repair costs are booked as property costs for the accounting period, given that these do not increase the expected future economic benefits of the building and do not add any functionality or improve the level of comfort in the building; 1 improvement and renovation: these are works carried out occasionally to add features to the property and considerably increase the expected future economic benefits of the building. The costs of these works (materials, contractor remuneration, technical studies, internal expenses, architect remuneration and interest during the construction - period) are capitalised. Examples: installation of a new air conditioning system, new roof, thorough renovation of all or part of the building. Worksites for which costs are being capitalised are identified beforehand according to the above-mentioned criteria. Net interest charges show the net interest on permitted hedging instruments. They are also shown net in the cash flow statement under Interest paid. Derivatives The Group uses derivatives to limit risks related to unfavourable interest rates resulting from the operational, financial and investment activities within the framework of its operational management. The Group does not use these instruments for speculative purposes, does not hold any derivatives and does not issue derivatives for trading purposes. Changes in the fair value of derivatives that do not qualify as hedging transactions are recognised immediately in earnings or loss under the heading Changes in fair value of hedging instruments. Changes in the fair value of derivatives allocated specifically to hedge the variability of cash flows of a recognised asset or liability or a forecast transaction are recognised in Other elements in the overall result. Revenue Rental income includes rents and revenues directly related to these, such as compensation for early lease termination. Revenue is valued at the fair value of the received or receivable compensation. Revenue is only recognised if it is likely that the economic benefits will befall the entity and can be determined with sufficient certainty. Rental income, and other income and expenses, are recognised in the earnings statement in the period to which they pertain. The fees for premature lease termination are recognised immediately in the result for the financial year. The proceeds from the sale of green power to the tenant, the sale of green power to the lessor and green power certificates are recognised at the time the green power is generated. WDP Annual accounts 2023 226
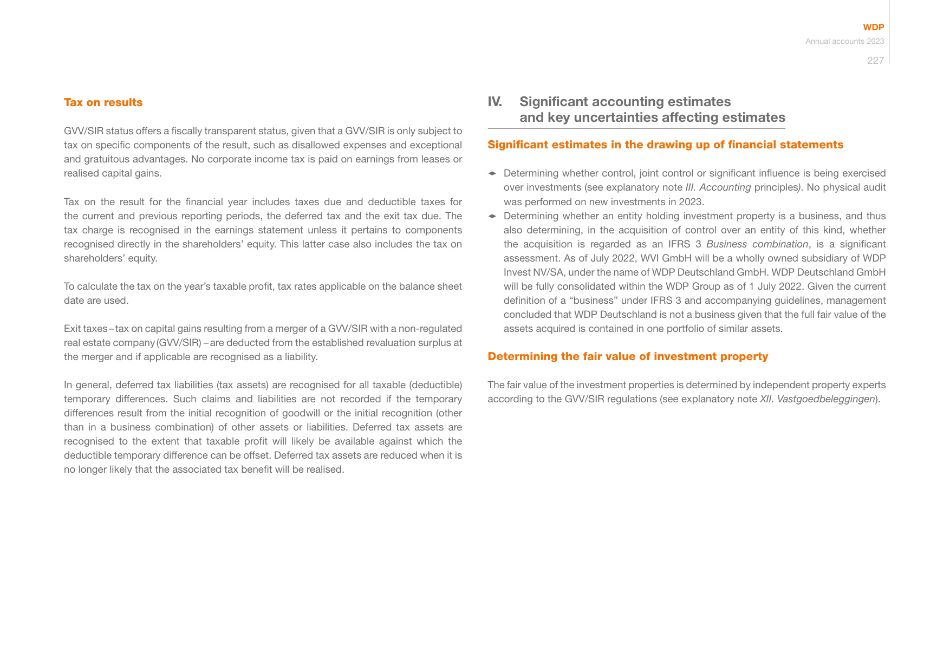
IV. Significant accounting estimates and key uncertainties affecting estimates Significant estimates in the drawing up of financial statements 1 Determining whether control, joint control or significant influence is being exercised over investments (see explanatory note III. Accounting principles). No physical audit was performed on new investments in 2023. 1 Determining whether an entity holding investment property is a business, and thus also determining, in the acquisition of control over an entity of this kind, whether the acquisition is regarded as an IFRS 3 Business combination, is a significant assessment. As of July 2022, WVI GmbH will be a wholly owned subsidiary of WDP Invest NV/SA, under the name of WDP Deutschland GmbH. WDP Deutschland GmbH will be fully consolidated within the WDP Group as of 1 July 2022. Given the current definition of a "business" under IFRS 3 and accompanying guidelines, management concluded that WDP Deutschland is not a business given that the full fair value of the assets acquired is contained in one portfolio of similar assets. Determining the fair value of investment property The fair value of the investment properties is determined by independent property experts according to the GVV/SIR regulations (see explanatory note XII. Vastgoedbeleggingen). Tax on results GVV/SIR status offers a fiscally transparent status, given that a GVV/SIR is only subject to tax on specific components of the result, such as disallowed expenses and exceptional and gratuitous advantages. No corporate income tax is paid on earnings from leases or realised capital gains. Tax on the result for the financial year includes taxes due and deductible taxes for the current and previous reporting periods, the deferred tax and the exit tax due. The tax charge is recognised in the earnings statement unless it pertains to components recognised directly in the shareholders' equity. This latter case also includes the tax on shareholders' equity. To calculate the tax on the year's taxable profit, tax rates applicable on the balance sheet date are used. Exit taxes – tax on capital gains resulting from a merger of a GVV/SIR with a non-regulated real estate company (GVV/SIR) – are deducted from the established revaluation surplus at the merger and if applicable are recognised as a liability. In general, deferred tax liabilities (tax assets) are recognised for all taxable (deductible) temporary differences. Such claims and liabilities are not recorded if the temporary differences result from the initial recognition of goodwill or the initial recognition (other than in a business combination) of other assets or liabilities. Deferred tax assets are recognised to the extent that taxable profit will likely be available against which the deductible temporary difference can be offset. Deferred tax assets are reduced when it is no longer likely that the associated tax benefit will be realised. WDP Annual accounts 2023 227
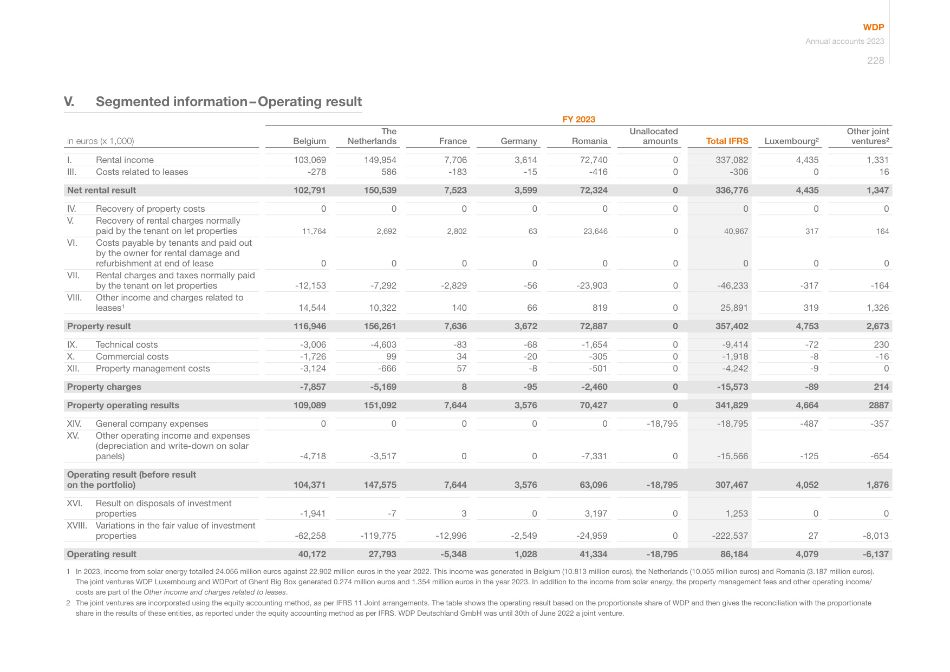
V. Segmented information – Operating result in euros (x 1,000) FY 2023 Belgium The Netherlands France Germany Romania Unallocated amounts Total IFRS Luxembourg² Other joint ventures² I. Rental income 103,069 149,954 7,706 3,614 72,740 0 337,082 4,435 1,331 III. Costs related to leases -278 586 -183 -15 -416 0 -306 0 16 Net rental result 102,791 150,539 7,523 3,599 72,324 0 336,776 4,435 1,347 IV. Recovery of property costs 0 0 0 0 0 0 0 0 0 V. Recovery of rental charges normally paid by the tenant on let properties 11,764 2,692 2,802 63 23,646 0 40,967 317 164 VI. Costs payable by tenants and paid out by the owner for rental damage and refurbishment at end of lease 0 0 0 0 0 0 0 0 0 VII. Rental charges and taxes normally paid by the tenant on let properties -12,153 -7,292 -2,829 -56 -23,903 0 -46,233 -317 -164 VIII. Other income and charges related to leases¹ 14,544 10,322 140 66 819 0 25,891 319 1,326 Property result 116,946 156,261 7,636 3,672 72,887 0 357,402 4,753 2,673 IX. Technical costs -3,006 -4,603 -83 -68 -1,654 0 -9,414 -72 230 X. Commercial costs -1,726 99 34 -20 -305 0 -1,918 -8 -16 XII. Property management costs -3,124 -666 57 -8 -501 0 -4,242 -9 0 Property charges -7,857 -5,169 8 -95 -2,460 0 -15,573 -89 214 Property operating results 109,089 151,092 7,644 3,576 70,427 0 341,829 4,664 2887 XIV. General company expenses 0 0 0 0 0 -18,795 -18,795 -487 -357 XV. Other operating income and expenses (depreciation and write-down on solar panels) -4,718 -3,517 0 0 -7,331 0 -15,566 -125 -654 Operating result (before result on the portfolio) 104,371 147,575 7,644 3,576 63,096 -18,795 307,467 4,052 1,876 XVI. Result on disposals of investment properties -1,941 -7 3 0 3,197 0 1,253 0 0 XVIII. Variations in the fair value of investment properties -62,258 -119,775 -12,996 -2,549 -24,959 0 -222,537 27 -8,013 Operating result 40,172 27,793 -5,348 1,028 41,334 -18,795 86,184 4,079 -6,137 1 In 2023, income from solar energy totalled 24.056 million euros against 22.902 million euros in the year 2022. This income was generated in Belgium (10.813 million euros), the Netherlands (10.055 million euros) and Romania (3.187 million euros). The joint ventures WDP Luxembourg and WDPort of Ghent Big Box generated 0.274 million euros and 1.354 million euros in the year 2023. In addition to the income from solar energy, the property management fees and other operating income/ costs are part of the Other income and charges related to leases. 2 The joint ventures are incorporated using the equity accounting method, as per IFRS 11 Joint arrangements. The table shows the operating result based on the proportionate share of WDP and then gives the reconciliation with the proportionate share in the results of these entities, as reported under the equity accounting method as per IFRS. WDP Deutschland GmbH was until 30th of June 2022 a joint venture. WDP Annual accounts 2023 228
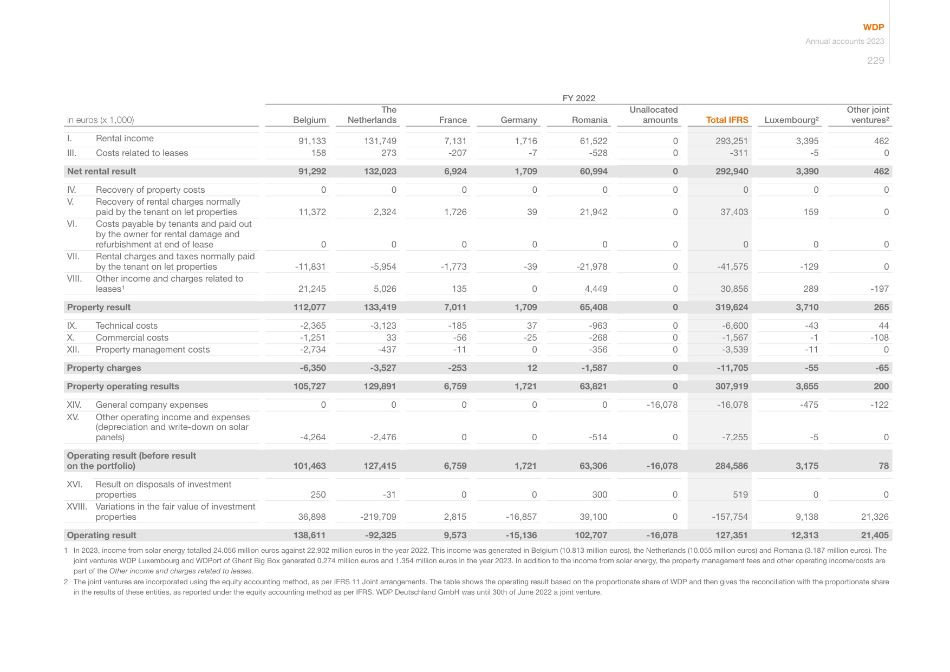
in euros (x 1,000) FY 2022 Belgium The Netherlands France Germany Romania Unallocated amounts Total IFRS Luxembourg² Other joint ventures² I. Rental income 91,133 131,749 7,131 1,716 61,522 0 293,251 3,395 462 III. Costs related to leases 158 273 -207 -7 -528 0 -311 -5 0 Net rental result 91,292 132,023 6,924 1,709 60,994 0 292,940 3,390 462 IV. Recovery of property costs 0 0 0 0 0 0 0 0 0 V. Recovery of rental charges normally paid by the tenant on let properties 11,372 2,324 1,726 39 21,942 0 37,403 159 0 VI. Costs payable by tenants and paid out by the owner for rental damage and refurbishment at end of lease 0 0 0 0 0 0 0 0 0 VII. Rental charges and taxes normally paid by the tenant on let properties -11,831 -5,954 -1,773 -39 -21,978 0 -41,575 -129 0 VIII. Other income and charges related to leases¹ 21,245 5,026 135 0 4,449 0 30,856 289 -197 Property result 112,077 133,419 7,011 1,709 65,408 0 319,624 3,710 265 IX. Technical costs -2,365 -3,123 -185 37 -963 0 -6,600 -43 44 X. Commercial costs -1,251 33 -56 -25 -268 0 -1,567 -1 -108 XII. Property management costs -2,734 -437 -11 0 -356 0 -3,539 -11 0 Property charges -6,350 -3,527 -253 12 -1,587 0 -11,705 -55 -65 Property operating results 105,727 129,891 6,759 1,721 63,821 0 307,919 3,655 200 XIV. General company expenses 0 0 0 0 0 -16,078 -16,078 -475 -122 XV. Other operating income and expenses (depreciation and write-down on solar panels) -4,264 -2,476 0 0 -514 0 -7,255 -5 0 Operating result (before result on the portfolio) 101,463 127,415 6,759 1,721 63,306 -16,078 284,586 3,175 78 XVI. Result on disposals of investment properties 250 -31 0 0 300 0 519 0 0 XVIII. Variations in the fair value of investment properties 36,898 -219,709 2,815 -16,857 39,100 0 -157,754 9,138 21,326 Operating result 138,611 -92,325 9,573 -15,136 102,707 -16,078 127,351 12,313 21,405 1 In 2023, income from solar energy totalled 24.056 million euros against 22.902 million euros in the year 2022. This income was generated in Belgium (10.813 million euros), the Netherlands (10.055 million euros) and Romania (3.187 million euros). The joint ventures WDP Luxembourg and WDPort of Ghent Big Box generated 0.274 million euros and 1.354 million euros in the year 2023. In addition to the income from solar energy, the property management fees and other operating income/costs are part of the Other income and charges related to leases. 2 The joint ventures are incorporated using the equity accounting method, as per IFRS 11 Joint arrangements. The table shows the operating result based on the proportionate share of WDP and then gives the reconciliation with the proportionate share in the results of these entities, as reported under the equity accounting method as per IFRS. WDP Deutschland GmbH was until 30th of June 2022 a joint venture. WDP Annual accounts 2023 229
The basis for reporting per segment within WDP is the geographical region. This segmentation basis reflects the geographical markets in Europe in which WDP is active. WDP's business is subdivided in five regions. More information on which subsidiaries are located within the geographical regions can be found in the group structure, see note VII. Information on subsidiaries. This segmentation is important for WDP given that the nature of its business, its customers, etc. represent similar economic characteristics within these segments. Business decisions are taken at this level and different key performance indicators (such as rental income, occupancy rates, etc.) are monitored in this manner. A second segmenting basis is not considered relevant by WDP as the business mainly focuses on the leasing of logistics sites. WDP Annual accounts 2023 230
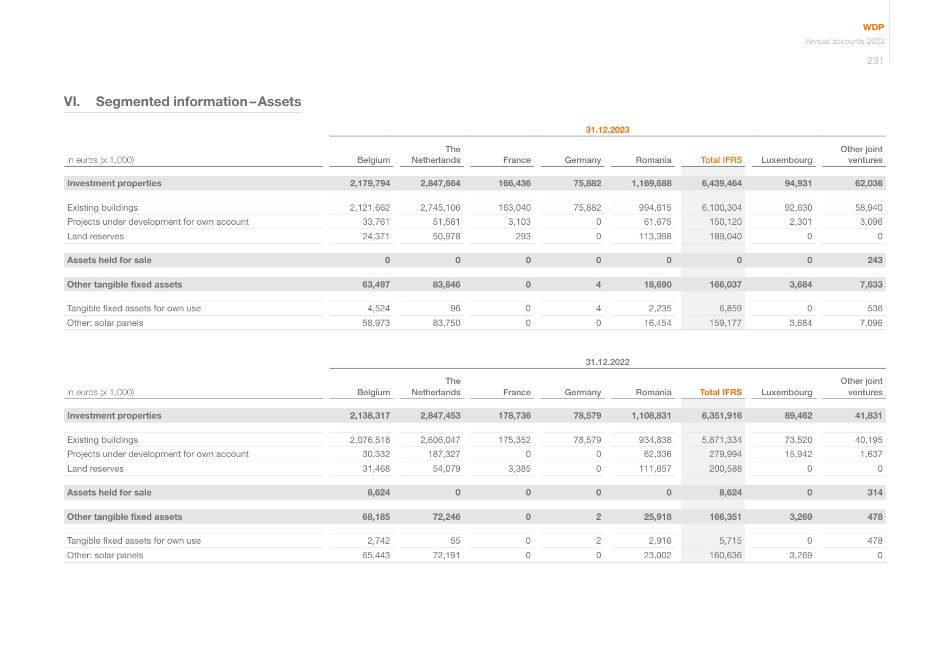
VI. Segmented information – Assets 31.12.2023 in euros (x 1,000) Belgium The Netherlands France Germany Romania Total IFRS Luxembourg Other joint ventures Investment properties 2,179,794 2,847,664 166,436 75,882 1,169,688 6,439,464 94,931 62,036 Existing buildings 2,121,662 2,745,106 163,040 75,882 994,615 6,100,304 92,630 58,940 Projects under development for own account 33,761 51,581 3,103 0 61,675 150,120 2,301 3,096 Land reserves 24,371 50,978 293 0 113,398 189,040 0 0 Assets held for sale 0 0 0 0 0 0 0 243 Other tangible fixed assets 63,497 83,846 0 4 18,690 166,037 3,684 7,633 Tangible fixed assets for own use 4,524 96 0 4 2,235 6,859 0 536 Other: solar panels 58,973 83,750 0 0 16,454 159,177 3,684 7,096 31.12.2022 in euros (x 1,000) Belgium The Netherlands France Germany Romania Total IFRS Luxembourg Other joint ventures Investment properties 2,138,317 2,847,453 178,736 78,579 1,108,831 6,351,916 89,462 41,831 Existing buildings 2,076,518 2,606,047 175,352 78,579 934,838 5,871,334 73,520 40,195 Projects under development for own account 30,332 187,327 0 0 62,336 279,994 15,942 1,637 Land reserves 31,468 54,079 3,385 0 111,657 200,588 0 0 Assets held for sale 8,624 0 0 0 0 8,624 0 314 Other tangible fixed assets 68,185 72,246 0 2 25,918 166,351 3,269 478 Tangible fixed assets for own use 2,742 55 0 2 2,916 5,715 0 478 Other: solar panels 65,443 72,191 0 0 23,002 160,636 3,269 0 WDP Annual accounts 2023 231
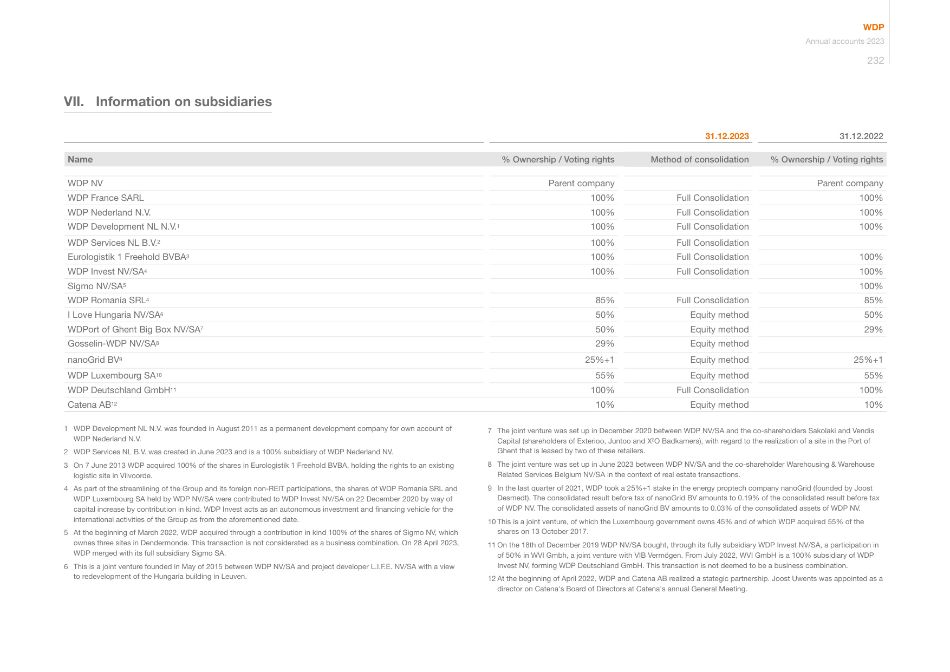
VII. Information on subsidiaries 31.12.2023 31.12.2022 Name % Ownership / Voting rights Method of consolidation % Ownership / Voting rights WDP NV Parent company Parent company WDP France SARL 100% Full Consolidation 100% WDP Nederland N.V. 100% Full Consolidation 100% WDP Development NL N.V.1 100% Full Consolidation 100% WDP Services NL B.V.2 100% Full Consolidation Eurologistik 1 Freehold BVBA3 100% Full Consolidation 100% WDP Invest NV/SA4 100% Full Consolidation 100% Sigmo NV/SA5 100% WDP Romania SRL4 85% Full Consolidation 85% I Love Hungaria NV/SA6 50% Equity method 50% WDPort of Ghent Big Box NV/SA7 50% Equity method 29% Gosselin-WDP NV/SA8 29% Equity method nanoGrid BV9 25%+1 Equity method 25%+1 WDP Luxembourg SA10 55% Equity method 55% WDP Deutschland GmbH11 100% Full Consolidation 100% Catena AB12 10% Equity method 10% 1 WDP Development NL N.V. was founded in August 2011 as a permanent development company for own account of WDP Nederland N.V. 2 WDP Services NL B.V. was created in June 2023 and is a 100% subsidiary of WDP Nederland NV. 3 On 7 June 2013 WDP acquired 100% of the shares in Eurologistik 1 Freehold BVBA, holding the rights to an existing logistic site in Vilvoorde. 4 As part of the streamlining of the Group and its foreign non-REIT participations, the shares of WDP Romania SRL and WDP Luxembourg SA held by WDP NV/SA were contributed to WDP Invest NV/SA on 22 December 2020 by way of capital increase by contribution in kind. WDP Invest acts as an autonomous investment and financing vehicle for the international activities of the Group as from the aforementioned date. 5 At the beginning of March 2022, WDP acquired through a contribution in kind 100% of the shares of Sigmo NV, which ownes three sites in Dendermonde. This transaction is not considerated as a business combination. On 28 April 2023, WDP merged with its full subsidiary Sigmo SA. 6 This is a joint venture founded in May of 2015 between WDP NV/SA and project developer L.I.F.E. NV/SA with a view to redevelopment of the Hungaria building in Leuven. 7 The joint venture was set up in December 2020 between WDP NV/SA and the co-shareholders Sakolaki and Vendis Capital (shareholders of Exterioo, Juntoo and X²O Badkamers), with regard to the realization of a site in the Port of Ghent that is leased by two of these retailers. 8 The joint venture was set up in June 2023 between WDP NV/SA and the co-shareholder Warehousing & Warehouse Related Services Belgium NV/SA in the context of real estate transactions. 9 In the last quarter of 2021, WDP took a 25%+1 stake in the energy proptech company nanoGrid (founded by Joost Desmedt). The consolidated result before tax of nanoGrid BV amounts to 0.19% of the consolidated result before tax of WDP NV. The consolidated assets of nanoGrid BV amounts to 0.03% of the consolidated assets of WDP NV. 10 This is a joint venture, of which the Luxembourg government owns 45% and of which WDP acquired 55% of the shares on 13 October 2017. 11 On the 18th of December 2019 WDP NV/SA bought, through its fully subsidiary WDP Invest NV/SA, a participation in of 50% in WVI Gmbh, a joint venture with VIB Vermögen. From July 2022, WVI GmbH is a 100% subsidiary of WDP Invest NV, forming WDP Deutschland GmbH. This transaction is not deemed to be a business combination. 12 At the beginning of April 2022, WDP and Catena AB realized a stategic partnership. Joost Uwents was appointed as a director on Catena's Board of Directors at Catena's annual General Meeting. WDP Annual accounts 2023 232
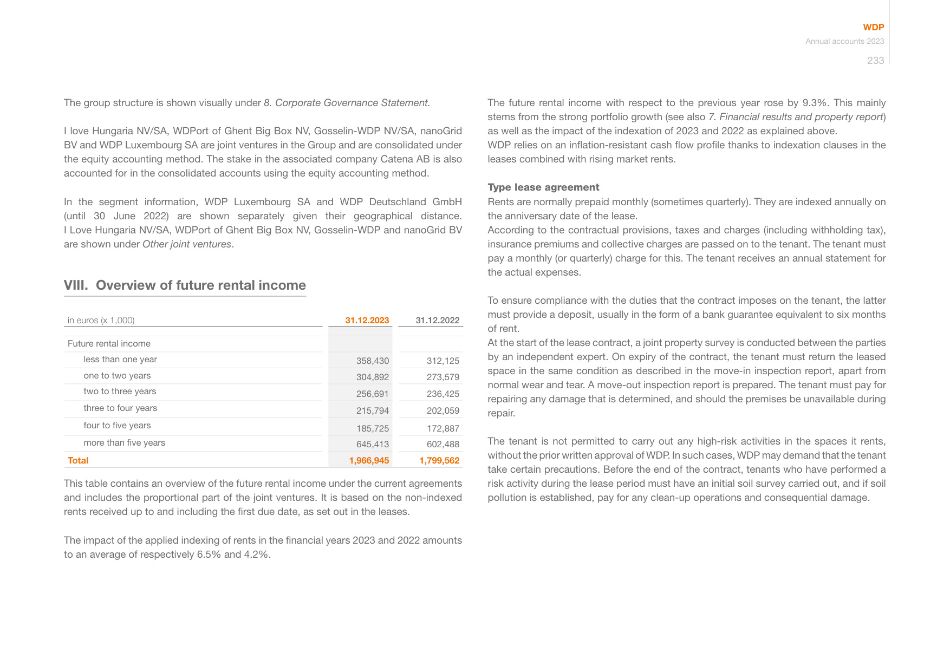
The future rental income with respect to the previous year rose by 9.3%. This mainly stems from the strong portfolio growth (see also 7. Financial results and property report) as well as the impact of the indexation of 2023 and 2022 as explained above. WDP relies on an inflation-resistant cash flow profile thanks to indexation clauses in the leases combined with rising market rents. Type lease agreement Rents are normally prepaid monthly (sometimes quarterly). They are indexed annually on the anniversary date of the lease. According to the contractual provisions, taxes and charges (including withholding tax), insurance premiums and collective charges are passed on to the tenant. The tenant must pay a monthly (or quarterly) charge for this. The tenant receives an annual statement for the actual expenses. To ensure compliance with the duties that the contract imposes on the tenant, the latter must provide a deposit, usually in the form of a bank guarantee equivalent to six months of rent. At the start of the lease contract, a joint property survey is conducted between the parties by an independent expert. On expiry of the contract, the tenant must return the leased space in the same condition as described in the move-in inspection report, apart from normal wear and tear. A move-out inspection report is prepared. The tenant must pay for repairing any damage that is determined, and should the premises be unavailable during repair. The tenant is not permitted to carry out any high-risk activities in the spaces it rents, without the prior written approval of WDP. In such cases, WDP may demand that the tenant take certain precautions. Before the end of the contract, tenants who have performed a risk activity during the lease period must have an initial soil survey carried out, and if soil pollution is established, pay for any clean-up operations and consequential damage. The group structure is shown visually under 8. Corporate Governance Statement. I love Hungaria NV/SA, WDPort of Ghent Big Box NV, Gosselin-WDP NV/SA, nanoGrid BV and WDP Luxembourg SA are joint ventures in the Group and are consolidated under the equity accounting method. The stake in the associated company Catena AB is also accounted for in the consolidated accounts using the equity accounting method. In the segment information, WDP Luxembourg SA and WDP Deutschland GmbH (until 30 June 2022) are shown separately given their geographical distance. I Love Hungaria NV/SA, WDPort of Ghent Big Box NV, Gosselin-WDP and nanoGrid BV are shown under Other joint ventures. VIII. Overview of future rental income in euros (x 1,000) 31.12.2023 31.12.2022 Future rental income less than one year 358,430 312,125 one to two years 304,892 273,579 two to three years 256,691 236,425 three to four years 215,794 202,059 four to five years 185,725 172,887 more than five years 645,413 602,488 Total 1,966,945 1,799,562 This table contains an overview of the future rental income under the current agreements and includes the proportional part of the joint ventures. It is based on the non-indexed rents received up to and including the first due date, as set out in the leases. The impact of the applied indexing of rents in the financial years 2023 and 2022 amounts to an average of respectively 6.5% and 4.2%. WDP Annual accounts 2023 233
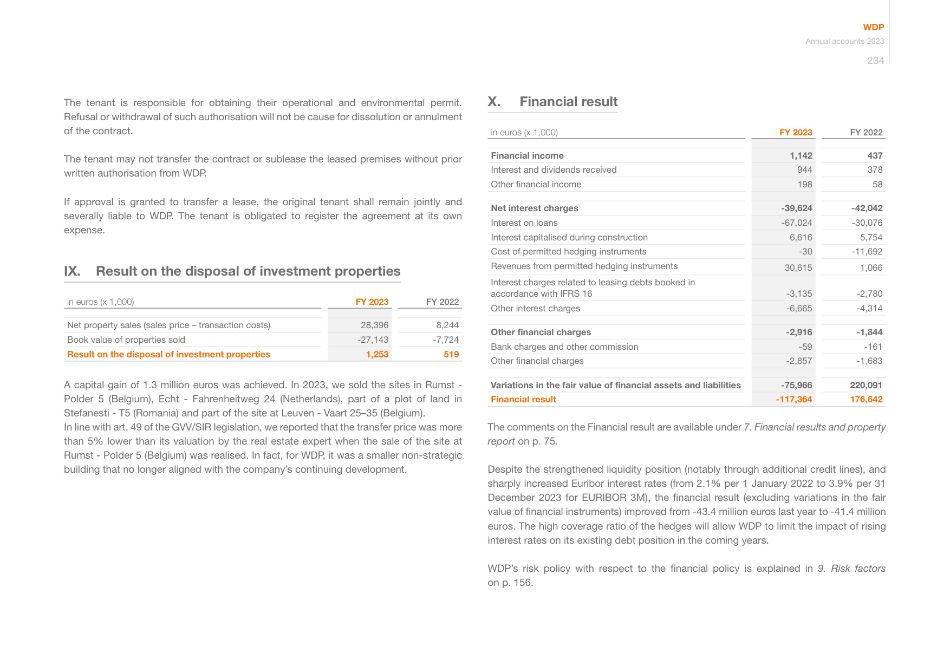
X. Financial result in euros (x 1,000) FY 2023 FY 2022 Financial income 1,142 437 Interest and dividends received 944 378 Other financial income 198 58 Net interest charges -39,624 -42,042 Interest on loans -67,024 -30,076 Interest capitalised during construction 6,616 5,754 Cost of permitted hedging instruments -30 -11,692 Revenues from permitted hedging instruments 30,615 1,066 Interest charges related to leasing debts booked in accordance with IFRS 16 -3,135 -2,780 Other interest charges -6,665 -4,314 Other financial charges -2,916 -1,844 Bank charges and other commission -59 -161 Other financial charges -2,857 -1,683 Variations in the fair value of financial assets and liabilities -75,966 220,091 Financial result -117,364 176,642 The comments on the Financial result are available under 7. Financial results and property report on p. 75. Despite the strengthened liquidity position (notably through additional credit lines), and sharply increased Euribor interest rates (from 2.1% per 1 January 2022 to 3.9% per 31 December 2023 for EURIBOR 3M), the financial result (excluding variations in the fair value of financial instruments) improved from -43.4 million euros last year to -41.4 million euros. The high coverage ratio of the hedges will allow WDP to limit the impact of rising interest rates on its existing debt position in the coming years. WDP's risk policy with respect to the financial policy is explained in 9. Risk factors on p. 156. The tenant is responsible for obtaining their operational and environmental permit. Refusal or withdrawal of such authorisation will not be cause for dissolution or annulment of the contract. The tenant may not transfer the contract or sublease the leased premises without prior written authorisation from WDP. If approval is granted to transfer a lease, the original tenant shall remain jointly and severally liable to WDP. The tenant is obligated to register the agreement at its own expense. IX. Result on the disposal of investment properties in euros (x 1,000) FY 2023 FY 2022 Net property sales (sales price – transaction costs) 28,396 8,244 Book value of properties sold -27,143 -7,724 Result on the disposal of investment properties 1,253 519 A capital gain of 1.3 million euros was achieved. In 2023, we sold the sites in Rumst - Polder 5 (Belgium), Echt - Fahrenheitweg 24 (Netherlands), part of a plot of land in Stefanesti - T5 (Romania) and part of the site at Leuven - Vaart 25–35 (Belgium). In line with art. 49 of the GVV/SIR legislation, we reported that the transfer price was more than 5% lower than its valuation by the real estate expert when the sale of the site at Rumst - Polder 5 (Belgium) was realised. In fact, for WDP, it was a smaller non-strategic building that no longer aligned with the company's continuing development. WDP Annual accounts 2023 234
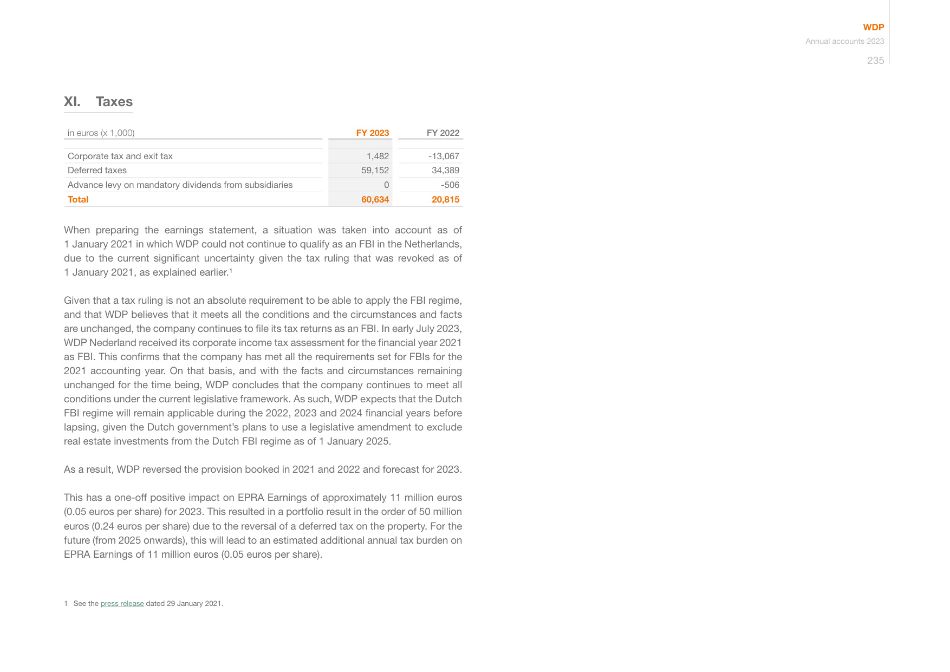
XI. Taxes in euros (x 1,000) FY 2023 FY 2022 Corporate tax and exit tax 1,482 -13,067 Deferred taxes 59,152 34,389 Advance levy on mandatory dividends from subsidiaries 0 -506 Total 60,634 20,815 When preparing the earnings statement, a situation was taken into account as of 1 January 2021 in which WDP could not continue to qualify as an FBI in the Netherlands, due to the current significant uncertainty given the tax ruling that was revoked as of 1 January 2021, as explained earlier.1 Given that a tax ruling is not an absolute requirement to be able to apply the FBI regime, and that WDP believes that it meets all the conditions and the circumstances and facts are unchanged, the company continues to file its tax returns as an FBI. In early July 2023, WDP Nederland received its corporate income tax assessment for the financial year 2021 as FBI. This confirms that the company has met all the requirements set for FBIs for the 2021 accounting year. On that basis, and with the facts and circumstances remaining unchanged for the time being, WDP concludes that the company continues to meet all conditions under the current legislative framework. As such, WDP expects that the Dutch FBI regime will remain applicable during the 2022, 2023 and 2024 financial years before lapsing, given the Dutch government's plans to use a legislative amendment to exclude real estate investments from the Dutch FBI regime as of 1 January 2025. As a result, WDP reversed the provision booked in 2021 and 2022 and forecast for 2023. This has a one-off positive impact on EPRA Earnings of approximately 11 million euros (0.05 euros per share) for 2023. This resulted in a portfolio result in the order of 50 million euros (0.24 euros per share) due to the reversal of a deferred tax on the property. For the future (from 2025 onwards), this will lead to an estimated additional annual tax burden on EPRA Earnings of 11 million euros (0.05 euros per share). 1 See the press release dated 29 January 2021. WDP Annual accounts 2023 235
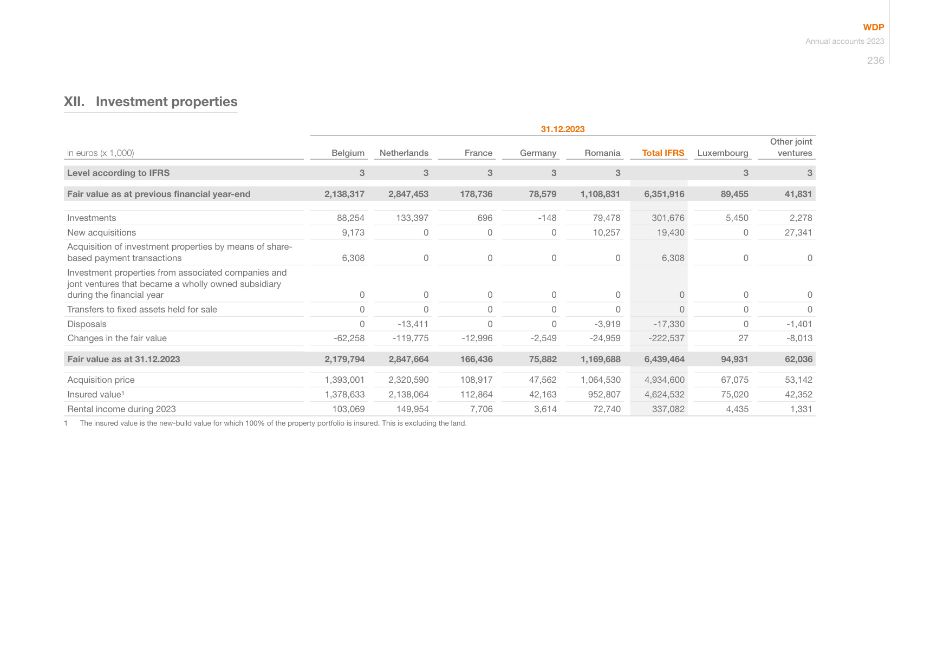
XII. Investment properties 31.12.2023 in euros (x 1,000) Belgium Netherlands France Germany Romania Total IFRS Luxembourg Other joint ventures Level according to IFRS 3 3 3 3 3 3 3 Fair value as at previous financial year-end 2,138,317 2,847,453 178,736 78,579 1,108,831 6,351,916 89,455 41,831 Investments 88,254 133,397 696 -148 79,478 301,676 5,450 2,278 New acquisitions 9,173 0 0 0 10,257 19,430 0 27,341 Acquisition of investment properties by means of share- based payment transactions 6,308 0 0 0 0 6,308 0 0 Investment properties from associated companies and jont ventures that became a wholly owned subsidiary during the financial year 0 0 0 0 0 0 0 0 Transfers to fixed assets held for sale 0 0 0 0 0 0 0 0 Disposals 0 -13,411 0 0 -3,919 -17,330 0 -1,401 Changes in the fair value -62,258 -119,775 -12,996 -2,549 -24,959 -222,537 27 -8,013 Fair value as at 31.12.2023 2,179,794 2,847,664 166,436 75,882 1,169,688 6,439,464 94,931 62,036 Acquisition price 1,393,001 2,320,590 108,917 47,562 1,064,530 4,934,600 67,075 53,142 Insured value¹ 1,378,633 2,138,064 112,864 42,163 952,807 4,624,532 75,020 42,352 Rental income during 2023 103,069 149,954 7,706 3,614 72,740 337,082 4,435 1,331 1 The insured value is the new-build value for which 100% of the property portfolio is insured. This is excluding the land. WDP Annual accounts 2023 236
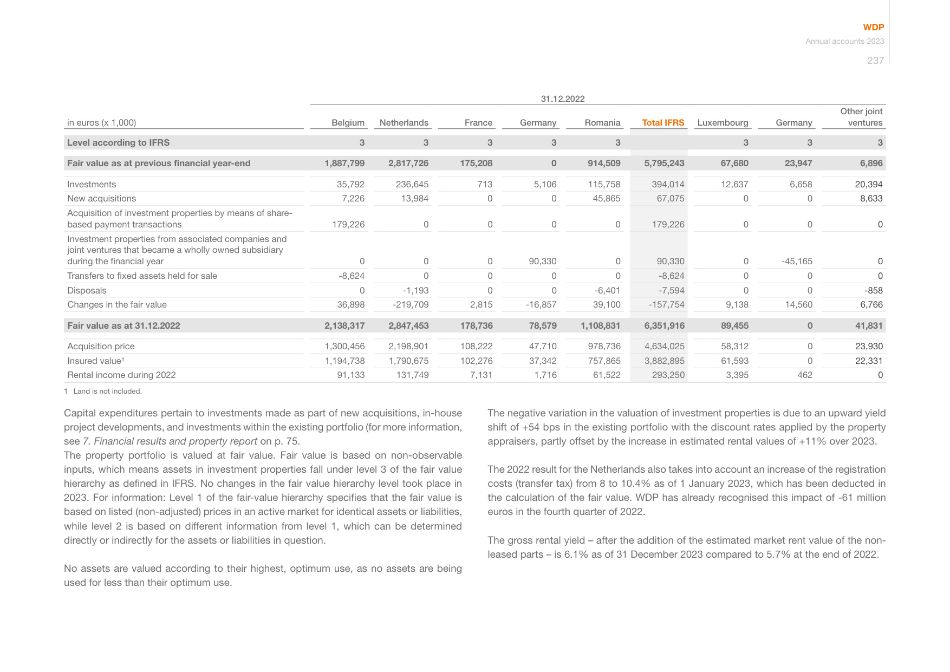
The negative variation in the valuation of investment properties is due to an upward yield shift of +54 bps in the existing portfolio with the discount rates applied by the property appraisers, partly offset by the increase in estimated rental values of +11% over 2023. The 2022 result for the Netherlands also takes into account an increase of the registration costs (transfer tax) from 8 to 10.4% as of 1 January 2023, which has been deducted in the calculation of the fair value. WDP has already recognised this impact of -61 million euros in the fourth quarter of 2022. The gross rental yield – after the addition of the estimated market rent value of the non- leased parts – is 6.1% as of 31 December 2023 compared to 5.7% at the end of 2022. 31.12.2022 in euros (x 1,000) Belgium Netherlands France Germany Romania Total IFRS Luxembourg Germany Other joint ventures Level according to IFRS 3 3 3 3 3 3 3 3 Fair value as at previous financial year-end 1,887,799 2,817,726 175,208 0 914,509 5,795,243 67,680 23,947 6,896 Investments 35,792 236,645 713 5,106 115,758 394,014 12,637 6,658 20,394 New acquisitions 7,226 13,984 0 0 45,865 67,075 0 0 8,633 Acquisition of investment properties by means of share- based payment transactions 179,226 0 0 0 0 179,226 0 0 0 Investment properties from associated companies and joint ventures that became a wholly owned subsidiary during the financial year 0 0 0 90,330 0 90,330 0 -45,165 0 Transfers to fixed assets held for sale -8,624 0 0 0 0 -8,624 0 0 0 Disposals 0 -1,193 0 0 -6,401 -7,594 0 0 -858 Changes in the fair value 36,898 -219,709 2,815 -16,857 39,100 -157,754 9,138 14,560 6,766 Fair value as at 31.12.2022 2,138,317 2,847,453 178,736 78,579 1,108,831 6,351,916 89,455 0 41,831 Acquisition price 1,300,456 2,198,901 108,222 47,710 978,736 4,634,025 58,312 0 23,930 Insured value¹ 1,194,738 1,790,675 102,276 37,342 757,865 3,882,895 61,593 0 22,331 Rental income during 2022 91,133 131,749 7,131 1,716 61,522 293,250 3,395 462 0 1 Land is not included. Capital expenditures pertain to investments made as part of new acquisitions, in-house project developments, and investments within the existing portfolio (for more information, see 7. Financial results and property report on p. 75. The property portfolio is valued at fair value. Fair value is based on non-observable inputs, which means assets in investment properties fall under level 3 of the fair value hierarchy as defined in IFRS. No changes in the fair value hierarchy level took place in 2023. For information: Level 1 of the fair-value hierarchy specifies that the fair value is based on listed (non-adjusted) prices in an active market for identical assets or liabilities, while level 2 is based on different information from level 1, which can be determined directly or indirectly for the assets or liabilities in question. No assets are valued according to their highest, optimum use, as no assets are being used for less than their optimum use. WDP Annual accounts 2023 237
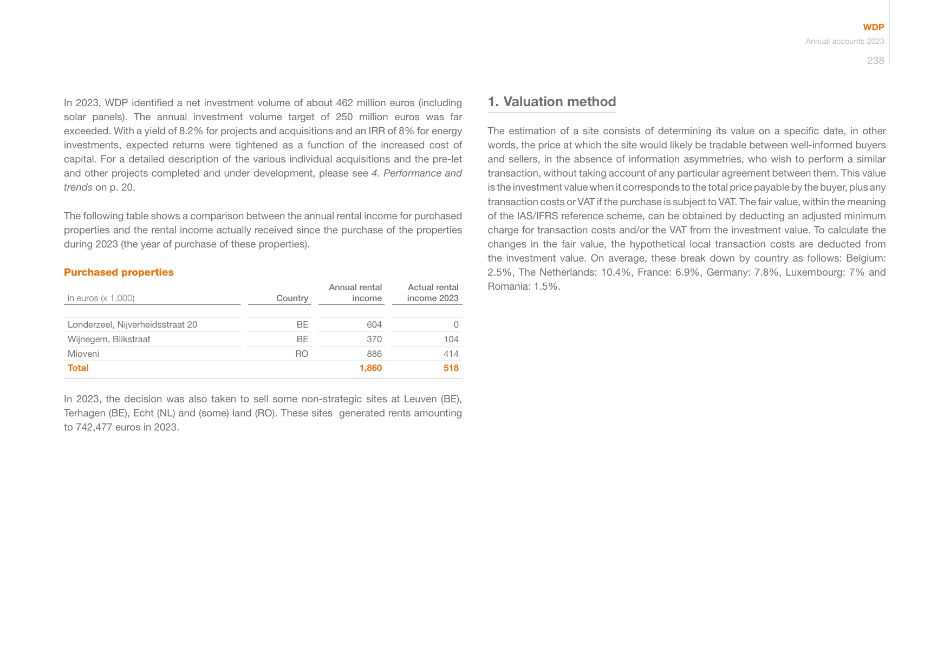
In 2023, WDP identified a net investment volume of about 462 million euros (including solar panels). The annual investment volume target of 250 million euros was far exceeded. With a yield of 8.2% for projects and acquisitions and an IRR of 8% for energy investments, expected returns were tightened as a function of the increased cost of capital. For a detailed description of the various individual acquisitions and the pre-let and other projects completed and under development, please see 4. Performance and trends on p. 20. The following table shows a comparison between the annual rental income for purchased properties and the rental income actually received since the purchase of the properties during 2023 (the year of purchase of these properties). Purchased properties in euros (x 1,000) Country Annual rental income Actual rental income 2023 Londerzeel, Nijverheidsstraat 20 BE 604 0 Wijnegem, Blikstraat BE 370 104 Mioveni RO 886 414 Total 1,860 518 In 2023, the decision was also taken to sell some non-strategic sites at Leuven (BE), Terhagen (BE), Echt (NL) and (some) land (RO). These sites generated rents amounting to 742,477 euros in 2023. 1. Valuation method The estimation of a site consists of determining its value on a specific date, in other words, the price at which the site would likely be tradable between well-informed buyers and sellers, in the absence of information asymmetries, who wish to perform a similar transaction, without taking account of any particular agreement between them. This value is the investment value when it corresponds to the total price payable by the buyer, plus any transaction costs or VAT if the purchase is subject to VAT. The fair value, within the meaning of the IAS/IFRS reference scheme, can be obtained by deducting an adjusted minimum charge for transaction costs and/or the VAT from the investment value. To calculate the changes in the fair value, the hypothetical local transaction costs are deducted from the investment value. On average, these break down by country as follows: Belgium: 2.5%, The Netherlands: 10.4%, France: 6.9%, Germany: 7.8%, Luxembourg: 7% and Romania: 1.5%. WDP Annual accounts 2023 238
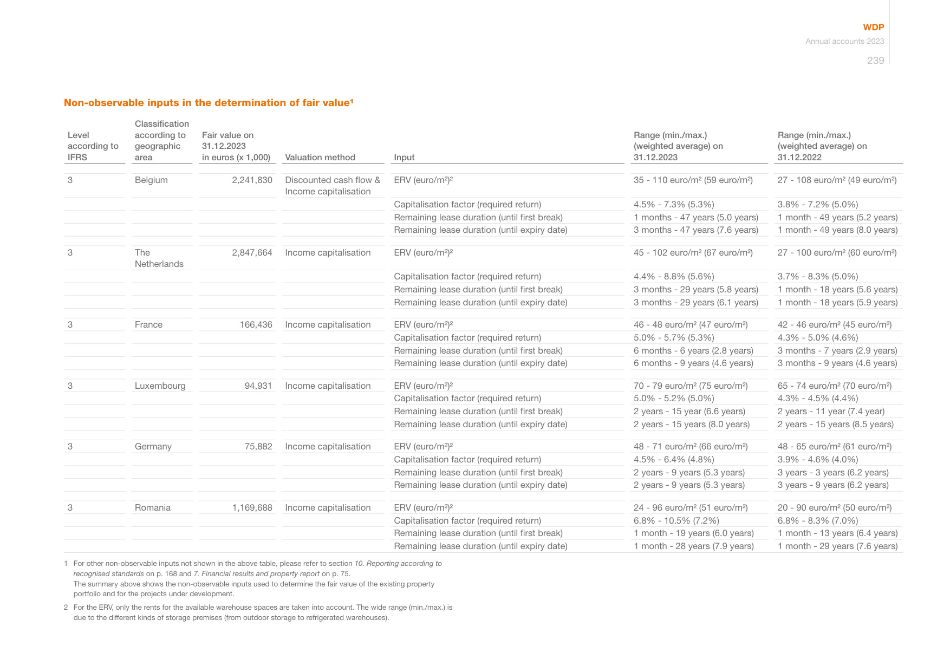
Non-observable inputs in the determination of fair value¹ Level according to IFRS Classification according to geographic area Fair value on 31.12.2023 in euros (x 1,000) Valuation method Input Range (min./max.) (weighted average) on 31.12.2023 Range (min./max.) (weighted average) on 31.12.2022 3 Belgium 2,241,830 Discounted cash flow & Income capitalisation ERV (euro/m²)² 35 - 110 euro/m² (59 euro/m²) 27 - 108 euro/m² (49 euro/m²) Capitalisation factor (required return) 4.5% - 7.3% (5.3%) 3.8% - 7.2% (5.0%) Remaining lease duration (until first break) 1 months - 47 years (5.0 years) 1 month - 49 years (5.2 years) Remaining lease duration (until expiry date) 3 months - 47 years (7.6 years) 1 month - 49 years (8.0 years) 3 The Netherlands 2,847,664 Income capitalisation ERV (euro/m²)² 45 - 102 euro/m² (67 euro/m²) 27 - 100 euro/m² (60 euro/m²) Capitalisation factor (required return) 4.4% - 8.8% (5.6%) 3.7% - 8.3% (5.0%) Remaining lease duration (until first break) 3 months - 29 years (5.8 years) 1 month - 18 years (5.6 years) Remaining lease duration (until expiry date) 3 months - 29 years (6.1 years) 1 month - 18 years (5.9 years) 3 France 166,436 Income capitalisation ERV (euro/m²)² 46 - 48 euro/m² (47 euro/m²) 42 - 46 euro/m² (45 euro/m²) Capitalisation factor (required return) 5.0% - 5.7% (5.3%) 4.3% - 5.0% (4.6%) Remaining lease duration (until first break) 6 months - 6 years (2.8 years) 3 months - 7 years (2.9 years) Remaining lease duration (until expiry date) 6 months - 9 years (4.6 years) 3 months - 9 years (4.6 years) 3 Luxembourg 94,931 Income capitalisation ERV (euro/m²)² 70 - 79 euro/m² (75 euro/m²) 65 - 74 euro/m² (70 euro/m²) Capitalisation factor (required return) 5.0% - 5.2% (5.0%) 4.3% - 4.5% (4.4%) Remaining lease duration (until first break) 2 years - 15 year (6.6 years) 2 years - 11 year (7.4 year) Remaining lease duration (until expiry date) 2 years - 15 years (8.0 years) 2 years - 15 years (8.5 years) 3 Germany 75,882 Income capitalisation ERV (euro/m²)² 48 - 71 euro/m² (66 euro/m²) 48 - 65 euro/m² (61 euro/m²) Capitalisation factor (required return) 4.5% - 6.4% (4.8%) 3.9% - 4.6% (4.0%) Remaining lease duration (until first break) 2 years - 9 years (5.3 years) 3 years - 3 years (6.2 years) Remaining lease duration (until expiry date) 2 years - 9 years (5.3 years) 3 years - 9 years (6.2 years) 3 Romania 1,169,688 Income capitalisation ERV (euro/m²)² 24 - 96 euro/m² (51 euro/m²) 20 - 90 euro/m² (50 euro/m²) Capitalisation factor (required return) 6.8% - 10.5% (7.2%) 6.8% - 8.3% (7.0%) Remaining lease duration (until first break) 1 month - 19 years (6.0 years) 1 month - 13 years (6.4 years) Remaining lease duration (until expiry date) 1 month - 28 years (7.9 years) 1 month - 29 years (7.6 years) 1 For other non-observable inputs not shown in the above table, please refer to section 10. Reporting according to recognised standards on p. 168 and 7. Financial results and property report on p. 75. The summary above shows the non-observable inputs used to determine the fair value of the existing property portfolio and for the projects under development. 2 For the ERV, only the rents for the available warehouse spaces are taken into account. The wide range (min./max.) is due to the different kinds of storage premises (from outdoor storage to refrigerated warehouses). WDP Annual accounts 2023 239
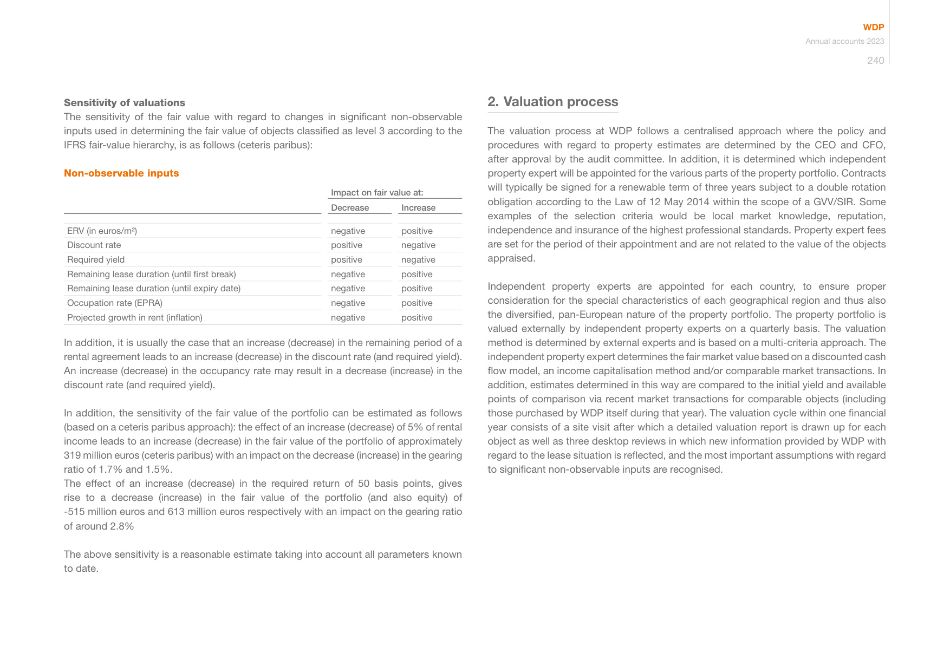
Sensitivity of valuations The sensitivity of the fair value with regard to changes in significant non-observable inputs used in determining the fair value of objects classified as level 3 according to the IFRS fair-value hierarchy, is as follows (ceteris paribus): Non-observable inputs Impact on fair value at: Decrease Increase ERV (in euros/m²) negative positive Discount rate positive negative Required yield positive negative Remaining lease duration (until first break) negative positive Remaining lease duration (until expiry date) negative positive Occupation rate (EPRA) negative positive Projected growth in rent (inflation) negative positive In addition, it is usually the case that an increase (decrease) in the remaining period of a rental agreement leads to an increase (decrease) in the discount rate (and required yield). An increase (decrease) in the occupancy rate may result in a decrease (increase) in the discount rate (and required yield). In addition, the sensitivity of the fair value of the portfolio can be estimated as follows (based on a ceteris paribus approach): the effect of an increase (decrease) of 5% of rental income leads to an increase (decrease) in the fair value of the portfolio of approximately 319 million euros (ceteris paribus) with an impact on the decrease (increase) in the gearing ratio of 1.7% and 1.5%. The effect of an increase (decrease) in the required return of 50 basis points, gives rise to a decrease (increase) in the fair value of the portfolio (and also equity) of -515 million euros and 613 million euros respectively with an impact on the gearing ratio of around 2.8% The above sensitivity is a reasonable estimate taking into account all parameters known to date. 2. Valuation process The valuation process at WDP follows a centralised approach where the policy and procedures with regard to property estimates are determined by the CEO and CFO, after approval by the audit committee. In addition, it is determined which independent property expert will be appointed for the various parts of the property portfolio. Contracts will typically be signed for a renewable term of three years subject to a double rotation obligation according to the Law of 12 May 2014 within the scope of a GVV/SIR. Some examples of the selection criteria would be local market knowledge, reputation, independence and insurance of the highest professional standards. Property expert fees are set for the period of their appointment and are not related to the value of the objects appraised. Independent property experts are appointed for each country, to ensure proper consideration for the special characteristics of each geographical region and thus also the diversified, pan-European nature of the property portfolio. The property portfolio is valued externally by independent property experts on a quarterly basis. The valuation method is determined by external experts and is based on a multi-criteria approach. The independent property expert determines the fair market value based on a discounted cash flow model, an income capitalisation method and/or comparable market transactions. In addition, estimates determined in this way are compared to the initial yield and available points of comparison via recent market transactions for comparable objects (including those purchased by WDP itself during that year). The valuation cycle within one financial year consists of a site visit after which a detailed valuation report is drawn up for each object as well as three desktop reviews in which new information provided by WDP with regard to the lease situation is reflected, and the most important assumptions with regard to significant non-observable inputs are recognised. WDP Annual accounts 2023 240
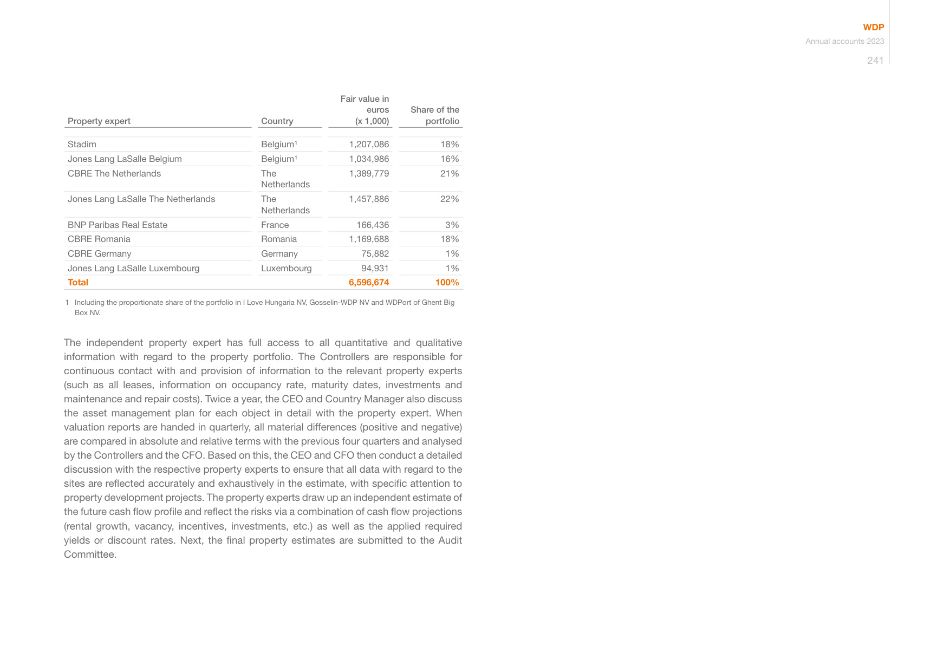
Property expert Country Fair value in euros (x 1,000) Share of the portfolio Stadim Belgium¹ 1,207,086 18% Jones Lang LaSalle Belgium Belgium¹ 1,034,986 16% CBRE The Netherlands The Netherlands 1,389,779 21% Jones Lang LaSalle The Netherlands The Netherlands 1,457,886 22% BNP Paribas Real Estate France 166,436 3% CBRE Romania Romania 1,169,688 18% CBRE Germany Germany 75,882 1% Jones Lang LaSalle Luxembourg Luxembourg 94,931 1% Total 6,596,674 100% 1 Including the proportionate share of the portfolio in I Love Hungaria NV, Gosselin-WDP NV and WDPort of Ghent Big Box NV. The independent property expert has full access to all quantitative and qualitative information with regard to the property portfolio. The Controllers are responsible for continuous contact with and provision of information to the relevant property experts (such as all leases, information on occupancy rate, maturity dates, investments and maintenance and repair costs). Twice a year, the CEO and Country Manager also discuss the asset management plan for each object in detail with the property expert. When valuation reports are handed in quarterly, all material differences (positive and negative) are compared in absolute and relative terms with the previous four quarters and analysed by the Controllers and the CFO. Based on this, the CEO and CFO then conduct a detailed discussion with the respective property experts to ensure that all data with regard to the sites are reflected accurately and exhaustively in the estimate, with specific attention to property development projects. The property experts draw up an independent estimate of the future cash flow profile and reflect the risks via a combination of cash flow projections (rental growth, vacancy, incentives, investments, etc.) as well as the applied required yields or discount rates. Next, the final property estimates are submitted to the Audit Committee. WDP Annual accounts 2023 241
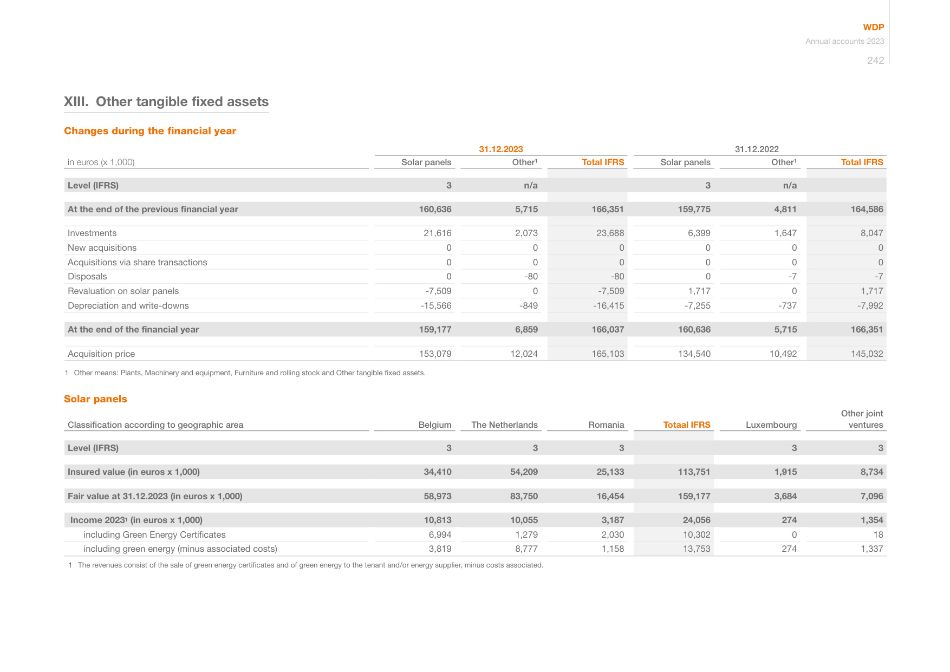
XIII. Other tangible fixed assets Changes during the financial year 31.12.2023 31.12.2022 in euros (x 1,000) Solar panels Other¹ Total IFRS Solar panels Other¹ Total IFRS Level (IFRS) 3 n/a 3 n/a At the end of the previous financial year 160,636 5,715 166,351 159,775 4,811 164,586 Investments 21,616 2,073 23,688 6,399 1,647 8,047 New acquisitions 0 0 0 0 0 0 Acquisitions via share transactions 0 0 0 0 0 0 Disposals 0 -80 -80 0 -7 -7 Revaluation on solar panels -7,509 0 -7,509 1,717 0 1,717 Depreciation and write-downs -15,566 -849 -16,415 -7,255 -737 -7,992 At the end of the financial year 159,177 6,859 166,037 160,636 5,715 166,351 Acquisition price 153,079 12,024 165,103 134,540 10,492 145,032 1 Other means: Plants, Machinery and equipment, Furniture and rolling stock and Other tangible fixed assets. Solar panels Classification according to geographic area Belgium The Netherlands Romania Totaal IFRS Luxembourg Other joint ventures Level (IFRS) 3 3 3 3 3 Insured value (in euros x 1,000) 34,410 54,209 25,133 113,751 1,915 8,734 Fair value at 31.12.2023 (in euros x 1,000) 58,973 83,750 16,454 159,177 3,684 7,096 Income 20231 (in euros x 1,000) 10,813 10,055 3,187 24,056 274 1,354 including Green Energy Certificates 6,994 1,279 2,030 10,302 0 18 including green energy (minus associated costs) 3,819 8,777 1,158 13,753 274 1,337 1 The revenues consist of the sale of green energy certificates and of green energy to the tenant and/or energy supplier, minus costs associated. WDP Annual accounts 2023 242
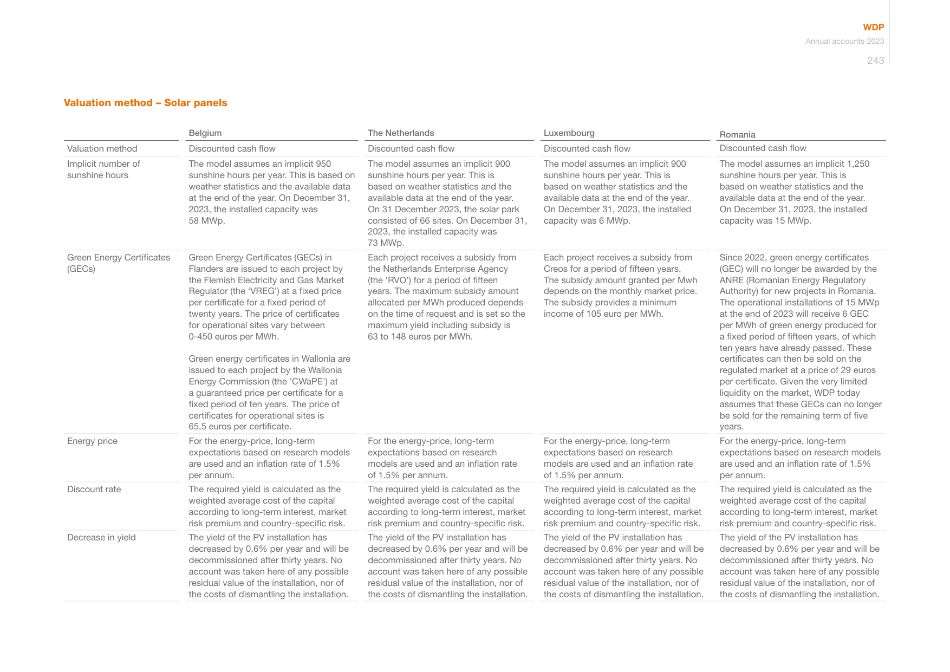
Valuation method – Solar panels Belgium The Netherlands Luxembourg Romania Valuation method Discounted cash flow Discounted cash flow Discounted cash flow Discounted cash flow Implicit number of sunshine hours The model assumes an implicit 950 sunshine hours per year. This is based on weather statistics and the available data at the end of the year. On December 31, 2023, the installed capacity was 58 MWp. The model assumes an implicit 900 sunshine hours per year. This is based on weather statistics and the available data at the end of the year. On 31 December 2023, the solar park consisted of 66 sites. On December 31, 2023, the installed capacity was 73 MWp. The model assumes an implicit 900 sunshine hours per year. This is based on weather statistics and the available data at the end of the year. On December 31, 2023, the installed capacity was 6 MWp. The model assumes an implicit 1,250 sunshine hours per year. This is based on weather statistics and the available data at the end of the year. On December 31, 2023, the installed capacity was 15 MWp. Green Energy Certificates (GECs) Green Energy Certificates (GECs) in Flanders are issued to each project by the Flemish Electricity and Gas Market Regulator (the 'VREG') at a fixed price per certificate for a fixed period of twenty years. The price of certificates for operational sites vary between 0-450 euros per MWh. Green energy certificates in Wallonia are issued to each project by the Wallonia Energy Commission (the 'CWaPE') at a guaranteed price per certificate for a fixed period of ten years. The price of certificates for operational sites is 65,5 euros per certificate. Each project receives a subsidy from the Netherlands Enterprise Agency (the 'RVO') for a period of fifteen years. The maximum subsidy amount allocated per MWh produced depends on the time of request and is set so the maximum yield including subsidy is 63 to 148 euros per MWh. Each project receives a subsidy from Creos for a period of fifteen years. The subsidy amount granted per Mwh depends on the monthly market price. The subsidy provides a minimum income of 105 euro per MWh. Since 2022, green energy certificates (GEC) will no longer be awarded by the ANRE (Romanian Energy Regulatory Authority) for new projects in Romania. The operational installations of 15 MWp at the end of 2023 will receive 6 GEC per MWh of green energy produced for a fixed period of fifteen years, of which ten years have already passed. These certificates can then be sold on the regulated market at a price of 29 euros per certificate. Given the very limited liquidity on the market, WDP today assumes that these GECs can no longer be sold for the remaining term of five years. Energy price For the energy-price, long-term expectations based on research models are used and an inflation rate of 1.5% per annum. For the energy-price, long-term expectations based on research models are used and an inflation rate of 1.5% per annum. For the energy-price, long-term expectations based on research models are used and an inflation rate of 1.5% per annum. For the energy-price, long-term expectations based on research models are used and an inflation rate of 1.5% per annum. Discount rate The required yield is calculated as the weighted average cost of the capital according to long-term interest, market risk premium and country-specific risk. The required yield is calculated as the weighted average cost of the capital according to long-term interest, market risk premium and country-specific risk. The required yield is calculated as the weighted average cost of the capital according to long-term interest, market risk premium and country-specific risk. The required yield is calculated as the weighted average cost of the capital according to long-term interest, market risk premium and country-specific risk. Decrease in yield The yield of the PV installation has decreased by 0.6% per year and will be decommissioned after thirty years. No account was taken here of any possible residual value of the installation, nor of the costs of dismantling the installation. The yield of the PV installation has decreased by 0.6% per year and will be decommissioned after thirty years. No account was taken here of any possible residual value of the installation, nor of the costs of dismantling the installation. The yield of the PV installation has decreased by 0.6% per year and will be decommissioned after thirty years. No account was taken here of any possible residual value of the installation, nor of the costs of dismantling the installation. The yield of the PV installation has decreased by 0.6% per year and will be decommissioned after thirty years. No account was taken here of any possible residual value of the installation, nor of the costs of dismantling the installation. WDP Annual accounts 2023 243
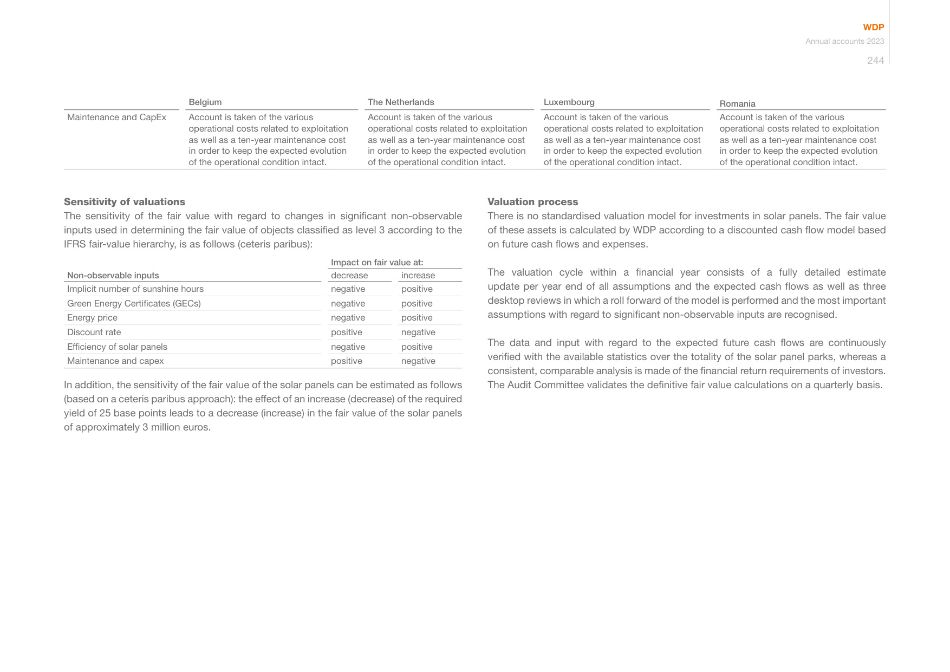
Belgium The Netherlands Luxembourg Romania Maintenance and CapEx Account is taken of the various operational costs related to exploitation as well as a ten-year maintenance cost in order to keep the expected evolution of the operational condition intact. Account is taken of the various operational costs related to exploitation as well as a ten-year maintenance cost in order to keep the expected evolution of the operational condition intact. Account is taken of the various operational costs related to exploitation as well as a ten-year maintenance cost in order to keep the expected evolution of the operational condition intact. Account is taken of the various operational costs related to exploitation as well as a ten-year maintenance cost in order to keep the expected evolution of the operational condition intact. Sensitivity of valuations The sensitivity of the fair value with regard to changes in significant non-observable inputs used in determining the fair value of objects classified as level 3 according to the IFRS fair-value hierarchy, is as follows (ceteris paribus): Impact on fair value at: Non-observable inputs decrease increase Implicit number of sunshine hours negative positive Green Energy Certificates (GECs) negative positive Energy price negative positive Discount rate positive negative Efficiency of solar panels negative positive Maintenance and capex positive negative In addition, the sensitivity of the fair value of the solar panels can be estimated as follows (based on a ceteris paribus approach): the effect of an increase (decrease) of the required yield of 25 base points leads to a decrease (increase) in the fair value of the solar panels of approximately 3 million euros. Valuation process There is no standardised valuation model for investments in solar panels. The fair value of these assets is calculated by WDP according to a discounted cash flow model based on future cash flows and expenses. The valuation cycle within a financial year consists of a fully detailed estimate update per year end of all assumptions and the expected cash flows as well as three desktop reviews in which a roll forward of the model is performed and the most important assumptions with regard to significant non-observable inputs are recognised. The data and input with regard to the expected future cash flows are continuously verified with the available statistics over the totality of the solar panel parks, whereas a consistent, comparable analysis is made of the financial return requirements of investors. The Audit Committee validates the definitive fair value calculations on a quarterly basis. WDP Annual accounts 2023 244
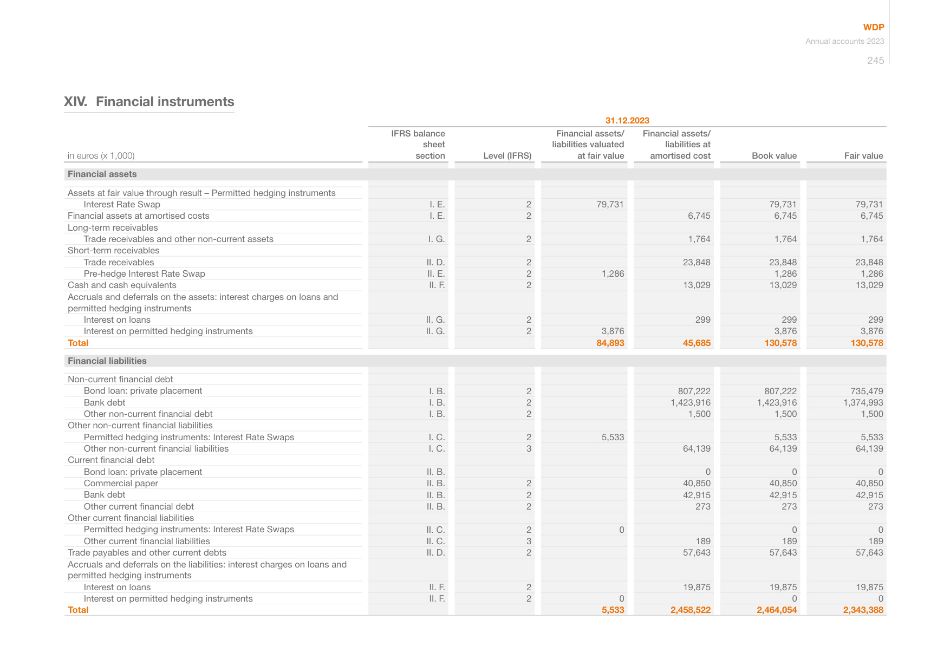
XIV. Financial instruments 31.12.2023 in euros (x 1,000) IFRS balance sheet section Level (IFRS) Financial assets/ liabilities valuated at fair value Financial assets/ liabilities at amortised cost Book value Fair value Financial assets Assets at fair value through result – Permitted hedging instruments Interest Rate Swap I. E. 2 79,731 79,731 79,731 Financial assets at amortised costs I. E. 2 6,745 6,745 6,745 Long-term receivables Trade receivables and other non-current assets I. G. 2 1,764 1,764 1,764 Short-term receivables Trade receivables II. D. 2 23,848 23,848 23,848 Pre-hedge Interest Rate Swap II. E. 2 1,286 1,286 1,286 Cash and cash equivalents II. F. 2 13,029 13,029 13,029 Accruals and deferrals on the assets: interest charges on loans and permitted hedging instruments Interest on loans II. G. 2 299 299 299 Interest on permitted hedging instruments II. G. 2 3,876 3,876 3,876 Total 84,893 45,685 130,578 130,578 Financial liabilities Non-current financial debt Bond loan: private placement I. B. 2 807,222 807,222 735,479 Bank debt I. B. 2 1,423,916 1,423,916 1,374,993 Other non-current financial debt I. B. 2 1,500 1,500 1,500 Other non-current financial liabilities Permitted hedging instruments: Interest Rate Swaps I. C. 2 5,533 5,533 5,533 Other non-current financial liabilities I. C. 3 64,139 64,139 64,139 Current financial debt Bond loan: private placement II. B. 0 0 0 Commercial paper II. B. 2 40,850 40,850 40,850 Bank debt II. B. 2 42,915 42,915 42,915 Other current financial debt II. B. 2 273 273 273 Other current financial liabilities Permitted hedging instruments: Interest Rate Swaps II. C. 2 0 0 0 Other current financial liabilities II. C. 3 189 189 189 Trade payables and other current debts II. D. 2 57,643 57,643 57,643 Accruals and deferrals on the liabilities: interest charges on loans and permitted hedging instruments Interest on loans II. F. 2 19,875 19,875 19,875 Interest on permitted hedging instruments II. F. 2 0 0 0 Total 5,533 2,458,522 2,464,054 2,343,388 WDP Annual accounts 2023 245
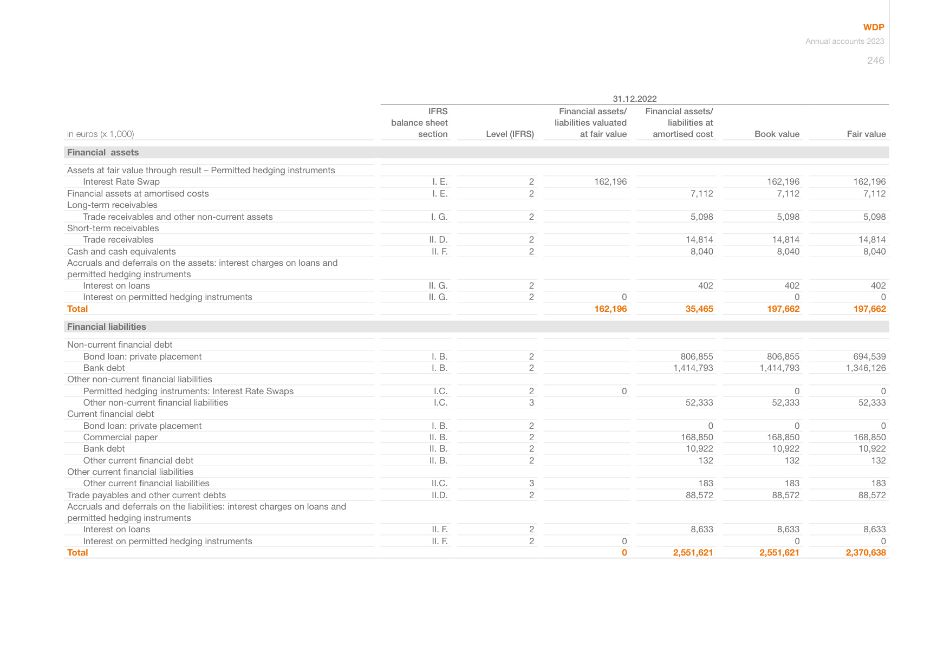
31.12.2022 in euros (x 1,000) IFRS balance sheet section Level (IFRS) Financial assets/ liabilities valuated at fair value Financial assets/ liabilities at amortised cost Book value Fair value Financial assets Assets at fair value through result – Permitted hedging instruments Interest Rate Swap I. E. 2 162,196 162,196 162,196 Financial assets at amortised costs I. E. 2 7,112 7,112 7,112 Long-term receivables Trade receivables and other non-current assets I. G. 2 5,098 5,098 5,098 Short-term receivables Trade receivables II. D. 2 14,814 14,814 14,814 Cash and cash equivalents II. F. 2 8,040 8,040 8,040 Accruals and deferrals on the assets: interest charges on loans and permitted hedging instruments Interest on loans II. G. 2 402 402 402 Interest on permitted hedging instruments II. G. 2 0 0 0 Total 162,196 35,465 197,662 197,662 Financial liabilities Non-current financial debt Bond loan: private placement I. B. 2 806,855 806,855 694,539 Bank debt I. B. 2 1,414,793 1,414,793 1,346,126 Other non-current financial liabilities Permitted hedging instruments: Interest Rate Swaps I.C. 2 0 0 0 Other non-current financial liabilities I.C. 3 52,333 52,333 52,333 Current financial debt Bond loan: private placement I. B. 2 0 0 0 Commercial paper II. B. 2 168,850 168,850 168,850 Bank debt II. B. 2 10,922 10,922 10,922 Other current financial debt II. B. 2 132 132 132 Other current financial liabilities Other current financial liabilities II.C. 3 183 183 183 Trade payables and other current debts II.D. 2 88,572 88,572 88,572 Accruals and deferrals on the liabilities: interest charges on loans and permitted hedging instruments Interest on loans II. F. 2 8,633 8,633 8,633 Interest on permitted hedging instruments II. F. 2 0 0 0 Total 0 2,551,621 2,551,621 2,370,638 WDP Annual accounts 2023 246
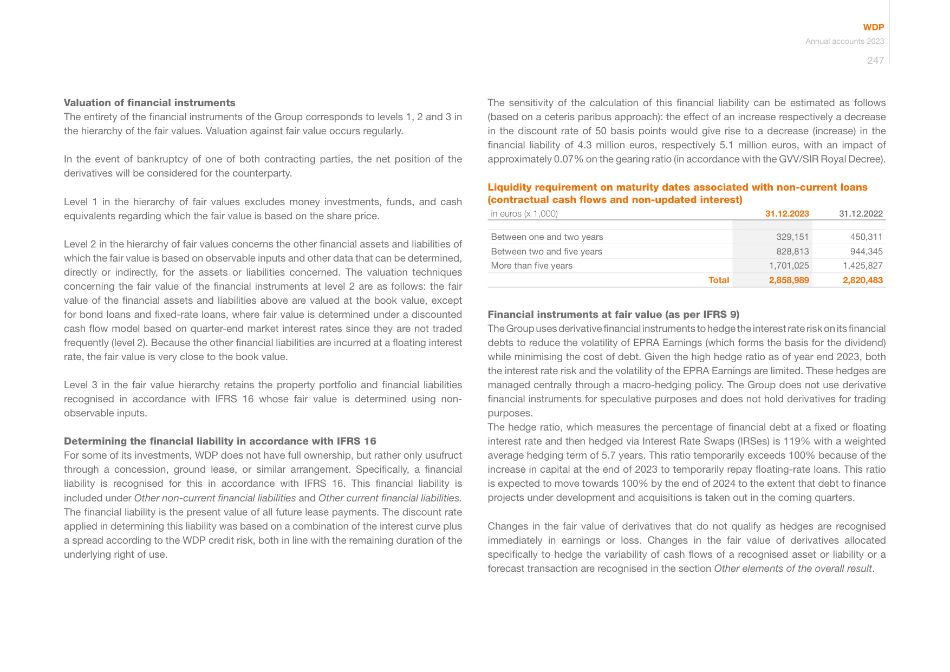
The sensitivity of the calculation of this financial liability can be estimated as follows (based on a ceteris paribus approach): the effect of an increase respectively a decrease in the discount rate of 50 basis points would give rise to a decrease (increase) in the financial liability of 4.3 million euros, respectively 5.1 million euros, with an impact of approximately 0.07% on the gearing ratio (in accordance with the GVV/SIR Royal Decree). Liquidity requirement on maturity dates associated with non-current loans (contractual cash flows and non-updated interest) in euros (x 1,000) 31.12.2023 31.12.2022 Between one and two years 329,151 450,311 Between two and five years 828,813 944,345 More than five years 1,701,025 1,425,827 Total 2,858,989 2,820,483 Financial instruments at fair value (as per IFRS 9) The Group uses derivative financial instruments to hedge the interest rate risk on its financial debts to reduce the volatility of EPRA Earnings (which forms the basis for the dividend) while minimising the cost of debt. Given the high hedge ratio as of year end 2023, both the interest rate risk and the volatility of the EPRA Earnings are limited. These hedges are managed centrally through a macro-hedging policy. The Group does not use derivative financial instruments for speculative purposes and does not hold derivatives for trading purposes. The hedge ratio, which measures the percentage of financial debt at a fixed or floating interest rate and then hedged via Interest Rate Swaps (IRSes) is 119% with a weighted average hedging term of 5.7 years. This ratio temporarily exceeds 100% because of the increase in capital at the end of 2023 to temporarily repay floating-rate loans. This ratio is expected to move towards 100% by the end of 2024 to the extent that debt to finance projects under development and acquisitions is taken out in the coming quarters. Changes in the fair value of derivatives that do not qualify as hedges are recognised immediately in earnings or loss. Changes in the fair value of derivatives allocated specifically to hedge the variability of cash flows of a recognised asset or liability or a forecast transaction are recognised in the section Other elements of the overall result. Valuation of financial instruments The entirety of the financial instruments of the Group corresponds to levels 1, 2 and 3 in the hierarchy of the fair values. Valuation against fair value occurs regularly. In the event of bankruptcy of one of both contracting parties, the net position of the derivatives will be considered for the counterparty. Level 1 in the hierarchy of fair values excludes money investments, funds, and cash equivalents regarding which the fair value is based on the share price. Level 2 in the hierarchy of fair values concerns the other financial assets and liabilities of which the fair value is based on observable inputs and other data that can be determined, directly or indirectly, for the assets or liabilities concerned. The valuation techniques concerning the fair value of the financial instruments at level 2 are as follows: the fair value of the financial assets and liabilities above are valued at the book value, except for bond loans and fixed-rate loans, where fair value is determined under a discounted cash flow model based on quarter-end market interest rates since they are not traded frequently (level 2). Because the other financial liabilities are incurred at a floating interest rate, the fair value is very close to the book value. Level 3 in the fair value hierarchy retains the property portfolio and financial liabilities recognised in accordance with IFRS 16 whose fair value is determined using non- observable inputs. Determining the financial liability in accordance with IFRS 16 For some of its investments, WDP does not have full ownership, but rather only usufruct through a concession, ground lease, or similar arrangement. Specifically, a financial liability is recognised for this in accordance with IFRS 16. This financial liability is included under Other non-current financial liabilities and Other current financial liabilities. The financial liability is the present value of all future lease payments. The discount rate applied in determining this liability was based on a combination of the interest curve plus a spread according to the WDP credit risk, both in line with the remaining duration of the underlying right of use. WDP Annual accounts 2023 247
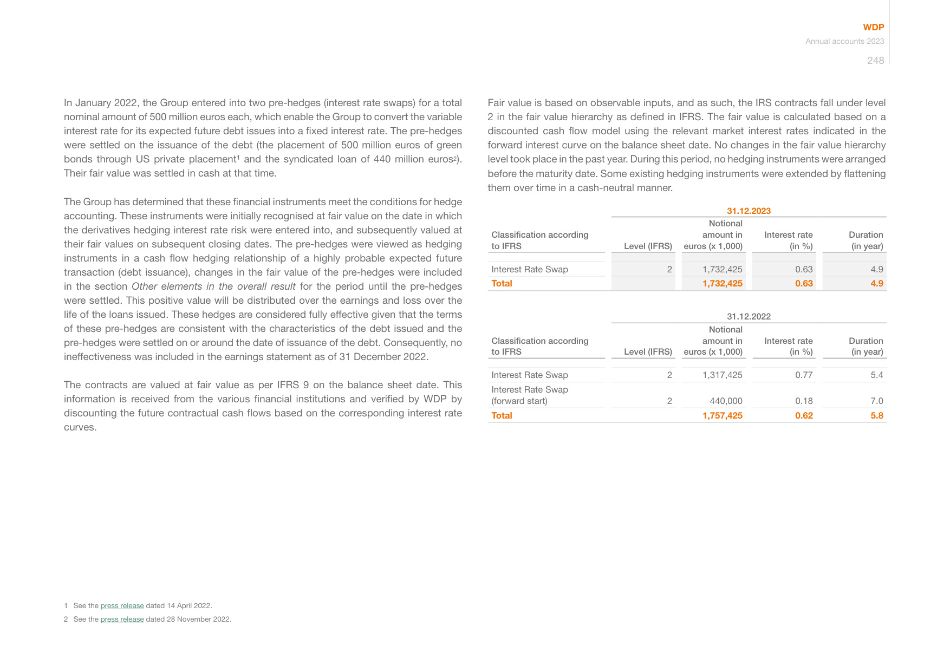
In January 2022, the Group entered into two pre-hedges (interest rate swaps) for a total nominal amount of 500 million euros each, which enable the Group to convert the variable interest rate for its expected future debt issues into a fixed interest rate. The pre-hedges were settled on the issuance of the debt (the placement of 500 million euros of green bonds through US private placement1 and the syndicated loan of 440 million euros2). Their fair value was settled in cash at that time. The Group has determined that these financial instruments meet the conditions for hedge accounting. These instruments were initially recognised at fair value on the date in which the derivatives hedging interest rate risk were entered into, and subsequently valued at their fair values on subsequent closing dates. The pre-hedges were viewed as hedging instruments in a cash flow hedging relationship of a highly probable expected future transaction (debt issuance), changes in the fair value of the pre-hedges were included in the section Other elements in the overall result for the period until the pre-hedges were settled. This positive value will be distributed over the earnings and loss over the life of the loans issued. These hedges are considered fully effective given that the terms of these pre-hedges are consistent with the characteristics of the debt issued and the pre-hedges were settled on or around the date of issuance of the debt. Consequently, no ineffectiveness was included in the earnings statement as of 31 December 2022. The contracts are valued at fair value as per IFRS 9 on the balance sheet date. This information is received from the various financial institutions and verified by WDP by discounting the future contractual cash flows based on the corresponding interest rate curves. Fair value is based on observable inputs, and as such, the IRS contracts fall under level 2 in the fair value hierarchy as defined in IFRS. The fair value is calculated based on a discounted cash flow model using the relevant market interest rates indicated in the forward interest curve on the balance sheet date. No changes in the fair value hierarchy level took place in the past year. During this period, no hedging instruments were arranged before the maturity date. Some existing hedging instruments were extended by flattening them over time in a cash-neutral manner. 31.12.2023 Classification according to IFRS Level (IFRS) Notional amount in euros (x 1,000) Interest rate (in %) Duration (in year) Interest Rate Swap 2 1,732,425 0.63 4.9 Total 1,732,425 0.63 4.9 31.12.2022 Classification according to IFRS Level (IFRS) Notional amount in euros (x 1,000) Interest rate (in %) Duration (in year) Interest Rate Swap 2 1,317,425 0.77 5.4 Interest Rate Swap (forward start) 2 440,000 0.18 7.0 Total 1,757,425 0.62 5.8 1 See the press release dated 14 April 2022. 2 See the press release dated 28 November 2022. WDP Annual accounts 2023 248
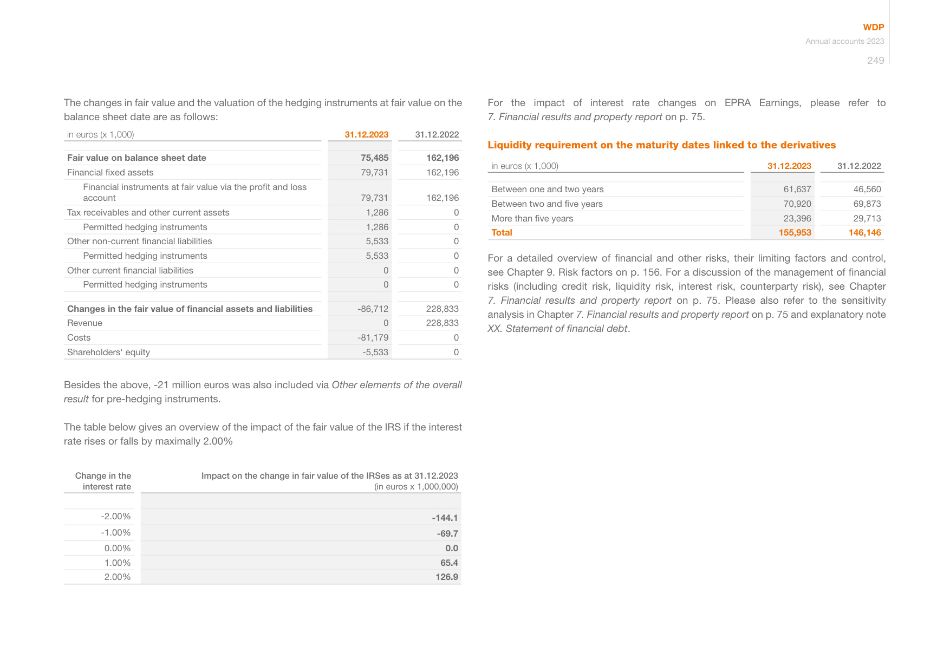
For the impact of interest rate changes on EPRA Earnings, please refer to 7. Financial results and property report on p. 75. Liquidity requirement on the maturity dates linked to the derivatives in euros (x 1,000) 31.12.2023 31.12.2022 Between one and two years 61,637 46,560 Between two and five years 70,920 69,873 More than five years 23,396 29,713 Total 155,953 146,146 For a detailed overview of financial and other risks, their limiting factors and control, see Chapter 9. Risk factors on p. 156. For a discussion of the management of financial risks (including credit risk, liquidity risk, interest risk, counterparty risk), see Chapter 7. Financial results and property report on p. 75. Please also refer to the sensitivity analysis in Chapter 7. Financial results and property report on p. 75 and explanatory note XX. Statement of financial debt. The changes in fair value and the valuation of the hedging instruments at fair value on the balance sheet date are as follows: in euros (x 1,000) 31.12.2023 31.12.2022 Fair value on balance sheet date 75,485 162,196 Financial fixed assets 79,731 162,196 Financial instruments at fair value via the profit and loss account 79,731 162,196 Tax receivables and other current assets 1,286 0 Permitted hedging instruments 1,286 0 Other non-current financial liabilities 5,533 0 Permitted hedging instruments 5,533 0 Other current financial liabilities 0 0 Permitted hedging instruments 0 0 Changes in the fair value of financial assets and liabilities -86,712 228,833 Revenue 0 228,833 Costs -81,179 0 Shareholders' equity -5,533 0 Besides the above, -21 million euros was also included via Other elements of the overall result for pre-hedging instruments. The table below gives an overview of the impact of the fair value of the IRS if the interest rate rises or falls by maximally 2.00% Change in the interest rate Impact on the change in fair value of the IRSes as at 31.12.2023 (in euros x 1,000,000) -2.00% -144.1 -1.00% -69.7 0.00% 0.0 1.00% 65.4 2.00% 126.9 WDP Annual accounts 2023 249
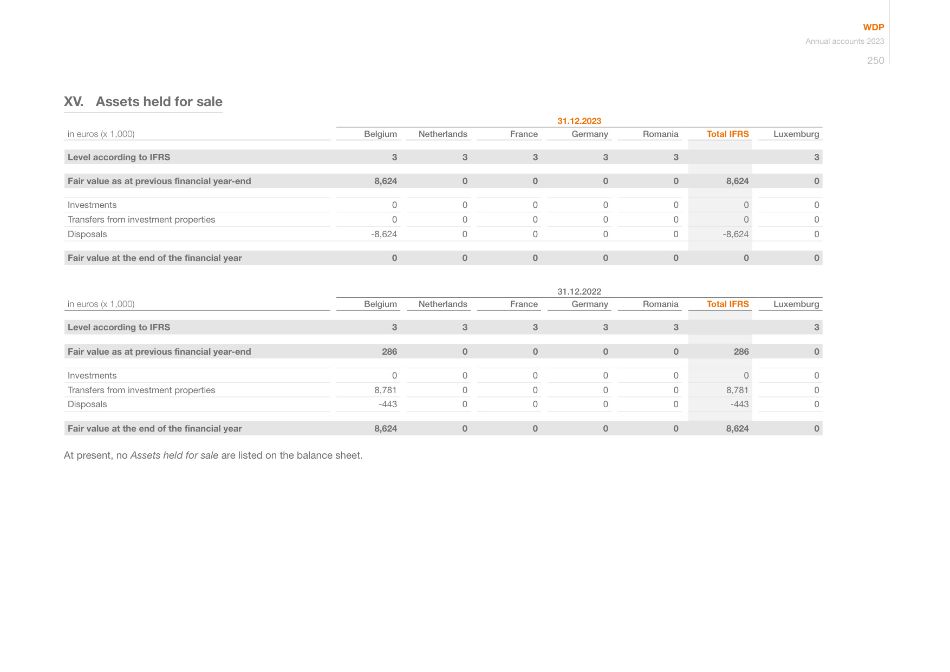
XV. Assets held for sale 31.12.2023 in euros (x 1,000) Belgium Netherlands France Germany Romania Total IFRS Luxemburg Level according to IFRS 3 3 3 3 3 3 Fair value as at previous financial year-end 8,624 0 0 0 0 8,624 0 Investments 0 0 0 0 0 0 0 Transfers from investment properties 0 0 0 0 0 0 0 Disposals -8,624 0 0 0 0 -8,624 0 Fair value at the end of the financial year 0 0 0 0 0 0 0 31.12.2022 in euros (x 1,000) Belgium Netherlands France Germany Romania Total IFRS Luxemburg Level according to IFRS 3 3 3 3 3 3 Fair value as at previous financial year-end 286 0 0 0 0 286 0 Investments 0 0 0 0 0 0 0 Transfers from investment properties 8,781 0 0 0 0 8,781 0 Disposals -443 0 0 0 0 -443 0 Fair value at the end of the financial year 8,624 0 0 0 0 8,624 0 At present, no Assets held for sale are listed on the balance sheet. WDP Annual accounts 2023 250
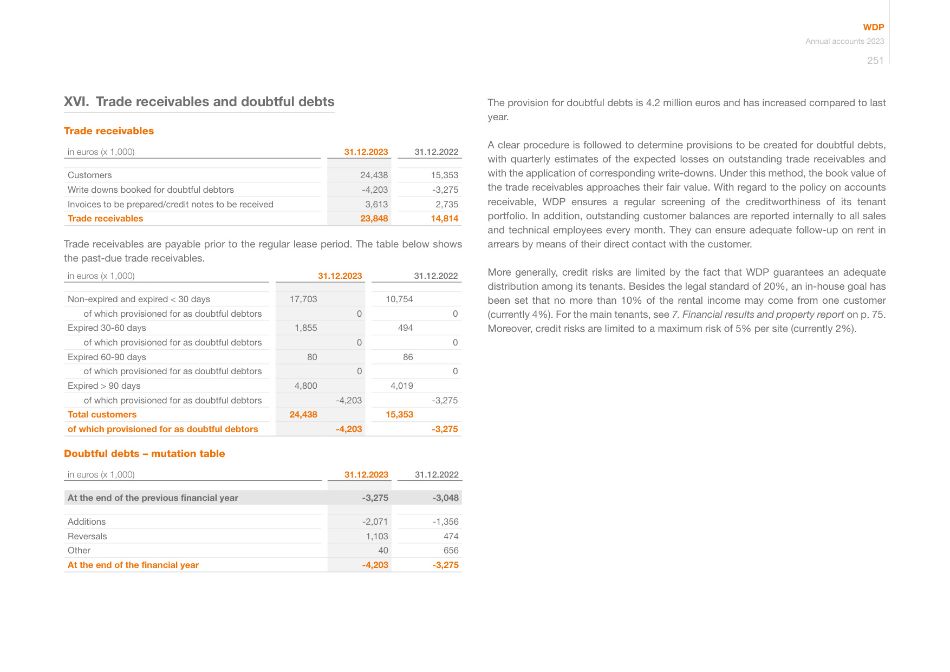
XVI. Trade receivables and doubtful debts Trade receivables in euros (x 1,000) 31.12.2023 31.12.2022 Customers 24,438 15,353 Write downs booked for doubtful debtors -4,203 -3,275 Invoices to be prepared/credit notes to be received 3,613 2,735 Trade receivables 23,848 14,814 Trade receivables are payable prior to the regular lease period. The table below shows the past-due trade receivables. in euros (x 1,000) 31.12.2023 31.12.2022 Non-expired and expired < 30 days 17,703 10,754 of which provisioned for as doubtful debtors 0 0 Expired 30-60 days 1,855 494 of which provisioned for as doubtful debtors 0 0 Expired 60-90 days 80 86 of which provisioned for as doubtful debtors 0 0 Expired > 90 days 4,800 4,019 of which provisioned for as doubtful debtors -4,203 -3,275 Total customers 24,438 15,353 of which provisioned for as doubtful debtors -4,203 -3,275 Doubtful debts – mutation table in euros (x 1,000) 31.12.2023 31.12.2022 At the end of the previous financial year -3,275 -3,048 Additions -2,071 -1,356 Reversals 1,103 474 Other 40 656 At the end of the financial year -4,203 -3,275 The provision for doubtful debts is 4.2 million euros and has increased compared to last year. A clear procedure is followed to determine provisions to be created for doubtful debts, with quarterly estimates of the expected losses on outstanding trade receivables and with the application of corresponding write-downs. Under this method, the book value of the trade receivables approaches their fair value. With regard to the policy on accounts receivable, WDP ensures a regular screening of the creditworthiness of its tenant portfolio. In addition, outstanding customer balances are reported internally to all sales and technical employees every month. They can ensure adequate follow-up on rent in arrears by means of their direct contact with the customer. More generally, credit risks are limited by the fact that WDP guarantees an adequate distribution among its tenants. Besides the legal standard of 20%, an in-house goal has been set that no more than 10% of the rental income may come from one customer (currently 4%). For the main tenants, see 7. Financial results and property report on p. 75. Moreover, credit risks are limited to a maximum risk of 5% per site (currently 2%). WDP Annual accounts 2023 251
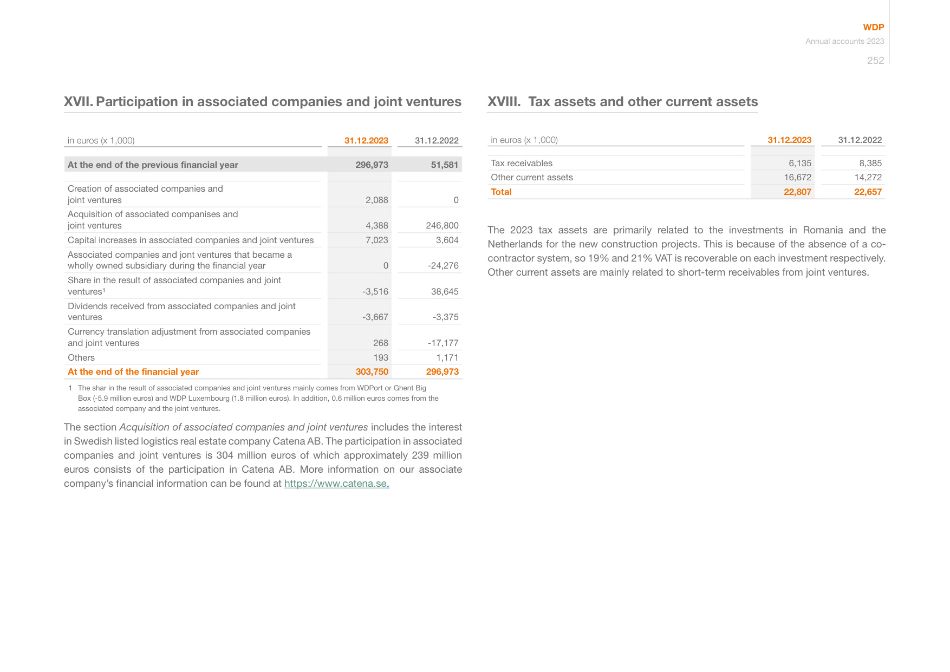
XVII. Participation in associated companies and joint ventures in euros (x 1,000) 31.12.2023 31.12.2022 At the end of the previous financial year 296,973 51,581 Creation of associated companies and joint ventures 2,088 0 Acquisition of associated companises and joint ventures 4,388 246,800 Capital increases in associated companies and joint ventures 7,023 3,604 Associated companies and jont ventures that became a wholly owned subsidiary during the financial year 0 -24,276 Share in the result of associated companies and joint ventures¹ -3,516 38,645 Dividends received from associated companies and joint ventures -3,667 -3,375 Currency translation adjustment from associated companies and joint ventures 268 -17,177 Others 193 1,171 At the end of the financial year 303,750 296,973 1 The shar in the result of associated companies and joint ventures mainly comes from WDPort or Ghent Big Box (-5.9 million euros) and WDP Luxembourg (1.8 million euros). In addition, 0.6 million euros comes from the associated company and the joint ventures. The section Acquisition of associated companies and joint ventures includes the interest in Swedish listed logistics real estate company Catena AB. The participation in associated companies and joint ventures is 304 million euros of which approximately 239 million euros consists of the participation in Catena AB. More information on our associate company's financial information can be found at https://www.catena.se. XVIII. Tax assets and other current assets in euros (x 1,000) 31.12.2023 31.12.2022 Tax receivables 6,135 8,385 Other current assets 16,672 14,272 Total 22,807 22,657 The 2023 tax assets are primarily related to the investments in Romania and the Netherlands for the new construction projects. This is because of the absence of a co- contractor system, so 19% and 21% VAT is recoverable on each investment respectively. Other current assets are mainly related to short-term receivables from joint ventures. WDP Annual accounts 2023 252
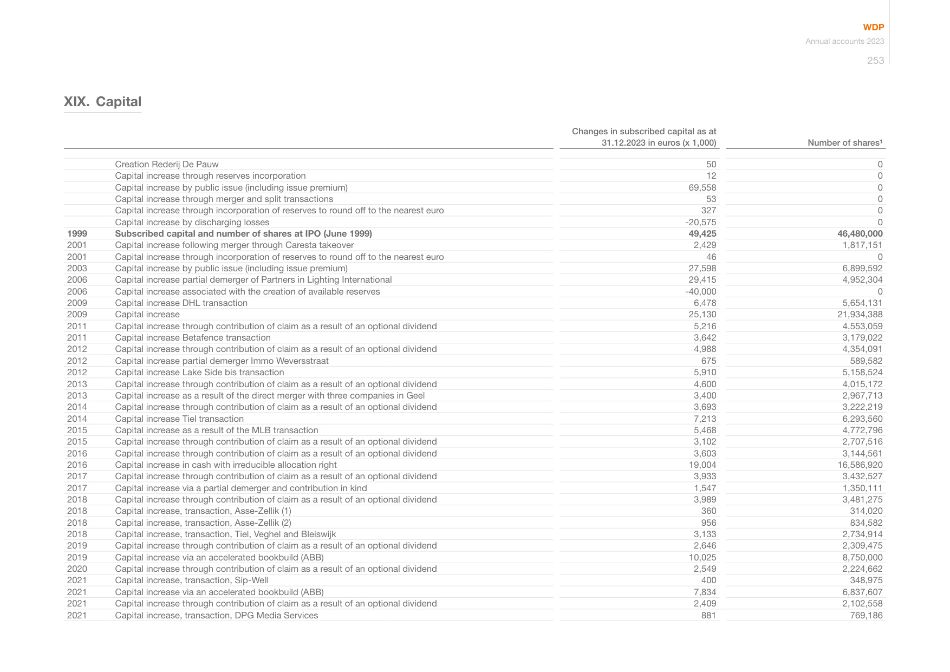
XIX. Capital Changes in subscribed capital as at 31.12.2023 in euros (x 1,000) Number of shares¹ Creation Rederij De Pauw 50 0 Capital increase through reserves incorporation 12 0 Capital increase by public issue (including issue premium) 69,558 0 Capital increase through merger and split transactions 53 0 Capital increase through incorporation of reserves to round off to the nearest euro 327 0 Capital increase by discharging losses -20,575 0 1999 Subscribed capital and number of shares at IPO (June 1999) 49,425 46,480,000 2001 Capital increase following merger through Caresta takeover 2,429 1,817,151 2001 Capital increase through incorporation of reserves to round off to the nearest euro 46 0 2003 Capital increase by public issue (including issue premium) 27,598 6,899,592 2006 Capital increase partial demerger of Partners in Lighting International 29,415 4,952,304 2006 Capital increase associated with the creation of available reserves -40,000 0 2009 Capital increase DHL transaction 6,478 5,654,131 2009 Capital increase 25,130 21,934,388 2011 Capital increase through contribution of claim as a result of an optional dividend 5,216 4,553,059 2011 Capital increase Betafence transaction 3,642 3,179,022 2012 Capital increase through contribution of claim as a result of an optional dividend 4,988 4,354,091 2012 Capital increase partial demerger Immo Weversstraat 675 589,582 2012 Capital increase Lake Side bis transaction 5,910 5,158,524 2013 Capital increase through contribution of claim as a result of an optional dividend 4,600 4,015,172 2013 Capital increase as a result of the direct merger with three companies in Geel 3,400 2,967,713 2014 Capital increase through contribution of claim as a result of an optional dividend 3,693 3,222,219 2014 Capital increase Tiel transaction 7,213 6,293,560 2015 Capital increase as a result of the MLB transaction 5,468 4,772,796 2015 Capital increase through contribution of claim as a result of an optional dividend 3,102 2,707,516 2016 Capital increase through contribution of claim as a result of an optional dividend 3,603 3,144,561 2016 Capital increase in cash with irreducible allocation right 19,004 16,586,920 2017 Capital increase through contribution of claim as a result of an optional dividend 3,933 3,432,527 2017 Capital increase via a partial demerger and contribution in kind 1,547 1,350,111 2018 Capital increase through contribution of claim as a result of an optional dividend 3,989 3,481,275 2018 Capital increase, transaction, Asse-Zellik (1) 360 314,020 2018 Capital increase, transaction, Asse-Zellik (2) 956 834,582 2018 Capital increase, transaction, Tiel, Veghel and Bleiswijk 3,133 2,734,914 2019 Capital increase through contribution of claim as a result of an optional dividend 2,646 2,309,475 2019 Capital increase via an accelerated bookbuild (ABB) 10,025 8,750,000 2020 Capital increase through contribution of claim as a result of an optional dividend 2,549 2,224,662 2021 Capital increase, transaction, Sip-Well 400 348,975 2021 Capital increase via an accelerated bookbuild (ABB) 7,834 6,837,607 2021 Capital increase through contribution of claim as a result of an optional dividend 2,409 2,102,558 2021 Capital increase, transaction, DPG Media Services 881 769,186 WDP Annual accounts 2023 253
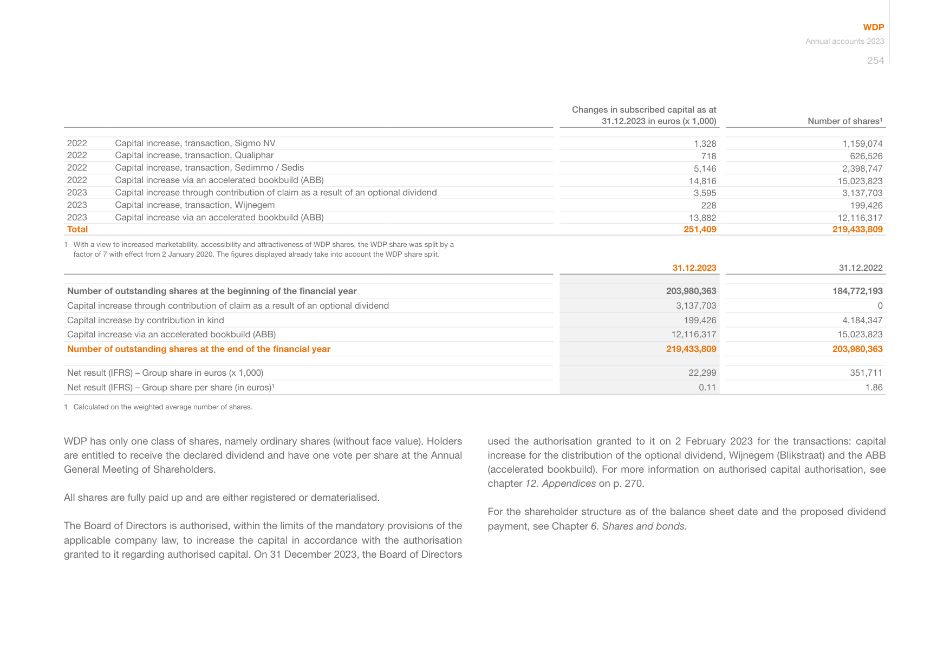
Changes in subscribed capital as at 31.12.2023 in euros (x 1,000) Number of shares¹ 2022 Capital increase, transaction, Sigmo NV 1,328 1,159,074 2022 Capital increase, transaction, Qualiphar 718 626,526 2022 Capital increase, transaction, Sedimmo / Sedis 5,146 2,398,747 2022 Capital increase via an accelerated bookbuild (ABB) 14,816 15,023,823 2023 Capital increase through contribution of claim as a result of an optional dividend 3,595 3,137,703 2023 Capital increase, transaction, Wijnegem 228 199,426 2023 Capital increase via an accelerated bookbuild (ABB) 13,882 12,116,317 Total 251,409 219,433,809 1 With a view to increased marketability, accessibility and attractiveness of WDP shares, the WDP share was split by a factor of 7 with effect from 2 January 2020. The figures displayed already take into account the WDP share split. 31.12.2023 31.12.2022 Number of outstanding shares at the beginning of the financial year 203,980,363 184,772,193 Capital increase through contribution of claim as a result of an optional dividend 3,137,703 0 Capital increase by contribution in kind 199,426 4,184,347 Capital increase via an accelerated bookbuild (ABB) 12,116,317 15,023,823 Number of outstanding shares at the end of the financial year 219,433,809 203,980,363 Net result (IFRS) – Group share in euros (x 1,000) 22,299 351,711 Net result (IFRS) – Group share per share (in euros)¹ 0.11 1.86 1 Calculated on the weighted average number of shares. WDP has only one class of shares, namely ordinary shares (without face value). Holders are entitled to receive the declared dividend and have one vote per share at the Annual General Meeting of Shareholders. All shares are fully paid up and are either registered or dematerialised. The Board of Directors is authorised, within the limits of the mandatory provisions of the applicable company law, to increase the capital in accordance with the authorisation granted to it regarding authorised capital. On 31 December 2023, the Board of Directors used the authorisation granted to it on 2 February 2023 for the transactions: capital increase for the distribution of the optional dividend, Wijnegem (Blikstraat) and the ABB (accelerated bookbuild). For more information on authorised capital authorisation, see chapter 12. Appendices on p. 270. For the shareholder structure as of the balance sheet date and the proposed dividend payment, see Chapter 6. Shares and bonds. WDP Annual accounts 2023 254
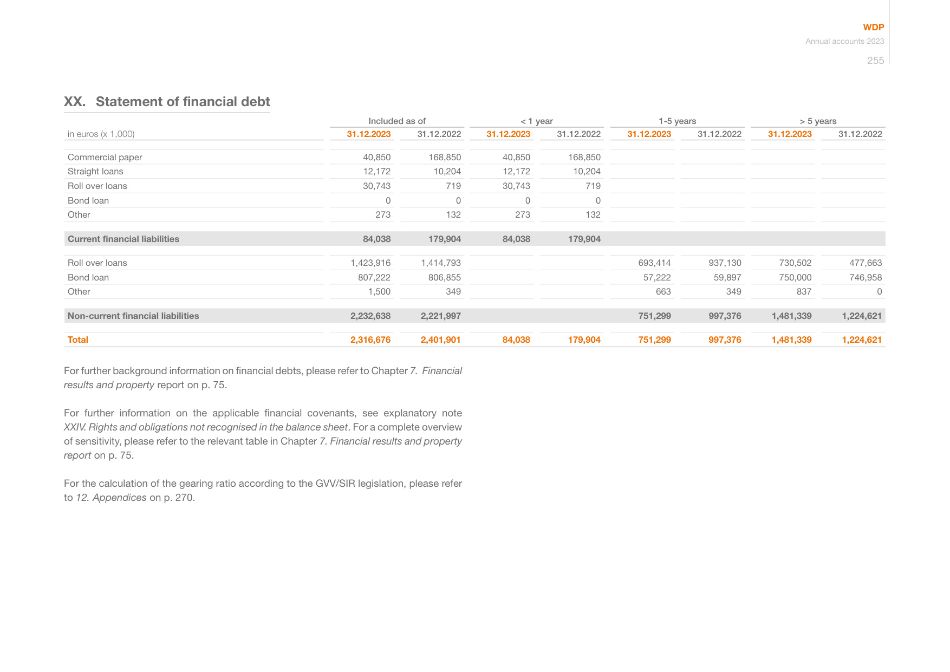
XX. Statement of financial debt Included as of < 1 year 1-5 years > 5 years in euros (x 1,000) 31.12.2023 31.12.2022 31.12.2023 31.12.2022 31.12.2023 31.12.2022 31.12.2023 31.12.2022 Commercial paper 40,850 168,850 40,850 168,850 Straight loans 12,172 10,204 12,172 10,204 Roll over loans 30,743 719 30,743 719 Bond loan 0 0 0 0 Other 273 132 273 132 Current financial liabilities 84,038 179,904 84,038 179,904 Roll over loans 1,423,916 1,414,793 693,414 937,130 730,502 477,663 Bond loan 807,222 806,855 57,222 59,897 750,000 746,958 Other 1,500 349 663 349 837 0 Non-current financial liabilities 2,232,638 2,221,997 751,299 997,376 1,481,339 1,224,621 Total 2,316,676 2,401,901 84,038 179,904 751,299 997,376 1,481,339 1,224,621 For further background information on financial debts, please refer to Chapter 7. Financial results and property report on p. 75. For further information on the applicable financial covenants, see explanatory note XXIV. Rights and obligations not recognised in the balance sheet. For a complete overview of sensitivity, please refer to the relevant table in Chapter 7. Financial results and property report on p. 75. For the calculation of the gearing ratio according to the GVV/SIR legislation, please refer to 12. Appendices on p. 270. WDP Annual accounts 2023 255
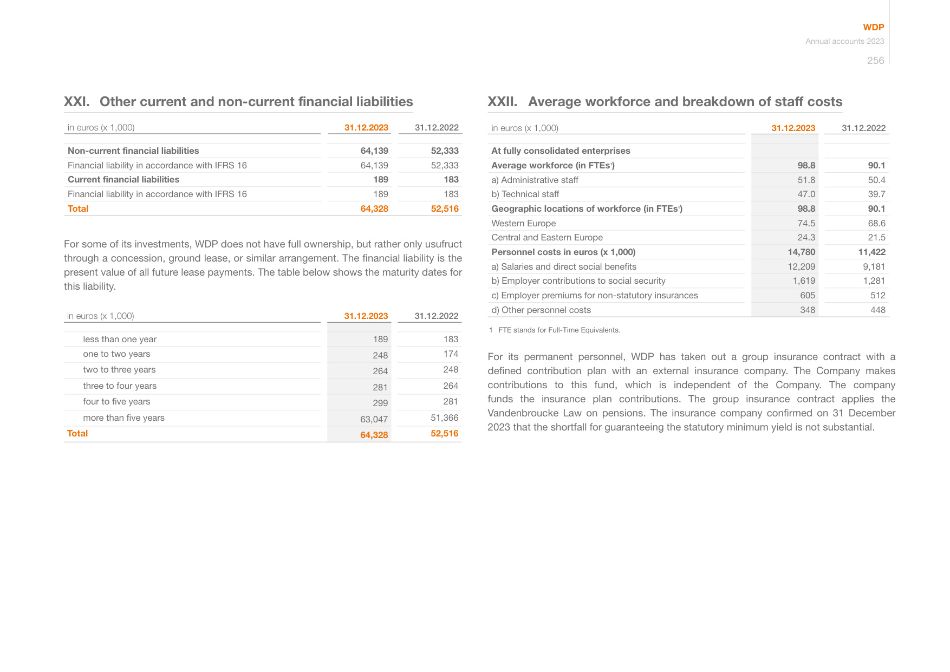
XXI. Other current and non-current financial liabilities in euros (x 1,000) 31.12.2023 31.12.2022 Non-current financial liabilities 64,139 52,333 Financial liability in accordance with IFRS 16 64,139 52,333 Current financial liabilities 189 183 Financial liability in accordance with IFRS 16 189 183 Total 64,328 52,516 For some of its investments, WDP does not have full ownership, but rather only usufruct through a concession, ground lease, or similar arrangement. The financial liability is the present value of all future lease payments. The table below shows the maturity dates for this liability. in euros (x 1,000) 31.12.2023 31.12.2022 less than one year 189 183 one to two years 248 174 two to three years 264 248 three to four years 281 264 four to five years 299 281 more than five years 63,047 51,366 Total 64,328 52,516 XXII. Average workforce and breakdown of staff costs in euros (x 1,000) 31.12.2023 31.12.2022 At fully consolidated enterprises Average workforce (in FTEs¹) 98.8 90.1 a) Administrative staff 51.8 50.4 b) Technical staff 47.0 39.7 Geographic locations of workforce (in FTEs¹) 98.8 90.1 Western Europe 74.5 68.6 Central and Eastern Europe 24.3 21.5 Personnel costs in euros (x 1,000) 14,780 11,422 a) Salaries and direct social benefits 12,209 9,181 b) Employer contributions to social security 1,619 1,281 c) Employer premiums for non-statutory insurances 605 512 d) Other personnel costs 348 448 1 FTE stands for Full-Time Equivalents. For its permanent personnel, WDP has taken out a group insurance contract with a defined contribution plan with an external insurance company. The Company makes contributions to this fund, which is independent of the Company. The company funds the insurance plan contributions. The group insurance contract applies the Vandenbroucke Law on pensions. The insurance company confirmed on 31 December 2023 that the shortfall for guaranteeing the statutory minimum yield is not substantial. WDP Annual accounts 2023 256
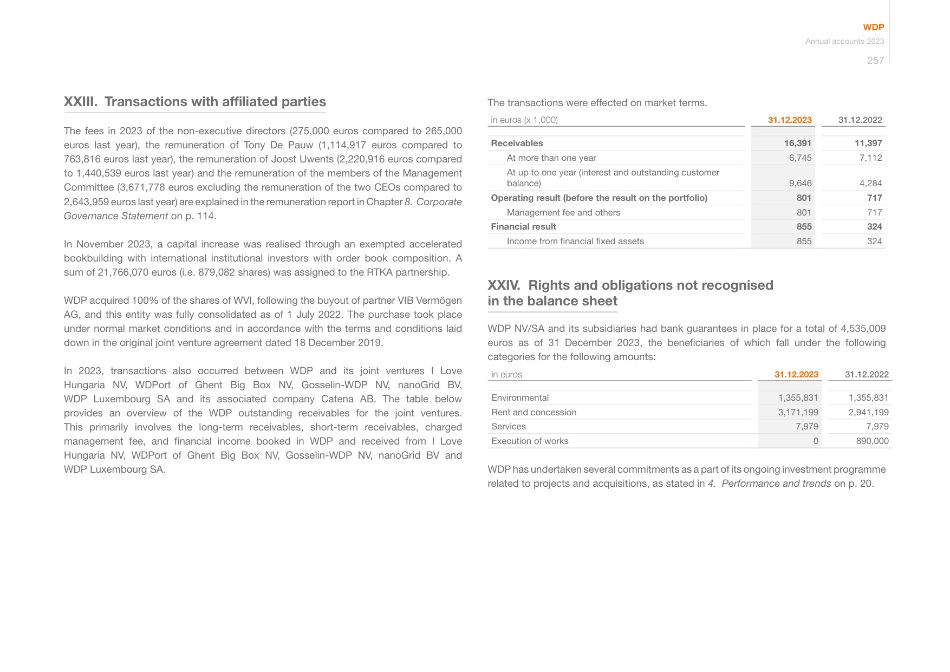
The transactions were effected on market terms. in euros (x 1,000) 31.12.2023 31.12.2022 Receivables 16,391 11,397 At more than one year 6,745 7,112 At up to one year (interest and outstanding customer balance) 9,646 4,284 Operating result (before the result on the portfolio) 801 717 Management fee and others 801 717 Financial result 855 324 Income from financial fixed assets 855 324 XXIV. Rights and obligations not recognised in the balance sheet WDP NV/SA and its subsidiaries had bank guarantees in place for a total of 4,535,009 euros as of 31 December 2023, the beneficiaries of which fall under the following categories for the following amounts: in euros 31.12.2023 31.12.2022 Environmental 1,355,831 1,355,831 Rent and concession 3,171,199 2,941,199 Services 7,979 7,979 Execution of works 0 890,000 WDP has undertaken several commitments as a part of its ongoing investment programme related to projects and acquisitions, as stated in 4. Performance and trends on p. 20. XXIII. Transactions with affiliated parties The fees in 2023 of the non-executive directors (275,000 euros compared to 265,000 euros last year), the remuneration of Tony De Pauw (1,114,917 euros compared to 763,816 euros last year), the remuneration of Joost Uwents (2,220,916 euros compared to 1,440,539 euros last year) and the remuneration of the members of the Management Committee (3,671,778 euros excluding the remuneration of the two CEOs compared to 2,643,959 euros last year) are explained in the remuneration report in Chapter 8. Corporate Governance Statement on p. 114. In November 2023, a capital increase was realised through an exempted accelerated bookbuilding with international institutional investors with order book composition. A sum of 21,766,070 euros (i.e. 879,082 shares) was assigned to the RTKA partnership. WDP acquired 100% of the shares of WVI, following the buyout of partner VIB Vermögen AG, and this entity was fully consolidated as of 1 July 2022. The purchase took place under normal market conditions and in accordance with the terms and conditions laid down in the original joint venture agreement dated 18 December 2019. In 2023, transactions also occurred between WDP and its joint ventures I Love Hungaria NV, WDPort of Ghent Big Box NV, Gosselin-WDP NV, nanoGrid BV, WDP Luxembourg SA and its associated company Catena AB. The table below provides an overview of the WDP outstanding receivables for the joint ventures. This primarily involves the long-term receivables, short-term receivables, charged management fee, and financial income booked in WDP and received from I Love Hungaria NV, WDPort of Ghent Big Box NV, Gosselin-WDP NV, nanoGrid BV and WDP Luxembourg SA. WDP Annual accounts 2023 257
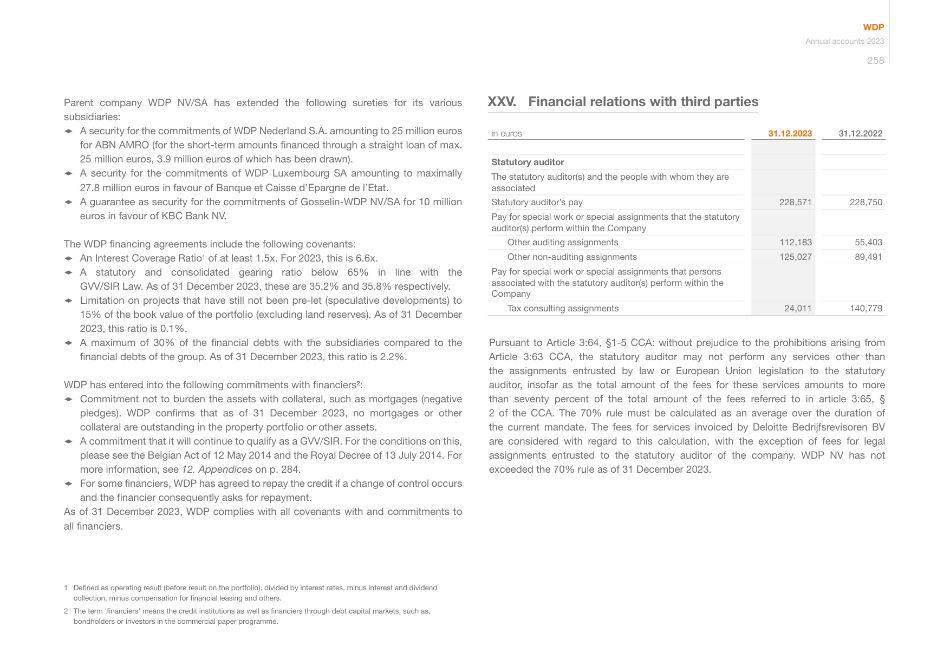
XXV. Financial relations with third parties in euros 31.12.2023 31.12.2022 Statutory auditor The statutory auditor(s) and the people with whom they are associated Statutory auditor's pay 228,571 228,750 Pay for special work or special assignments that the statutory auditor(s) perform within the Company Other auditing assignments 112,183 55,403 Other non-auditing assignments 125,027 89,491 Pay for special work or special assignments that persons associated with the statutory auditor(s) perform within the Company Tax consulting assignments 24,011 140,779 Pursuant to Article 3:64, §1-5 CCA: without prejudice to the prohibitions arising from Article 3:63 CCA, the statutory auditor may not perform any services other than the assignments entrusted by law or European Union legislation to the statutory auditor, insofar as the total amount of the fees for these services amounts to more than seventy percent of the total amount of the fees referred to in article 3:65, § 2 of the CCA. The 70% rule must be calculated as an average over the duration of the current mandate. The fees for services invoiced by Deloitte Bedrijfsrevisoren BV are considered with regard to this calculation, with the exception of fees for legal assignments entrusted to the statutory auditor of the company. WDP NV has not exceeded the 70% rule as of 31 December 2023. Parent company WDP NV/SA has extended the following sureties for its various subsidiaries: 1 A security for the commitments of WDP Nederland S.A. amounting to 25 million euros for ABN AMRO (for the short-term amounts financed through a straight loan of max. 25 million euros, 3.9 million euros of which has been drawn). 1 A security for the commitments of WDP Luxembourg SA amounting to maximally 27.8 million euros in favour of Banque et Caisse d'Epargne de l'Etat. 1 A guarantee as security for the commitments of Gosselin-WDP NV/SA for 10 million euros in favour of KBC Bank NV. The WDP financing agreements include the following covenants: 1 An Interest Coverage Ratio1 of at least 1.5x. For 2023, this is 6.6x. 1 A statutory and consolidated gearing ratio below 65% in line with the GVV/SIR Law. As of 31 December 2023, these are 35.2% and 35.8% respectively. 1 Limitation on projects that have still not been pre-let (speculative developments) to 15% of the book value of the portfolio (excluding land reserves). As of 31 December 2023, this ratio is 0.1%. 1 A maximum of 30% of the financial debts with the subsidiaries compared to the financial debts of the group. As of 31 December 2023, this ratio is 2.2%. WDP has entered into the following commitments with financiers2: 1 Commitment not to burden the assets with collateral, such as mortgages (negative pledges). WDP confirms that as of 31 December 2023, no mortgages or other collateral are outstanding in the property portfolio or other assets. 1 A commitment that it will continue to qualify as a GVV/SIR. For the conditions on this, please see the Belgian Act of 12 May 2014 and the Royal Decree of 13 July 2014. For more information, see 12. Appendices on p. 284. 1 For some financiers, WDP has agreed to repay the credit if a change of control occurs and the financier consequently asks for repayment. As of 31 December 2023, WDP complies with all covenants with and commitments to all financiers. 1 Defined as operating result (before result on the portfolio), divided by interest rates, minus interest and dividend collection, minus compensation for financial leasing and others. 2 The term 'financiers' means the credit institutions as well as financiers through debt capital markets, such as, bondholders or investors in the commercial paper programme. WDP Annual accounts 2023 258
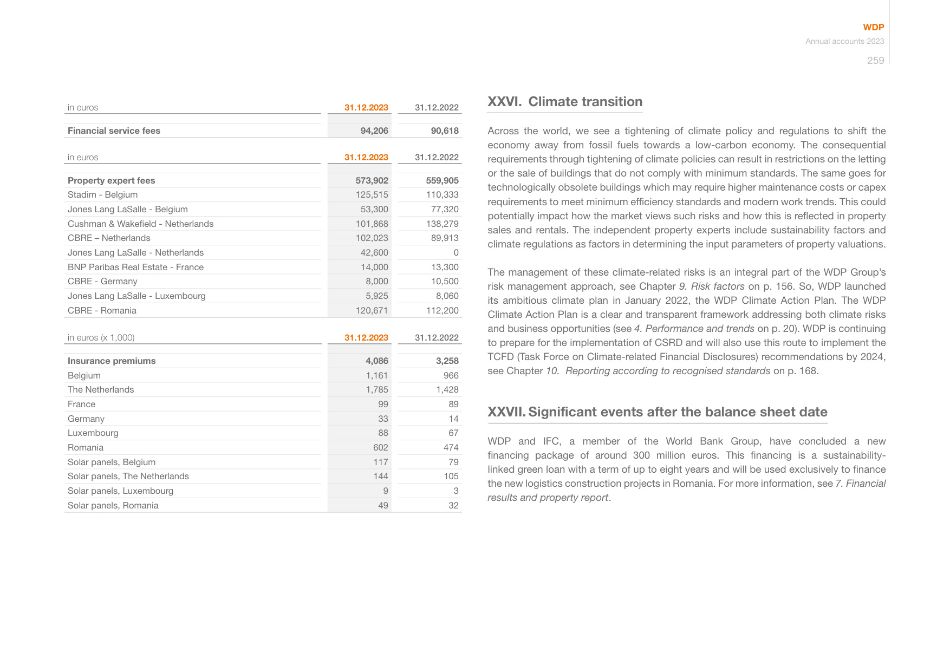
XXVI. Climate transition Across the world, we see a tightening of climate policy and regulations to shift the economy away from fossil fuels towards a low-carbon economy. The consequential requirements through tightening of climate policies can result in restrictions on the letting or the sale of buildings that do not comply with minimum standards. The same goes for technologically obsolete buildings which may require higher maintenance costs or capex requirements to meet minimum efficiency standards and modern work trends. This could potentially impact how the market views such risks and how this is reflected in property sales and rentals. The independent property experts include sustainability factors and climate regulations as factors in determining the input parameters of property valuations. The management of these climate-related risks is an integral part of the WDP Group's risk management approach, see Chapter 9. Risk factors on p. 156. So, WDP launched its ambitious climate plan in January 2022, the WDP Climate Action Plan. The WDP Climate Action Plan is a clear and transparent framework addressing both climate risks and business opportunities (see 4. Performance and trends on p. 20). WDP is continuing to prepare for the implementation of CSRD and will also use this route to implement the TCFD (Task Force on Climate-related Financial Disclosures) recommendations by 2024, see Chapter 10. Reporting according to recognised standards on p. 168. XXVII. Significant events after the balance sheet date WDP and IFC, a member of the World Bank Group, have concluded a new financing package of around 300 million euros. This financing is a sustainability- linked green loan with a term of up to eight years and will be used exclusively to finance the new logistics construction projects in Romania. For more information, see 7. Financial results and property report. in euros 31.12.2023 31.12.2022 Financial service fees 94,206 90,618 in euros 31.12.2023 31.12.2022 Property expert fees 573,902 559,905 Stadim - Belgium 125,515 110,333 Jones Lang LaSalle - Belgium 53,300 77,320 Cushman & Wakefield - Netherlands 101,868 138,279 CBRE – Netherlands 102,023 89,913 Jones Lang LaSalle - Netherlands 42,600 0 BNP Paribas Real Estate - France 14,000 13,300 CBRE - Germany 8,000 10,500 Jones Lang LaSalle - Luxembourg 5,925 8,060 CBRE - Romania 120,671 112,200 in euros (x 1,000) 31.12.2023 31.12.2022 Insurance premiums 4,086 3,258 Belgium 1,161 966 The Netherlands 1,785 1,428 France 99 89 Germany 33 14 Luxembourg 88 67 Romania 602 474 Solar panels, Belgium 117 79 Solar panels, The Netherlands 144 105 Solar panels, Luxembourg 9 3 Solar panels, Romania 49 32 WDP Annual accounts 2023 259
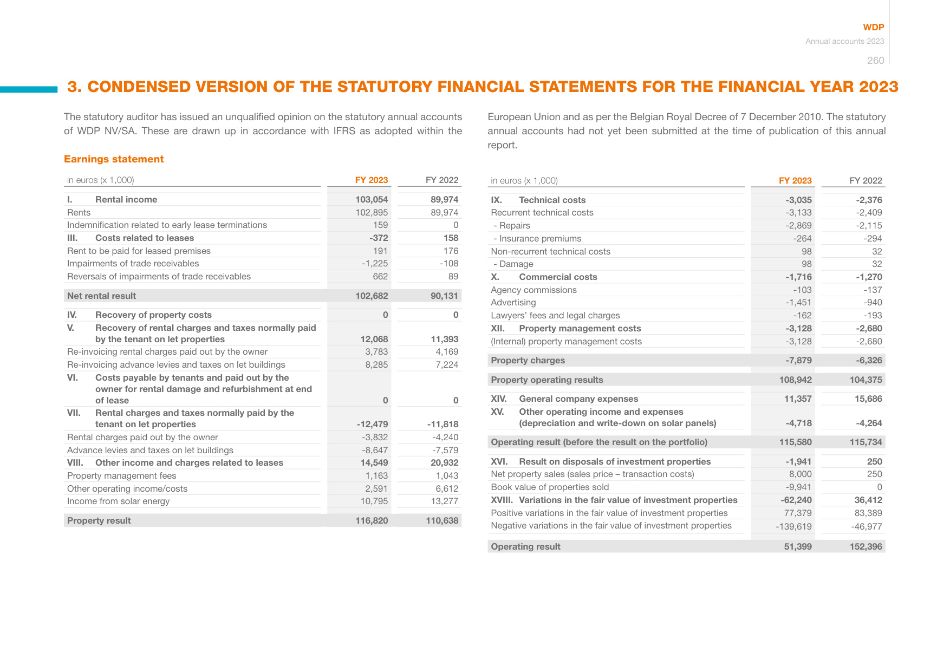
3. CONDENSED VERSION OF THE STATUTORY FINANCIAL STATEMENTS FOR THE FINANCIAL YEAR 2023 European Union and as per the Belgian Royal Decree of 7 December 2010. The statutory annual accounts had not yet been submitted at the time of publication of this annual report. The statutory auditor has issued an unqualified opinion on the statutory annual accounts of WDP NV/SA. These are drawn up in accordance with IFRS as adopted within the Earnings statement in euros (x 1,000) FY 2023 FY 2022 I. Rental income 103,054 89,974 Rents 102,895 89,974 Indemnification related to early lease terminations 159 0 III. Costs related to leases -372 158 Rent to be paid for leased premises 191 176 Impairments of trade receivables -1,225 -108 Reversals of impairments of trade receivables 662 89 Net rental result 102,682 90,131 IV. Recovery of property costs 0 0 V. Recovery of rental charges and taxes normally paid by the tenant on let properties 12,068 11,393 Re-invoicing rental charges paid out by the owner 3,783 4,169 Re-invoicing advance levies and taxes on let buildings 8,285 7,224 VI. Costs payable by tenants and paid out by the owner for rental damage and refurbishment at end of lease 0 0 VII. Rental charges and taxes normally paid by the tenant on let properties -12,479 -11,818 Rental charges paid out by the owner -3,832 -4,240 Advance levies and taxes on let buildings -8,647 -7,579 VIII. Other income and charges related to leases 14,549 20,932 Property management fees 1,163 1,043 Other operating income/costs 2,591 6,612 Income from solar energy 10,795 13,277 Property result 116,820 110,638 in euros (x 1,000) FY 2023 FY 2022 IX. Technical costs -3,035 -2,376 Recurrent technical costs -3,133 -2,409 - Repairs -2,869 -2,115 - Insurance premiums -264 -294 Non-recurrent technical costs 98 32 - Damage 98 32 X. Commercial costs -1,716 -1,270 Agency commissions -103 -137 Advertising -1,451 -940 Lawyers' fees and legal charges -162 -193 XII. Property management costs -3,128 -2,680 (Internal) property management costs -3,128 -2,680 Property charges -7,879 -6,326 Property operating results 108,942 104,375 XIV. General company expenses 11,357 15,686 XV. Other operating income and expenses (depreciation and write-down on solar panels) -4,718 -4,264 Operating result (before the result on the portfolio) 115,580 115,734 XVI. Result on disposals of investment properties -1,941 250 Net property sales (sales price – transaction costs) 8,000 250 Book value of properties sold -9,941 0 XVIII. Variations in the fair value of investment properties -62,240 36,412 Positive variations in the fair value of investment properties 77,379 83,389 Negative variations in the fair value of investment properties -139,619 -46,977 Operating result 51,399 152,396 WDP Annual accounts 2023 260
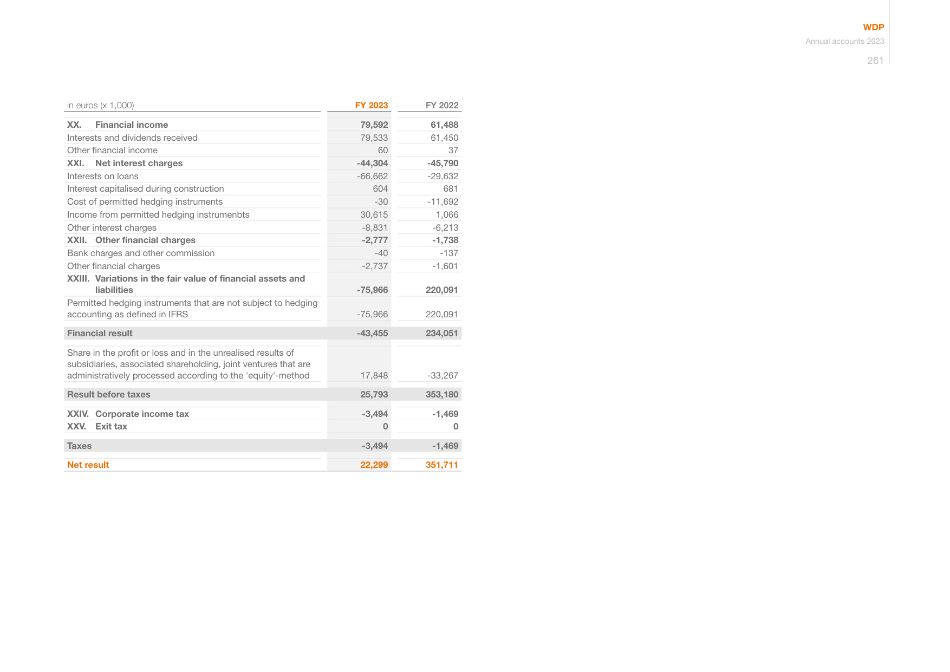
in euros (x 1,000) FY 2023 FY 2022 XX. Financial income 79,592 61,488 Interests and dividends received 79,533 61,450 Other financial income 60 37 XXI. Net interest charges -44,304 -45,790 Interests on loans -66,662 -29,632 Interest capitalised during construction 604 681 Cost of permitted hedging instruments -30 -11,692 Income from permitted hedging instrumenbts 30,615 1,066 Other interest charges -8,831 -6,213 XXII. Other financial charges -2,777 -1,738 Bank charges and other commission -40 -137 Other financial charges -2,737 -1,601 XXIII. Variations in the fair value of financial assets and liabilities -75,966 220,091 Permitted hedging instruments that are not subject to hedging accounting as defined in IFRS -75,966 220,091 Financial result -43,455 234,051 Share in the profit or loss and in the unrealised results of subsidiaries, associated shareholding, joint ventures that are administratively processed according to the 'equity'-method 17,848 -33,267 Result before taxes 25,793 353,180 XXIV. Corporate income tax -3,494 -1,469 XXV. Exit tax 0 0 Taxes -3,494 -1,469 Net result 22,299 351,711 WDP Annual accounts 2023 261
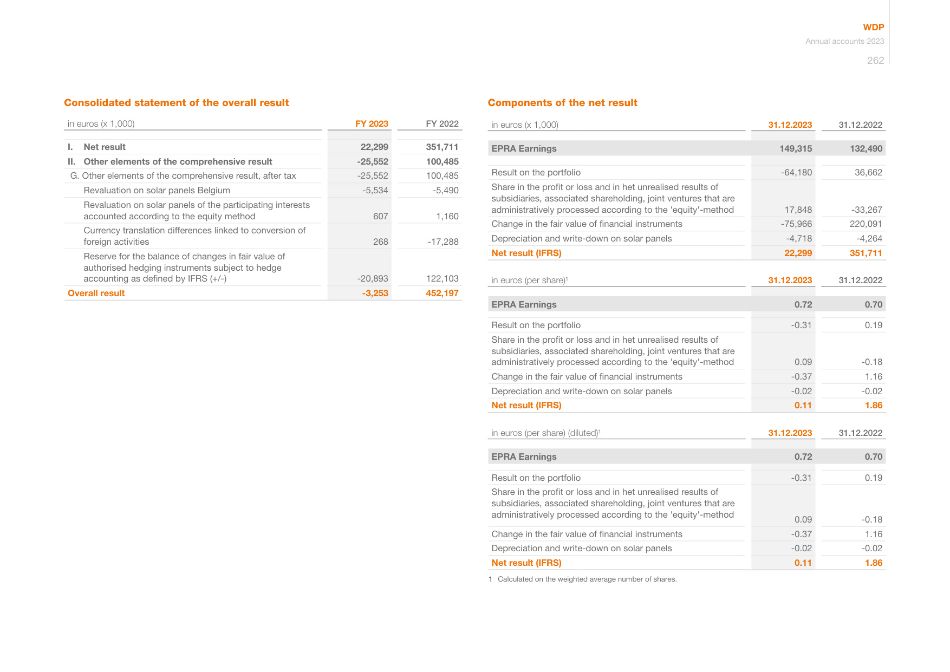
Components of the net result in euros (x 1,000) 31.12.2023 31.12.2022 EPRA Earnings 149,315 132,490 Result on the portfolio -64,180 36,662 Share in the profit or loss and in het unrealised results of subsidiaries, associated shareholding, joint ventures that are administratively processed according to the 'equity'-method 17,848 -33,267 Change in the fair value of financial instruments -75,966 220,091 Depreciation and write-down on solar panels -4,718 -4,264 Net result (IFRS) 22,299 351,711 in euros (per share)¹ 31.12.2023 31.12.2022 EPRA Earnings 0.72 0.70 Result on the portfolio -0.31 0.19 Share in the profit or loss and in het unrealised results of subsidiaries, associated shareholding, joint ventures that are administratively processed according to the 'equity'-method 0.09 -0.18 Change in the fair value of financial instruments -0.37 1.16 Depreciation and write-down on solar panels -0.02 -0.02 Net result (IFRS) 0.11 1.86 in euros (per share) (diluted)¹ 31.12.2023 31.12.2022 EPRA Earnings 0.72 0.70 Result on the portfolio -0.31 0.19 Share in the profit or loss and in het unrealised results of subsidiaries, associated shareholding, joint ventures that are administratively processed according to the 'equity'-method 0.09 -0.18 Change in the fair value of financial instruments -0.37 1.16 Depreciation and write-down on solar panels -0.02 -0.02 Net result (IFRS) 0.11 1.86 1 Calculated on the weighted average number of shares. Consolidated statement of the overall result in euros (x 1,000) FY 2023 FY 2022 I. Net result 22,299 351,711 II. Other elements of the comprehensive result -25,552 100,485 G. Other elements of the comprehensive result, after tax -25,552 100,485 Revaluation on solar panels Belgium -5,534 -5,490 Revaluation on solar panels of the participating interests accounted according to the equity method 607 1,160 Currency translation differences linked to conversion of foreign activities 268 -17,288 Reserve for the balance of changes in fair value of authorised hedging instruments subject to hedge accounting as defined by IFRS (+/-) -20,893 122,103 Overall result -3,253 452,197 WDP Annual accounts 2023 262
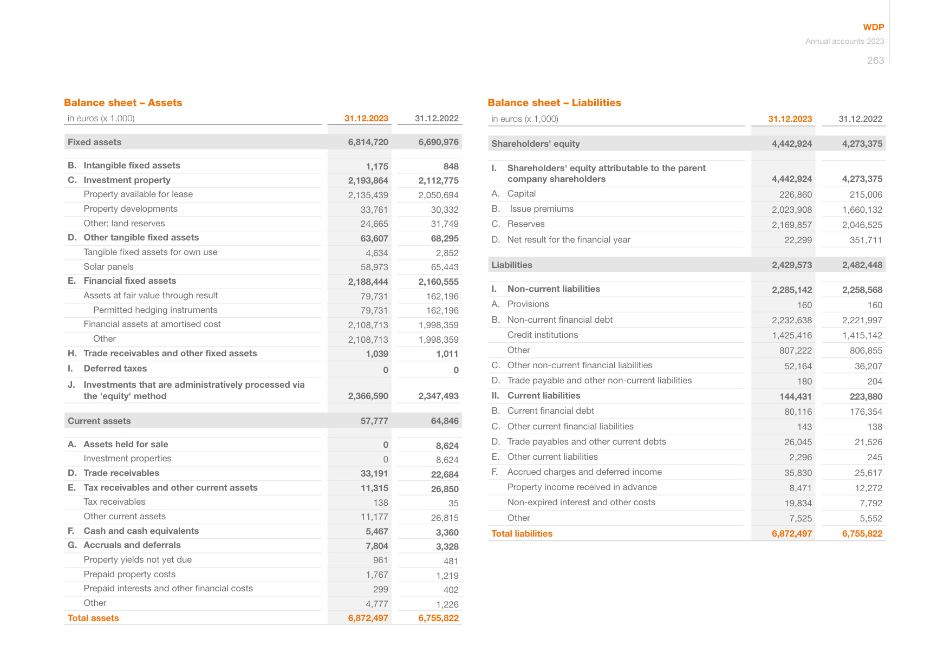
Balance sheet – Liabilities in euros (x 1,000) 31.12.2023 31.12.2022 Shareholders' equity 4,442,924 4,273,375 I. Shareholders' equity attributable to the parent company shareholders 4,442,924 4,273,375 A. Capital 226,860 215,006 B. Issue premiums 2,023,908 1,660,132 C. Reserves 2,169,857 2,046,525 D. Net result for the financial year 22,299 351,711 Liabilities 2,429,573 2,482,448 I. Non-current liabilities 2,285,142 2,258,568 A. Provisions 160 160 B. Non-current financial debt 2,232,638 2,221,997 Credit institutions 1,425,416 1,415,142 Other 807,222 806,855 C. Other non-current financial liabilities 52,164 36,207 D. Trade payable and other non-current liabilities 180 204 II. Current liabilities 144,431 223,880 B. Current financial debt 80,116 176,354 C. Other current financial liabilities 143 138 D. Trade payables and other current debts 26,045 21,526 E. Other current liabilities 2,296 245 F. Accrued charges and deferred income 35,830 25,617 Property income received in advance 8,471 12,272 Non-expired interest and other costs 19,834 7,792 Other 7,525 5,552 Total liabilities 6,872,497 6,755,822 Balance sheet – Assets in euros (x 1,000) 31.12.2023 31.12.2022 Fixed assets 6,814,720 6,690,976 B. Intangible fixed assets 1,175 848 C. Investment property 2,193,864 2,112,775 Property available for lease 2,135,439 2,050,694 Property developments 33,761 30,332 Other: land reserves 24,665 31,749 D. Other tangible fixed assets 63,607 68,295 Tangible fixed assets for own use 4,634 2,852 Solar panels 58,973 65,443 E. Financial fixed assets 2,188,444 2,160,555 Assets at fair value through result 79,731 162,196 Permitted hedging instruments 79,731 162,196 Financial assets at amortised cost 2,108,713 1,998,359 Other 2,108,713 1,998,359 H. Trade receivables and other fixed assets 1,039 1,011 I. Deferred taxes 0 0 J. Investments that are administratively processed via the 'equity' method 2,366,590 2,347,493 Current assets 57,777 64,846 A. Assets held for sale 0 8,624 Investment properties 0 8,624 D. Trade receivables 33,191 22,684 E. Tax receivables and other current assets 11,315 26,850 Tax receivables 138 35 Other current assets 11,177 26,815 F. Cash and cash equivalents 5,467 3,360 G. Accruals and deferrals 7,804 3,328 Property yields not yet due 961 481 Prepaid property costs 1,767 1,219 Prepaid interests and other financial costs 299 402 Other 4,777 1,226 Total assets 6,872,497 6,755,822 WDP Annual accounts 2023 263
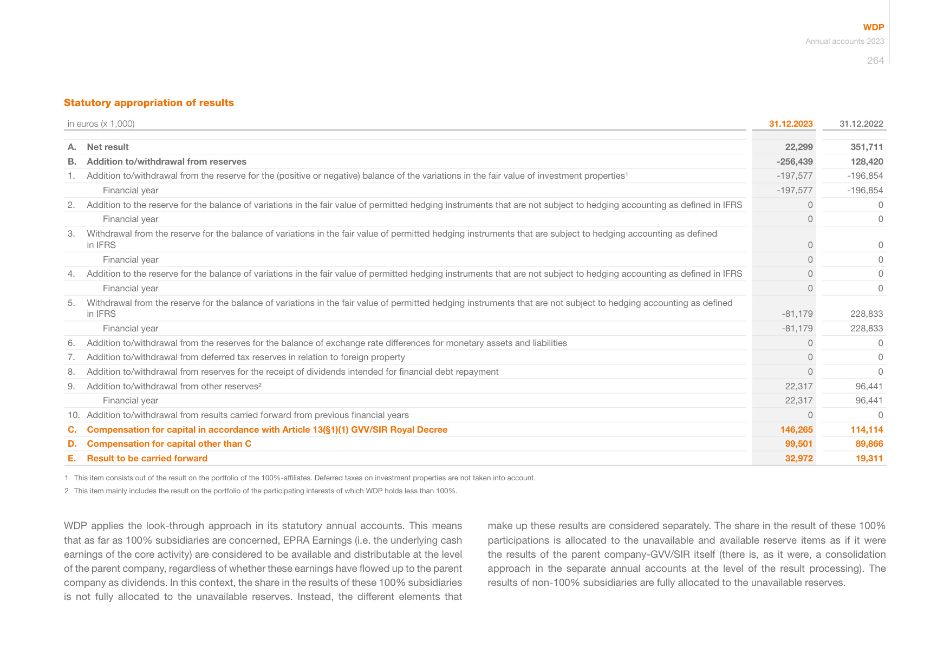
make up these results are considered separately. The share in the result of these 100% participations is allocated to the unavailable and available reserve items as if it were the results of the parent company-GVV/SIR itself (there is, as it were, a consolidation approach in the separate annual accounts at the level of the result processing). The results of non-100% subsidiaries are fully allocated to the unavailable reserves. Statutory appropriation of results in euros (x 1,000) 31.12.2023 31.12.2022 A. Net result 22,299 351,711 B. Addition to/withdrawal from reserves -256,439 128,420 1. Addition to/withdrawal from the reserve for the (positive or negative) balance of the variations in the fair value of investment properties¹ -197,577 -196,854 Financial year -197,577 -196,854 2. Addition to the reserve for the balance of variations in the fair value of permitted hedging instruments that are not subject to hedging accounting as defined in IFRS 0 0 Financial year 0 0 3. Withdrawal from the reserve for the balance of variations in the fair value of permitted hedging instruments that are subject to hedging accounting as defined in IFRS 0 0 Financial year 0 0 4. Addition to the reserve for the balance of variations in the fair value of permitted hedging instruments that are not subject to hedging accounting as defined in IFRS 0 0 Financial year 0 0 5. Withdrawal from the reserve for the balance of variations in the fair value of permitted hedging instruments that are not subject to hedging accounting as defined in IFRS -81,179 228,833 Financial year -81,179 228,833 6. Addition to/withdrawal from the reserves for the balance of exchange rate differences for monetary assets and liabilities 0 0 7. Addition to/withdrawal from deferred tax reserves in relation to foreign property 0 0 8. Addition to/withdrawal from reserves for the receipt of dividends intended for financial debt repayment 0 0 9. Addition to/withdrawal from other reserves² 22,317 96,441 Financial year 22,317 96,441 10. Addition to/withdrawal from results carried forward from previous financial years 0 0 C. Compensation for capital in accordance with Article 13(§1)(1) GVV/SIR Royal Decree 146,265 114,114 D. Compensation for capital other than C 99,501 89,866 E. Result to be carried forward 32,972 19,311 1 This item consists out of the result on the portfolio of the 100%-affiliates. Deferred taxes on investment properties are not taken into account. 2 This item mainly includes the result on the portfolio of the participating interests of which WDP holds less than 100%. WDP applies the look-through approach in its statutory annual accounts. This means that as far as 100% subsidiaries are concerned, EPRA Earnings (i.e. the underlying cash earnings of the core activity) are considered to be available and distributable at the level of the parent company, regardless of whether these earnings have flowed up to the parent company as dividends. In this context, the share in the results of these 100% subsidiaries is not fully allocated to the unavailable reserves. Instead, the different elements that WDP Annual accounts 2023 264
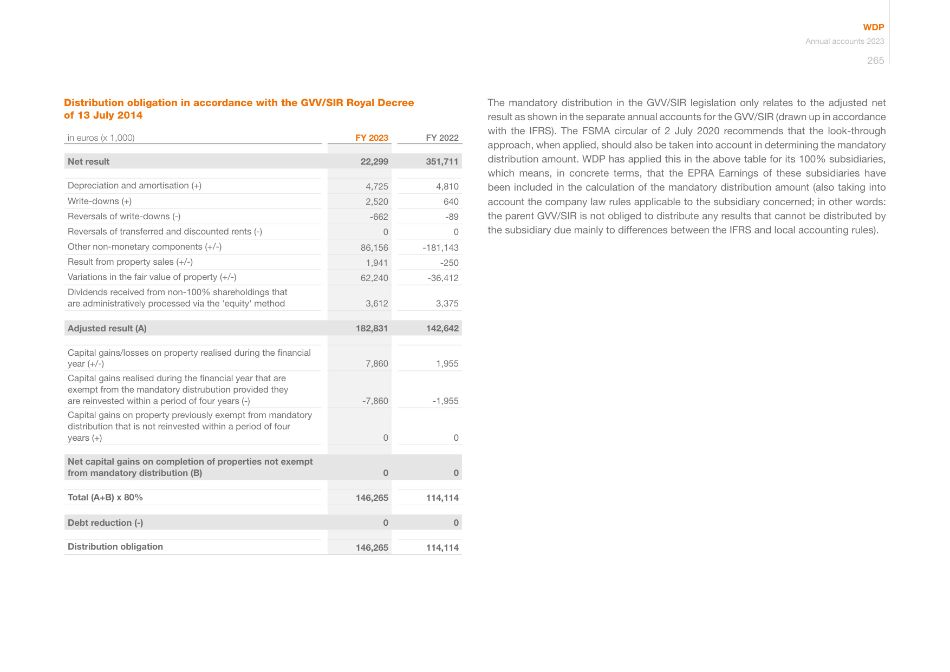
The mandatory distribution in the GVV/SIR legislation only relates to the adjusted net result as shown in the separate annual accounts for the GVV/SIR (drawn up in accordance with the IFRS). The FSMA circular of 2 July 2020 recommends that the look-through approach, when applied, should also be taken into account in determining the mandatory distribution amount. WDP has applied this in the above table for its 100% subsidiaries, which means, in concrete terms, that the EPRA Earnings of these subsidiaries have been included in the calculation of the mandatory distribution amount (also taking into account the company law rules applicable to the subsidiary concerned; in other words: the parent GVV/SIR is not obliged to distribute any results that cannot be distributed by the subsidiary due mainly to differences between the IFRS and local accounting rules). Distribution obligation in accordance with the GVV/SIR Royal Decree of 13 July 2014 in euros (x 1,000) FY 2023 FY 2022 Net result 22,299 351,711 Depreciation and amortisation (+) 4,725 4,810 Write-downs (+) 2,520 640 Reversals of write-downs (-) -662 -89 Reversals of transferred and discounted rents (-) 0 0 Other non-monetary components (+/-) 86,156 -181,143 Result from property sales (+/-) 1,941 -250 Variations in the fair value of property (+/-) 62,240 -36,412 Dividends received from non-100% shareholdings that are administratively processed via the 'equity' method 3,612 3,375 Adjusted result (A) 182,831 142,642 Capital gains/losses on property realised during the financial year (+/-) 7,860 1,955 Capital gains realised during the financial year that are exempt from the mandatory distrubution provided they are reinvested within a period of four years (-) -7,860 -1,955 Capital gains on property previously exempt from mandatory distribution that is not reinvested within a period of four years (+) 0 0 Net capital gains on completion of properties not exempt from mandatory distribution (B) 0 0 Total (A+B) x 80% 146,265 114,114 Debt reduction (-) 0 0 Distribution obligation 146,265 114,114 WDP Annual accounts 2023 265
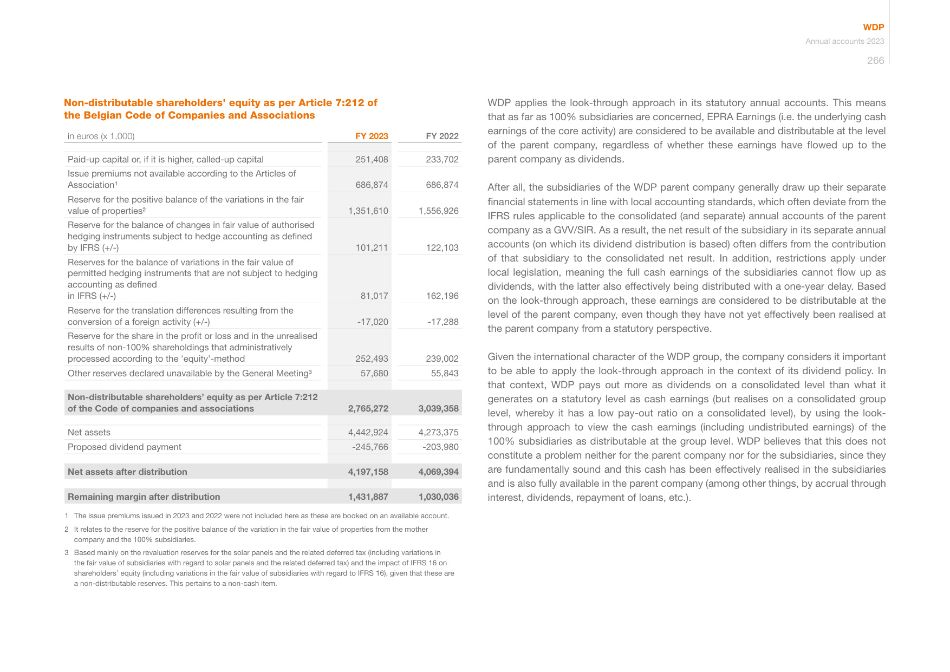
WDP applies the look-through approach in its statutory annual accounts. This means that as far as 100% subsidiaries are concerned, EPRA Earnings (i.e. the underlying cash earnings of the core activity) are considered to be available and distributable at the level of the parent company, regardless of whether these earnings have flowed up to the parent company as dividends. After all, the subsidiaries of the WDP parent company generally draw up their separate financial statements in line with local accounting standards, which often deviate from the IFRS rules applicable to the consolidated (and separate) annual accounts of the parent company as a GVV/SIR. As a result, the net result of the subsidiary in its separate annual accounts (on which its dividend distribution is based) often differs from the contribution of that subsidiary to the consolidated net result. In addition, restrictions apply under local legislation, meaning the full cash earnings of the subsidiaries cannot flow up as dividends, with the latter also effectively being distributed with a one-year delay. Based on the look-through approach, these earnings are considered to be distributable at the level of the parent company, even though they have not yet effectively been realised at the parent company from a statutory perspective. Given the international character of the WDP group, the company considers it important to be able to apply the look-through approach in the context of its dividend policy. In that context, WDP pays out more as dividends on a consolidated level than what it generates on a statutory level as cash earnings (but realises on a consolidated group level, whereby it has a low pay-out ratio on a consolidated level), by using the look- through approach to view the cash earnings (including undistributed earnings) of the 100% subsidiaries as distributable at the group level. WDP believes that this does not constitute a problem neither for the parent company nor for the subsidiaries, since they are fundamentally sound and this cash has been effectively realised in the subsidiaries and is also fully available in the parent company (among other things, by accrual through interest, dividends, repayment of loans, etc.). Non-distributable shareholders' equity as per Article 7:212 of the Belgian Code of Companies and Associations in euros (x 1,000) FY 2023 FY 2022 Paid-up capital or, if it is higher, called-up capital 251,408 233,702 Issue premiums not available according to the Articles of Association¹ 686,874 686,874 Reserve for the positive balance of the variations in the fair value of properties² 1,351,610 1,556,926 Reserve for the balance of changes in fair value of authorised hedging instruments subject to hedge accounting as defined by IFRS (+/-) 101,211 122,103 Reserves for the balance of variations in the fair value of permitted hedging instruments that are not subject to hedging accounting as defined in IFRS (+/-) 81,017 162,196 Reserve for the translation differences resulting from the conversion of a foreign activity (+/-) -17,020 -17,288 Reserve for the share in the profit or loss and in the unrealised results of non-100% shareholdings that administratively processed according to the 'equity'-method 252,493 239,002 Other reserves declared unavailable by the General Meeting³ 57,680 55,843 Non-distributable shareholders' equity as per Article 7:212 of the Code of companies and associations 2,765,272 3,039,358 Net assets 4,442,924 4,273,375 Proposed dividend payment -245,766 -203,980 Net assets after distribution 4,197,158 4,069,394 Remaining margin after distribution 1,431,887 1,030,036 1 The issue premiums issued in 2023 and 2022 were not included here as these are booked on an available account. 2 It relates to the reserve for the positive balance of the variation in the fair value of properties from the mother company and the 100% subsidiaries. 3 Based mainly on the revaluation reserves for the solar panels and the related deferred tax (including variations in the fair value of subsidiaries with regard to solar panels and the related deferred tax) and the impact of IFRS 16 on shareholders' equity (including variations in the fair value of subsidiaries with regard to IFRS 16), given that these are a non-distributable reserves. This pertains to a non-cash item. WDP Annual accounts 2023 266
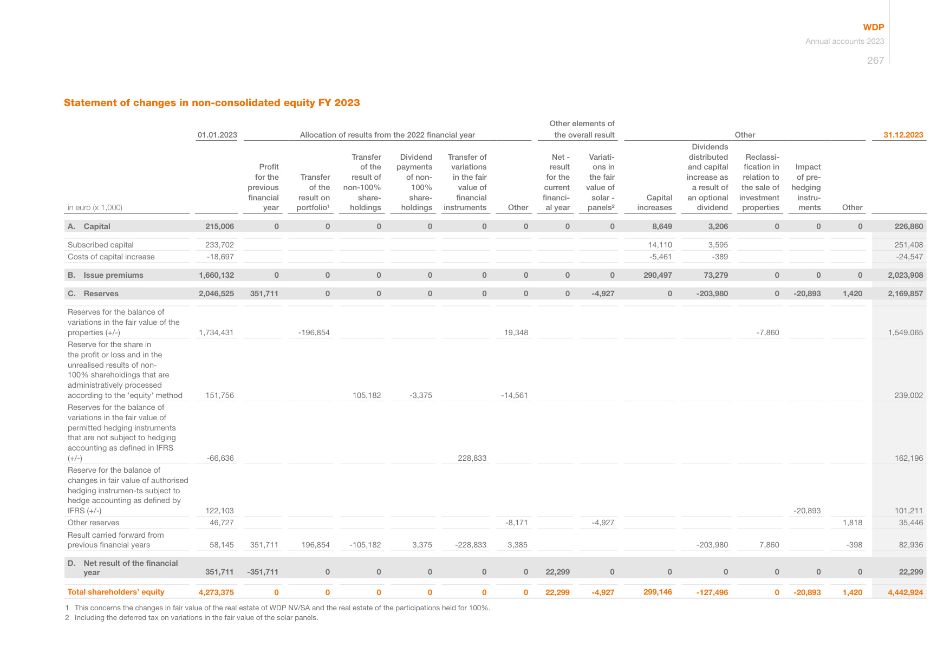
Statement of changes in non-consolidated equity FY 2023 01.01.2023 Allocation of results from the 2022 financial year Other elements of the overall result Other 31.12.2023 in euro (x 1,000) Profit for the previous financial year Transfer of the result on portfolio¹ Transfer of the result of non-100% share- holdings Dividend payments of non- 100% share- holdings Transfer of variations in the fair value of financial instruments Other Net - result for the current financi- al year Variati- ons in the fair value of solar - panels² Capital increases Dividends distributed and capital increase as a result of an optional dividend Reclassi- fication in relation to the sale of investment properties Impact of pre- hedging instru- ments Other A. Capital 215,006 0 0 0 0 0 0 0 0 8,649 3,206 0 0 0 226,860 Subscribed capital 233,702 14,110 3,595 251,408 Costs of capital increase -18,697 -5,461 -389 -24,547 B. Issue premiums 1,660,132 0 0 0 0 0 0 0 0 290,497 73,279 0 0 0 2,023,908 C. Reserves 2,046,525 351,711 0 0 0 0 0 0 -4,927 0 -203,980 0 -20,893 1,420 2,169,857 Reserves for the balance of variations in the fair value of the properties (+/-) 1,734,431 -196,854 19,348 -7,860 1,549,065 Reserve for the share in the profit or loss and in the unrealised results of non- 100% shareholdings that are administratively processed according to the 'equity' method 151,756 105,182 -3,375 -14,561 239,002 Reserves for the balance of variations in the fair value of permitted hedging instruments that are not subject to hedging accounting as defined in IFRS (+/-) -66,636 228,833 162,196 Reserve for the balance of changes in fair value of authorised hedging instrumen-ts subject to hedge accounting as defined by IFRS (+/-) 122,103 -20,893 101,211 Other reserves 46,727 -8,171 -4,927 1,818 35,446 Result carried forward from previous financial years 58,145 351,711 196,854 -105,182 3,375 -228,833 3,385 -203,980 7,860 -398 82,936 D. Net result of the financial year 351,711 -351,711 0 0 0 0 0 22,299 0 0 0 0 0 0 22,299 Total shareholders' equity 4,273,375 0 0 0 0 0 0 22,299 -4,927 299,146 -127,496 0 -20,893 1,420 4,442,924 1 This concerns the changes in fair value of the real estate of WDP NV/SA and the real estate of the participations held for 100%. 2 Including the deferred tax on variations in the fair value of the solar panels. WDP Annual accounts 2023 267
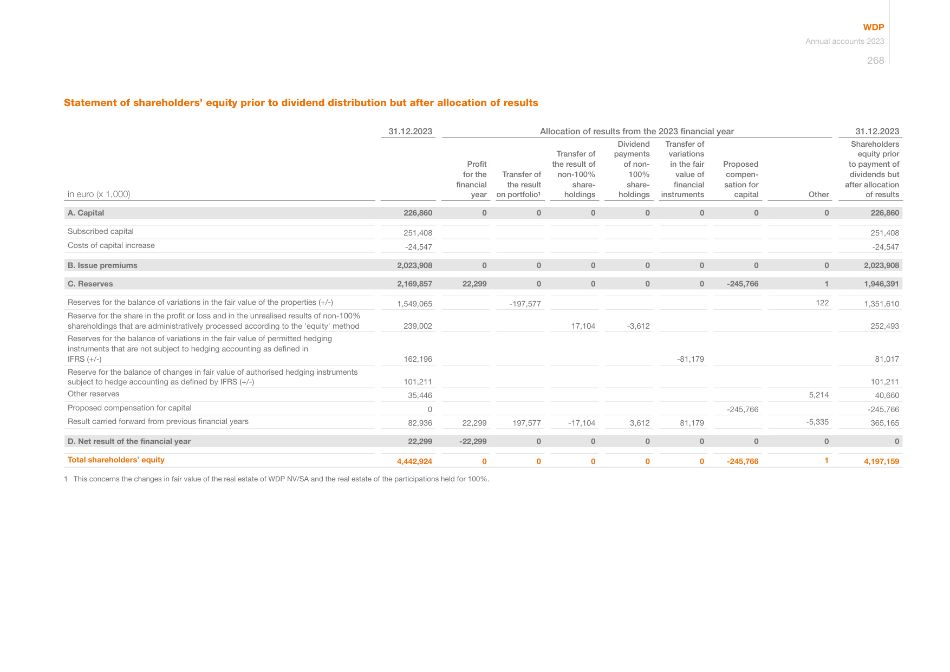
Statement of shareholders' equity prior to dividend distribution but after allocation of results 31.12.2023 Allocation of results from the 2023 financial year 31.12.2023 in euro (x 1,000) Profit for the financial year Transfer of the result on portfolio1 Transfer of the result of non-100% share- holdings Dividend payments of non- 100% share- holdings Transfer of variations in the fair value of financial instruments Proposed compen- sation for capital Other Shareholders equity prior to payment of dividends but after allocation of results A. Capital 226,860 0 0 0 0 0 0 0 226,860 Subscribed capital 251,408 251,408 Costs of capital increase -24,547 -24,547 B. Issue premiums 2,023,908 0 0 0 0 0 0 0 2,023,908 C. Reserves 2,169,857 22,299 0 0 0 0 -245,766 1 1,946,391 Reserves for the balance of variations in the fair value of the properties (+/-) 1,549,065 -197,577 122 1,351,610 Reserve for the share in the profit or loss and in the unrealised results of non-100% shareholdings that are administratively processed according to the 'equity' method 239,002 17,104 -3,612 252,493 Reserves for the balance of variations in the fair value of permitted hedging instruments that are not subject to hedging accounting as defined in IFRS (+/-) 162,196 -81,179 81,017 Reserve for the balance of changes in fair value of authorised hedging instruments subject to hedge accounting as defined by IFRS (+/-) 101,211 101,211 Other reserves 35,446 5,214 40,660 Proposed compensation for capital 0 -245,766 -245,766 Result carried forward from previous financial years 82,936 22,299 197,577 -17,104 3,612 81,179 -5,335 365,165 D. Net result of the financial year 22,299 -22,299 0 0 0 0 0 0 0 Total shareholders' equity 4,442,924 0 0 0 0 0 -245,766 1 4,197,159 1 This concerns the changes in fair value of the real estate of WDP NV/SA and the real estate of the participations held for 100%. WDP Annual accounts 2023 268
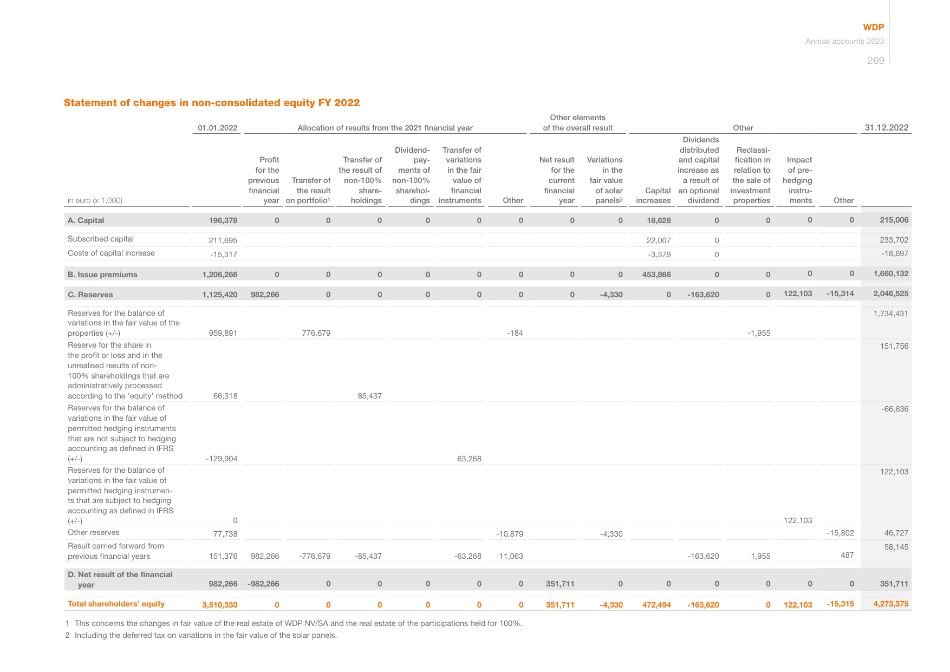
Statement of changes in non-consolidated equity FY 2022 01.01.2022 Allocation of results from the 2021 financial year Other elements of the overall result Other 31.12.2022 in euro (x 1,000) Profit for the previous financial year Transfer of the result on portfolio1 Transfer of the result of non-100% share- holdings Dividend- pay- ments of non-100% sharehol- dings Transfer of variations in the fair value of financial instruments Other Net result for the current financial year Variations in the fair value of solar panels2 Capital increases Dividends distributed and capital increase as a result of an optional dividend Reclassi- fication in relation to the sale of investment properties Impact of pre- hedging instru- ments Other A. Capital 196,378 0 0 0 0 0 0 0 0 18,628 0 0 0 0 215,006 Subscribed capital 211,695 22,007 0 233,702 Costs of capital increase -15,317 -3,379 0 -18,697 B. Issue premiums 1,206,266 0 0 0 0 0 0 0 0 453,866 0 0 0 0 1,660,132 C. Reserves 1,125,420 982,266 0 0 0 0 0 0 -4,330 0 -163,620 0 122,103 -15,314 2,046,525 Reserves for the balance of variations in the fair value of the properties (+/-) 959,891 776,679 -184 -1,955 1,734,431 Reserve for the share in the profit or loss and in the unrealised results of non- 100% shareholdings that are administratively processed according to the 'equity' method 66,318 85,437 151,756 Reserves for the balance of variations in the fair value of permitted hedging instruments that are not subject to hedging accounting as defined in IFRS (+/-) -129,904 63,268 -66,636 Reserves for the balance of variations in the fair value of permitted hedging instrumen- ts that are subject to hedging accounting as defined in IFRS (+/-) 0 122,103 122,103 Other reserves 77,738 -10,879 -4,330 -15,802 46,727 Result carried forward from previous financial years 151,376 982,266 -776,679 -85,437 -63,268 11,063 -163,620 1,955 487 58,145 D. Net result of the financial year 982,266 -982,266 0 0 0 0 0 351,711 0 0 0 0 0 0 351,711 Total shareholders' equity 3,510,330 0 0 0 0 0 0 351,711 -4,330 472,494 -163,620 0 122,103 -15,315 4,273,375 1 This concerns the changes in fair value of the real estate of WDP NV/SA and the real estate of the participations held for 100%. 2 Including the deferred tax on variations in the fair value of the solar panels. WDP Annual accounts 2023 269
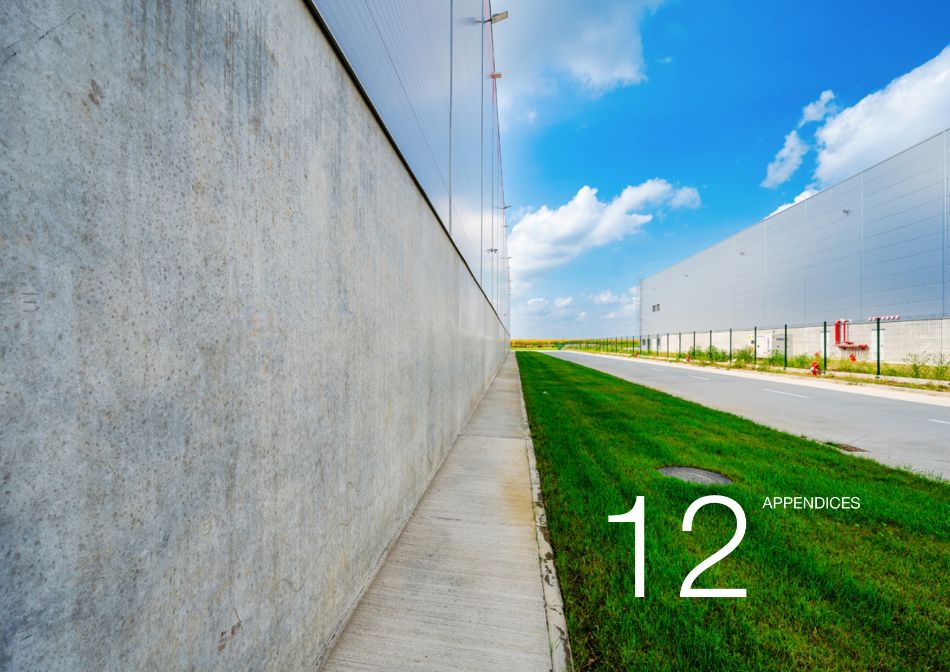
12 APPENDICES
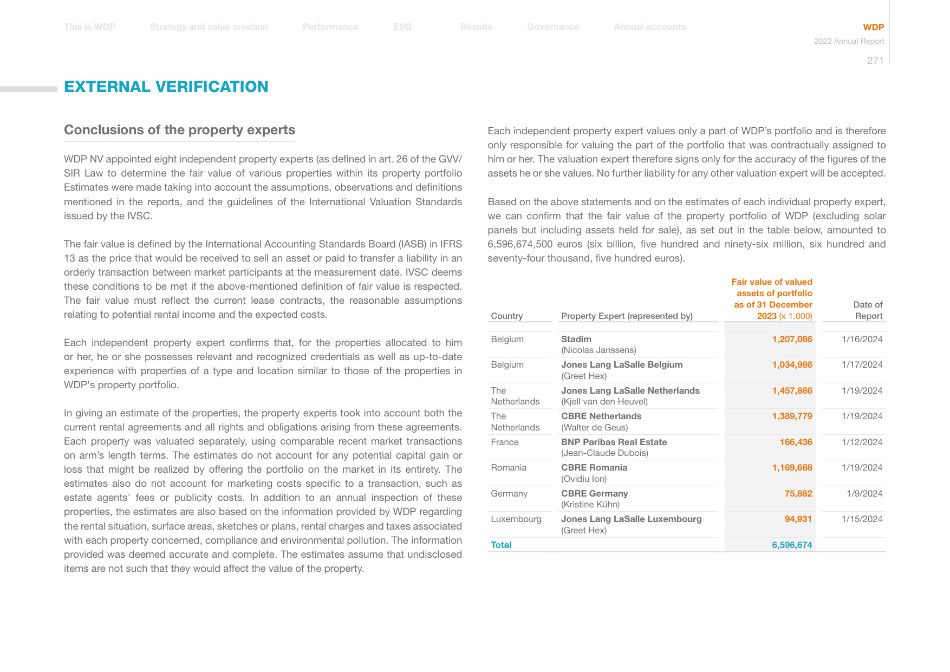
Conclusions of the property experts WDP NV appointed eight independent property experts (as defined in art. 26 of the GVV/ SIR Law to determine the fair value of various properties within its property portfolio Estimates were made taking into account the assumptions, observations and definitions mentioned in the reports, and the guidelines of the International Valuation Standards issued by the IVSC. The fair value is defined by the International Accounting Standards Board (IASB) in IFRS 13 as the price that would be received to sell an asset or paid to transfer a liability in an orderly transaction between market participants at the measurement date. IVSC deems these conditions to be met if the above-mentioned definition of fair value is respected. The fair value must reflect the current lease contracts, the reasonable assumptions relating to potential rental income and the expected costs. Each independent property expert confirms that, for the properties allocated to him or her, he or she possesses relevant and recognized credentials as well as up-to-date experience with properties of a type and location similar to those of the properties in WDP's property portfolio. In giving an estimate of the properties, the property experts took into account both the current rental agreements and all rights and obligations arising from these agreements. Each property was valuated separately, using comparable recent market transactions on arm's length terms. The estimates do not account for any potential capital gain or loss that might be realized by offering the portfolio on the market in its entirety. The estimates also do not account for marketing costs specific to a transaction, such as estate agents' fees or publicity costs. In addition to an annual inspection of these properties, the estimates are also based on the information provided by WDP regarding the rental situation, surface areas, sketches or plans, rental charges and taxes associated with each property concerned, compliance and environmental pollution. The information provided was deemed accurate and complete. The estimates assume that undisclosed items are not such that they would affect the value of the property. EXTERNAL VERIFICATION Each independent property expert values only a part of WDP's portfolio and is therefore only responsible for valuing the part of the portfolio that was contractually assigned to him or her. The valuation expert therefore signs only for the accuracy of the figures of the assets he or she values. No further liability for any other valuation expert will be accepted. Based on the above statements and on the estimates of each individual property expert, we can confirm that the fair value of the property portfolio of WDP (excluding solar panels but including assets held for sale), as set out in the table below, amounted to 6,596,674,500 euros (six billion, five hundred and ninety-six million, six hundred and seventy-four thousand, five hundred euros). Country Property Expert (represented by) Fair value of valued assets of portfolio as of 31 December 2023 (x 1,000) Date of Report Belgium Stadim (Nicolas Janssens) 1,207,086 1/16/2024 Belgium Jones Lang LaSalle Belgium (Greet Hex) 1,034,986 1/17/2024 The Netherlands Jones Lang LaSalle Netherlands (Kjell van den Heuvel) 1,457,886 1/19/2024 The Netherlands CBRE Netherlands (Walter de Geus) 1,389,779 1/19/2024 France BNP Paribas Real Estate (Jean-Claude Dubois) 166,436 1/12/2024 Romania CBRE Romania (Ovidiu Ion) 1,169,688 1/19/2024 Germany CBRE Germany (Kristine Kühn) 75,882 1/9/2024 Luxembourg Jones Lang LaSalle Luxembourg (Greet Hex) 94,931 1/15/2024 Total 6,596,674 Annual accounts Governance Results Performance Strategy and value creation This is WDP ESG WDP 2023 Annual Report 271
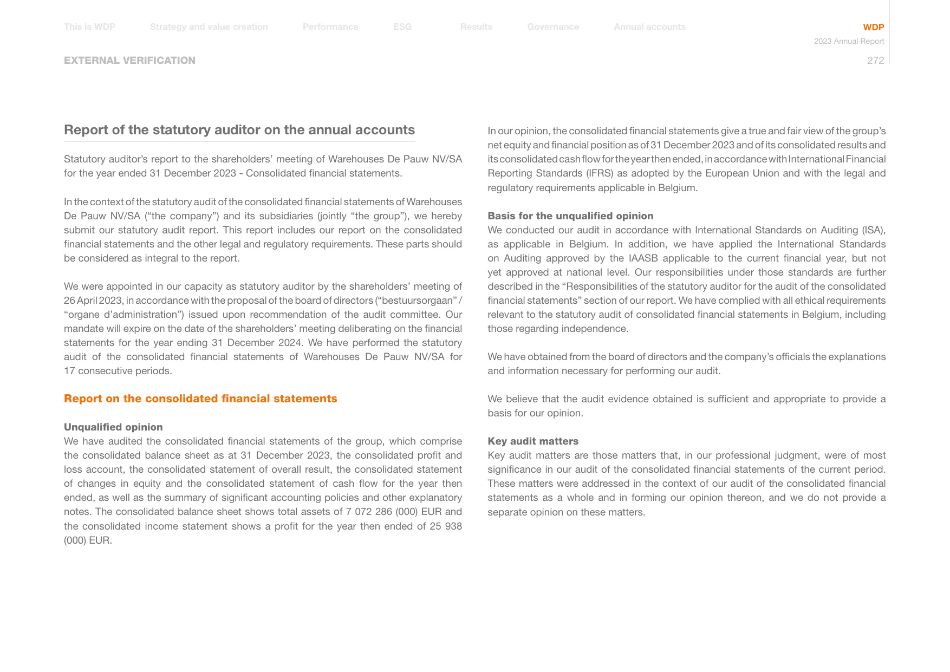
EXTERNAL VERIFICATION Report of the statutory auditor on the annual accounts Statutory auditor's report to the shareholders' meeting of Warehouses De Pauw NV/SA for the year ended 31 December 2023 - Consolidated financial statements. In the context of the statutory audit of the consolidated financial statements of Warehouses De Pauw NV/SA ("the company") and its subsidiaries (jointly "the group"), we hereby submit our statutory audit report. This report includes our report on the consolidated financial statements and the other legal and regulatory requirements. These parts should be considered as integral to the report. We were appointed in our capacity as statutory auditor by the shareholders' meeting of 26 April 2023, in accordance with the proposal of the board of directors ("bestuursorgaan" / "organe d'administration") issued upon recommendation of the audit committee. Our mandate will expire on the date of the shareholders' meeting deliberating on the financial statements for the year ending 31 December 2024. We have performed the statutory audit of the consolidated financial statements of Warehouses De Pauw NV/SA for 17 consecutive periods. Report on the consolidated financial statements Unqualified opinion We have audited the consolidated financial statements of the group, which comprise the consolidated balance sheet as at 31 December 2023, the consolidated profit and loss account, the consolidated statement of overall result, the consolidated statement of changes in equity and the consolidated statement of cash flow for the year then ended, as well as the summary of significant accounting policies and other explanatory notes. The consolidated balance sheet shows total assets of 7 072 286 (000) EUR and the consolidated income statement shows a profit for the year then ended of 25 938 (000) EUR. In our opinion, the consolidated financial statements give a true and fair view of the group's net equity and financial position as of 31 December 2023 and of its consolidated results and its consolidated cash flow for the year then ended, in accordance with International Financial Reporting Standards (IFRS) as adopted by the European Union and with the legal and regulatory requirements applicable in Belgium. Basis for the unqualified opinion We conducted our audit in accordance with International Standards on Auditing (ISA), as applicable in Belgium. In addition, we have applied the International Standards on Auditing approved by the IAASB applicable to the current financial year, but not yet approved at national level. Our responsibilities under those standards are further described in the "Responsibilities of the statutory auditor for the audit of the consolidated financial statements" section of our report. We have complied with all ethical requirements relevant to the statutory audit of consolidated financial statements in Belgium, including those regarding independence. We have obtained from the board of directors and the company's officials the explanations and information necessary for performing our audit. We believe that the audit evidence obtained is sufficient and appropriate to provide a basis for our opinion. Key audit matters Key audit matters are those matters that, in our professional judgment, were of most significance in our audit of the consolidated financial statements of the current period. These matters were addressed in the context of our audit of the consolidated financial statements as a whole and in forming our opinion thereon, and we do not provide a separate opinion on these matters. Annual accounts Governance Results Performance Strategy and value creation This is WDP ESG WDP 2023 Annual Report 272
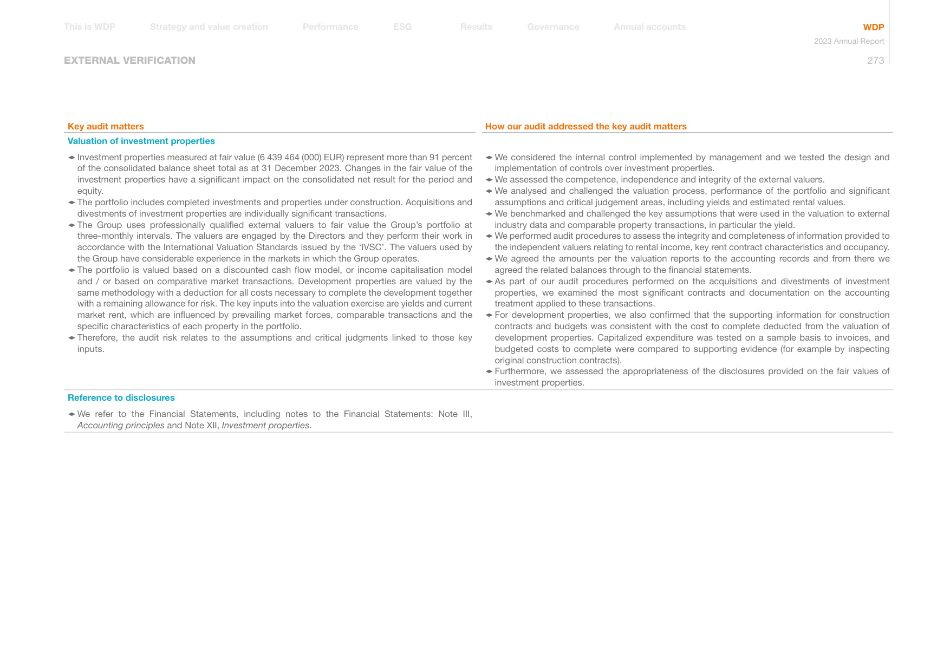
EXTERNAL VERIFICATION Key audit matters How our audit addressed the key audit matters Valuation of investment properties 1 Investment properties measured at fair value (6 439 464 (000) EUR) represent more than 91 percent of the consolidated balance sheet total as at 31 December 2023. Changes in the fair value of the investment properties have a significant impact on the consolidated net result for the period and equity. 1 The portfolio includes completed investments and properties under construction. Acquisitions and divestments of investment properties are individually significant transactions. 1 The Group uses professionally qualified external valuers to fair value the Group's portfolio at three-monthly intervals. The valuers are engaged by the Directors and they perform their work in accordance with the International Valuation Standards issued by the 'IVSC'. The valuers used by the Group have considerable experience in the markets in which the Group operates. 1 The portfolio is valued based on a discounted cash flow model, or income capitalisation model and / or based on comparative market transactions. Development properties are valued by the same methodology with a deduction for all costs necessary to complete the development together with a remaining allowance for risk. The key inputs into the valuation exercise are yields and current market rent, which are influenced by prevailing market forces, comparable transactions and the specific characteristics of each property in the portfolio. 1 Therefore, the audit risk relates to the assumptions and critical judgments linked to those key inputs. 1 We considered the internal control implemented by management and we tested the design and implementation of controls over investment properties. 1 We assessed the competence, independence and integrity of the external valuers. 1 We analysed and challenged the valuation process, performance of the portfolio and significant assumptions and critical judgement areas, including yields and estimated rental values. 1 We benchmarked and challenged the key assumptions that were used in the valuation to external industry data and comparable property transactions, in particular the yield. 1 We performed audit procedures to assess the integrity and completeness of information provided to the independent valuers relating to rental income, key rent contract characteristics and occupancy. 1 We agreed the amounts per the valuation reports to the accounting records and from there we agreed the related balances through to the financial statements. 1 As part of our audit procedures performed on the acquisitions and divestments of investment properties, we examined the most significant contracts and documentation on the accounting treatment applied to these transactions. 1 For development properties, we also confirmed that the supporting information for construction contracts and budgets was consistent with the cost to complete deducted from the valuation of development properties. Capitalized expenditure was tested on a sample basis to invoices, and budgeted costs to complete were compared to supporting evidence (for example by inspecting original construction contracts). 1 Furthermore, we assessed the appropriateness of the disclosures provided on the fair values of investment properties. Reference to disclosures 1 We refer to the Financial Statements, including notes to the Financial Statements: Note III, Accounting principles and Note XII, Investment properties. Annual accounts Governance Results Performance Strategy and value creation This is WDP ESG WDP 2023 Annual Report 273
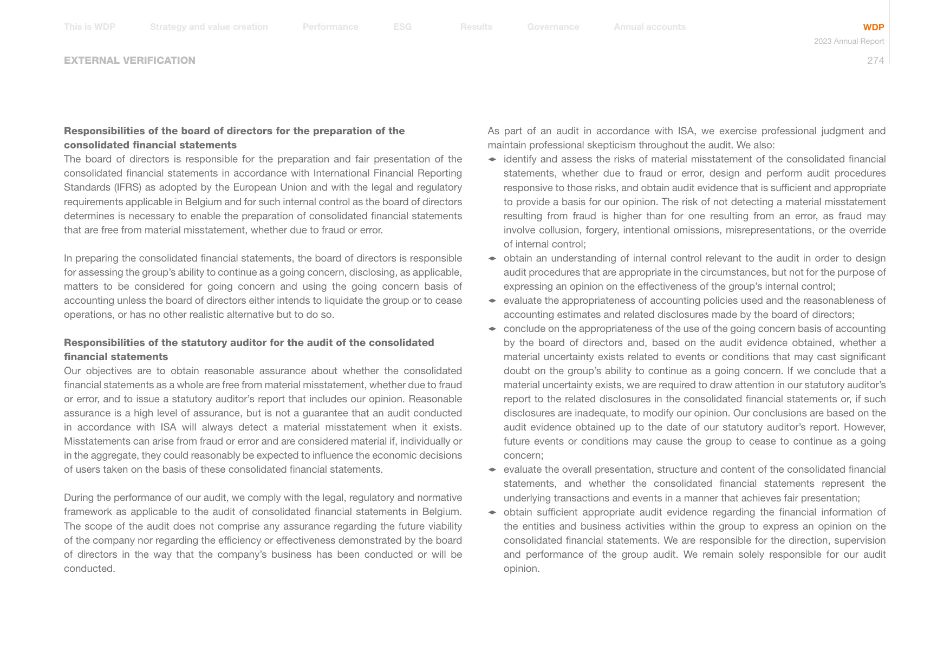
EXTERNAL VERIFICATION Responsibilities of the board of directors for the preparation of the consolidated financial statements The board of directors is responsible for the preparation and fair presentation of the consolidated financial statements in accordance with International Financial Reporting Standards (IFRS) as adopted by the European Union and with the legal and regulatory requirements applicable in Belgium and for such internal control as the board of directors determines is necessary to enable the preparation of consolidated financial statements that are free from material misstatement, whether due to fraud or error. In preparing the consolidated financial statements, the board of directors is responsible for assessing the group's ability to continue as a going concern, disclosing, as applicable, matters to be considered for going concern and using the going concern basis of accounting unless the board of directors either intends to liquidate the group or to cease operations, or has no other realistic alternative but to do so. Responsibilities of the statutory auditor for the audit of the consolidated financial statements Our objectives are to obtain reasonable assurance about whether the consolidated financial statements as a whole are free from material misstatement, whether due to fraud or error, and to issue a statutory auditor's report that includes our opinion. Reasonable assurance is a high level of assurance, but is not a guarantee that an audit conducted in accordance with ISA will always detect a material misstatement when it exists. Misstatements can arise from fraud or error and are considered material if, individually or in the aggregate, they could reasonably be expected to influence the economic decisions of users taken on the basis of these consolidated financial statements. During the performance of our audit, we comply with the legal, regulatory and normative framework as applicable to the audit of consolidated financial statements in Belgium. The scope of the audit does not comprise any assurance regarding the future viability of the company nor regarding the efficiency or effectiveness demonstrated by the board of directors in the way that the company's business has been conducted or will be conducted. As part of an audit in accordance with ISA, we exercise professional judgment and maintain professional skepticism throughout the audit. We also: 1 identify and assess the risks of material misstatement of the consolidated financial statements, whether due to fraud or error, design and perform audit procedures responsive to those risks, and obtain audit evidence that is sufficient and appropriate to provide a basis for our opinion. The risk of not detecting a material misstatement resulting from fraud is higher than for one resulting from an error, as fraud may involve collusion, forgery, intentional omissions, misrepresentations, or the override of internal control; 1 obtain an understanding of internal control relevant to the audit in order to design audit procedures that are appropriate in the circumstances, but not for the purpose of expressing an opinion on the effectiveness of the group's internal control; 1 evaluate the appropriateness of accounting policies used and the reasonableness of accounting estimates and related disclosures made by the board of directors; 1 conclude on the appropriateness of the use of the going concern basis of accounting by the board of directors and, based on the audit evidence obtained, whether a material uncertainty exists related to events or conditions that may cast significant doubt on the group's ability to continue as a going concern. If we conclude that a material uncertainty exists, we are required to draw attention in our statutory auditor's report to the related disclosures in the consolidated financial statements or, if such disclosures are inadequate, to modify our opinion. Our conclusions are based on the audit evidence obtained up to the date of our statutory auditor's report. However, future events or conditions may cause the group to cease to continue as a going concern; 1 evaluate the overall presentation, structure and content of the consolidated financial statements, and whether the consolidated financial statements represent the underlying transactions and events in a manner that achieves fair presentation; 1 obtain sufficient appropriate audit evidence regarding the financial information of the entities and business activities within the group to express an opinion on the consolidated financial statements. We are responsible for the direction, supervision and performance of the group audit. We remain solely responsible for our audit opinion. Annual accounts Governance Results Performance Strategy and value creation This is WDP ESG WDP 2023 Annual Report 274
EXTERNAL VERIFICATION We communicate with the audit committee regarding, amongst other matters, the planned scope and timing of the audit and significant audit findings, including any significant deficiencies in internal control that we identify during our audit. We also provide the audit committee with a statement that we have complied with relevant ethical requirements regarding independence, and we communicate with them about all relationships and other matters that may reasonably be thought to bear on our independence, and where applicable, related safeguards. From the matters communicated to the audit committee, we determine those matters that were of most significance in the audit of the consolidated financial statements of the current period and are therefore the key audit matters. We describe these matters in our report unless law or regulation precludes any public disclosure about the matter. Other legal and regulatory requirements Responsibilities of the board of directors The board of directors is responsible for the preparation and the content of the directors' report on the consolidated financial statements. Responsibilities of the statutory auditor As part of our mandate and in accordance with the Belgian standard complementary to the International Standards on Auditing (ISA) as applicable in Belgium, our responsibility is to verify, in all material respects, the director's report on the consolidated financial statements and other matters disclosed in the annual report on the consolidated financial statements, as well as to report on these matters. Aspects regarding the directors' report on the consolidated financial statements In our opinion, after performing the specific procedures on the directors' report on the consolidated financial statements, this report is consistent with the consolidated financial statements for that same year and has been established in accordance with the requirements of article 3:32 of the Code of companies and associations. In the context of our statutory audit of the consolidated financial statements we are responsible to consider, in particular based on information that we became aware of during the audit, if the directors' report on the consolidated financial statements and other information disclosed in the annual report on the consolidated financial statements, i.e.: 1 the required sections of Warehouses De Pauw NV's annual report in accordance with articles 3:6 and 3:32 of the Belgian Companies and Associations Code, as set out in the following sections of the annual report: 3. Strategy and value creation, 4. Performance and trends, 7. Financial results and property report, 8. Corporate Governance Statement, 9. Risk factors and 11. Financial statements. are free of material misstatements, either by information that is incorrectly stated or otherwise misleading. In the context of the procedures performed, we are not aware of such a material misstatement. Statements regarding independence 1 Our audit firm and our network have not performed any prohibited services and our audit firm has remained independent from the group during the performance of our mandate. 1 The fees for the additional non-audit services compatible with the statutory audit, as defined in article 3:65 of the Code of companies and associations, have been properly disclosed and disaggregated in the notes to the consolidated financial statements. Annual accounts Governance Results Performance Strategy and value creation This is WDP ESG WDP 2023 Annual Report 275
EXTERNAL VERIFICATION Single European Electronic Format (ESEF) In accordance with the draft standard on the audit of the compliance of the financial statements with the Single European Electronic Format ("ESEF"), we have also performed the audit of the compliance of the ESEF format and of the tagging with the technical regulatory standards as defined by the European Delegated Regulation No. 2019/815 of 17 December 2018 ("Delegated Regulation"). The board of directors is responsible for the preparation, in accordance with the ESEF requirements, of the consolidated financial statements in the form of an electronic file in ESEF format ("digital consolidated financial statements") included in the annual financial report. Our responsibility is to obtain sufficient and appropriate evidence to conclude that the format and the tagging of the digital consolidated financial statements comply, in all material respects, with the ESEF requirements as stipulated by the Delegated Regulation. Based on our work, in our opinion, the format and the tagging of information in the official language of the digital consolidated financial statements included in the annual financial report of Warehouses De Pauw NV as of 31 December 2023 are, in all material respects, prepared in accordance with the ESEF requirements as stipulated by the Delegated Regulation. Other statements 1 This report is consistent with our additional report to the audit committee referred to in article 11 of Regulation (EU) No 537/2014. Signed at Antwerp. The statutory auditor Deloitte Bedrijfsrevisoren / Réviseurs d'Entreprises BV/SRL Represented by Kathleen De Brabander Annual accounts Governance Results Performance Strategy and value creation This is WDP ESG WDP 2023 Annual Report 276
EXTERNAL VERIFICATION Report of the statutory auditor on the Profit Forecast To the board of directors of Warehouses De Pauw NV/SA Blakebergen 15 B-1861 Wolvertem Dear ladies and gentlemen We report on the forecasted EPRA earnings (as defined in August 2011 (and amended in November 2016) in the report "Best Practices Recommendations Guidelines" of the European Public Real Estate Association) of Warehouses De Pauw NV/SA ("WDP", "the Company") and its subsidiaries (together "the Group") for the 12 months period ending 31 December 2024 (the "Profit Forecast"). The Profit Forecast, and the material assumptions upon which it is based are set out in chapter 7 Financial results and property portfolio, paragraph Outlook of the 2023 annual report of the WDP Group (the "Annual Report") issued by the Company. We do not report on the other elements of the net result nor on the EPRA earnings per share, the projected dividend or the projected balance sheet. This report is voluntarily required upon request by the board of directors of the Company for the purpose to confirm the Profit Forecast has been compiled and prepared in accordance with elements (a) and (b) as defined under item 11.2 of Annex 1 of the Commission Delegated Regulation (EU) 2019/980 supplementing Regulation (EU) 2017/1129 of the European Parliament and of the Council as regards the format, content, scrutiny and approval of the prospectus to be published when securities are offered to the public or admitted to trading on a regulated market and repealing Commission Regulation (EC) No 809/2004 (the "Commission Delegated Regulation") and for no other purpose. Responsibilities It is the responsibility of the directors of the Company (the "Directors") to prepare the Profit Forecast in accordance with Annex 1 section 11 of the Commission Delegated Regulation. It is our responsibility to form an opinion as to the proper compilation of the Profit Forecast and to report that opinion to you. Save for any responsibility arising under art. 26 of the Law of 11 July 2018 to any person as and to the extent there provided, to the fullest extent permitted by law we do not assume any responsibility and will not accept any liability to any other person for any loss suffered by any such other person as a result of, arising out of, or in accordance with this report or our statement, required by and given solely for the purposes of complying with Annex 1 item 1.3 of the Commission Delated Regulation, consenting to its inclusion in the Universal Registration document. Basis of Preparation of the Profit Forecast The Profit Forecast has been prepared on the basis stated in chapter 7 Financial results and property portfolio, paragraph Outlook of the annual report and is based on a forecast for the 12 months to 31 December 2024. The Profit Forecast is required to be presented on a basis consistent with the accounting policies of the Group. Basis of opinion We conducted our work in accordance with the International Standard on Assurance Engagement 3400 "The Examination of Prospective Financial Information" ("ISAE 3400") issued by the International Auditing and Assurance Standards Board ("IAASB"). Our work included evaluating the basis on which the historical financial information included in the Profit Forecast has been prepared and considering whether the Profit Forecast has been accurately computed based upon the disclosed assumptions and the accounting policies of the Group. Whilst the assumptions upon which the Profit Forecast are based are solely the responsibility of the Directors, we considered whether anything came to Annual accounts Governance Results Performance Strategy and value creation This is WDP ESG WDP 2023 Annual Report 277
EXTERNAL VERIFICATION our attention to indicate that any of the assumptions adopted by the Directors which, in our opinion, are necessary for a proper understanding of the Profit Forecast have not been disclosed or if any material assumption made by the Directors appears to us to be unrealistic. We planned and performed our work so as to obtain the information and explanations we considered necessary in order to provide us with reasonable assurance that the Profit Forecast has been properly compiled on the basis stated. Since the Profit Forecast and the assumptions on which it is based relate to the future and may therefore be affected by unforeseen events, we can express no opinion as to whether the actual results reported will correspond to those shown in the Profit Forecast and differences may be material. Our work has not been carried out in accordance with auditing or other standards and practices generally accepted in jurisdictions outside Belgium, including the United States of America, and accordingly should not be relied upon as if it had been carried out in accordance with those standards and practices. Opinion In our opinion, the Profit Forecast has been properly compiled on the basis stated which is comparable with the historical financial information and is consistent with the accounting policies of the Group. Declaration For the purposes of art. 26 of the Law of 11 July 2018 we are responsible for this report as part of the Universal Registration document and declare that we have taken all reasonable care to ensure that the information contained in this report is, to the best of our knowledge, in accordance with the facts and contains no omission likely to affect its import. This declaration is included in the Universal Registration document in compliance with Annex 1 item 1.2 of the Commission Delegated Regulation. Signed at Antwerp. The statutory auditor Deloitte Bedrijfsrevisoren / Réviseurs d'Entreprises BV/SRL Represented by Kathleen De Brabander Annual accounts Governance Results Performance Strategy and value creation This is WDP ESG WDP 2023 Annual Report 278
EXTERNAL VERIFICATION Audit report on environmental, social and governance performance indicators Independent assurance report on selected environmental, social and governance performance indicators published in the Annual Report of Warehouses De Pauw NV for the year ended 31 December 2023. To the board of directors We have been engaged to conduct a limited assurance engagement on selected environmental, social and governance performance indicators ("Selected Information") published in the Annual Report of Warehouses De Pauw NV ("the Company") for the year ending 31 December 2023. In preparing the Selected Information, Warehouses De Pauw NV applied the Best Practices Recommendations for the European Public Real Estate Association regarding sustainability reporting (EPRA sBPR), alongside the Green Bond Principles 2021 by the International Capital Market Association (ICMA) and the Green Loan Principles 2021 by the Loan Market Association (LMA) as delineated in WDP's Green Financing Framework dated April 2022 with a set of own indicators ("Applicable Criteria") as included in chapter 10. Reporting according to recognised standards in the annual report. The Selected Information needs to be read and understood together with the Applicable Criteria. The Selected Information in scope of our engagement is identified with in Chapter 10. Reporting according to recognised standards of the Annual Report. Based on our work as described in this report, nothing has come to our attention that causes us to believe that the Selected Information identified with in Chapter 10. Reporting according to recognised standards of the Annual Report of Warehouses De Pauw NV per 31 December 2023, has not been prepared, in all material respects, in accordance with the Appliable Criteria. Responsibility of the board of directors The board of directors of Warehouses De Pauw NV is responsible for the preparation of the Selected Information and the references made to it presented in the Annual Report per 31 December 2023 as well as for the declaration that its reporting meets the requirements of the Applicable Criteria. The board of directors is also responsible for: 1 Selecting and establishing the Applicable Criteria. 1 Preparing, measuring, presenting and reporting the Selected Information in accordance with the Applicable Criteria. 1 Designing, implementing, and maintaining internal processes and controls over information relevant to the preparation of the Selected Information to ensure that they are free from material misstatement, including whether due to fraud or error. 1 Providing sufficient access and making available all necessary records, correspondence, information and explanations to allow the successful completion of the Services. 1 Confirming to us through written representations that you have provided us with all information relevant to our Services of which you are aware, and that the measurement or evaluation of the underlying subject matter against the Applicable Criteria, including that all relevant matters, are reflected in the Selected Information. Our responsibilities Our responsibility is to express a conclusion on the Selected Information based on our procedures. We conducted our engagement in accordance with International Standard on Assurance Engagements ISAE 3000 (Revised) Assurance Engagements Other than Audits or Reviews of Historical Financial Information, issued by the International Auditing and Assurance Standards Board (IAASB), in order to state whether anything had come to our attention that causes us to believe that the Selected Information has not been prepared, in all material respects, in accordance with the Applicable Criteria. Annual accounts Governance Results Performance Strategy and value creation This is WDP ESG WDP 2023 Annual Report 279
EXTERNAL VERIFICATION Applying these standards, our procedures are aimed at obtaining limited assurance on the fact that the Selected Information do not contain material misstatements. The procedures performed in a limited assurance engagement vary in nature and timing from, and are less in extent than for, a reasonable assurance engagement and consequently, the level of assurance obtained in a limited assurance engagement is substantially lower than the assurance that would have been obtained had a reasonable assurance engagement been performed. Our work was performed on the data gathered and retained in the reporting scope by Warehouses De Pauw NV as mentioned above. Our conclusion covers therefore only the Selected Information identified with in Chapter 10. Reporting according to recognised standards of the Annual Report and not all information included in the Annual Report. The limited assurance on the Selected Information was only performed on the Selected Information covering the year ending 31 December 2023. We are required to plan and perform our work to address the areas where we have identified that a material misstatement of the description of activities undertaken in respect of the Selected Information is likely to arise. The procedures we performed were based on our professional judgment. In carrying out our limited assurance engagement on the description of activities undertaken in respect of the Selected Information, we performed the following key procedures: 1 Perform analytical review procedures and consider the risks of material misstatement of the Selected Information. 1 Through inquiries of management, obtain an understanding of the Company, its environment, processes and information systems relevant to the preparation of the Selected Information sufficient to identify and assess risks of material misstatement in the Selected Information, and provide a basis for designing and performing procedures to respond to assessed risks and to obtain limited assurance to support a conclusion. 1 Perform procedures over the Selected Information, including recalculation of relevant formulae used in manual calculations and assessment whether the data has been appropriately consolidated. 1 Perform procedures over underlying data on a statistical sample basis to assess whether the data has been collected and reported in accordance with the Applicable Criteria, including verifying to source documentation. 1 Perform procedures over the Selected Information including assessing management's assumptions and estimates. 1 Accumulate misstatements and control deficiencies identified, assessing whether material. 1 Read the narrative accompanying the Selected Information with regard to the Applicable Criteria, and for consistency with our findings. We apply International Standard on Quality Management 1 and, accordingly, maintain a comprehensive system of quality control including documented policies and procedures regarding compliance with ethical requirements, professional standards and applicable legal and regulatory requirements. In conducting our engagement, we have complied with the independence and other ethical requirements of the Code of Ethics for Professional Accountants issued by the International Ethics Standards Board for Accountants (IESBA), which is founded on fundamental principles of integrity, objectivity, professional competence and due care, confidentiality and professional behaviour. This includes the verification that there are no conflicts of interest with this assurance engagement. Inherent limitations of the Selected Information We obtained limited assurance over the preparation of the Selected Information in accordance with the Applicable Criteria. Inherent limitations exist in all assurance engagements. Any internal control structure, no matter how effective, cannot eliminate the possibility that fraud, errors or irregularities may occur and remain undetected and because we use selective testing in our engagement, we cannot guarantee that errors or irregularities, if present, will be detected. Annual accounts Governance Results Performance Strategy and value creation This is WDP ESG WDP 2023 Annual Report 280
EXTERNAL VERIFICATION The self-defined Applicable Criteria, the nature of the Selected Information, and absence of consistent external standards allow for different, but acceptable, measurements to be adopted which may result in variances between entities. The adopted measurement methodologies may also impact comparability of the Selected Information reported by different organizations and from year to year within an organization as methodologies develop. Use of our report This report is made solely to the board of directors of Warehouses De Pauw NV in accordance with ISAE 3000 (Revised) and our agreed terms of engagement. Our work has been undertaken so that we might state to the board of directors those matters we have agreed to state to them in this report and for no other purpose. Without assuming or accepting any responsibility or liability in respect of this report to any party other than the Company and its board of directors, we acknowledge that the board of directors may choose to make this report publicly available for others wishing to have access to it, which does not and will not affect or extend for any purpose or on any basis our responsibilities. To the fullest extent permitted by law, we do not accept or assume responsibility to anyone other than Warehouses De Pauw NV and its board of directors as a body, for our work, for this report, or for the conclusions we have formed. Signed at Zaventem. Deloitte Bedrijfsrevisoren BV Represented by Sofian Milad Annual accounts Governance Results Performance Strategy and value creation This is WDP ESG WDP 2023 Annual Report 281
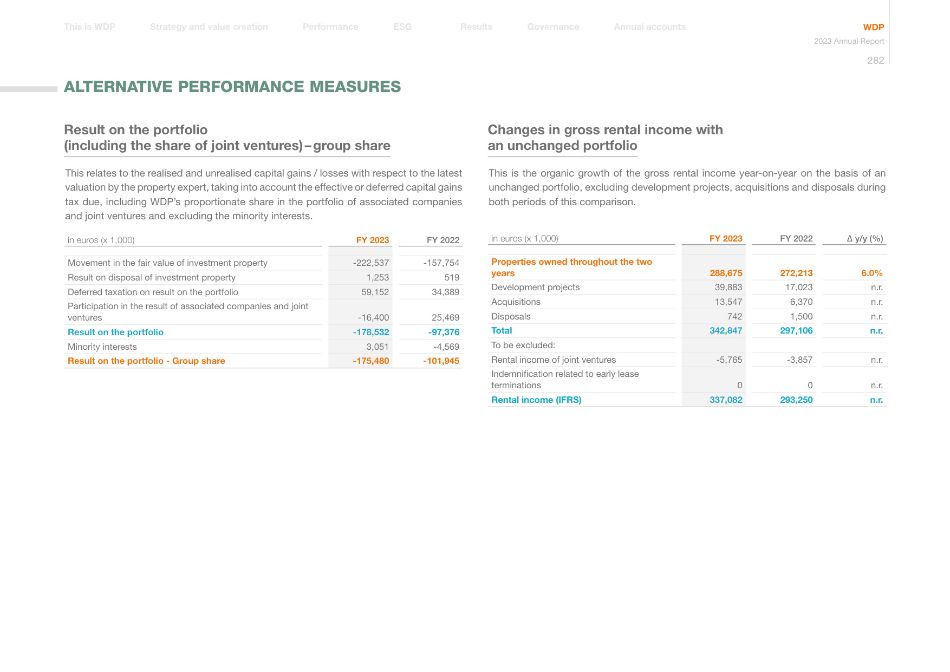
Result on the portfolio (including the share of joint ventures) – group share This relates to the realised and unrealised capital gains / losses with respect to the latest valuation by the property expert, taking into account the effective or deferred capital gains tax due, including WDP's proportionate share in the portfolio of associated companies and joint ventures and excluding the minority interests. in euros (x 1,000) FY 2023 FY 2022 Movement in the fair value of investment property -222,537 -157,754 Result on disposal of investment property 1,253 519 Deferred taxation on result on the portfolio 59,152 34,389 Participation in the result of associated companies and joint ventures -16,400 25,469 Result on the portfolio -178,532 -97,376 Minority interests 3,051 -4,569 Result on the portfolio - Group share -175,480 -101,945 Changes in gross rental income with an unchanged portfolio This is the organic growth of the gross rental income year-on-year on the basis of an unchanged portfolio, excluding development projects, acquisitions and disposals during both periods of this comparison. in euros (x 1,000) FY 2023 FY 2022 ∆ y/y (%) Properties owned throughout the two years 288,675 272,213 6.0% Development projects 39,883 17,023 n.r. Acquisitions 13,547 6,370 n.r. Disposals 742 1,500 n.r. Total 342,847 297,106 n.r. To be excluded: Rental income of joint ventures -5,765 -3,857 n.r. Indemnification related to early lease terminations 0 0 n.r. Rental income (IFRS) 337,082 293,250 n.r. Annual accounts Governance Results Performance Strategy and value creation This is WDP ESG WDP 2023 Annual Report 282 ALTERNATIVE PERFORMANCE MEASURES
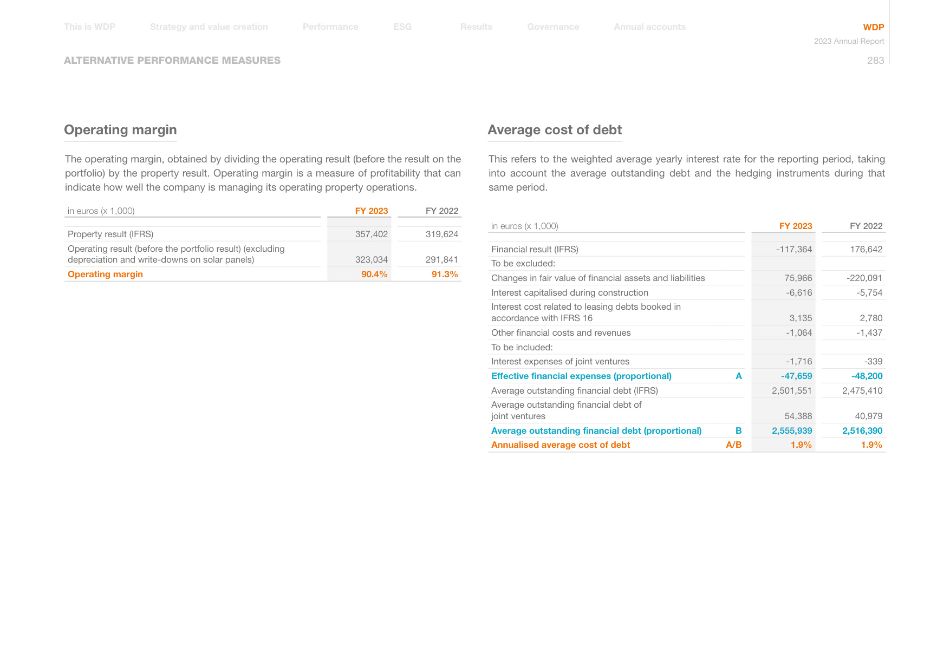
ALTERNATIVE PERFORMANCE MEASURES Operating margin The operating margin, obtained by dividing the operating result (before the result on the portfolio) by the property result. Operating margin is a measure of profitability that can indicate how well the company is managing its operating property operations. in euros (x 1,000) FY 2023 FY 2022 Property result (IFRS) 357,402 319,624 Operating result (before the portfolio result) (excluding depreciation and write-downs on solar panels) 323,034 291,841 Operating margin 90.4% 91.3% Average cost of debt This refers to the weighted average yearly interest rate for the reporting period, taking into account the average outstanding debt and the hedging instruments during that same period. in euros (x 1,000) FY 2023 FY 2022 Financial result (IFRS) -117,364 176,642 To be excluded: Changes in fair value of financial assets and liabilities 75,966 -220,091 Interest capitalised during construction -6,616 -5,754 Interest cost related to leasing debts booked in accordance with IFRS 16 3,135 2,780 Other financial costs and revenues -1,064 -1,437 To be included: Interest expenses of joint ventures -1,716 -339 Effective financial expenses (proportional) A -47,659 -48,200 Average outstanding financial debt (IFRS) 2,501,551 2,475,410 Average outstanding financial debt of joint ventures 54,388 40,979 Average outstanding financial debt (proportional) B 2,555,939 2,516,390 Annualised average cost of debt A/B 1.9% 1.9% Annual accounts Governance Results Performance Strategy and value creation This is WDP ESG WDP 2023 Annual Report 283
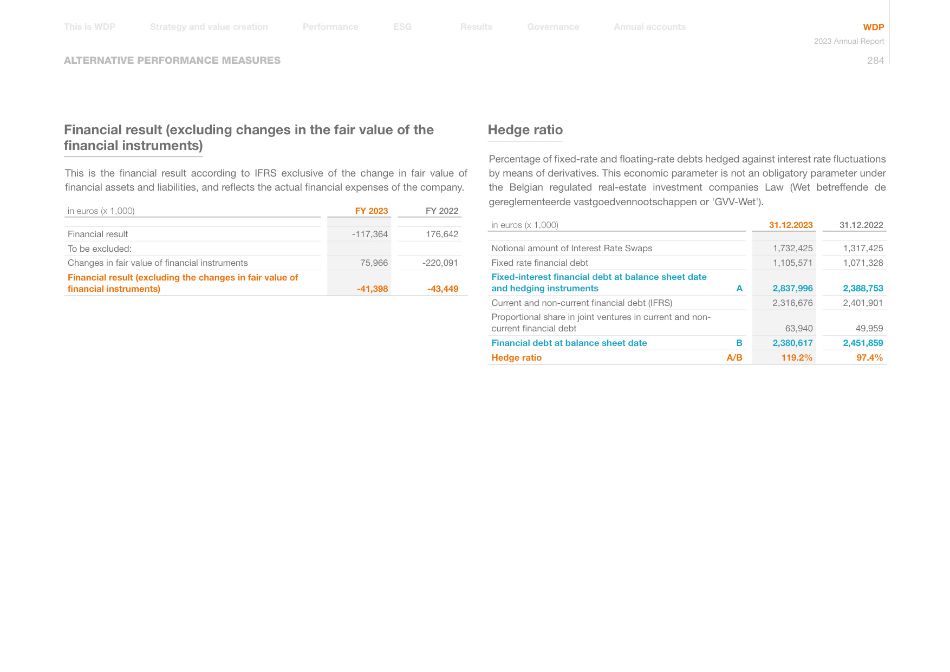
ALTERNATIVE PERFORMANCE MEASURES Financial result (excluding changes in the fair value of the financial instruments) This is the financial result according to IFRS exclusive of the change in fair value of financial assets and liabilities, and reflects the actual financial expenses of the company. in euros (x 1,000) FY 2023 FY 2022 Financial result -117,364 176,642 To be excluded: Changes in fair value of financial instruments 75,966 -220,091 Financial result (excluding the changes in fair value of financial instruments) -41,398 -43,449 Hedge ratio Percentage of fixed-rate and floating-rate debts hedged against interest rate fluctuations by means of derivatives. This economic parameter is not an obligatory parameter under the Belgian regulated real-estate investment companies Law (Wet betreffende de gereglementeerde vastgoedvennootschappen or 'GVV-Wet'). in euros (x 1,000) 31.12.2023 31.12.2022 Notional amount of Interest Rate Swaps 1,732,425 1,317,425 Fixed rate financial debt 1,105,571 1,071,328 Fixed-interest financial debt at balance sheet date and hedging instruments A 2,837,996 2,388,753 Current and non-current financial debt (IFRS) 2,316,676 2,401,901 Proportional share in joint ventures in current and non- current financial debt 63,940 49,959 Financial debt at balance sheet date B 2,380,617 2,451,859 Hedge ratio A/B 119.2% 97.4% Annual accounts Governance Results Performance Strategy and value creation This is WDP ESG WDP 2023 Annual Report 284
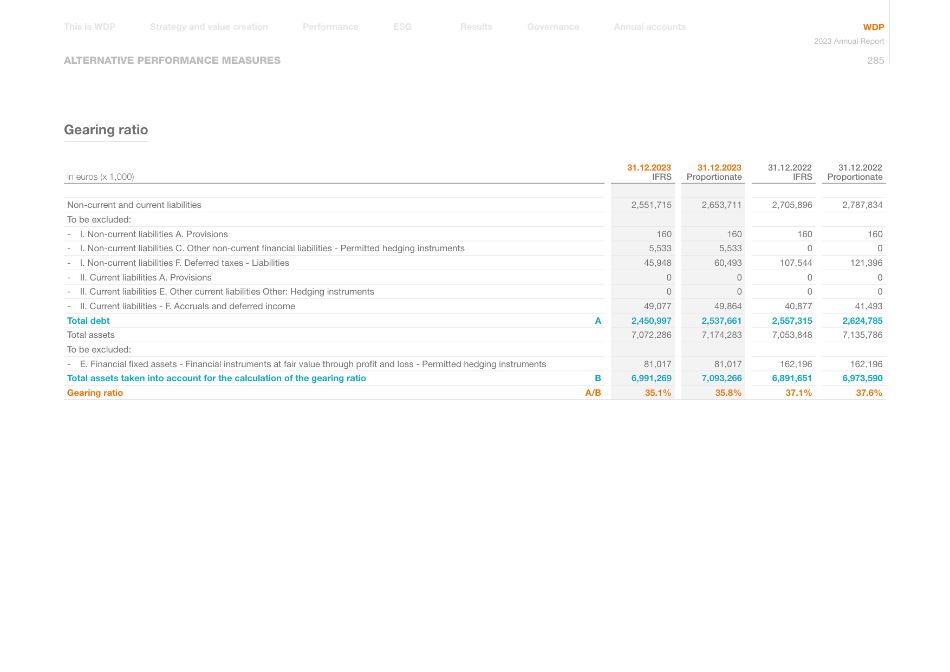
ALTERNATIVE PERFORMANCE MEASURES Gearing ratio in euros (x 1,000) 31.12.2023 31.12.2023 31.12.2022 31.12.2022 IFRS Proportionate IFRS Proportionate Non-current and current liabilities 2,551,715 2,653,711 2,705,896 2,787,834 To be excluded: - I. Non-current liabilities A. Provisions 160 160 160 160 - I. Non-current liabilities C. Other non-current financial liabilities - Permitted hedging instruments 5,533 5,533 0 0 - I. Non-current liabilities F. Deferred taxes - Liabilities 45,948 60,493 107,544 121,396 - II. Current liabilities A. Provisions 0 0 0 0 - II. Current liabilities E. Other current liabilities Other: Hedging instruments 0 0 0 0 - II. Current liabilities - F. Accruals and deferred income 49,077 49,864 40,877 41,493 Total debt A 2,450,997 2,537,661 2,557,315 2,624,785 Total assets 7,072,286 7,174,283 7,053,848 7,135,786 To be excluded: - E. Financial fixed assets - Financial instruments at fair value through profit and loss - Permitted hedging instruments 81,017 81,017 162,196 162,196 Total assets taken into account for the calculation of the gearing ratio B 6,991,269 7,093,266 6,891,651 6,973,590 Gearing ratio A/B 35.1% 35.8% 37.1% 37.6% Annual accounts Governance Results Performance Strategy and value creation This is WDP ESG WDP 2023 Annual Report 285
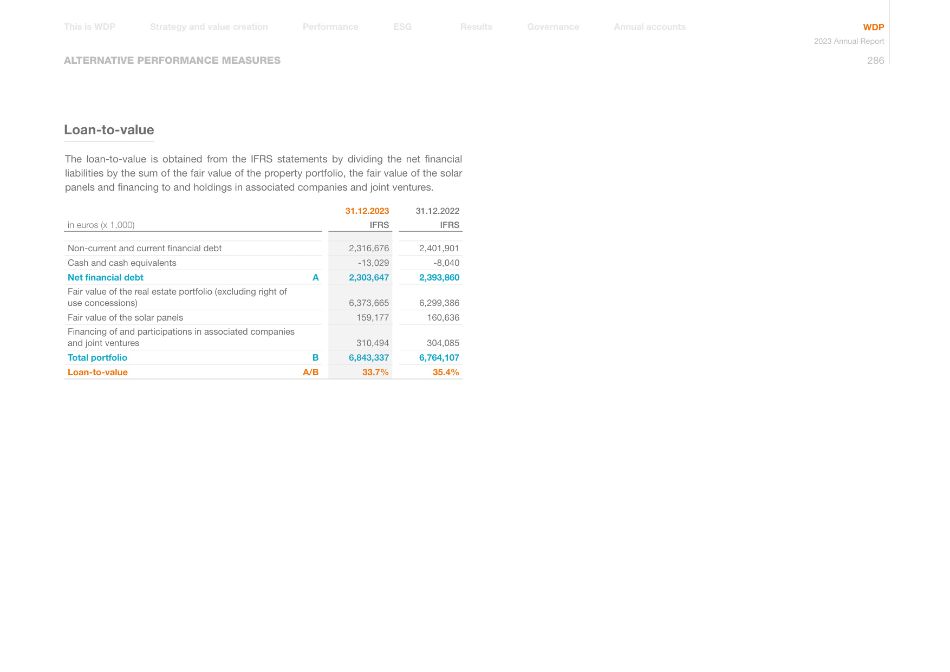
ALTERNATIVE PERFORMANCE MEASURES Loan-to-value The loan-to-value is obtained from the IFRS statements by dividing the net financial liabilities by the sum of the fair value of the property portfolio, the fair value of the solar panels and financing to and holdings in associated companies and joint ventures. in euros (x 1,000) 31.12.2023 IFRS 31.12.2022 IFRS Non-current and current financial debt 2,316,676 2,401,901 Cash and cash equivalents -13,029 -8,040 Net financial debt A 2,303,647 2,393,860 Fair value of the real estate portfolio (excluding right of use concessions) 6,373,665 6,299,386 Fair value of the solar panels 159,177 160,636 Financing of and participations in associated companies and joint ventures 310,494 304,085 Total portfolio B 6,843,337 6,764,107 Loan-to-value A/B 33.7% 35.4% Annual accounts Governance Results Performance Strategy and value creation This is WDP ESG WDP 2023 Annual Report 286
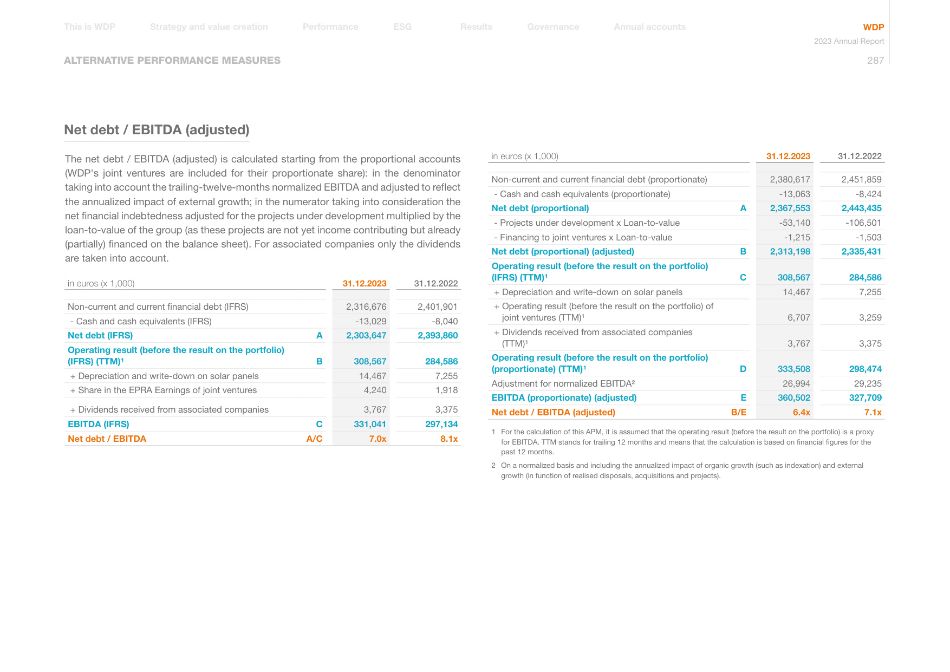
ALTERNATIVE PERFORMANCE MEASURES Net debt / EBITDA (adjusted) The net debt / EBITDA (adjusted) is calculated starting from the proportional accounts (WDP's joint ventures are included for their proportionate share): in the denominator taking into account the trailing-twelve-months normalized EBITDA and adjusted to reflect the annualized impact of external growth; in the numerator taking into consideration the net financial indebtedness adjusted for the projects under development multiplied by the loan-to-value of the group (as these projects are not yet income contributing but already (partially) financed on the balance sheet). For associated companies only the dividends are taken into account. in euros (x 1,000) 31.12.2023 31.12.2022 Non-current and current financial debt (IFRS) 2,316,676 2,401,901 - Cash and cash equivalents (IFRS) -13,029 -8,040 Net debt (IFRS) A 2,303,647 2,393,860 Operating result (before the result on the portfolio) (IFRS) (TTM)¹ B 308,567 284,586 + Depreciation and write-down on solar panels 14,467 7,255 + Share in the EPRA Earnings of joint ventures 4,240 1,918 + Dividends received from associated companies 3,767 3,375 EBITDA (IFRS) C 331,041 297,134 Net debt / EBITDA A/C 7.0x 8.1x in euros (x 1,000) 31.12.2023 31.12.2022 Non-current and current financial debt (proportionate) 2,380,617 2,451,859 - Cash and cash equivalents (proportionate) -13,063 -8,424 Net debt (proportional) A 2,367,553 2,443,435 - Projects under development x Loan-to-value -53,140 -106,501 - Financing to joint ventures x Loan-to-value -1,215 -1,503 Net debt (proportional) (adjusted) B 2,313,198 2,335,431 Operating result (before the result on the portfolio) (IFRS) (TTM)¹ C 308,567 284,586 + Depreciation and write-down on solar panels 14,467 7,255 + Operating result (before the result on the portfolio) of joint ventures (TTM)¹ 6,707 3,259 + Dividends received from associated companies (TTM)¹ 3,767 3,375 Operating result (before the result on the portfolio) (proportionate) (TTM)¹ D 333,508 298,474 Adjustment for normalized EBITDA² 26,994 29,235 EBITDA (proportionate) (adjusted) E 360,502 327,709 Net debt / EBITDA (adjusted) B/E 6.4x 7.1x 1 For the calculation of this APM, it is assumed that the operating result (before the result on the portfolio) is a proxy for EBITDA. TTM stands for trailing 12 months and means that the calculation is based on financial figures for the past 12 months. 2 On a normalized basis and including the annualized impact of organic growth (such as indexation) and external growth (in function of realised disposals, acquisitions and projects). Annual accounts Governance Results Performance Strategy and value creation This is WDP ESG WDP 2023 Annual Report 287
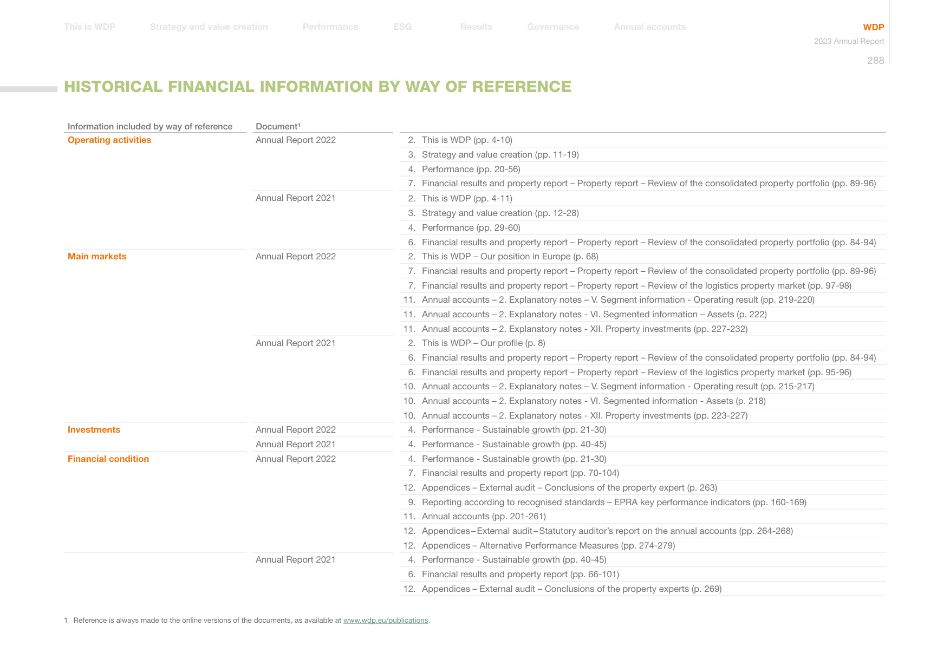
Information included by way of reference Document1 Operating activities Annual Report 2022 2. This is WDP (pp. 4-10) 3. Strategy and value creation (pp. 11-19) 4. Performance (pp. 20-56) 7. Financial results and property report – Property report – Review of the consolidated property portfolio (pp. 89-96) Annual Report 2021 2. This is WDP (pp. 4-11) 3. Strategy and value creation (pp. 12-28) 4. Performance (pp. 29-60) 6. Financial results and property report – Property report – Review of the consolidated property portfolio (pp. 84-94) Main markets Annual Report 2022 2. This is WDP – Our position in Europe (p. 68) 7. Financial results and property report – Property report – Review of the consolidated property portfolio (pp. 89-96) 7. Financial results and property report – Property report – Review of the logistics property market (pp. 97-98) 11. Annual accounts – 2. Explanatory notes – V. Segment information - Operating result (pp. 219-220) 11. Annual accounts – 2. Explanatory notes - VI. Segmented information – Assets (p. 222) 11. Annual accounts – 2. Explanatory notes - XII. Property investments (pp. 227-232) Annual Report 2021 2. This is WDP – Our profile (p. 8) 6. Financial results and property report – Property report – Review of the consolidated property portfolio (pp. 84-94) 6. Financial results and property report – Property report – Review of the logistics property market (pp. 95-96) 10. Annual accounts – 2. Explanatory notes – V. Segment information - Operating result (pp. 215-217) 10. Annual accounts – 2. Explanatory notes - VI. Segmented information - Assets (p. 218) 10. Annual accounts – 2. Explanatory notes - XII. Property investments (pp. 223-227) Investments Annual Report 2022 4. Performance - Sustainable growth (pp. 21-30) Annual Report 2021 4. Performance - Sustainable growth (pp. 40-45) Financial condition Annual Report 2022 4. Performance - Sustainable growth (pp. 21-30) 7. Financial results and property report (pp. 70-104) 12. Appendices – External audit – Conclusions of the property expert (p. 263) 9. Reporting according to recognised standards – EPRA key performance indicators (pp. 160-169) 11. Annual accounts (pp. 201-261) 12. Appendices – External audit – Statutory auditor's report on the annual accounts (pp. 264-268) 12. Appendices – Alternative Performance Measures (pp. 274-279) Annual Report 2021 4. Performance - Sustainable growth (pp. 40-45) 6. Financial results and property report (pp. 66-101) 12. Appendices – External audit – Conclusions of the property experts (p. 269) 1 Reference is always made to the online versions of the documents, as available at www.wdp.eu/publications. Annual accounts Governance Results Performance Strategy and value creation This is WDP ESG WDP 2023 Annual Report 288 HISTORICAL FINANCIAL INFORMATION BY WAY OF REFERENCE
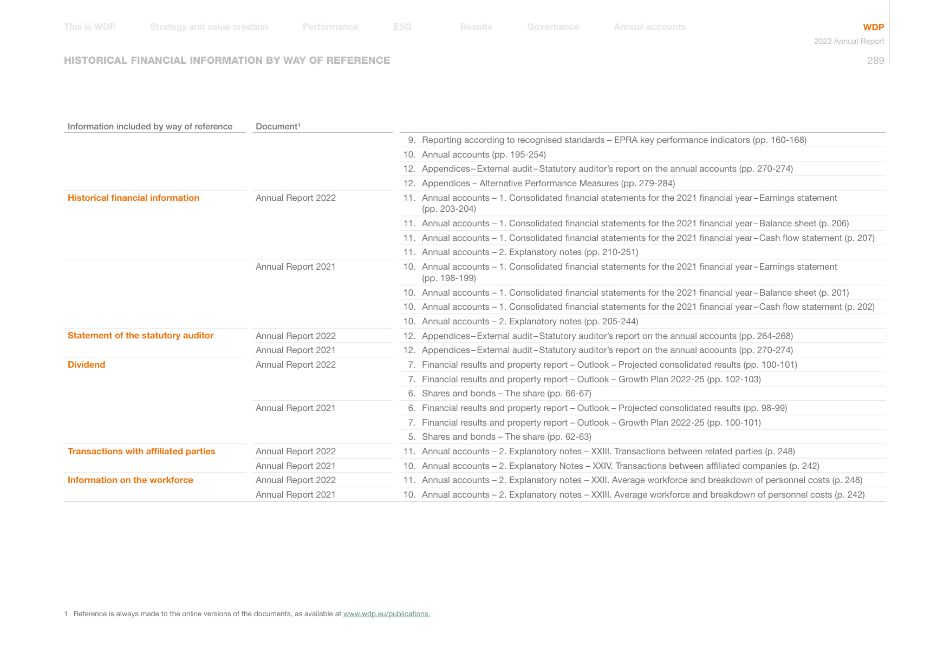
HISTORICAL FINANCIAL INFORMATION BY WAY OF REFERENCE Information included by way of reference Document1 9. Reporting according to recognised standards – EPRA key performance indicators (pp. 160-168) 10. Annual accounts (pp. 195-254) 12. Appendices – External audit – Statutory auditor's report on the annual accounts (pp. 270-274) 12. Appendices – Alternative Performance Measures (pp. 279-284) Historical financial information Annual Report 2022 11. Annual accounts – 1. Consolidated financial statements for the 2021 financial year – Earnings statement (pp. 203-204) 11. Annual accounts – 1. Consolidated financial statements for the 2021 financial year – Balance sheet (p. 206) 11. Annual accounts – 1. Consolidated financial statements for the 2021 financial year – Cash flow statement (p. 207) 11. Annual accounts – 2. Explanatory notes (pp. 210-251) Annual Report 2021 10. Annual accounts – 1. Consolidated financial statements for the 2021 financial year – Earnings statement (pp. 198-199) 10. Annual accounts – 1. Consolidated financial statements for the 2021 financial year – Balance sheet (p. 201) 10. Annual accounts – 1. Consolidated financial statements for the 2021 financial year – Cash flow statement (p. 202) 10. Annual accounts – 2. Explanatory notes (pp. 205-244) Statement of the statutory auditor Annual Report 2022 12. Appendices – External audit – Statutory auditor's report on the annual accounts (pp. 264-268) Annual Report 2021 12. Appendices – External audit – Statutory auditor's report on the annual accounts (pp. 270-274) Dividend Annual Report 2022 7. Financial results and property report – Outlook – Projected consolidated results (pp. 100-101) 7. Financial results and property report – Outlook – Growth Plan 2022-25 (pp. 102-103) 6. Shares and bonds – The share (pp. 66-67) Annual Report 2021 6. Financial results and property report – Outlook – Projected consolidated results (pp. 98-99) 7. Financial results and property report – Outlook – Growth Plan 2022-25 (pp. 100-101) 5. Shares and bonds – The share (pp. 62-63) Transactions with affiliated parties Annual Report 2022 11. Annual accounts – 2. Explanatory notes – XXIII. Transactions between related parties (p. 248) Annual Report 2021 10. Annual accounts – 2. Explanatory Notes – XXIV. Transactions between affiliated companies (p. 242) Information on the workforce Annual Report 2022 11. Annual accounts – 2. Explanatory notes – XXII. Average workforce and breakdown of personnel costs (p. 248) Annual Report 2021 10. Annual accounts – 2. Explanatory notes – XXIII. Average workforce and breakdown of personnel costs (p. 242) 1 Reference is always made to the online versions of the documents, as available at www.wdp.eu/publications. Annual accounts Governance Results Performance Strategy and value creation This is WDP ESG WDP 2023 Annual Report 289
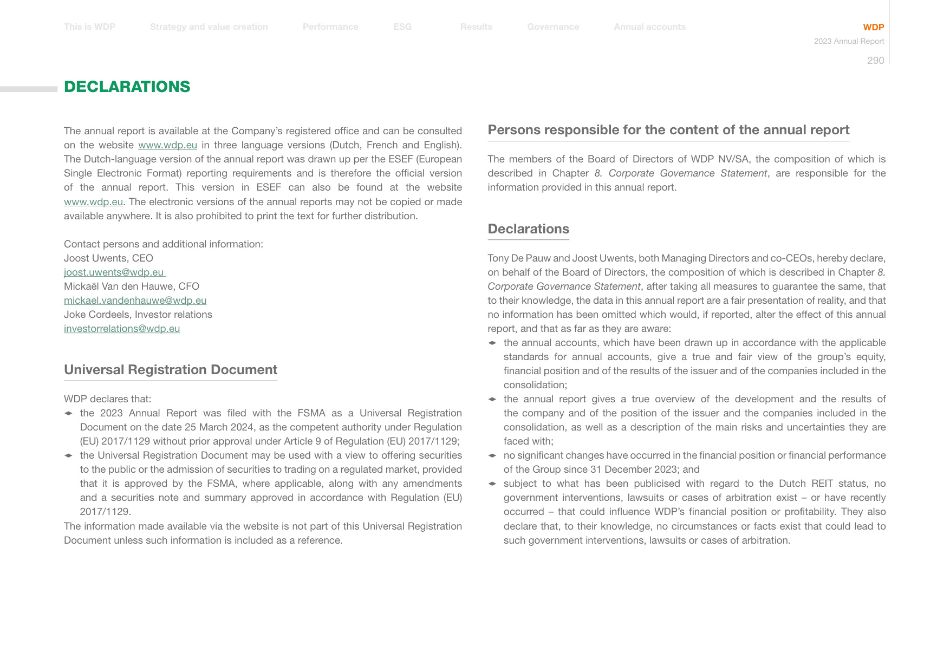
The annual report is available at the Company's registered office and can be consulted on the website www.wdp.eu in three language versions (Dutch, French and English). The Dutch-language version of the annual report was drawn up per the ESEF (European Single Electronic Format) reporting requirements and is therefore the official version of the annual report. This version in ESEF can also be found at the website www.wdp.eu. The electronic versions of the annual reports may not be copied or made available anywhere. It is also prohibited to print the text for further distribution. Contact persons and additional information: Joost Uwents, CEO joost.uwents@wdp.eu Mickaël Van den Hauwe, CFO mickael.vandenhauwe@wdp.eu Joke Cordeels, Investor relations investorrelations@wdp.eu Universal Registration Document WDP declares that: 1 the 2023 Annual Report was filed with the FSMA as a Universal Registration Document on the date 25 March 2024, as the competent authority under Regulation (EU) 2017/1129 without prior approval under Article 9 of Regulation (EU) 2017/1129; 1 the Universal Registration Document may be used with a view to offering securities to the public or the admission of securities to trading on a regulated market, provided that it is approved by the FSMA, where applicable, along with any amendments and a securities note and summary approved in accordance with Regulation (EU) 2017/1129. The information made available via the website is not part of this Universal Registration Document unless such information is included as a reference. Persons responsible for the content of the annual report The members of the Board of Directors of WDP NV/SA, the composition of which is described in Chapter 8. Corporate Governance Statement, are responsible for the information provided in this annual report. Declarations Tony De Pauw and Joost Uwents, both Managing Directors and co-CEOs, hereby declare, on behalf of the Board of Directors, the composition of which is described in Chapter 8. Corporate Governance Statement, after taking all measures to guarantee the same, that to their knowledge, the data in this annual report are a fair presentation of reality, and that no information has been omitted which would, if reported, alter the effect of this annual report, and that as far as they are aware: 1 the annual accounts, which have been drawn up in accordance with the applicable standards for annual accounts, give a true and fair view of the group's equity, financial position and of the results of the issuer and of the companies included in the consolidation; 1 the annual report gives a true overview of the development and the results of the company and of the position of the issuer and the companies included in the consolidation, as well as a description of the main risks and uncertainties they are faced with; 1 no significant changes have occurred in the financial position or financial performance of the Group since 31 December 2023; and 1 subject to what has been publicised with regard to the Dutch REIT status, no government interventions, lawsuits or cases of arbitration exist – or have recently occurred – that could influence WDP's financial position or profitability. They also declare that, to their knowledge, no circumstances or facts exist that could lead to such government interventions, lawsuits or cases of arbitration. DECLARATIONS Annual accounts Governance Results Performance Strategy and value creation This is WDP ESG WDP 2023 Annual Report 290
DECLARATIONS Available documents WDP hereby declares that, at least during the period of validity of the Universal Registration Document, the following documents are available for viewing on its website at www.wdp.eu: 1 the latest deed of incorporation and Articles of Association of WDP; 1 the annual reports; 1 the reports, and respectively, the conclusions of the statutory auditor and the property experts; 1 press releases and mandatory financial information. The company's financial reporting is published in the financial press where required by law; 1 the Corporate Governance Charter; 1 The obligations of the Company and the rights of the shareholders with regard to the General Meeting are published on the Investors section of WDP's website from the meeting notice until participation and voting in full. This information remains available on the Company website for a period of at least five years starting from the date of the General Meeting to which it pertains. In accordance with the relevant provisions of the law, the separate and consolidated financial statements of the Company are deposited with the National Bank of Belgium. Decisions related to the appointment and dismissal of members of the Board of Directors are published in the Annexes to the Belgian Official Journal. Information from third parties WDP declares that the information provided by the property experts and the statutory auditor has been faithfully reproduced. To WDP's knowledge, and based on what it has been able to deduce from the information published by the property experts and the statutory auditor, no facts were omitted that would render the information provided by the property experts or the statutory auditor incorrect or misleading. WDP also confirms that the statutory auditor and property experts have given their approval for the content of their report and conclusions respectively to be included in the annual report. For confidentiality reasons, the full report of the property experts has not been included and cannot be consulted. Required components of the annual report In accordance with Articles 3:6 and 3:32 of the Belgian Code of Companies and Associations, the required components of the WDP annual report appear in the following chapters: 1 7. Financial results and property report; 1 8. Corporate Governance Statement; 1 9. Risk factors; and 1 11. Annual accounts. This annual report provides an overview of the activities and financial statements for the financial year ending on 31 December 2023. Annual accounts Governance Results Performance Strategy and value creation This is WDP ESG WDP 2023 Annual Report 291
Basic information Company name (Article 1 of the coordinated Articles of Association) Warehouses De Pauw, or WDP for short. Place of registration, company number, identification code for legal entities The Company is registered in the Crossroads Bank for Enterprises, in the district of Brussels, Dutch language division, under the legal entity registration number 0417.199.869. Its identification code for legal entities (LEI – legal entity identifier) is 549300HWDYC5JXC85138. Legal form, incorporation1 The Company was founded as a public limited company ('NV'/'SA') under the name Rederij De Pauw by a deed executed before civil-law notary Paul De Ruyver in Liedekerke on 27 May 1977, published in the Annexes to the Belgian Official Journal on 21 June 1977 under number 2249-1. By means of a general merger and demerger operation, this NV became the holding company bringing together the property portfolios of nine companies. At the same time, the name of the Company was changed to Warehousing & Distribution De Pauw and was converted into a partnership limited by shares under Belgian law (Comm. VA). The associated amendments to the Articles of Association were provisionally enacted by a deed executed by civil-law-notary Siegfried Defrancq in Asse-Zellik, acting as substitute for civil-law-notary Jean-Jacques Boel in Asse due to his statutory incapacity, on 20 May 1999, subsequently published in the annexes to the Belgian Official Journal on 16 June under number 990616-21, and endorsed in two deeds dated 28 June 1999 by the same civil-law notary, subsequently published in the annexes to the Belgian Official Journal on 20 July under numbers 990720-757 and 758. The company name was changed during the Extraordinary General Meeting of 25 April 2001 into Warehouses De Pauw, as set out in the deed executed by the 1 See also chapter 2. This is WDP on p. 4. aforementioned notary Siegfried Defrancq, replacing the aforementioned notary Jean-Jacques Boel, due to his statutory incapacity, published in the annexes to the Belgian Official Journal on 18 May 2001 under number 20010518-652. At the Extraordinary General Meeting of 11 September 2019, the legal form of WDP was changed to a public limited company ('naamloze vennootschap') effective as of 1 October 2019, as established in the deed executed before civil-law-notary Tim Carnewal, published in the annexes to the Belgian Official Journal of the following 25 September 2019, under number 19127672. At the Extraordinary General Meeting on 11 September 2019, it was decided to split the share by a factor of 7. This declaration deed was executed before Civil-Law Notary Eric Spruyt in Brussels and was published in the Annexes to the Belgian Official Journal on 5 February 2020 under number 20020249. The WDP articles of association were last amended on 4 December 2023 by means of a deed executed by a civil notary Tim Carnewal in Brussels, following the decision to amend the articles of association. This deed was published in the Annexes to the Belgian Official Journal of 14 December 2023 under number 23458223. REIT status BELGIUM: Regulated Real Estate Company (GVV/SIR) status (Article 1 of the coordinated Articles of Association) Since 28 June 1999, WDP has been registered with the Belgian Financial Services and Markets Authority, (the FSMA), as a fixed-capital Belgian REIT (a Vastgoedbevak/ SICAF). On 16 October 2014, in order to better meet the economic realities, and due to the changes in the legal framework related to our capacity as an operational and commercial real estate company, WDP changed its status to that of a public regulated real estate company under Belgian law (public 'GVV/SIR'). The relevant amendments to the Articles of Association were enacted in a deed executed by the civil-law notary Yves De Ruyver replacing the aforementioned civil-law notary Jean-Jacques Boel, due to his statutory incapacity, as published in the annexes to the Belgian Official Journal on 31 October 2014 under number 14199666. Therefore, WDP is subject to the legal system as determined in the GVV/SIR legislation. PERMANENT DOCUMENT Annual accounts Governance Results Performance Strategy and value creation This is WDP ESG WDP 2023 Annual Report 292
PERMANENT DOCUMENT Generally speaking, a public regulated real estate company under Belgian law, and therefore also WDP since 16 October 2014, must satisfy some crucial conditions in order to be able to make use of the favourable regime while guaranteeing greater transparency and a limitation of risk for the investor. A public regulated real estate company under Belgian law: 1 is a real estate company that (i) mainly makes immovable property available to users, (ii) may possess other types of property within the statutory limits (holding rights in fixed capital Belgian REITs (a 'Vastgoedbevak/SICAF'), holding rights in certain foreign ICBs, shares issued by other REITs, property certificates and holding rights in a FIIS/GVBF), and (iii) within the framework of making immovable property available, may perform any and all activities associated with the construction, conversion, renovation, development (for the company's own portfolio), acquisition, disposal, management and operation of immovable property and (iv) within the legal limits, may also invest in the infrastructure sector (including through PPPs) and the energy sector (including renewable energy); 1 has a statutory maximum gearing ratio of 65% of its assets; 1 must distribute at least 80% of its earnings to its shareholders; 1 has the obligation of periodic and occasional valuation of the fair value of the property by an independent property expert; 1 diversifies its properties in such a way as to spread the risks appropriately, by type of property, geographic area and category of user or tenant, and no single transaction shall result in more than 20% of its consolidated assets constituting a single property; 1 is subject to corporate income tax at the standard rate, although only on a limited taxable base (i.e. non-deductible professional expenses, abnormal or gratuitous benefits and special assessment of secret commissions). When a GVV/SIR participates in a merger, a demerger or a similar transaction, this transaction shall not benefit from the tax neutrality regime but will give rise to the application of the exit tax at the rate of 15% as of 1 January 2020. As a rule, the dividends paid by a GVV/ SIR to a shareholder give rise to the collection of an immovable property tax at the rate of 30%; 1 follows a strategy intended to retain possession of its properties over the long term; 1 prioritises active management in the performance of its activities, which specifically entails that the company itself is responsible for the development and day-to-day management of the immovable property, and that all other activities that it performs provide added value for these same immovable property or their users, such as offering services that supplement provision of the immovable property; 1 for performance of the aforementioned activities, has its own management structure, administrative, accounting, financial and technical organisation and suitable internal control; 1 is subject to the provisions of the GVV/SIR Act and of the Royal Decree on GVVs/ SIRs; 1 must be incorporated in the form of a public limited company ('NV/SA'); 1 is listed, and at least 30% of the shares must be distributed in the market; 1 cannot act (directly or indirectly) as a property developer (other than occasionally); 1 may possess companies in which it owns, directly or indirectly, over 25% of the shares ("perimeter" companies), which may or may not take the status of an institutional GVV/SIR; 1 must adhere to strict rules regarding conflicts of interest and internal auditing structures. Public or institutional GVV/SIRs fall under the supervision of the FSMA. For more infor mation on the GVV/SIR status, please refer to our website. Aside from Articles 7:96 (conflicts of interest of directors) and 7:97 (conflicts of interest of affiliated companies) of the Belgian Code of Companies and Associations, which apply to all listed companies, special rules apply to GVVs/SIRs regarding functional conflicts of interest (by virtue of Article 37 of the GVV/SIR Act). For further information on each of these procedures, please refer to Chapter 8. Corporate Governance Statement on p. 144. Annual accounts Governance Results Performance Strategy and value creation This is WDP ESG WDP 2023 Annual Report 293
PERMANENT DOCUMENT THE NETHERLANDS: Fiscale Beleggingsinstelling (Fiscal Investment Institution) (FBI) As of 1 November 2010, the FBI (Fiscal Investment Institution) regime applies to WDP Nederland S.A., as a result of which the corporate income tax rate of 0% applies. The company must satisfy the following conditions in order to benefit from this regime: 1 WDP Nederland must be a B.V., N.V. or a mutual fund. 1 The statutory objective as per the Articles of Association and the actual activities of WDP Nederland S.A. are limited to the investment of capital. 1 Only 60% of the financing of the funds for investment (fiscal book value) can be loan capital, in the case immovable property. For other investments (not related to immovable property), only 20% of the fiscal book value of financing can be loan capital. 1 The operating profit of WDP Nederland S.A. must be provided to the shareholder of WDP Nederland S.A. starting from application of the FBI regime within eight months after the end of the financial year. 1 The distributed profits must be distributed evenly across all shares. 1 75% or more of the shares in WDP Nederland S.A. must be held by a body that is not subject to a tax based on earnings. 1 5% or more of the shares cannot be held directly or indirectly by natural persons. 1 25% or more of the shares cannot be held by funds based abroad for persons residing or legal entities domiciled in the Netherlands. For more information on the evolution of the FBI status, we refer to Chapter 7. Financial results and property report on p. 75. FRANCE: Société d'Investissement Immobilier Cotée (SIIC) Since 2005, WDP has been under the SIIC regime (Société d'Investissement Immobilier Cotée) via its permanent establishment in France and its subsidiary WDP France SARL, which means that a corporate income tax rate of 0% applies. The company must satisfy the following conditions in order to benefit from this regime: 1 The parent company must have the structure of an NV/SA or any other form of company limited by shares that can be admitted for listing on the stock market. This parent company must be listed on a stock market under EU law. 1 The main activity of the SIIC must be limited to leasing immovable property. Property developments are not permitted to exceed the limit of 20% of the gross book value of the portfolio. 1 No more than 60% of the shares in WDP can be held by a single investor or a group of investors acting in mutual consultation. 1 Earnings originating from the letting of buildings, the capital gains realised on the sale of buildings, the capital gains realised on the sale of securities in the partnerships or subsidiaries that are liable for corporate income tax and that have opted for SIIC status, contributions disbursed through their subsidiaries that have opted for SIIC status and share in the profits in partnerships are exempt from corporate income tax. 1 A disbursement obligation applies to the results for 95% of the tax-exempt profit originating from rental income, 60% of tax-exempt profit originating from the sale of buildings and securities of partnerships and subsidiaries that are subject to SIIC status and 100% of the dividends that are paid to them by their subsidiaries that are liable for corporate income tax and that have opted for SIIC status. 1 Payment of an exit tax at a rate of 19% on the unrealised capital gains on buildings that are the property of the SIIC or its subsidiaries that are liable for corporate income tax and have opted for SIIC status, and on the securities of partnerships that are not subject to corporate income tax. Website and email address of the Company (Article 4 of the coordinated Articles of Association) The Company's website is: www.wdp.eu. The Company can be contacted at the following email address: shareholdersmeetings@wdp.eu. Registered office of the Company (Article 3 of the coordinated Articles of Association) The Company is based in the Flemish Region. The registered offices can be relocated in Belgium by a decision of the Board of Directors, provided the relocation does not require a change in the language of the Articles of Association to comply with applicable language legislation. Annual accounts Governance Results Performance Strategy and value creation This is WDP ESG WDP 2023 Annual Report 294
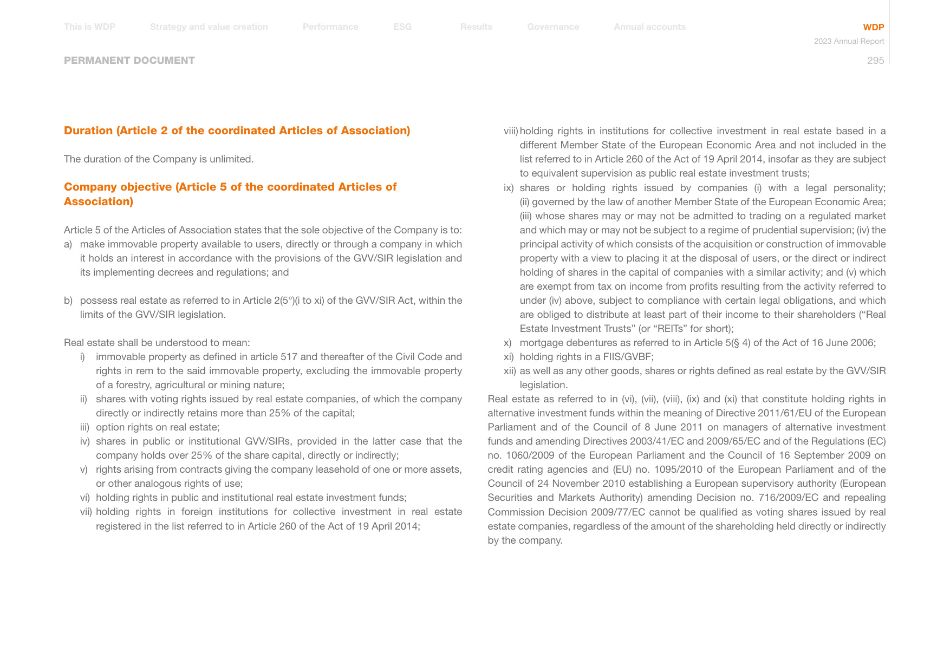
PERMANENT DOCUMENT Duration (Article 2 of the coordinated Articles of Association) The duration of the Company is unlimited. Company objective (Article 5 of the coordinated Articles of Association) Article 5 of the Articles of Association states that the sole objective of the Company is to: a) make immovable property available to users, directly or through a company in which it holds an interest in accordance with the provisions of the GVV/SIR legislation and its implementing decrees and regulations; and b) possess real estate as referred to in Article 2(5°)(i to xi) of the GVV/SIR Act, within the limits of the GVV/SIR legislation. Real estate shall be understood to mean: i) immovable property as defined in article 517 and thereafter of the Civil Code and rights in rem to the said immovable property, excluding the immovable property of a forestry, agricultural or mining nature; ii) shares with voting rights issued by real estate companies, of which the company directly or indirectly retains more than 25% of the capital; iii) option rights on real estate; iv) shares in public or institutional GVV/SIRs, provided in the latter case that the company holds over 25% of the share capital, directly or indirectly; v) rights arising from contracts giving the company leasehold of one or more assets, or other analogous rights of use; vi) holding rights in public and institutional real estate investment funds; vii) holding rights in foreign institutions for collective investment in real estate registered in the list referred to in Article 260 of the Act of 19 April 2014; viii) holding rights in institutions for collective investment in real estate based in a different Member State of the European Economic Area and not included in the list referred to in Article 260 of the Act of 19 April 2014, insofar as they are subject to equivalent supervision as public real estate investment trusts; ix) shares or holding rights issued by companies (i) with a legal personality; (ii) governed by the law of another Member State of the European Economic Area; (iii) whose shares may or may not be admitted to trading on a regulated market and which may or may not be subject to a regime of prudential supervision; (iv) the principal activity of which consists of the acquisition or construction of immovable property with a view to placing it at the disposal of users, or the direct or indirect holding of shares in the capital of companies with a similar activity; and (v) which are exempt from tax on income from profits resulting from the activity referred to under (iv) above, subject to compliance with certain legal obligations, and which are obliged to distribute at least part of their income to their shareholders ("Real Estate Investment Trusts" (or "REITs" for short); x) mortgage debentures as referred to in Article 5(§ 4) of the Act of 16 June 2006; xi) holding rights in a FIIS/GVBF; xii) as well as any other goods, shares or rights defined as real estate by the GVV/SIR legislation. Real estate as referred to in (vi), (vii), (viii), (ix) and (xi) that constitute holding rights in alternative investment funds within the meaning of Directive 2011/61/EU of the European Parliament and of the Council of 8 June 2011 on managers of alternative investment funds and amending Directives 2003/41/EC and 2009/65/EC and of the Regulations (EC) no. 1060/2009 of the European Parliament and the Council of 16 September 2009 on credit rating agencies and (EU) no. 1095/2010 of the European Parliament and of the Council of 24 November 2010 establishing a European supervisory authority (European Securities and Markets Authority) amending Decision no. 716/2009/EC and repealing Commission Decision 2009/77/EC cannot be qualified as voting shares issued by real estate companies, regardless of the amount of the shareholding held directly or indirectly by the company. Annual accounts Governance Results Performance Strategy and value creation This is WDP ESG WDP 2023 Annual Report 295
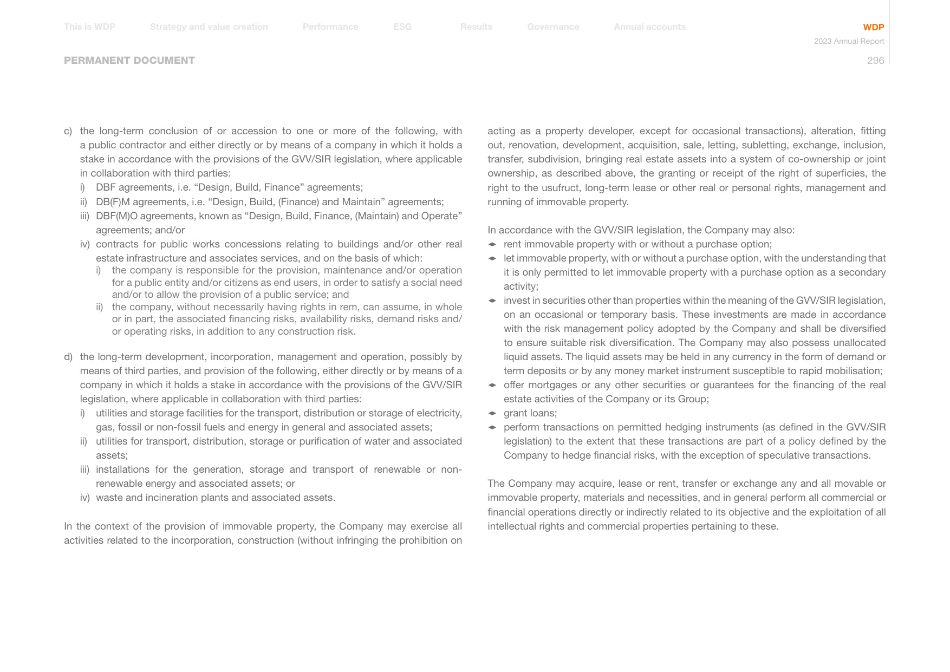
PERMANENT DOCUMENT c) the long-term conclusion of or accession to one or more of the following, with a public contractor and either directly or by means of a company in which it holds a stake in accordance with the provisions of the GVV/SIR legislation, where applicable in collaboration with third parties: i) DBF agreements, i.e. "Design, Build, Finance" agreements; ii) DB(F)M agreements, i.e. "Design, Build, (Finance) and Maintain" agreements; iii) DBF(M)O agreements, known as "Design, Build, Finance, (Maintain) and Operate" agreements; and/or iv) contracts for public works concessions relating to buildings and/or other real estate infrastructure and associates services, and on the basis of which: i) the company is responsible for the provision, maintenance and/or operation for a public entity and/or citizens as end users, in order to satisfy a social need and/or to allow the provision of a public service; and ii) the company, without necessarily having rights in rem, can assume, in whole or in part, the associated financing risks, availability risks, demand risks and/ or operating risks, in addition to any construction risk. d) the long-term development, incorporation, management and operation, possibly by means of third parties, and provision of the following, either directly or by means of a company in which it holds a stake in accordance with the provisions of the GVV/SIR legislation, where applicable in collaboration with third parties: i) utilities and storage facilities for the transport, distribution or storage of electricity, gas, fossil or non-fossil fuels and energy in general and associated assets; ii) utilities for transport, distribution, storage or purification of water and associated assets; iii) installations for the generation, storage and transport of renewable or non- renewable energy and associated assets; or iv) waste and incineration plants and associated assets. In the context of the provision of immovable property, the Company may exercise all activities related to the incorporation, construction (without infringing the prohibition on acting as a property developer, except for occasional transactions), alteration, fitting out, renovation, development, acquisition, sale, letting, subletting, exchange, inclusion, transfer, subdivision, bringing real estate assets into a system of co-ownership or joint ownership, as described above, the granting or receipt of the right of superficies, the right to the usufruct, long-term lease or other real or personal rights, management and running of immovable property. In accordance with the GVV/SIR legislation, the Company may also: 1 rent immovable property with or without a purchase option; 1 let immovable property, with or without a purchase option, with the understanding that it is only permitted to let immovable property with a purchase option as a secondary activity; 1 invest in securities other than properties within the meaning of the GVV/SIR legislation, on an occasional or temporary basis. These investments are made in accordance with the risk management policy adopted by the Company and shall be diversified to ensure suitable risk diversification. The Company may also possess unallocated liquid assets. The liquid assets may be held in any currency in the form of demand or term deposits or by any money market instrument susceptible to rapid mobilisation; 1 offer mortgages or any other securities or guarantees for the financing of the real estate activities of the Company or its Group; 1 grant loans; 1 perform transactions on permitted hedging instruments (as defined in the GVV/SIR legislation) to the extent that these transactions are part of a policy defined by the Company to hedge financial risks, with the exception of speculative transactions. The Company may acquire, lease or rent, transfer or exchange any and all movable or immovable property, materials and necessities, and in general perform all commercial or financial operations directly or indirectly related to its objective and the exploitation of all intellectual rights and commercial properties pertaining to these. Annual accounts Governance Results Performance Strategy and value creation This is WDP ESG WDP 2023 Annual Report 296
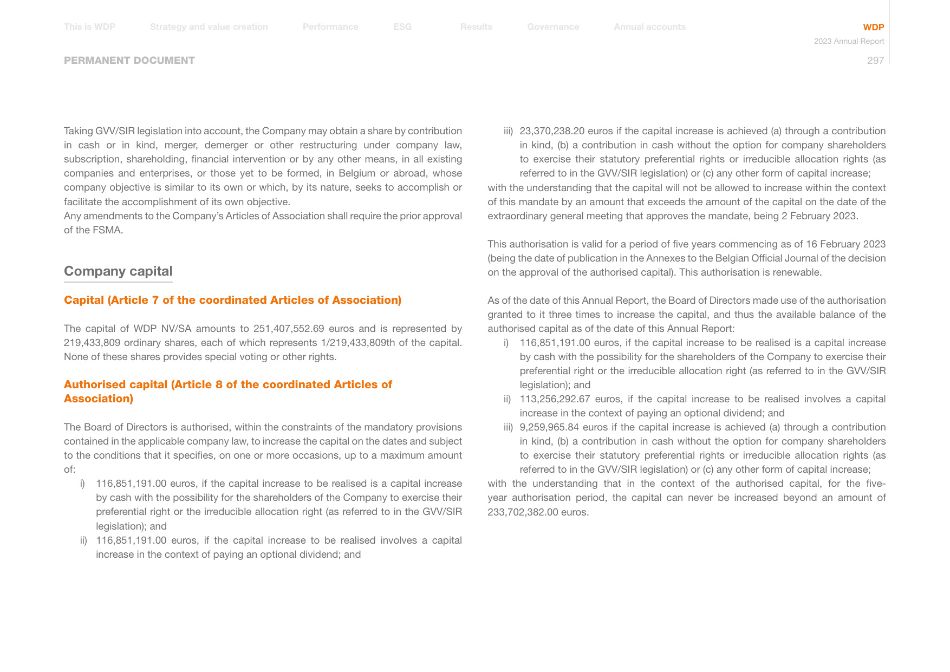
PERMANENT DOCUMENT Taking GVV/SIR legislation into account, the Company may obtain a share by contribution in cash or in kind, merger, demerger or other restructuring under company law, subscription, shareholding, financial intervention or by any other means, in all existing companies and enterprises, or those yet to be formed, in Belgium or abroad, whose company objective is similar to its own or which, by its nature, seeks to accomplish or facilitate the accomplishment of its own objective. Any amendments to the Company's Articles of Association shall require the prior approval of the FSMA. Company capital Capital (Article 7 of the coordinated Articles of Association) The capital of WDP NV/SA amounts to 251,407,552.69 euros and is represented by 219,433,809 ordinary shares, each of which represents 1/219,433,809th of the capital. None of these shares provides special voting or other rights. Authorised capital (Article 8 of the coordinated Articles of Association) The Board of Directors is authorised, within the constraints of the mandatory provisions contained in the applicable company law, to increase the capital on the dates and subject to the conditions that it specifies, on one or more occasions, up to a maximum amount of: i) 116,851,191.00 euros, if the capital increase to be realised is a capital increase by cash with the possibility for the shareholders of the Company to exercise their preferential right or the irreducible allocation right (as referred to in the GVV/SIR legislation); and ii) 116,851,191.00 euros, if the capital increase to be realised involves a capital increase in the context of paying an optional dividend; and iii) 23,370,238.20 euros if the capital increase is achieved (a) through a contribution in kind, (b) a contribution in cash without the option for company shareholders to exercise their statutory preferential rights or irreducible allocation rights (as referred to in the GVV/SIR legislation) or (c) any other form of capital increase; with the understanding that the capital will not be allowed to increase within the context of this mandate by an amount that exceeds the amount of the capital on the date of the extraordinary general meeting that approves the mandate, being 2 February 2023. This authorisation is valid for a period of five years commencing as of 16 February 2023 (being the date of publication in the Annexes to the Belgian Official Journal of the decision on the approval of the authorised capital). This authorisation is renewable. As of the date of this Annual Report, the Board of Directors made use of the authorisation granted to it three times to increase the capital, and thus the available balance of the authorised capital as of the date of this Annual Report: i) 116,851,191.00 euros, if the capital increase to be realised is a capital increase by cash with the possibility for the shareholders of the Company to exercise their preferential right or the irreducible allocation right (as referred to in the GVV/SIR legislation); and ii) 113,256,292.67 euros, if the capital increase to be realised involves a capital increase in the context of paying an optional dividend; and iii) 9,259,965.84 euros if the capital increase is achieved (a) through a contribution in kind, (b) a contribution in cash without the option for company shareholders to exercise their statutory preferential rights or irreducible allocation rights (as referred to in the GVV/SIR legislation) or (c) any other form of capital increase; with the understanding that in the context of the authorised capital, for the five- year authorisation period, the capital can never be increased beyond an amount of 233,702,382.00 euros. Annual accounts Governance Results Performance Strategy and value creation This is WDP ESG WDP 2023 Annual Report 297
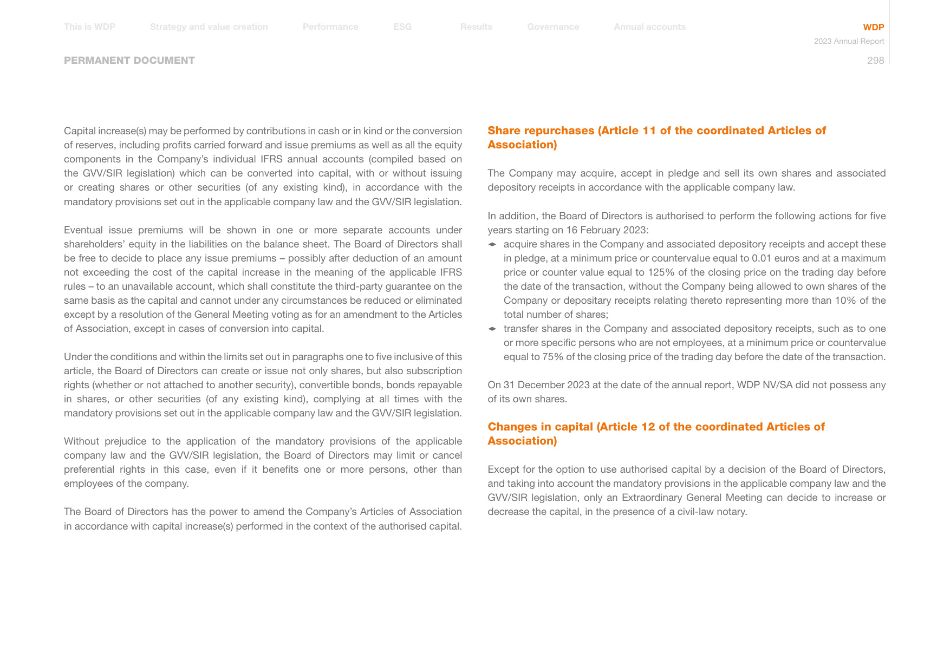
PERMANENT DOCUMENT Capital increase(s) may be performed by contributions in cash or in kind or the conversion of reserves, including profits carried forward and issue premiums as well as all the equity components in the Company's individual IFRS annual accounts (compiled based on the GVV/SIR legislation) which can be converted into capital, with or without issuing or creating shares or other securities (of any existing kind), in accordance with the mandatory provisions set out in the applicable company law and the GVV/SIR legislation. Eventual issue premiums will be shown in one or more separate accounts under shareholders' equity in the liabilities on the balance sheet. The Board of Directors shall be free to decide to place any issue premiums – possibly after deduction of an amount not exceeding the cost of the capital increase in the meaning of the applicable IFRS rules – to an unavailable account, which shall constitute the third-party guarantee on the same basis as the capital and cannot under any circumstances be reduced or eliminated except by a resolution of the General Meeting voting as for an amendment to the Articles of Association, except in cases of conversion into capital. Under the conditions and within the limits set out in paragraphs one to five inclusive of this article, the Board of Directors can create or issue not only shares, but also subscription rights (whether or not attached to another security), convertible bonds, bonds repayable in shares, or other securities (of any existing kind), complying at all times with the mandatory provisions set out in the applicable company law and the GVV/SIR legislation. Without prejudice to the application of the mandatory provisions of the applicable company law and the GVV/SIR legislation, the Board of Directors may limit or cancel preferential rights in this case, even if it benefits one or more persons, other than employees of the company. The Board of Directors has the power to amend the Company's Articles of Association in accordance with capital increase(s) performed in the context of the authorised capital. Share repurchases (Article 11 of the coordinated Articles of Association) The Company may acquire, accept in pledge and sell its own shares and associated depository receipts in accordance with the applicable company law. In addition, the Board of Directors is authorised to perform the following actions for five years starting on 16 February 2023: 1 acquire shares in the Company and associated depository receipts and accept these in pledge, at a minimum price or countervalue equal to 0.01 euros and at a maximum price or counter value equal to 125% of the closing price on the trading day before the date of the transaction, without the Company being allowed to own shares of the Company or depositary receipts relating thereto representing more than 10% of the total number of shares; 1 transfer shares in the Company and associated depository receipts, such as to one or more specific persons who are not employees, at a minimum price or countervalue equal to 75% of the closing price of the trading day before the date of the transaction. On 31 December 2023 at the date of the annual report, WDP NV/SA did not possess any of its own shares. Changes in capital (Article 12 of the coordinated Articles of Association) Except for the option to use authorised capital by a decision of the Board of Directors, and taking into account the mandatory provisions in the applicable company law and the GVV/SIR legislation, only an Extraordinary General Meeting can decide to increase or decrease the capital, in the presence of a civil-law notary. Annual accounts Governance Results Performance Strategy and value creation This is WDP ESG WDP 2023 Annual Report 298
PERMANENT DOCUMENT 1 Capital increase in cash Where the capital is increased by a cash contribution and without prejudice to the application of the mandatory provisions of the applicable company law, the preferential right can be restricted or cancelled. In such cases, if the mandatory provisions of GVV/SIR legislation require the granting of an irreducible allocation right to existing shareholders when new securities are allocated, this irreducible allocation right must at least satisfy the following conditions: 1° it applies to all new securities issued; 2° it is granted to the shareholders in proportion to the share of capital that their shares represent at the time of the transaction; 3° a maximum share price shall be announced by no later than the evening prior to the opening of the public subscription period; and 4° in such cases, the public subscription period must be at least three trading days. However, a capital increase in cash can also take place with the waiving of the statutory preferential right and without the allocation of an irreducible allocation right, provided that the following conditions are satisfied: 1° the capital increase takes place using the authorised capital; 2° the cumulative amount of capital increases carried out in accordance herewith over a period of twelve months shall not exceed 10% of the amount of the capital at the time of the decision to increase the capital. This allows a GVV/SIR, among other things, to realise an exempted private offering of new shares by means of an accelerated private placement with an order book (i.e. accelerated bookbuilding or ABB). 1 Capital increase in kind When issuing securities against contributions in kind, the following conditions must be met without prejudice to the mandatory provisions contained in the applicable company law: 1) the identity of the contributor must be disclosed in the special report of the Board of Directors on the capital increase by contribution in kind, and also, where applicable, in the invitations to the general meeting that will decide on the contribution in kind; 2) the issue prices shall be no less than the lower value of (a) a net value per share dated no more than four months prior to the date of the contribution agreement or, at the discretion of the company, before the date of the capital increase deed, and (b) the average closing price of the thirty calendar days before this date; 3) unless the issue price and method used are determined at the latest by the working day after conclusion of the contribution agreement and are announced to the public with indication of the timeframe within which the capital increase will actually be complete, the capital increase deed shall be executed within no more than four months; and 4) the report provided for under point 1 above must also explain the impact of the proposed contribution on the position of the earlier shareholders and more particularly on their share in the profits, in the net value per share and in the capital as well as the impact on voting rights. For the application of point 2 above, an amount may be deducted from the sum specified in clause 2(b) above, that is equal to the part of the undistributed gross dividend to which the new shares may not grant a right. Where applicable, the Board of Directors shall specifically justify the dividend amount deducted, as described above, in its special report, and explain the financial conditions of the transaction in its annual financial report. Annual accounts Governance Results Performance Strategy and value creation This is WDP ESG WDP 2023 Annual Report 299
PERMANENT DOCUMENT The special rules for capital increases in kind, explained above, do not apply to the contribution of a right to a dividend in the context of payment of an optional dividend, insofar as this is effectively open for payment to all shareholders. 1 Mergers, demergers and equivalent operations The special rules for capital increases in kind, explained above, apply mutatis mutandis to mergers, demergers and similar operations to which the GVV/SIR legislation refers in this specific context. In this case, the "date of the contribution agreement" refers to the date on which the merger or demerger proposal was deposited. Control over the Company Special rights of control are not granted to any categories of shareholders. WDP currently has only one reference shareholder, who has one representative on the Board of Directors by virtue of the binding right of appointment as set out in Article 15 of the coordinated Articles of Association, an excerpt of which is provided below: "Notwithstanding the mandatory provisions in the applicable company law and notwithstanding the GVV/SIR legislation, and subject to the conditions and terms of this article, every natural person, legal entity or company (with or without legal personality) that individually and directly holds at least 10% of the shares in the Company (a "Reference Shareholder"), shall have a binding right to appoint one director at the annual meeting. A Reference Shareholder shall have a binding right, subject to the terms and conditions contained in this article, to appoint one additional director for each block of 10% of the shares that the Reference Shareholder owns individually and directly in the company (...)" Statutory auditor (Article 23 of the coordinated Articles of Association) On 25 April 2007, Deloitte Bedrijfsrevisoren, a member of the Belgian Institute of Registered Auditors with offices at Gateway building Luchthaven Brussel Nationaal 1 J, 1930 Zaventem, was appointed as the WDP company auditor. On 27 April 2016, the statutory auditor, represented by its permanent representative, Kathleen De Brabander, was reappointed until the annual meeting of 2019. On 6 December 2016, WDP launched an open call for tenders for this term of appointment as statutory auditor in accordance with the European Audit Directive 537/2014/EU. Due to this legislation, the term of Deloitte Bedrijfsrevisoren already ended at the Annual General Meeting of 26 April 2017. This meeting concerned the reappointment of Deloitte Bedrijfsrevisoren, represented by its permanent representative, Kathleen De Brabander, until the annual meeting of 2020. The Annual General Meeting of 24 April 2019 conducted an internal rotation of the permanent representatives of the statutory auditor in the context of Article 22(§ 3) of the Act of 7 December 2016 organising the profession and public supervision of company auditors. Kathleen De Brabander was succeeded by Rik Neckebroeck for the remainder of the term, i.e. until the annual meeting of 2020. The Annual General Meeting of 26 April 2023 conducted an internal rotation of the permanent representatives of the statutory auditor in the context of Article 22(§ 3) of the Act of 7 December 2016 organising the profession and public supervision of company auditors. Rik Neckebroeck was succeeded by Kathleen de Brabander, for an additional period of two years, i.e. until the annual meeting in 2025. The duties of the statutory auditor consist of the auditing the consolidated and separate annual accounts of WDP NV/SA and the other Belgian subsidiaries. Annual accounts Governance Results Performance Strategy and value creation This is WDP ESG WDP 2023 Annual Report 300
PERMANENT DOCUMENT In France, Deloitte & Associés, represented by Pierre-Marie Martin, with offices at 6, Place de la Pyramide, 92908 Paris La Défense Cedex, was appointed as statutory auditor for the subsidiary WDP France SARL. In the Netherlands, Deloitte Accountants BV, represented by Viona Borreman, with offices at Gustav Mahlerplein 2970, 1081 LA Amsterdam, the Netherlands, was appointed as the statutory auditor for the WDP Nederland S.A. and WDP Development NL S.A. subsidiaries. In Luxembourg, Deloitte Audit SARL, represented by Ronan Richard, with offices at Boulevard de Kockelscheuer 20, 1821 Luxembourg, was appointed as statutory auditor of the WDP Luxembourg S.A. subsidiary. In Romania, Deloitte Audit SRL, represented by Claudiu Ghiurluc, with offices at 82-98 Calea Grivitei, The Mark Tower, 14th floor, District 1, 010735 Bucharest, Romania, was appointed as the statutory auditor of the Warehouses De Pauw Romania SRL subsidiary. The fees of the statutory auditor are determined based on prices in line with market conditions and independently of WDP as per the code of conduct and the standards of the Belgian Institute of Registered Auditors and in accordance with the applicable provisions with regard to the independence of company auditors set out in the Belgian Code of Companies and Associations. For further information on statutory auditor fees, please see Chapter 11. Annual accounts on p. 258. Financial service (paying agent) ABN AMRO Bank N.V. Richard van Etten and Julie Nollet Gustav Mahlerlaan 10, P.O. Box 283 (HQ 7212), 1000 EA AMSTERDAM +31 20 628 0647 richard.van.etten@nl.abnamro.com and julie.nollet@nl.abnamro.com The fees for financial services are determined based on market conditions as a percentage of the volume of the transactions concerned (such as dividend payments, optional dividends, etc.) and are independent of the Company. For further information on financial service fees, please see Chapter 11. Annual accounts on p. 259. Property expert In accordance with the GVV/SIR legislation, the expert values all buildings of the GVV/ SIR and its subsidiaries at the end of each financial year. The book value of the buildings appearing on the balance sheet is adjusted to these values. In addition, at the end of each of the first three quarters of the financial year, the independent property expert updates the overall valuation prepared at the end of the previous year based on the development of the market and the individual characteristics of the properties in question. The expert also values the properties of the GVV/SIR and its subsidiaries if the GVV/SIR wishes to perform transactions such as share issues or mergers. All immovable property that the GVV/SIR or its subsidiaries want to acquire or transfer are valued by the independent property expert prior to the transaction. The valuation of the expert shall apply as a minimum price (in cases of disposal), or maximum price (in cases of acquisitions) for the GVV/SIR when the counterparty is a person that is closely involved with the GVV/SIR (as determined in the applicable regulations for GVVs/ SIRs) or if such persons receive any benefits from the transaction in question. The GVV/SIR legislation formulates statutory obligations on procedures followed by property experts to ensure the necessary degree of independence of property appraisers in the valuation of the property. It is stipulated that the remuneration cannot be related to the value of the property that forms the subject matter of the expert's report. Annual accounts Governance Results Performance Strategy and value creation This is WDP ESG WDP 2023 Annual Report 301
PERMANENT DOCUMENT An obligation is also imposed on the GVV/SIR to ensure replacement of the expert(s) that it appoints under a double rotation requirement. Thus, the GVV/SIR may only appoint the expert for a renewable term of three years. Moreover, an expert may only be entrusted with the valuation of a particular property for a maximum period of three years, after which a cooling-off period of three years must be observed. Therefore, an expert who has already served a three-year term may only be appointed for a new three-year term if, for this period, the expert is responsible for valuing a different part of the assets of the public GVV/SIR or its subsidiaries. Special rules apply if the expert is a legal entity. As of 31 December 2023, the property experts appointed by WDP NV/SA are: 1 Stadim CVBA, Mechelsesteenweg 180, 2018 Antwerp - Belgium, represented (within the meaning of Article 24 of the GVV/SIR Act) by Céline Janssens; 1 Jones Lang LaSalle BV, Marnixlaan 23, 1000 Brussels – Belgium, represented (within the meaning of Article 24 of the GVV/SIR Act) by Rod Scrivener; 1 Jones Lang LaSalle BV, Parnassusweg 727, 1077DG Amsterdam – The Netherlands represented (within the meaning of Article 24 of the GVV-Set) by Justin Stortelers; 1 CBRE Valuation & Advisory Services B.V., Anthony Fokkerweg 15, 1059 CM Amsterdam, the Netherlands, represented (within the meaning of Article 24 of the GVV/SIR Act) by Walter de Geus; 1 BNP Paribas Real Estate, 50 cours de l'Ile Seguin, in 921009 Boulogne Billancourt, France, represented (within the meaning of Article 24 of the GVV/SIR Act) by Caroline Hussenot; 1 CBRE Romania | Valuation Department, One Tower, 165 Calea Floreasca, 14th Floor, Bucharest, Romania, represented (within the meaning of Article 24 of the GVV/SIR Act) by Ovidiu Ion; 1 Jones Lang LaSalle Luxembourg SECS, rue du Puits Romain 37, L-8070 Bertrange, Luxembourg, represented (within the meaning of Article 24 of the GVV/SIR Act) by Greet Hex; 1 CBRE GmbH, Hausvogteiplatz 10, 10117 Berlin – Germany, represented (within the meaning of Article 24 of the GVV/SIR Act) by Kristine Kühn. Remuneration for property experts is not connected to the value of the property and is based on a fixed fee per property valued and/or a variable fee according to the surface area valued. The agreements with the property experts satisfy the relevant regulations. For further information on the division of the property portfolio or property expert fees, see Chapter 11. Annual accounts on p. 241 and p. 260. Insurance cover WDP and its subsidiaries must take out adequate insurance cover for all of their immovable property. The insurance cover must be in line with customary market conditions. All WDP buildings are insured for their new construction value. For further information on the insured value and the premiums paid for insurance cover, we refer to Chapter 11. Annual accounts on p. 236 and p. 260. Structures abroad To ensure optimal management of the property portfolio abroad, WDP NV/SA has subsidiaries and sub-subsidiaries in several European countries (these companies do not have the status of an institutional GVV/SIR). 1 The companies in the Group have several features in common. 1 The company structure is also the local equivalent of a private limited company ('BV') or a public limited company ('NV/SA'). 1 WDP owns 100% of the shares in all foreign subsidiaries and sub-subsidiaries, except for WDP Romania (85%), and WDP Luxembourg (55%). Annual accounts Governance Results Performance Strategy and value creation This is WDP ESG WDP 2023 Annual Report 302
PERMANENT DOCUMENT 1 WDP NV/SA is represented in France by its permanent establishment at rue Cantrelle 28, 36000 Châteauroux, France. 1 WDP Nederland S.A. has another 100% subsidiary, WDP Development NL S.A., Hoge Mosten 2, 4822 NH Breda. The results of the subsidiaries are subject to local corporate income tax, except for WDP Nederland which has FBI status (Fiscale Beleggingsinstelling) and WDP France which has SIIC status (Société d'Investissement Immobilier Cotée), with the corresponding fiscal transparency. More information on the FBI status and the SIIC status is available under REIT status earlier on in this chapter. The net income can be disbursed to WDP, in which case the withholding tax or exemption depends on the EU Parent-Subsidiary Directive, its implementation in the local legislation of the respective countries and the applicable double taxation agreements between Belgium and the various countries in which WDP is active. Results from foreign subsidiaries are included in the consolidation, after elimination of the depreciation of immovable property and offset of deferred tax receivables. The choice of financing method (group loans versus bank loans) must always take into account the impact of this financing on the consolidated gearing ratio for WDP (the maximum gearing ratio at the consolidated level must be respected and amounts to 65% as per GVV/SIR legislation. This same maximum gearing ratio also applies to the separate statements of the GVV/SIR). At the consolidated level, subordinated group loans do not affect the Group's gearing ratio. On the other hand, bank loans do. For this financing strategy, the main factors to consider (aside from the gearing ratio) are the two key principles of taxation that differ from country to country: 1 the rules on the thin capitalisation obligation for companies; 1 the withholding tax percentage to be deducted on interest payments on outstanding group loans disbursed to the country of origin. Annual accounts Governance Results Performance Strategy and value creation This is WDP ESG WDP 2023 Annual Report 303
Financial and operating results Acquisition price This refers to the value of the property at the time of purchase. Any transfer costs paid are included in the acquisition price. See also Transfer costs. Initial yield The ratio of the (initial) contractual rent of a purchased property to the acquisition price. See also Acquisition price. Accelerated bookbuild (ABB) An exempt accelerated private placement with international institutional investors with the composition of an order book. APM (Alternative Performance Measure) Financial measurement of historic or future financial performance, financial position or cash flow of a company that has not been defined in the customary reporting guidelines. The Alternative Performance Measures (APM) adopted by WDP – including the EPRA key performance indicators – are always accompanied by a symbol () and are provided with their definition and reconciliation in the appendices to this report. CAGR Compounded annual growth rate. Contractual rent The gross rental prices as contractually stipulated in the lease agreements on the date of conclusion. Derivatives As a borrower, WDP would like to hedge itself against any interest rate increases. The interest rate risk can be hedged in part by using derivatives (such as interest rate swaps). Discounted cash flow This is a valuation method based on a detailed projected revenue flow that is discounted to the current net value at a specific discount rate according to the risk of the asset to be valued. Due diligence Extensive investigation conducted within the framework of all acquisitions and/or financial transactions in the areas of real estate, economics, taxation, law, bookkeeping and administration, possibly in association with specialist external advisors. Fair value The fair value is defined in IAS 40 as the amount for which the property could be exchanged between two well-informed, willing parties in an arm's length transaction. The market value must additionally reflect the current rental incomes, the current gross margin for self-financing (or cash flow), the reasonable assumptions regarding potential rental income and the expected costs. Estimated rental value (ERV) The estimated rental value is the rental value determined by the independent property experts. GLOSSARY IAS/IFRS The IAS (International Accounting Standards) and IFRS (International Financial Reporting Standards) apply to the preparation of annual accounts and are drafted by the International Accounting Standards Board (IASB). IAS 16 Tangible fixed assets IAS 16 is an IAS/IFRS that applies to the administrative treatment of tangible fixed assets unless a different standard requires or permits different treatment. The main issues arising in the administrative treatment of tangible fixed assets is the recognition of assets, calculation of their book value and depreciation costs and special impairment losses to be recognised in relation to the assets. IAS 40 Investment properties IAS 40 is an IAS/IFRS that applies to recognition and measurement of and the provision of information on investment properties. This standard therefore provides the treatment method for investment properties and the corresponding disclosure requirements. IFRS 9 Financial instruments: recognition and measurement IFRS 9 is a standard that determines how a company must classify and measure the financial instruments on its balance sheet. Among other things, this standard provides for the obligation that all derivatives must be booked in the balance sheet at their fair value. Contribution in kind The assets contributed when a company is incorporated or when its capital is increased, other than by depositing money. Indexation The rent is contractually adjusted for inflation annually on the anniversary of the contract start date based on the reference index in each specific country. Income capitalisation This is a valuation technique used for valuing real estate where the income stream is discounted in a perpetuity at a certain required rate of return. Subsequently, certain corrections are applied to account for deviations in full occupancy under market conditions (subletting, incentives, vacancies, etc.). Interest Rate Swap (forward) An IRS where the start date is in the future. Interest Rate Swap (IRS) An interest rate swap is an instrument in which parties exchange interest payments with one another for a set term. WDP uses Interest Rate Swaps to convert floating interest payments into fixed interest payments, to hedge against interest rate increases. IVSC (International Valuation Standards Council) An independent body that develops global standards regarding valuations that investors and other third parties or stakeholders should be able to trust. Quality distribution of the properties in the property portfolio The quality distribution of the properties within the property portfolio is based on a classification according to Class A green-certified warehouse, Class A warehouse, Class B warehouse and Class C warehouse. This classification is based on the following parameters: age and location of the property, clear height, prospects for expansion and/or development, equipment and parking. Annual accounts Governance Results Performance Strategy and value creation This is WDP ESG WDP 2023 Annual Report 304
Glossary Optional dividend The transfer of ownership of a property is, in principle, subject to the collection by the state of transfer rights that constitute the bulk of the transaction costs. The amount of these rights depends on the method of transfer, the capacity of the buyer and the geographical location of the property. Partial demerger A partial demerger is a legal transaction in which part of the assets of a company (both rights and obligations) is transferred to an existing or new company without dissolution, in exchange for transfer of shares in the acquiring company to shareholders in the demerging company. Property portfolio The portfolio value is composed of investment properties, investment properties under development for own account with the purpose of being rented out, assets held for sale and the fair value of the solar panels. Project development team Management of construction or renovation projects. WDP has an internal team of project managers working exclusively for the company. Property management team Day-to-day management of the property portfolio, more specifically formulation of the policy for management of existing buildings (maintenance, modification and improvement works). WDP has an internal team of property managers working exclusively for the company. Fair value See Fair value. Interest hedging The use of derivative financial instruments to protect existing debt positions against an increase in interest rates. The share Gross dividend The gross dividend per share is the dividend before deduction of the withholding tax. See also Immovable property tax. Dividend yield Gross dividend divided by the share price. Ex-date Start date of trading the share on the stock market without entitlement to the next dividend distribution, in other words, the cut-off date of the coupon. Free float Percentage of shares owned by the public. According to the definition of EPRA and Euronext, this means every individual shareholder that possesses 5% of the total number of shares. Optional dividend With an optional dividend, the dividend claim linked to an established number of existing shares provides the right to a new share, at an issue price per share that may include a discount compared to the share price (whether or not an average share price over a certain period). The issue of shares within the framework of the optional dividend is subject to standard company law on capital increases. If, in addition to a contribution in kind within the framework of the distribution of an optional dividend, a contribution in cash is made, the special provisions of article 26, § 1 of the GVV/SIR Act concerning capital increases in cash cannot be declared applicable in the articles of association, insofar as this optional dividend is effectively made payable to all shareholders. The special rules on contribution in kind to a GVV/SIR, as provided for by Article 26, § 2 of the GVV/SIR Act, do not apply either, provided certain conditions are met. Liquidity This is the average number of shares traded per trading day measured over a specific period of time. Market capitalisation Closing price on the stock market multiplied by the number of shares in circulation on that date. Net dividend This is equal to the gross dividend after deduction of the 30% withholding tax. See also Immovable property tax. Record date The date on which the positions are closed for identification of shareholders entitled to dividends, also known as the ex-date for short. Immovable property tax An advance levy deducted by a bank or financial intermediary on the payment of a dividend. The standard rate of the immovable property tax on dividends in Belgium is fixed at 30%. Annual accounts Governance Results Performance Strategy and value creation This is WDP ESG WDP 2023 Annual Report 305
Glossary Environmental results BREEAM (Building Research Establishment Environmental Assessment Method) BREEAM is a sustainability certificate related to the performance of a building over its complete life cycle. BREEAM is the main and most commonly used sustainability label for buildings in Europe. Unlike other standards, BREEAM applies a multi-criteria approach. The certification process examines not only the energy consumption of a property, but also land use, ecology, the construction process, water use, waste, pollution, transport, materials, health and comfort. As a total score, a building is rated Acceptable (only applicable to BREEAM In-Use), Pass, Good, Very Good, Excellent or Outstanding. Greenhouse gases (GHG) Greenhouse gases are a collection of gases expressed in CO2 equivalents that absorb heat from the sun and trap it in the Earth's atmosphere. Carbon removal Carbon removal is a process where residual emissions (CO2) are removed from the atmosphere and stored for long periods of time. The removal of GHGs means the removal of greenhouse gases (GHDs) from the atmosphere by deliberate human activities. In other words, in addition to the removal that would occur via the natural carbon cycle or atmospheric chemical processes. Carbon removal is integrated as a part of the strategy to move – after the maximum reduction of greenhouse gas emissions – towards net-zero emissions. Cradle-to-Grave: Refers to a full life cycle inventory, including all emissions and disposals of a given product or material starting from its acquisition up to the end of its useful life. Cradle-to-Gate: Refers to a partial life cycle inventory, including all emissions and disposals starting from the purchase of the material up to the moment the material reaches the WDP worksite (and thus excluding the use of the end product and end of useful life). EDGE (Excellence in Design for Greater Efficiencies) Certification programme for green buildings that focuses on the efficient use of resources. EDGE supports developers and builders to quickly and cost-effectively reduce energy and water consumption or energy absorbed by materials. EDGE certificates are issued worldwide and are an initiative of IFC, part of the World Bank Group. Embodied carbon Greenhouse gases released during the production, transport and construction of building materials as well as during the demolition of buildings. Green Energy Certificates (GECs) These are granted by the Flemish Electricity and Gas Market Regulator (the 'VREG') in Flanders, the Wallonia Energy Commission (the 'CWaPE') in Wallonia and the Romanian Energy Regulatory Authority (the 'ANRE') in Romania for alternative energy projects, including solar power, with a minimum price per certificate. Carbon dioxide (CO2) A greenhouse gas produced by the decomposition of plant-based or animal matter. PV installation Photovoltaic or solar panel system. Scope 1 Direct greenhouse gas emissions caused by sources owned or under direct control of the Group, such as office and transport-related activities. Scope 2 Indirect greenhouse gas emissions from the generation of purchased electricity or heat. This energy generation occurs outside the Group's control but results in the emission of greenhouse gases. Scope 3 Indirect greenhouse gas emissions caused by the operating activities of another organisation in the value chain, both from suppliers and customers of the Group. TCFD The Task Force on Climate-related Financial Disclosure is a reporting standard that allows companies to report on the financial impact of climate factors on business operations. Governance and regulations Corporate Governance Code 2020 Belgian code drawn up by the Corporate Governance Committee with practices and provisions on good governance that must be met by companies under Belgian law whose shares are traded on a regulated market. EPRA (European Public Real Estate Association) EPRA is a pan-European association of listed real estate companies that aims to promote the sector, introduce best practices for bookkeeping, reporting and corporate governance, provide qualitative information to investors and serve as a think tank for challenges facing the sector. FBI (Fiscale Beleggingsinstelling) Special fiscal status in the Netherlands available if specific requirements are met. See also 12. Appendices – Permanent document. FSMA (Financial Services and Markets Authority) Along with the National Bank of Belgium (the NBB), the FSMA supervises the Belgian financial sector. The powers of the FSMA fall into the following six areas: supervision of financial markets and listed companies, conduct supervision, product supervision, supervision of financial service providers and intermediaries, supervision of supplementary pensions and facilitation of better financial education. GVV/SIR (Regulated Real Estate Company) A regulated real estate company is a listed operational real estate company that specialises in making immovable property available to users and meets the legal requirements as set out in the GVV/SIR legislation. It positions itself in an international context as a REIT, characterised by a regime of fiscal transparency. The GVV/SIR is subject to the prudential supervision of the FSMA. See also GVV/SIR legislation. Annual accounts Governance Results Performance Strategy and value creation This is WDP ESG WDP 2023 Annual Report 306
Glossary GVV/SIR ROYAL DECREE Royal Decree of 13 July 2014 on regulated real estate companies and, together with the GVV/SIR Act, i.e. the GVV/SIR legislation. See also GVV/SIR Act, GVV/SIR legislation and REIT. GVV/SIR Act Act of 12 May 2014 on regulated real estate companies and, together with the GVV/SIR Act, i.e. the GVV/ SIR legislation. See also GVV/SIR Royal Decree, GVV/SIR legislation and REIT. GVV/SIR legislation The Act of 12 May 2014 (GVV/SIR Act) and the Royal Decree of 13 July 2014 (GVV/SIR Royal Decree). Reference shareholder Any natural person, legal entity or company (possibly with a legal personality) that holds at least 10% of the shares in the Company individually and directly, in accordance with Article 15 of the Articles of Association of the Company. Regulated Property Companies (GVVs/SIRs) International designation for listed real estate investment funds with a special tax status (such as in Belgium (see also GVV/SIR), the Netherlands (see also FBI) and France (see also SIIC)). SIIC (Société d'Investissement Immobiliers Cotée) Special tax status available in France that listed real estate companies can opt for if the specific requirements are met. See also 12. Appendices – Permanent document. Annual accounts Governance Results Performance Strategy and value creation This is WDP ESG WDP 2023 Annual Report 307
www.wdp.eu WDP NV Blakebergen 15, B-1861 Wolvertem T. +32 (0)52 338 400 info@wdp.eu | www.wdp.eu www.facebook.com/WDPwarehouses @WDP_EU linkedin.com/company/wdp Company number: BE 0417.199.869 (Register of legal entities of Brussels, Dutch section) Design and realisation: CF Report I Text and photography: WDP I Translations ElaN Translations This report has been printed on FSC certified paper.