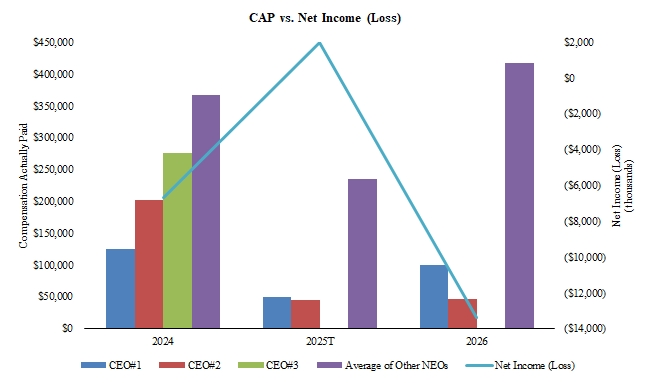
| Summary Compensation Table (SCT) Total for CEO #1(a) | | Compensation Actually Paid (CAP) to CEO #1 (a)(b) | | SCT Total for CEO #2(a) | | CAP to CEO #2(a)(b) | | SCT Total for CEO #3(a) | | CAP to CEO #3(a)(b) | | Average SCT for Other NEOs(a) | | Average CAP to Other NEOs(a)(b) | | Value of Initial Fixed $100 Investment Based on: Total Stockholder Return(c) | | Net Income (Loss) | |||||||||||
2026 | $ | 100,000 | $ | 100,000 | $ | 100,000 | $ | 46,529 | $ | 417,786 | $ | 417,786 | $ | 15.55 | $ | (13,383) | ||||||||||||||
2025T | $ | 50,000 | $ | 50,000 | $ | 50,000 | $ | 44,330 | $ | 235,565 | $ | 235,565 | $ | 21.79 | $ | 1,969 | ||||||||||||||
2024 | $ | 125,635 | $ | 125,635 | $ | 172,732 | $ | 202,162 | $ | 276,051 | $ | 276,051 | $ | 366,854 | $ | 366,854 | $ | 21.01 | $ | (6,677) | ||||||||||
| (a) | Our NEOs were: |
| CEO #1 | | CEO #2 | | CEO #3 | | Other NEOs | |
2026 | Mark R. Jundt | Daniel C. Philp | Elizabeth E. McShane, Werner F. Jansen | |||||
2025T | Mark R. Jundt | Daniel C. Philp | Elizabeth E. McShane, Werner F. Jansen | |||||
2024 | Mark R. Jundt(1) | Daniel C. Philp(1) | Randy D. Uglem(2) | Elizabeth E. McShane, Werner F. Jansen, Zackery A. Weber(4) |
| (1) | Messrs. Jundt and Philp were appointed to serve as Co-Chief Executive Officers effective July 1, 2024. |
| (2) | Mr. Uglem’s employment with the Company started on March 31, 2023 and ended on July 1, 2024. |
| (3) | Ms. McShane was appointed to serve as Chief Financial Officer, Treasurer and Secretary effective May 20, 2024. |
| (b) | Mr. Weber departed all positions with the Company on June 3, 2024. |
SEC rules require certain adjustments be made to the SCT totals to determine CAP as reported in the Pay Versus Performance Table. CAP does not necessarily represent cash and/or equity value transferred to the applicable NEO without restriction, but rather is a value calculated under applicable SEC rules. None of our NEOs participate in a pension plan; therefore, no adjustment from the SCT total related to pension value was made. Other than Mr. Philp (CEO#2 for 2025T and 2024), no other CEO or NEO had any equity compensation awards. A reconciliation of Total Compensation from the SCT to Compensation Actually Paid for Mr. Philp for 2024 and 2025T is shown below:
Adjustments | | 2026 | 2025 | | 2024 | ||||
Total Compensation from SCT | $ | 100,000 | $ | 50,000 | $ | 172,732 | |||
(Subtraction): SCT amounts of Stock and Option awards | - | - | (101,520) | ||||||
Addition: Fair value as of the end of the covered fiscal year of all awards granted during the covered fiscal year that are outstanding and unvested as of the end of the covered fiscal year | - | - | 130,950 | ||||||
Addition (Subtraction): Amount equal to the difference in fair value from the end of the prior fiscal year to the end of the covered fiscal year of any awards granted in any prior fiscal year that are outstanding and unvested as of the end of the covered fiscal year | 526 | 3,240 | - | ||||||
Addition: Fair value as of the vesting date, for awards that are granted and vest in the same year | - | - | - | ||||||
Addition (Subtraction): Amount equal to the difference in fair value from the end of the prior fiscal year to the vesting date of any awards granted in any prior fiscal year for which all applicable vesting conditions were satisfied at the end of or during the covered fiscal year | (53,997) | (8,910) | - | ||||||
(Subtraction): Amount equal to the fair value at the end of the prior fiscal year for any awards granted in any prior fiscal year that fail to meet the applicable vesting conditions during the covered fiscal year | - | - | - | ||||||
Addition: Dividends or other earnings paid on stock or option awards in the covered year prior to vesting if not otherwise included in the total compensation for the covered year | - | - | - | ||||||
Compensation Actually Paid (as calculated) | $ | 46,529 | $ | 44,330 | $ | 202,162 | |||
| (c) | Total stockholder return as calculated based on a fixed investment of one hundred dollars measured from the market close on December 31, 2021 (the last trading day of 2021) through and including the end of the fiscal year for each year reported in the table. |
| (a) | Our NEOs were: |
| CEO #1 | | CEO #2 | | CEO #3 | | Other NEOs | |
2026 | Mark R. Jundt | Daniel C. Philp | Elizabeth E. McShane, Werner F. Jansen | |||||
2025T | Mark R. Jundt | Daniel C. Philp | Elizabeth E. McShane, Werner F. Jansen | |||||
2024 | Mark R. Jundt(1) | Daniel C. Philp(1) | Randy D. Uglem(2) | Elizabeth E. McShane, Werner F. Jansen, Zackery A. Weber(4) |
| (1) | Messrs. Jundt and Philp were appointed to serve as Co-Chief Executive Officers effective July 1, 2024. |
| (2) | Mr. Uglem’s employment with the Company started on March 31, 2023 and ended on July 1, 2024. |
| (3) | Ms. McShane was appointed to serve as Chief Financial Officer, Treasurer and Secretary effective May 20, 2024. |
| (b) | Mr. Weber departed all positions with the Company on June 3, 2024. |
SEC rules require certain adjustments be made to the SCT totals to determine CAP as reported in the Pay Versus Performance Table. CAP does not necessarily represent cash and/or equity value transferred to the applicable NEO without restriction, but rather is a value calculated under applicable SEC rules. None of our NEOs participate in a pension plan; therefore, no adjustment from the SCT total related to pension value was made. Other than Mr. Philp (CEO#2 for 2025T and 2024), no other CEO or NEO had any equity compensation awards. A reconciliation of Total Compensation from the SCT to Compensation Actually Paid for Mr. Philp for 2024 and 2025T is shown below:
Adjustments | | 2026 | 2025 | | 2024 | ||||
Total Compensation from SCT | $ | 100,000 | $ | 50,000 | $ | 172,732 | |||
(Subtraction): SCT amounts of Stock and Option awards | - | - | (101,520) | ||||||
Addition: Fair value as of the end of the covered fiscal year of all awards granted during the covered fiscal year that are outstanding and unvested as of the end of the covered fiscal year | - | - | 130,950 | ||||||
Addition (Subtraction): Amount equal to the difference in fair value from the end of the prior fiscal year to the end of the covered fiscal year of any awards granted in any prior fiscal year that are outstanding and unvested as of the end of the covered fiscal year | 526 | 3,240 | - | ||||||
Addition: Fair value as of the vesting date, for awards that are granted and vest in the same year | - | - | - | ||||||
Addition (Subtraction): Amount equal to the difference in fair value from the end of the prior fiscal year to the vesting date of any awards granted in any prior fiscal year for which all applicable vesting conditions were satisfied at the end of or during the covered fiscal year | (53,997) | (8,910) | - | ||||||
(Subtraction): Amount equal to the fair value at the end of the prior fiscal year for any awards granted in any prior fiscal year that fail to meet the applicable vesting conditions during the covered fiscal year | - | - | - | ||||||
Addition: Dividends or other earnings paid on stock or option awards in the covered year prior to vesting if not otherwise included in the total compensation for the covered year | - | - | - | ||||||
Compensation Actually Paid (as calculated) | $ | 46,529 | $ | 44,330 | $ | 202,162 | |||
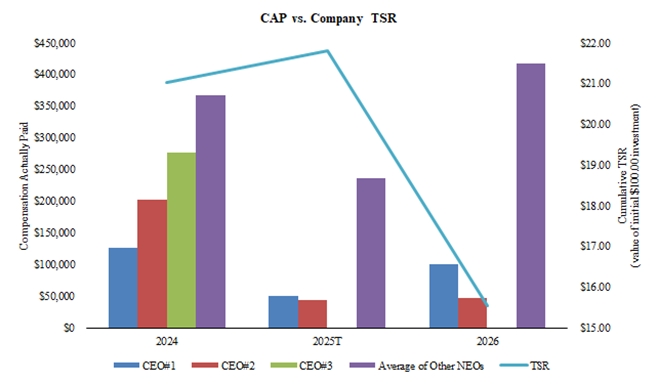
| (1) | Total stockholder return in the above chart reflects the cumulative return of $100.00 as if invested on December 31, 2021, including reinvestment of any dividends. |