Pay versus Performance
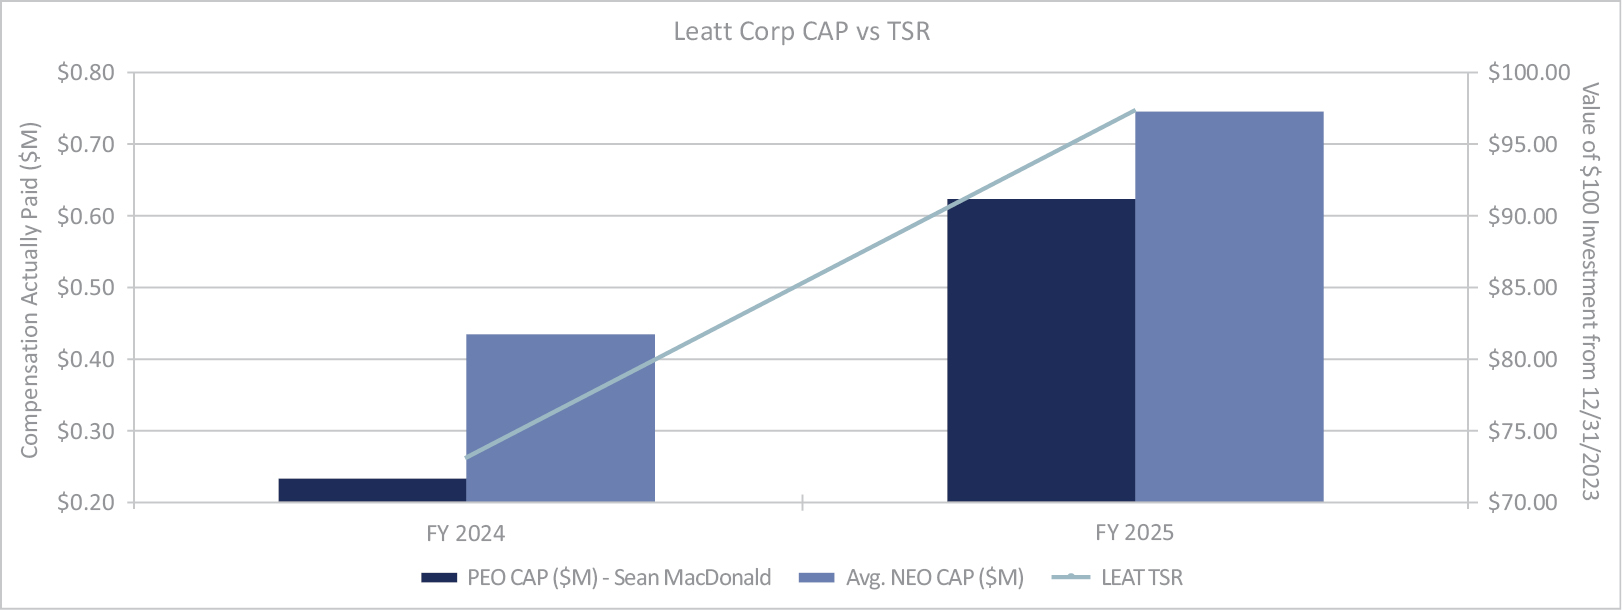
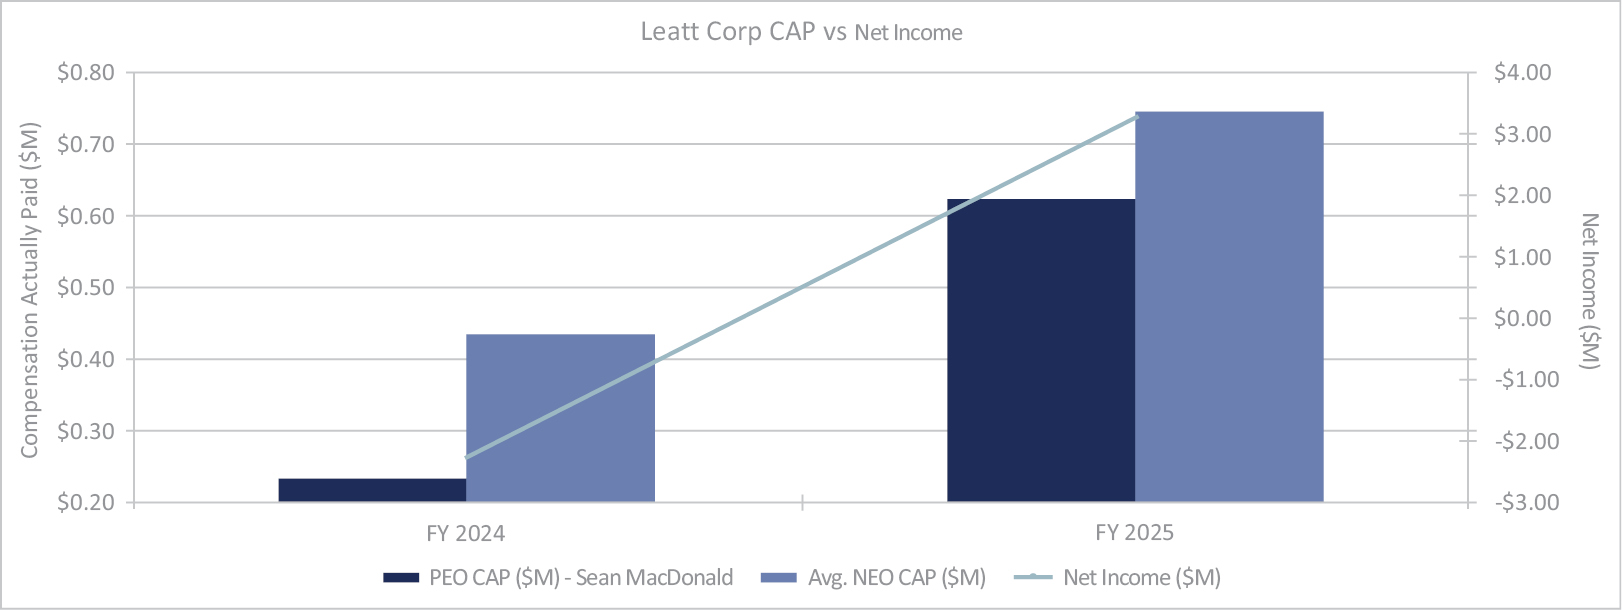
Pursuant to Section 953(a) of the Dodd-Frank Wall Street Reform and Consumer Protection Act, and Item 402(v) of Regulation S-K, we are providing the following information regarding “compensation actually paid”, as defined in Item 402(v). In accordance with SEC rules, the “compensation actually paid” amounts shown in the table below for each applicable year reflect certain adjustments to the values reported in the Summary of Compensation Table as described in the footnotes to the following table.
In accordance with the transitional relief under the SEC rules for smaller reporting companies, only two years of information is required as this is the Company’s first year of disclosure under Item 402(v) of Regulation S-K.
| Year | Summary | Compensation | Average | Average | Value of | Net Income | |||||||||||||
| 2025 | $ | 623,734 | $ | 623,512 | $ | 746,591 | $ | 746,443 | $ | 97.38 | $ | 3.26 |
| ||||||
| 2024 | $ | 487,756 | $ | 231,762 | $ | 519,130 | $ | 433,799 | $ | 73.30 | $ | (2.20 | ) | ||||||
____________
(1) For each year shown, the first PEO was the Chief Executive Officer, Sean Macdonald. The values reflected in this column reflect the “Total Compensation” paid to Mr. Macdonald, the Company’s first Principal Executive Officer, as set forth in the Summary of Compensation Table.
(2) The dollar amounts reported in this column represent the amount of “compensation actually paid” to Mr. Macdonald, as computed in accordance with Item 402(v) of Regulation S-K. The dollar amounts do not reflect the actual amount of compensation earned by or paid to Mr. Macdonald during the applicable year. In accordance with the requirements of Item 402(v) of Regulation S-K, the following adjustments were made to determine the “compensation actually paid” amounts reported above for Mr. Macdonald:
| Reconciliation of Summary of Compensation Table Total to Compensation | 2024 | 2025 | ||||||
| Summary of Compensation Table Total | $ | 487,756 |
| $ | 623,734 |
| ||
| Less: Grant Date Fair Value of Option and Stock Awards Granted in Fiscal Year |
| (70,350 | ) |
| (153,785 | ) | ||
| Plus: Fair Value of Awards Granted during Applicable Fiscal Year that Remain Unvested as of Applicable Fiscal Year End, Determined as of Applicable Fiscal Year End |
| 0 |
|
| 0 |
| ||
| Plus: Fair Value of Awards Granted During the Applicable Fiscal Year that Vested During the Applicable Fiscal Year, Determined as of the |
| 0 |
|
| 0 |
| ||
| Plus (Less): Adjustment for Awards Granted During a Prior Fiscal Year that were Outstanding and Unvested as of the Applicable Fiscal Year End, Determined Based on the Change in ASC 718 Fair Value from Prior Fiscal year End to the Applicable Fiscal Year End |
| (167,344 | ) |
| 120,750 |
| ||
| Plus (Less): Adjustment for Awards Granted During a Prior Fiscal Year that Vested During the Applicable Fiscal year, Determined based on the Change in ASC 718 Fair Value from the Prior Fiscal Year End to the Vesting Date |
| (18,300 | ) |
| 32,813 |
| ||
| Less: ASC 718 Fair Value of Awards Granted During a Prior Fiscal Year that were Forfeited During the Applicable Fiscal Year, determined as of the Prior Fiscal Year End |
| 0 |
|
| 0 |
| ||
| Plus: Dividends or Other Earnings Paid During the Applicable Fiscal year |
| 0 |
|
| 0 |
| ||
| Compensation Actually Paid | $ | 231,762 |
| $ | 623,512 |
| ||
____________
(3) For 2025 the non-PEO NEO is Dr Christopher James Leatt. For 2024 the non-PEO NEOs are Dr Christopher James Leatt and Todd Repsher. The values reflected in this column reflect the “Total Compensation” paid to the non-PEO NEOs in the applicable year, as set forth in the Summary of Compensation Table for the applicable year.
(4) The dollar amounts reported in column (e) represent the average amount of “compensation actually paid” to the non-PEO NEOs, as computed in accordance with Item 402(v) of Regulation S-K. The dollar amounts do not necessarily reflect the actual average amount of compensation earned by or paid to such person during the applicable year. In accordance with the requirements of Item 402(v) of Regulation S-K, the following adjustments were made to average total compensation for the non-PEO NEO for each year to determine the compensation actually paid:
| Reconciliation of Average Summary of Compensation Table Totals for non-PEO | 2024 | 2025 | ||||||
| Average Summary of Compensation Table Total | $ | 519,130 |
| $ | 746,591 |
| ||
| Less: Grant Date Fair Value of Option and Stock Awards Granted in Fiscal Year |
| (23,450 | ) |
| (102,523 | ) | ||
| Plus: Fair Value of Awards Granted during Applicable Fiscal Year that Remain Unvested as of Applicable Fiscal Year End, Determined as of Applicable Fiscal Year End |
| 0 |
|
| 0 |
| ||
| Plus: Fair Value of Awards Granted During the Applicable Fiscal Year that Vested During the Applicable Fiscal Year, Determined as of the |
| 0 |
|
| 0 |
| ||
| Plus (Less): Adjustment for Awards Granted During a Prior Fiscal Year that were Outstanding and Unvested as of the Applicable Fiscal Year End, Determined Based on the Change in ASC 718 Fair Value from Prior Fiscal year End to the Applicable Fiscal Year End |
| (55,781 | ) |
| 80,500 |
| ||
| Reconciliation of Average Summary of Compensation Table Totals for non-PEO | 2024 | 2025 | |||||
| Plus (Less): Adjustment for Awards Granted During a Prior Fiscal Year that Vested During the Applicable Fiscal year, Determined based on the Change in ASC 718 Fair Value from the Prior Fiscal Year End to the Vesting Date |
| (6,100 | ) |
| 21,875 | ||
| Less: ASC 718 Fair Value of Awards Granted During a Prior Fiscal Year that were Forfeited During the Applicable Fiscal Year, determined as of the Prior Fiscal Year End |
| 0 |
|
| 0 | ||
| Plus: Dividends or Other Earnings Paid During the Applicable Fiscal year |
| 0 |
|
| 0 | ||
| Average Compensation Actually Paid | $ | 433,799 |
| $ | 746,443 | ||
____________
(5) The TSR value listed in each year reflects what the cumulative value of $100 would be if invested on December 31, 2023.
(6) The dollar amounts reported represent the amount of net income reflected in the Company’s audited financial statements for the applicable year.
| [1] | For each year shown, the first PEO was the Chief Executive Officer, Sean Macdonald. The values reflected in this column reflect the “Total Compensation” paid to Mr. Macdonald, the Company’s first Principal Executive Officer, as set forth in the Summary of Compensation Table. | ||||||||||||||||||||||||||||||||||||||||||||||||||||||||||||||||||||||||||||||||||||||||||||||
| [2] | The dollar amounts reported in this column represent the amount of “compensation actually paid” to Mr. Macdonald, as computed in accordance with Item 402(v) of Regulation S-K. The dollar amounts do not reflect the actual amount of compensation earned by or paid to Mr. Macdonald during the applicable year. In accordance with the requirements of Item 402(v) of Regulation S-K, the following adjustments were made to determine the “compensation actually paid” amounts reported above for Mr. Macdonald:
|
||||||||||||||||||||||||||||||||||||||||||||||||||||||||||||||||||||||||||||||||||||||||||||||
| [3] | For 2025 the non-PEO NEO is Dr Christopher James Leatt. For 2024 the non-PEO NEOs are Dr Christopher James Leatt and Todd Repsher. The values reflected in this column reflect the “Total Compensation” paid to the non-PEO NEOs in the applicable year, as set forth in the Summary of Compensation Table for the applicable year. | ||||||||||||||||||||||||||||||||||||||||||||||||||||||||||||||||||||||||||||||||||||||||||||||
| [4] | The dollar amounts reported in column (e) represent the average amount of “compensation actually paid” to the non-PEO NEOs, as computed in accordance with Item 402(v) of Regulation S-K. The dollar amounts do not necessarily reflect the actual average amount of compensation earned by or paid to such person during the applicable year. In accordance with the requirements of Item 402(v) of Regulation S-K, the following adjustments were made to average total compensation for the non-PEO NEO for each year to determine the compensation actually paid:
|
||||||||||||||||||||||||||||||||||||||||||||||||||||||||||||||||||||||||||||||||||||||||||||||
| [5] | The TSR value listed in each year reflects what the cumulative value of $100 would be if invested on December 31, 2023. | ||||||||||||||||||||||||||||||||||||||||||||||||||||||||||||||||||||||||||||||||||||||||||||||
| [6] | The dollar amounts reported represent the amount of net income reflected in the Company’s audited financial statements for the applicable year. | ||||||||||||||||||||||||||||||||||||||||||||||||||||||||||||||||||||||||||||||||||||||||||||||