PAY VERSUS PERFORMANCE
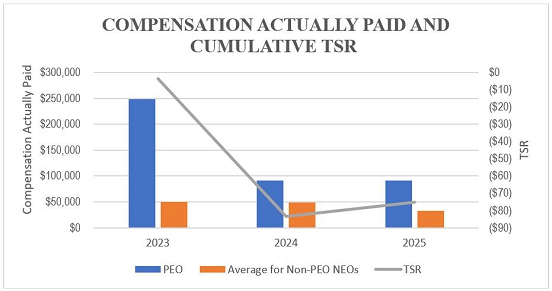
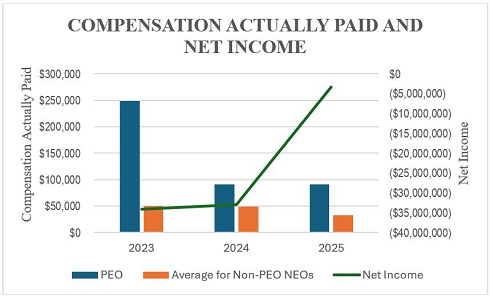
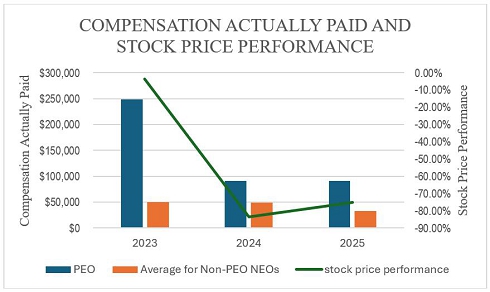
As required by Section 953(a) of the Dodd-Frank Wall Street Reform and Consumer Protection Act, and Item 402(v) of Regulation S- K, we are providing the following information about the relationship of “compensation actually paid” (“CAP”) to our principal executive officer (“PEO”) and other named executive officers (“Non-PEO NEOS”) and our performance.
Pay Versus Performance Table
As required by Section 953(a) of the Dodd-Frank Wall Street Reform and Customer Protection Act, and item 402(v) of Regulation S-K promulgated under the Exchange Act, we are providing the following information about the relationship between executive compensation actually paid and certain financial performance of the Company.
For purposes of the tables below, the principal executive officer (“PEO”) and non-PEO named executive officers for 2025, 2024 and 2023 are the following:
| Year | PEO | Non-PEO named executive officers | ||
| 2025 | Hu Li | Ming Yi, Peng Lei and Ting Ouyang | ||
| 2024 | Shanchun Huang, Hu Li | Ming Yi, Peng Lei | ||
| 2023 | Shanchun Huang | Ming Yi, Yongke Xue, Peng Lei |
| SCT Total for PEO #1 (Shanchun Huang) (1) | CAP to PEO #1 (2) | SCT Total for PEO #2 (Hu Li) (3) | CAP to PEO #2 (4) | Avg Summary Compensation Table for Non-PEO NEOs (5) | Avg Compensation Actually Paid to Non-PEO NEOs (6) | Value of Initial Fixed $100 Investment Based On Total Shareholder Return (7) | Net Income (Loss) (8) | |||||||||||||||||||||||||
| Year | ($) | ($) | ($) | ($) | ($) | ($) | ($) | ($) | ||||||||||||||||||||||||
| (a) | (b1) | (c1) | (b1) | (c2) | (d) | (e) | (f) | (g) | ||||||||||||||||||||||||
| 2023 | 248,001 | 248,001 | 49,924 | 49,924 | (3.76 | ) | (34,124,499 | ) | ||||||||||||||||||||||||
| 2024 | 90,740 | 90,740 | 49,389 | 49,389 | 48,967 | 48,967 | (83.43 | ) | (32,995,434 | ) | ||||||||||||||||||||||
| 2025 | 91,254 | 91,254 | 32,707 | 32,707 | (75.32 | ) | (3,341,365 | ) | ||||||||||||||||||||||||
| (1) | The dollar amounts reported in column (b1) represent the amounts of total compensation reported for PEO #1 (Mr. Shanchun Huang) for each corresponding year in the “Total” column of the Summary Compensation Table. |
| (2) | The dollar amounts reported in column (c1) represent the amount of “compensation actually paid” to PEO #1 (Mr. Shanchun Huang), as computed in accordance with Item 402(v) of Regulation S-K. No adjustments were required to be made to the PEO’s total compensation for each year to determine the compensation actually paid pursuant to the requirements of Item 402(v) of Regulation S-K. |
| (3) | The dollar amounts reported in column (b2) represent the amounts of total compensation reported for PEO #2 (Mr. Hu Li) for each corresponding year in the “Total” column of the Summary Compensation Table. |
| (4) | The dollar amounts reported in column (c2) represent the amount of “compensation actually paid” to PEO #2 (Mr. Hu Li), as computed in accordance with Item 402(v) of Regulation S-K. No adjustments were required to be made to the PEO’s total compensation for each year to determine the compensation actually paid pursuant to the requirements of Item 402(v) of Regulation S-K. |
| (5) | The dollar amounts reported in column (d) represent the average of the amounts reported for the Company’s non-PEO named executive officers as a group in the “Total” column of the Summary Compensation Table in each applicable year. |
| (6) | The dollar amounts reported in column (e) represent the average amount of “compensation actually paid” to the non-PEO named executive officers as a group, as computed in accordance with Item 402(v) of Regulation S-K. No adjustments were required to be made to average total compensation for the non-PEO named executive officers as a group for each year to determine the compensation actually paid pursuant to the requirements of Item 402(v) of Regulation S-K. |
| (7) | Cumulative total shareholder return (“TSR”) is calculated by dividing the sum of the cumulative amount of dividends for the measurement period, assuming dividend reinvestment, and the difference between the Company’s share price at the end and the beginning of the measurement period by the Company’s share price at the beginning of the measurement period. |
| (8) | The dollar amounts reported represent the amount of net loss reflected in the Company’s audited financial statements for the applicable year. |
| [1] | The dollar amounts reported in column (d) represent the average of the amounts reported for the Company’s non-PEO named executive officers as a group in the “Total” column of the Summary Compensation Table in each applicable year. |
| [2] | The dollar amounts reported in column (e) represent the average amount of “compensation actually paid” to the non-PEO named executive officers as a group, as computed in accordance with Item 402(v) of Regulation S-K. No adjustments were required to be made to average total compensation for the non-PEO named executive officers as a group for each year to determine the compensation actually paid pursuant to the requirements of Item 402(v) of Regulation S-K. |
| [3] | Cumulative total shareholder return (“TSR”) is calculated by dividing the sum of the cumulative amount of dividends for the measurement period, assuming dividend reinvestment, and the difference between the Company’s share price at the end and the beginning of the measurement period by the Company’s share price at the beginning of the measurement period. |
| [4] | The dollar amounts reported represent the amount of net loss reflected in the Company’s audited financial statements for the applicable year. |
| [5] | The dollar amounts reported in column (b1) represent the amounts of total compensation reported for PEO #1 (Mr. Shanchun Huang) for each corresponding year in the “Total” column of the Summary Compensation Table. |
| [6] | The dollar amounts reported in column (c1) represent the amount of “compensation actually paid” to PEO #1 (Mr. Shanchun Huang), as computed in accordance with Item 402(v) of Regulation S-K. No adjustments were required to be made to the PEO’s total compensation for each year to determine the compensation actually paid pursuant to the requirements of Item 402(v) of Regulation S-K. |
| [7] | The dollar amounts reported in column (b2) represent the amounts of total compensation reported for PEO #2 (Mr. Hu Li) for each corresponding year in the “Total” column of the Summary Compensation Table. |
| [8] | The dollar amounts reported in column (c2) represent the amount of “compensation actually paid” to PEO #2 (Mr. Hu Li), as computed in accordance with Item 402(v) of Regulation S-K. No adjustments were required to be made to the PEO’s total compensation for each year to determine the compensation actually paid pursuant to the requirements of Item 402(v) of Regulation S-K. |