Exhibit 99.3
| Investor Update H1 2026 |

| Disclaimer This presentation may contain “forward-looking statements” which include, but are not limited to, statements regarding future events and other statements that are not historical facts. Forward-looking statements are generally accompanied by words such as “believe,” “may,” “will,” “estimate,” “continue,” “anticipate,” “intend,” “expect,” “should,” “would,” “plan,” “predict,” “potential,” “seem,” “seek,” “future,” “outlook” and similar expressions that predict or indicate future events or trends or that are not statements of historical matters. For example, Swvl Holdings Corp (“Swvl”) is using forward-looking statements when it discusses the benefits and uses of its products and platform; its product and market growth potential; that by prioritizing recurring revenue, it aims to set a foundation for predictable and profitable growth while reducing the impact of market seasonality; and that it continues to aim at expanding its dollar-pegged revenue to reduce its exposure to volatility in foreign currencies. These statements are based on the current expectations of Swvl’s management and are not predictions of actual performance. These forward-looking statements must not be relied on by any investor as a guarantee, assurance, prediction, or definitive statement of fact or probability. Actual results and outcomes could differ materially for a variety of reasons, including, among others, general economic, political and business conditions; the ability of Swvl to execute its growth strategy, manage growth profitably and retain its key employees; competition with other companies in the mobility industry; Swvl’s limited operating history and lack of experience as a public company; recent implementation of certain policies and procedures to ensure compliance with applicable laws and regulations, including with respect to anti-bribery, anti-corruption, and cyber protection; the risk that Swvl is not able to execute its portfolio optimization plan; the risk that Swvl is unable to attract and retain consumers and qualified drivers and other high quality personnel; the risk that Swvl is unable to protect and enforce its intellectual property rights; the risk that Swvl is unable to determine rider demand to develop new offerings on its platform; the difficulty of obtaining required registrations, licenses, permits or approvals in jurisdictions in which Swvl currently operates or may in the future operate; the fact that Swvl currently operates in and intends to expand into jurisdictions that are, or have been, characterized by political instability, may have inadequate or limited regulatory and legal frameworks and may have limited, if any, treaties or other arrangements in place to protect foreign investment or involvement; the risk that Swvl’s drivers could be classified as employees, workers or quasi-employees in the jurisdictions they operate; the fact that Swvl has operations in countries known to experience high levels of corruption and is subject to territorial anti-corruption laws in these jurisdictions; the ability of Swvl to maintain the listing of its securities on Nasdaq; Swvl’s acquisitions may not be beneficial to Swvl as a result of the cost of integrating geographically disparate operations and the diversion of management’s attention from its existing business, among other things; and other risks that will be detailed from time to time in filings with the U.S. Securities and Exchange Commission. The foregoing list of risk factors is not exhaustive. There may be additional risks that Swvl presently does not know or that Swvl currently believes are immaterial that could also cause actual results to differ from those contained in forward-looking statements. In addition, forward-looking statements provide Swvl’s expectations, plans or forecasts of future events and views as of the date of this communication. Swvl anticipates that subsequent events and developments will cause Swvl’s assessments and projections to change. However, while Swvl may elect to update these forward-looking statements in the future, Swvl specifically disclaims any obligation to do so. These forward-looking statements should not be relied upon as representing Swvl’s assessments as of any date subsequent to the date of this presentation. Accordingly, undue reliance should not be placed upon the forward-looking statements. 1/ SWVL Holdings Corp | NASDAQ: SWVL | H1 2026 Update |
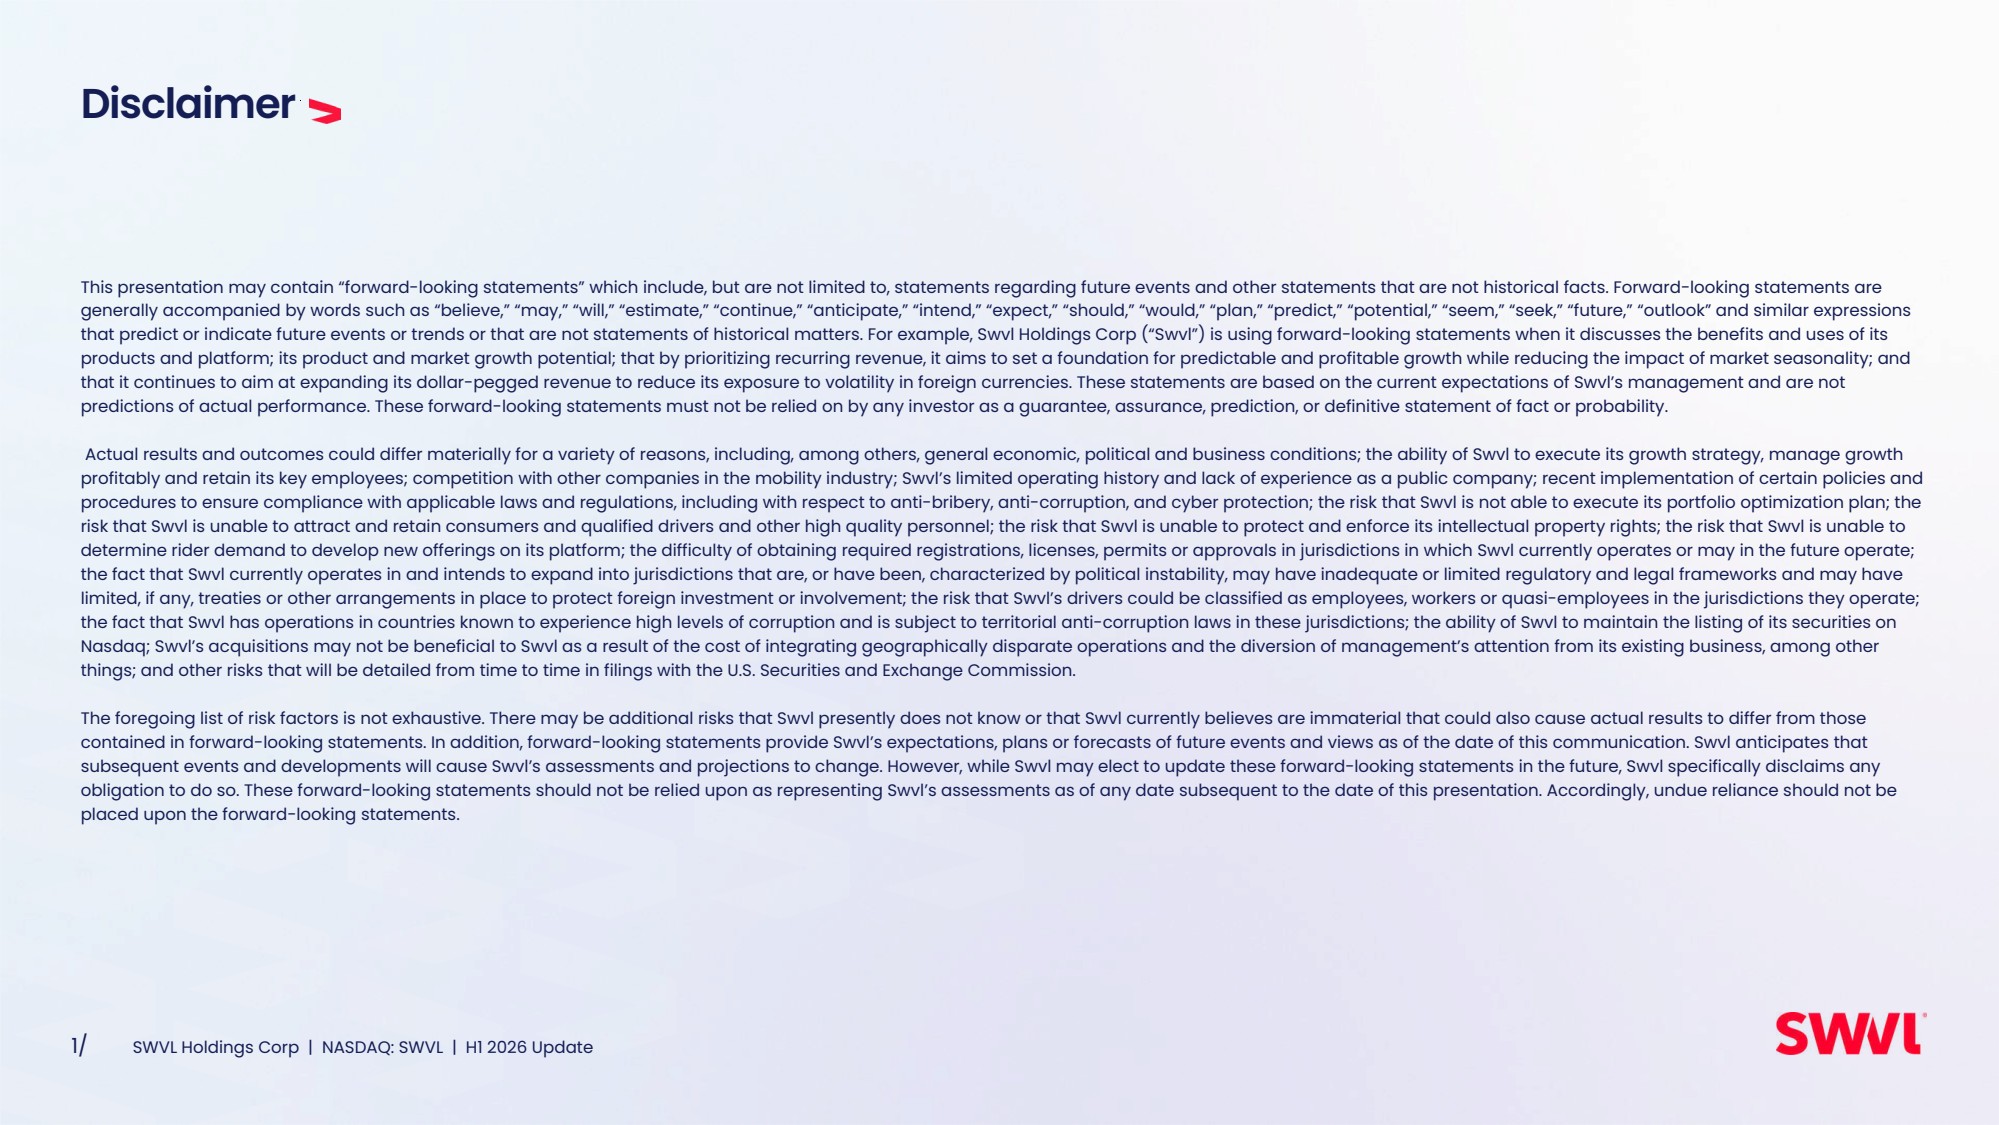
| Business at a Glance One platform, complete control, measurable ROI — route-optimization software (SaaS) paired with end-to-end managed mobility (MaaS). Rider app, operator dashboard & captain app Mobility Interface Suite Driver vetting, geo-monitoring, incident reporting Safety, Compliance & Monitoring Vehicle rostering, smart dispatch, max utilization Fleet Management System SaaS / white-label API, identity & access control Platform & Integrations KPIs, SLA tracking, cost-per-ride analytics Data & Business Intelligence 2/ Education Hubs BPO & Call Center Corporate Offices Warehouses & Logistics City to City Travelers Manufacturing & Industrial Hospitals & Healthcare Shuttle & Feeder Networks Route design & network planning · captain onboarding · analytics & SLA reporting Asset-light vehicle sourcing · on-ground QA · integrated Apps · 24/7 support Route optimization, demand prediction, dynamic pricing AI & Network Intelligence Platform Capabilities Software (SaaS) Managed Mobility (MaaS) Delivery Model SLA - Service level agreement defining metrics, performance standards and expectations of service being provided by the supplier to the customer API - Application Programming Interface which are a set of rules and protocols that enable software applications to communicate with each other SWVL Holdings Corp | NASDAQ: SWVL | H1 2026 Update |
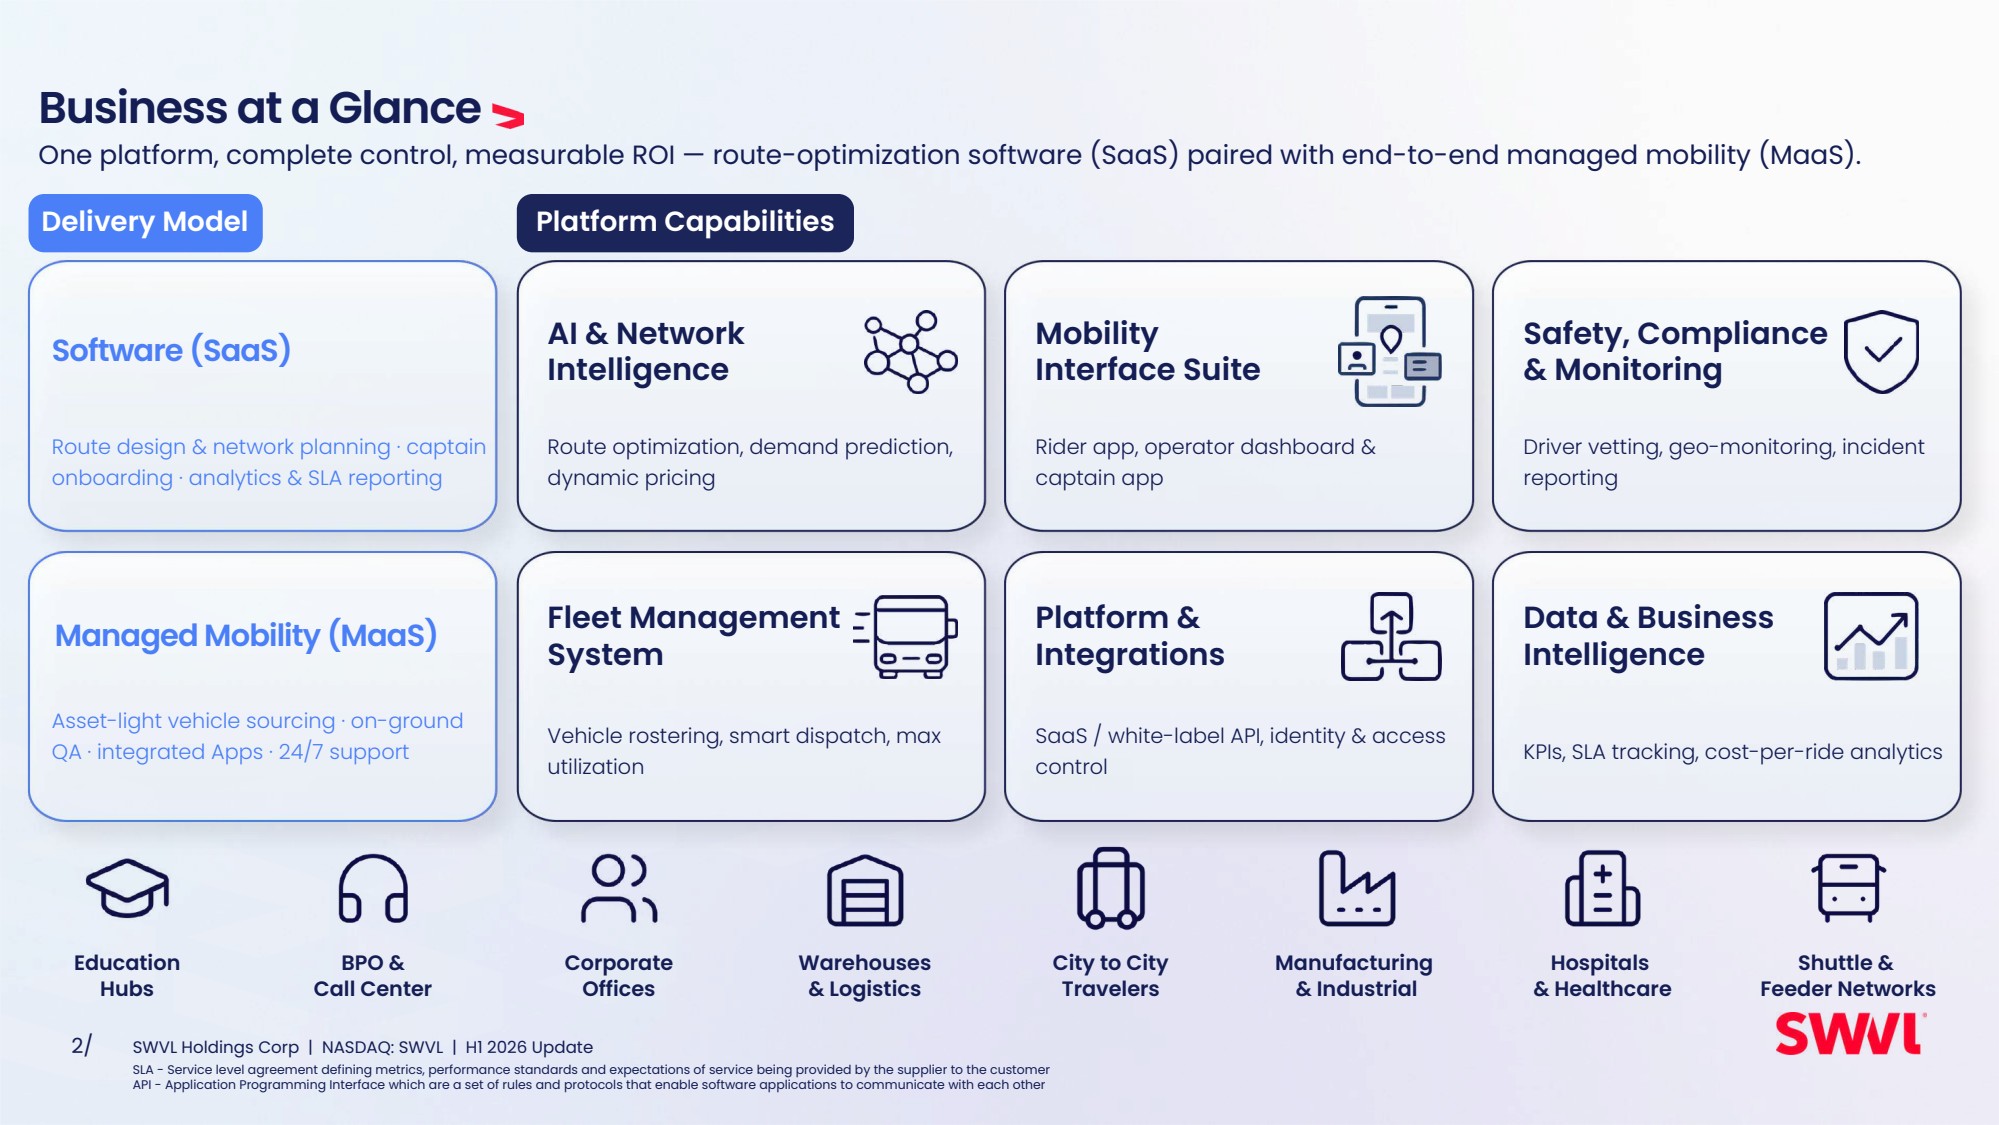
| H1 2026: results Dollar Pegged-Revenue 44% Dollar-pegged revenue reached 44% of total revenue, up from 34% in H1'25. Revenue Growth 59% Revenue grew to $16.22M, up from $10.19M in H1'25. Recurring Revenue 88% Recurring revenue reached 88% of total revenue, up from 85% in H1'25 Gross Profit 35% Gross profit expanded to $2.95M, up from $2.19M in H1'25. Net Dollar Retention 123% Net dollar retention of 123% reflects expansion of H1'25 corporate clients into H1'26, net of churn (H1'25: 118%) Operating Loss $0.57M Operating loss $0.57M vs $0.42M in H1'25; margin -3.5% vs -4.1% (+0.6pp) Six months ended June 30 2026, versus, June 30 2025 Compounding revenue growth with improving operating Margin. Swvl grew revenue by 59% in H1 2026 over H1 2025, with Dollar Pegged Revenue reaching 44% of total revenue. 3/ SWVL Holdings Corp | NASDAQ: SWVL | H1 2026 Update Please see definitions in slide number 24. |
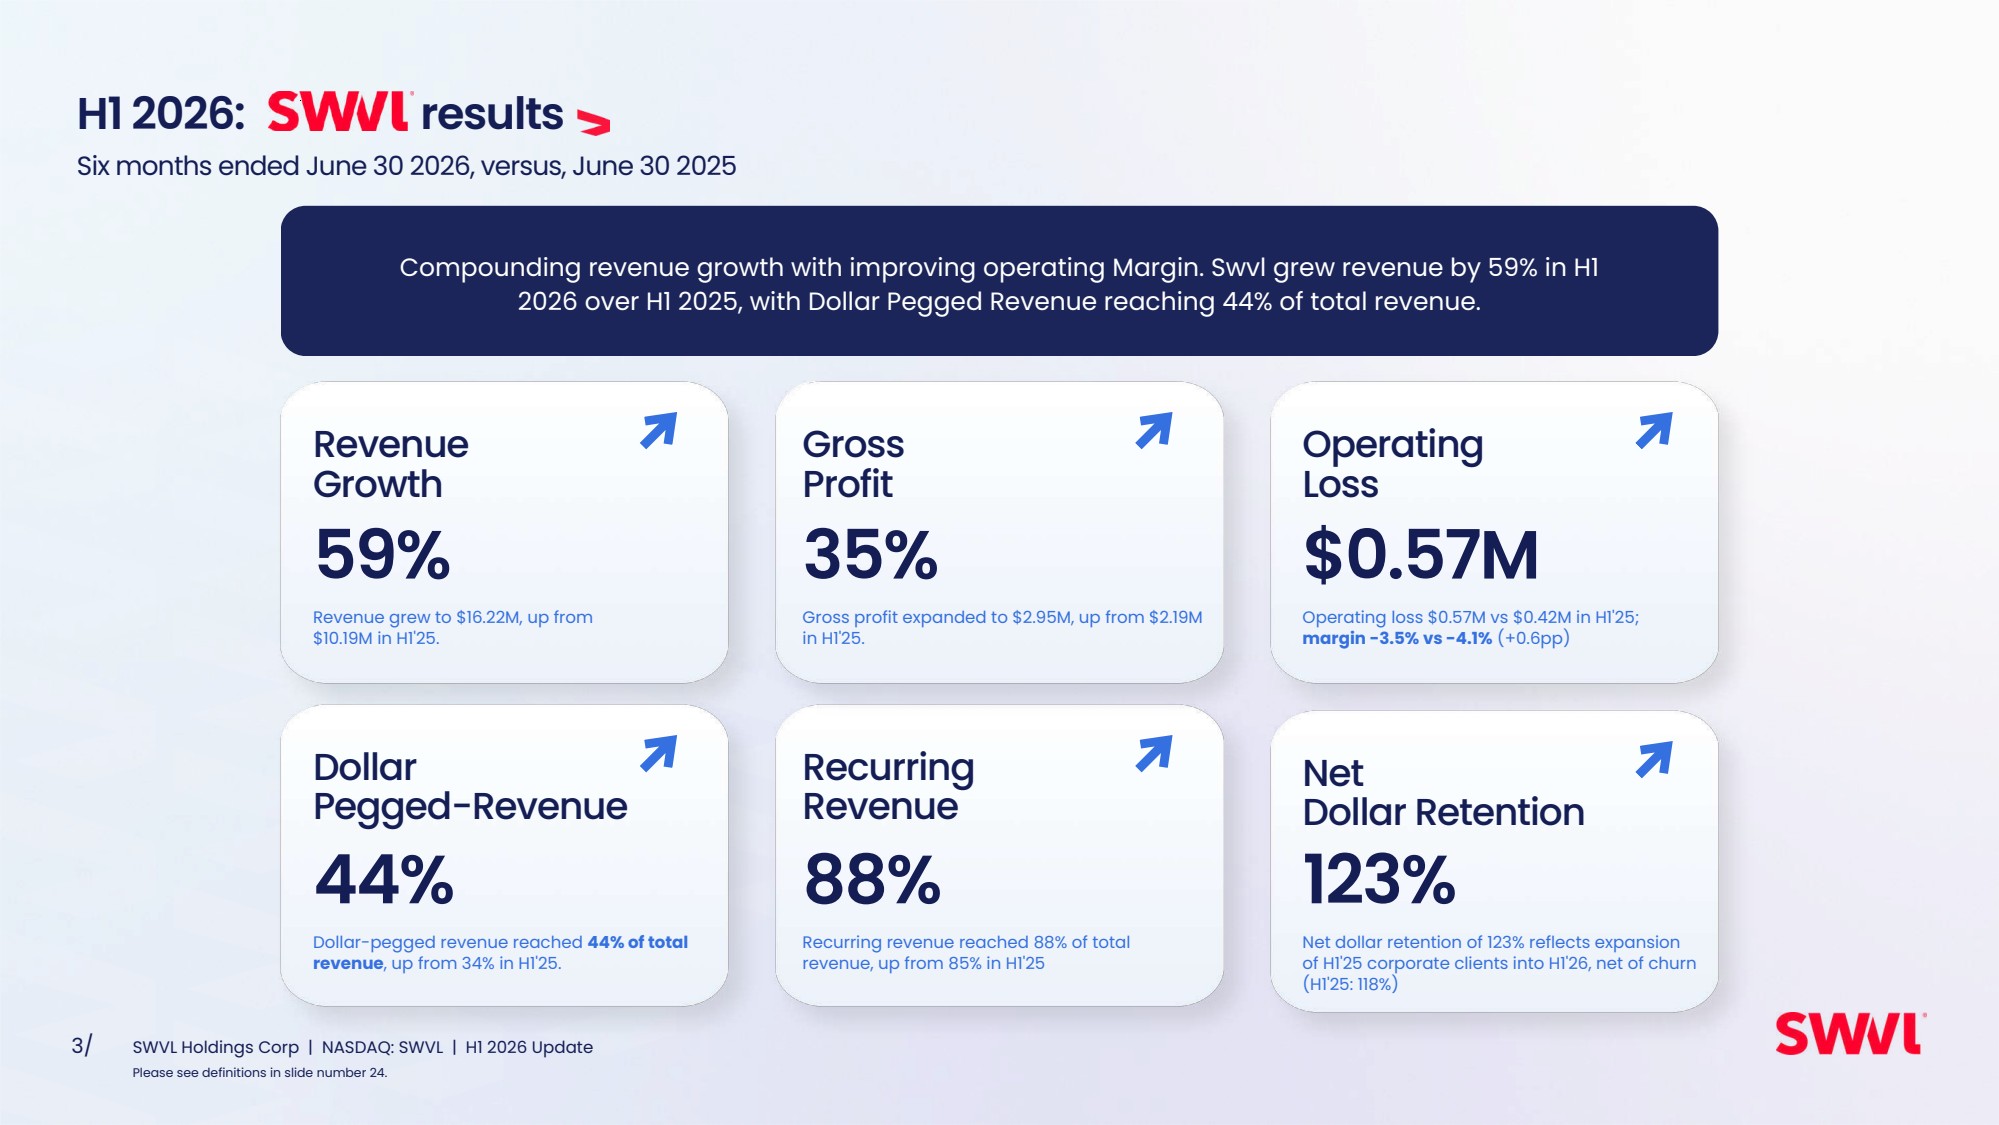
| H1'24 H1'25 H1'26 Financial Performance Revenue Gross Profit $16.22M $10.19M $8.07M 26% 59% 26% 35% H1'24 H1'25 H1'26 $1.74M $2.95M $2.19M 4/ SWVL Holdings Corp | NASDAQ: SWVL | H1 2026 Update |
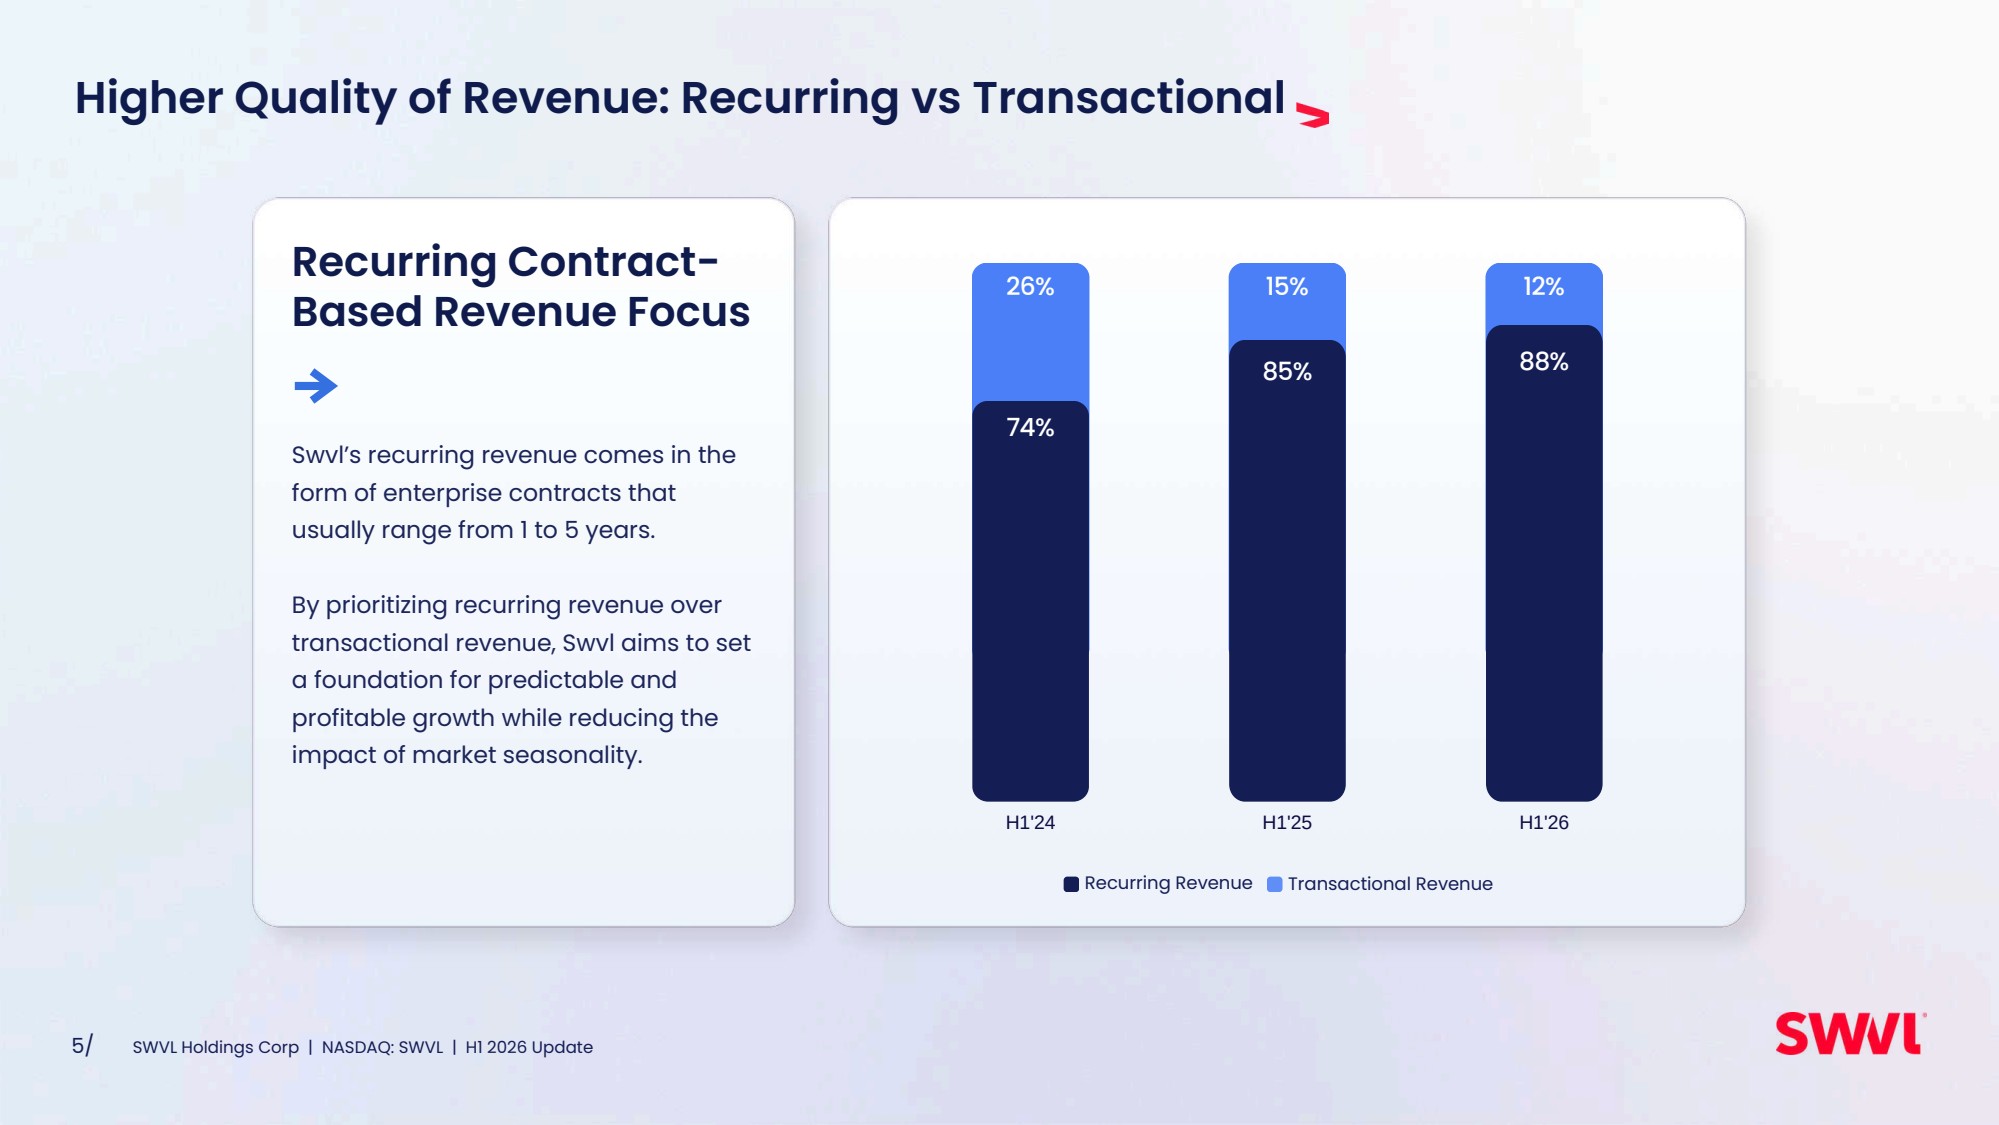
| Higher Quality of Revenue: Recurring vs Transactional 5/ SWVL Holdings Corp | NASDAQ: SWVL | H1 2026 Update Recurring Revenue Transactional Revenue 74% 26% H1'24 85% 15% H1'25 88% 12% H1'26 Recurring Contract-Based Revenue Focus Swvl’s recurring revenue comes in the form of enterprise contracts that usually range from 1 to 5 years. By prioritizing recurring revenue over transactional revenue, Swvl aims to set a foundation for predictable and profitable growth while reducing the impact of market seasonality. |
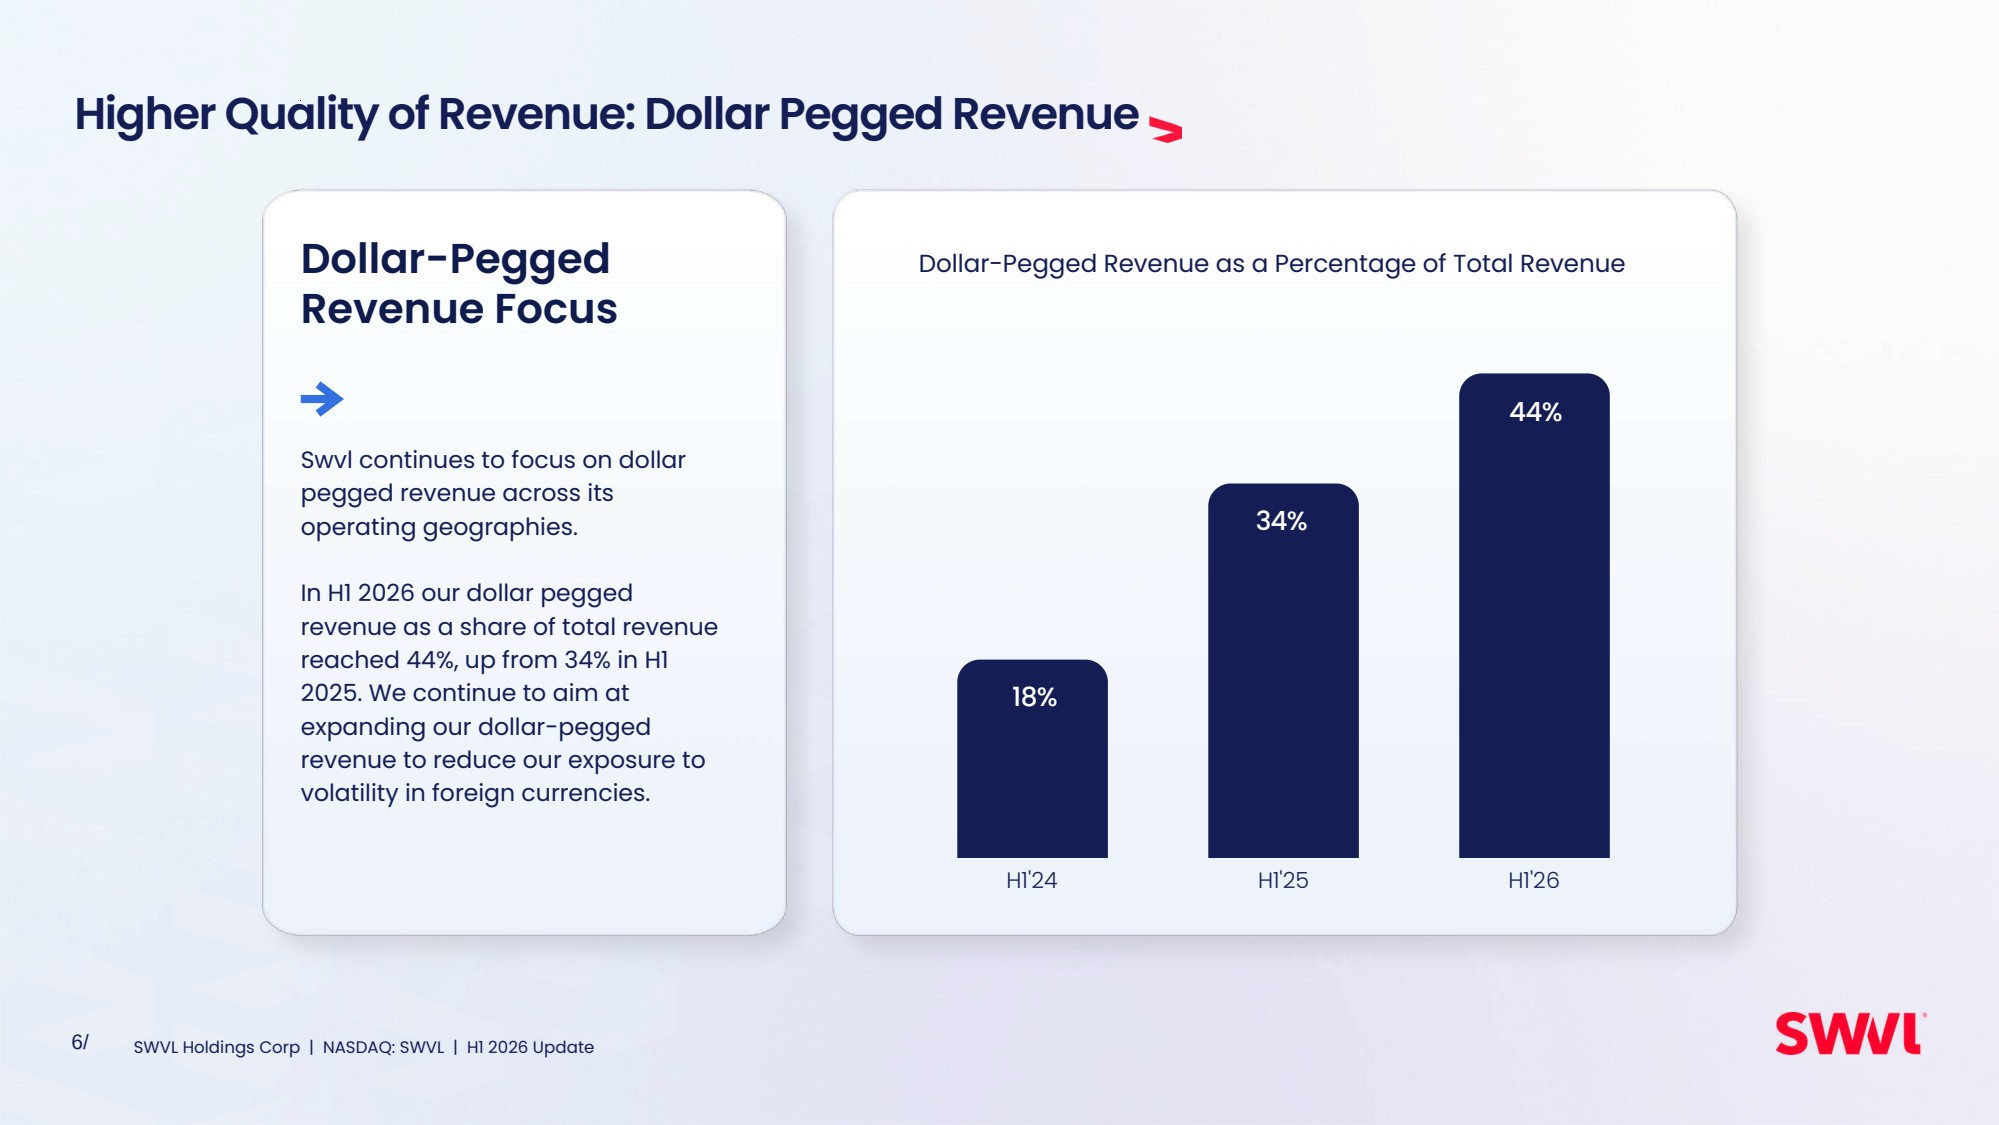
| Higher Quality of Revenue: Dollar Pegged Revenue 6/ Dollar-Pegged Revenue Focus Swvl continues to focus on dollar pegged revenue across its operating geographies. In H1 2026 our dollar pegged revenue as a share of total revenue reached 44%, up from 34% in H1 2025. We continue to aim at expanding our dollar-pegged revenue to reduce our exposure to volatility in foreign currencies. Dollar-Pegged Revenue as a Percentage of Total Revenue H1'24 H1'25 H1'26 18% 34% 44% SWVL Holdings Corp | NASDAQ: SWVL | H1 2026 Update |
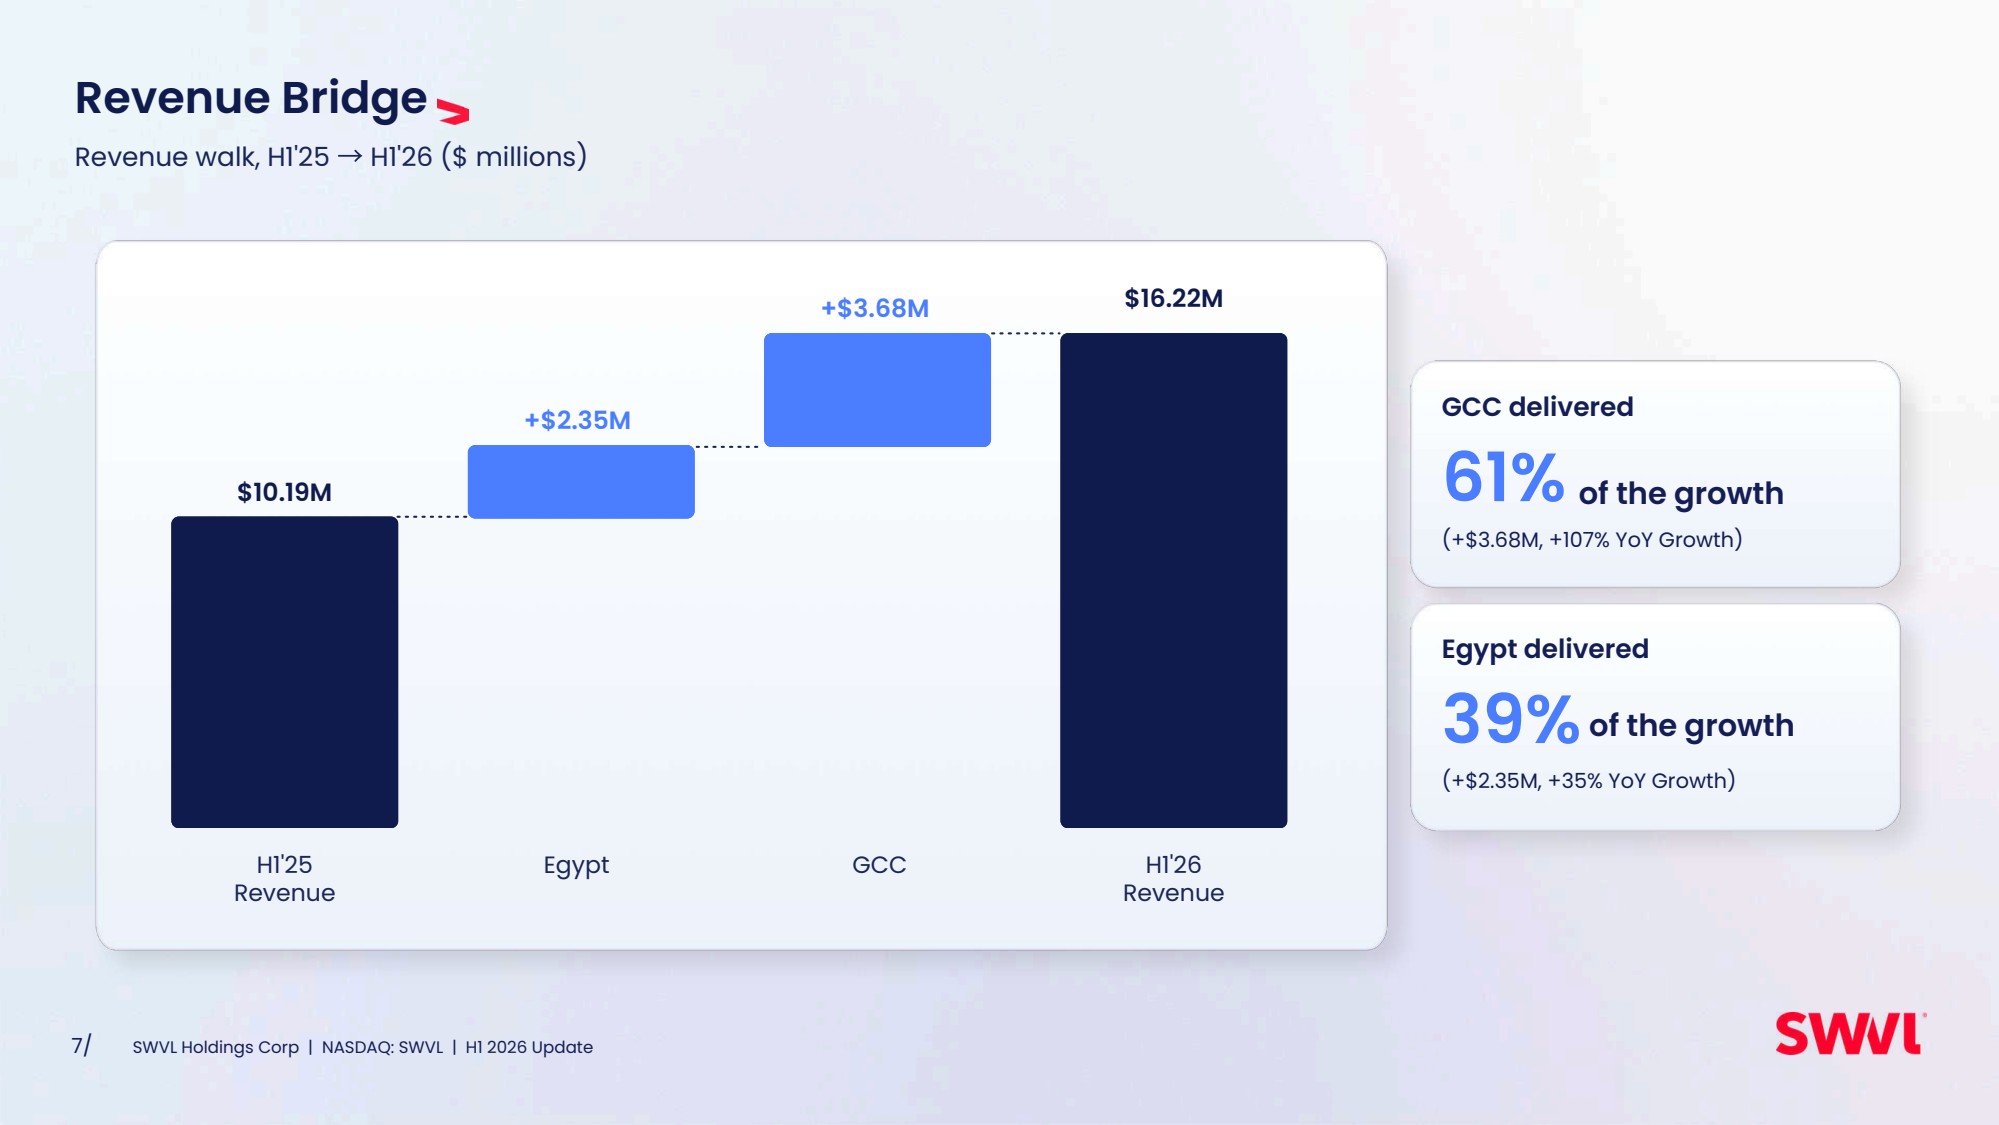
| Revenue Bridge Revenue walk, H1'25 → H1'26 ($ millions) $10.19M +$2.35M +$3.68M $16.22M 7/ SWVL Holdings Corp | NASDAQ: SWVL | H1 2026 Update 61% 39% H1'25 Revenue Egypt GCC H1'26 Revenue (+$3.68M, +107% YoY Growth) GCC delivered (+$2.35M, +35% YoY Growth) Egypt delivered of the growth of the growth |
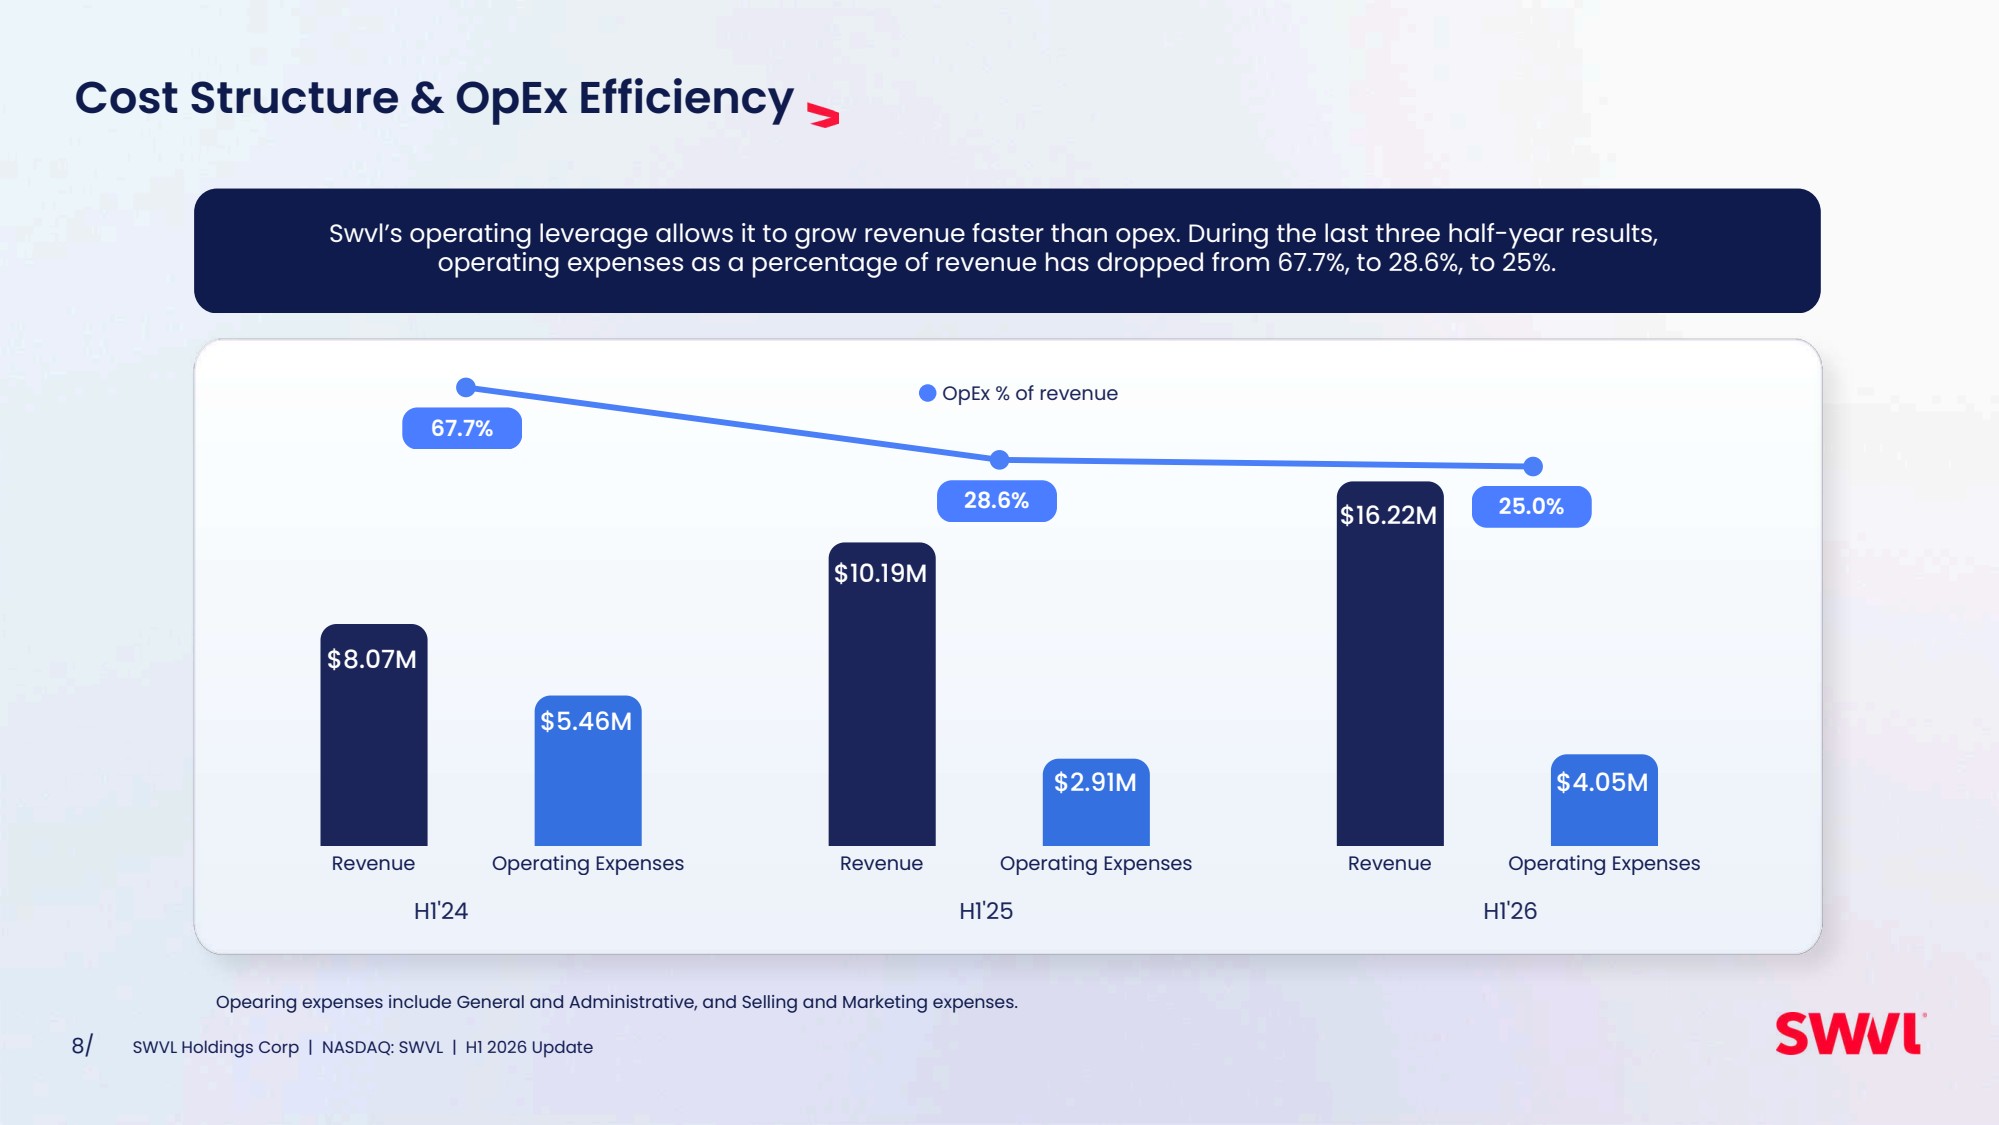
| Cost Structure & OpEx Efficiency Swvl’s operating leverage allows it to grow revenue faster than opex. During the last three half-year results, operating expenses as a percentage of revenue has dropped from 67.7%, to 28.6%, to 25%. H1'24 H1'25 H1'26 67.7% 28.6% 25.0% ● OpEx % of revenue Revenue Operating Expenses $8.07M $5.46M Revenue Operating Expenses $10.19M $2.91M Revenue Operating Expenses $16.22M $4.05M 8/ SWVL Holdings Corp | NASDAQ: SWVL | H1 2026 Update Opearing expenses include General and Administrative, and Selling and Marketing expenses. |
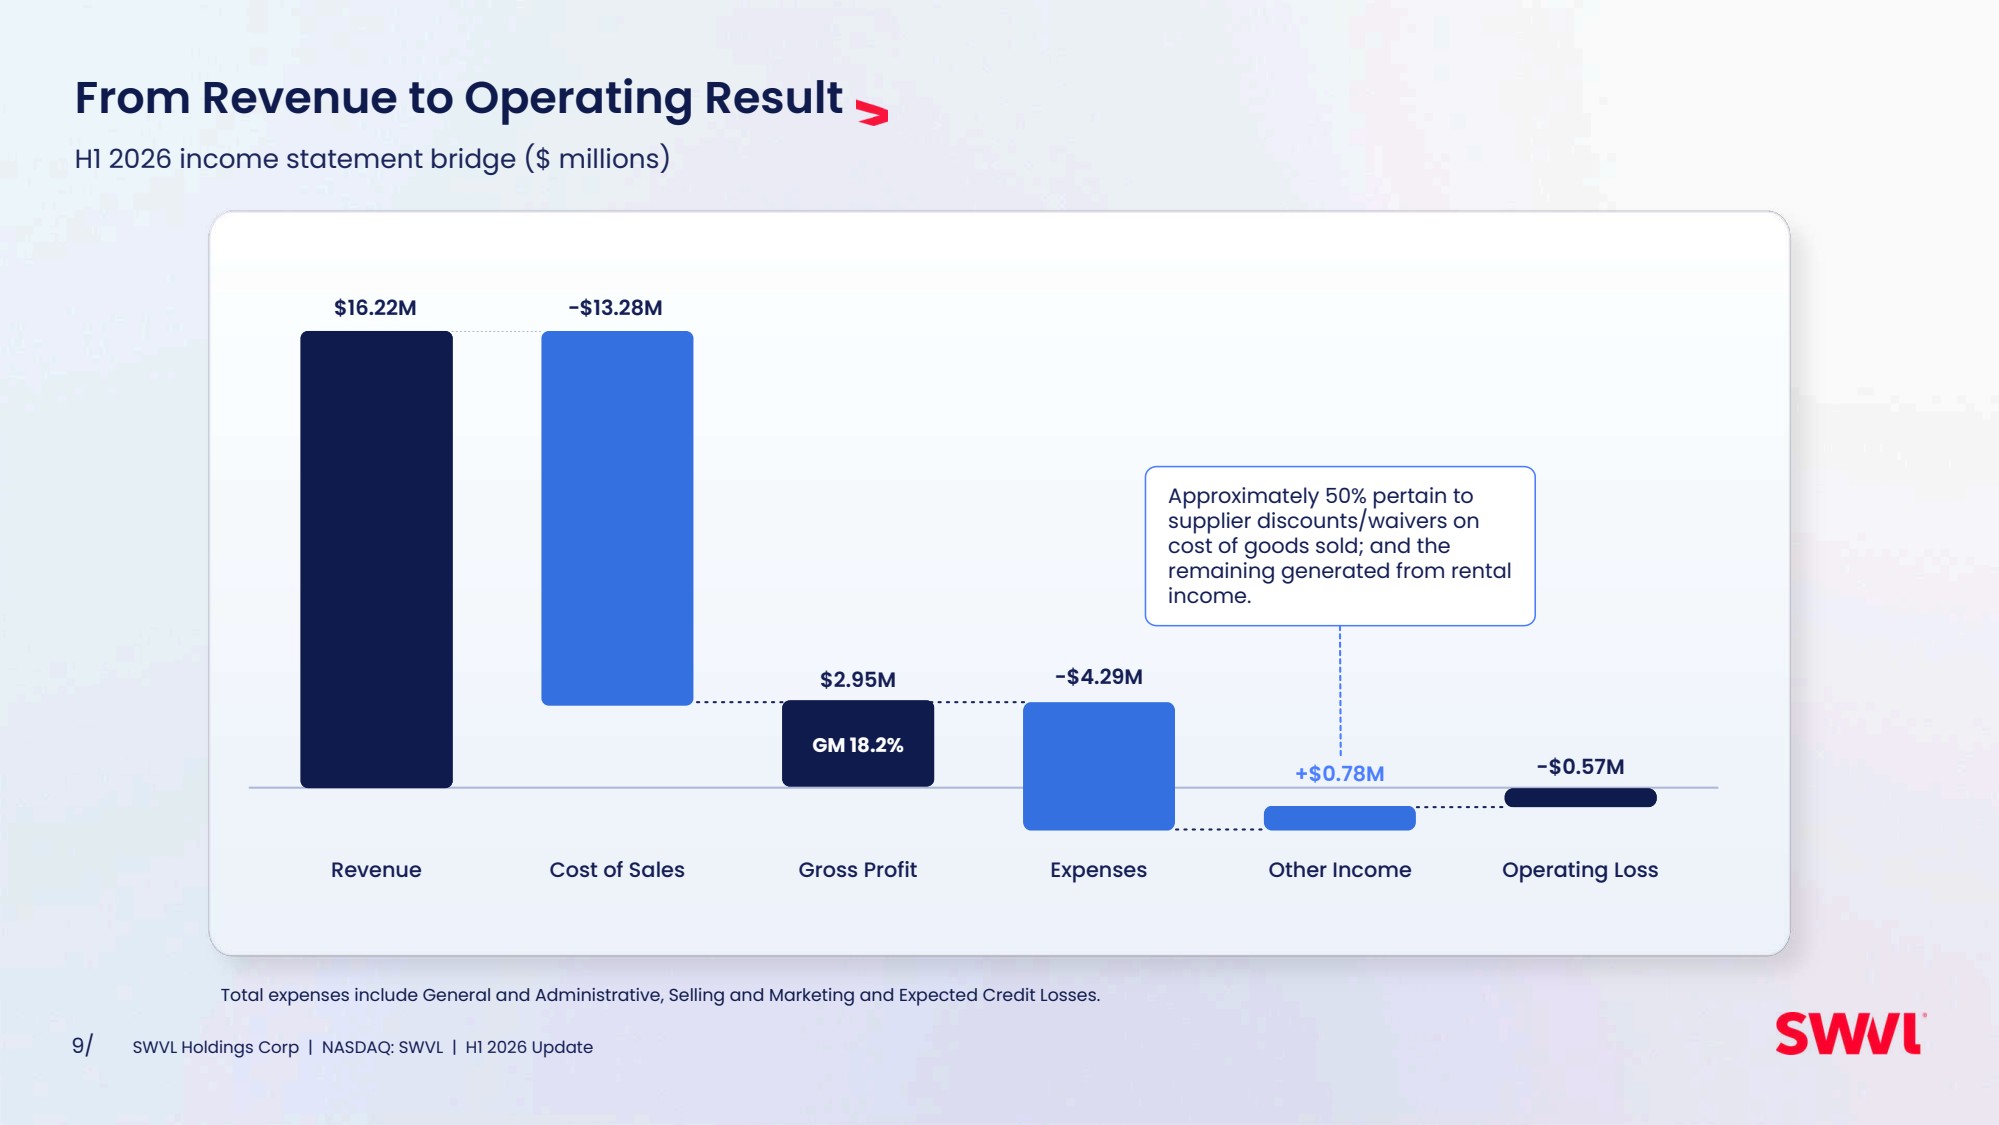
| From Revenue to Operating Result H1 2026 income statement bridge ($ millions) $16.22M −$13.28M $2.95M +$0.78M -$0.57M GM 18.2% Total expenses include General and Administrative, Selling and Marketing and Expected Credit Losses. 9/ SWVL Holdings Corp | NASDAQ: SWVL | H1 2026 Update -$4.29M Revenue Cost of Sales Gross Profit Expenses Other Income Operating Loss Approximately 50% pertain to supplier discounts/waivers on cost of goods sold; and the remaining generated from rental income. |
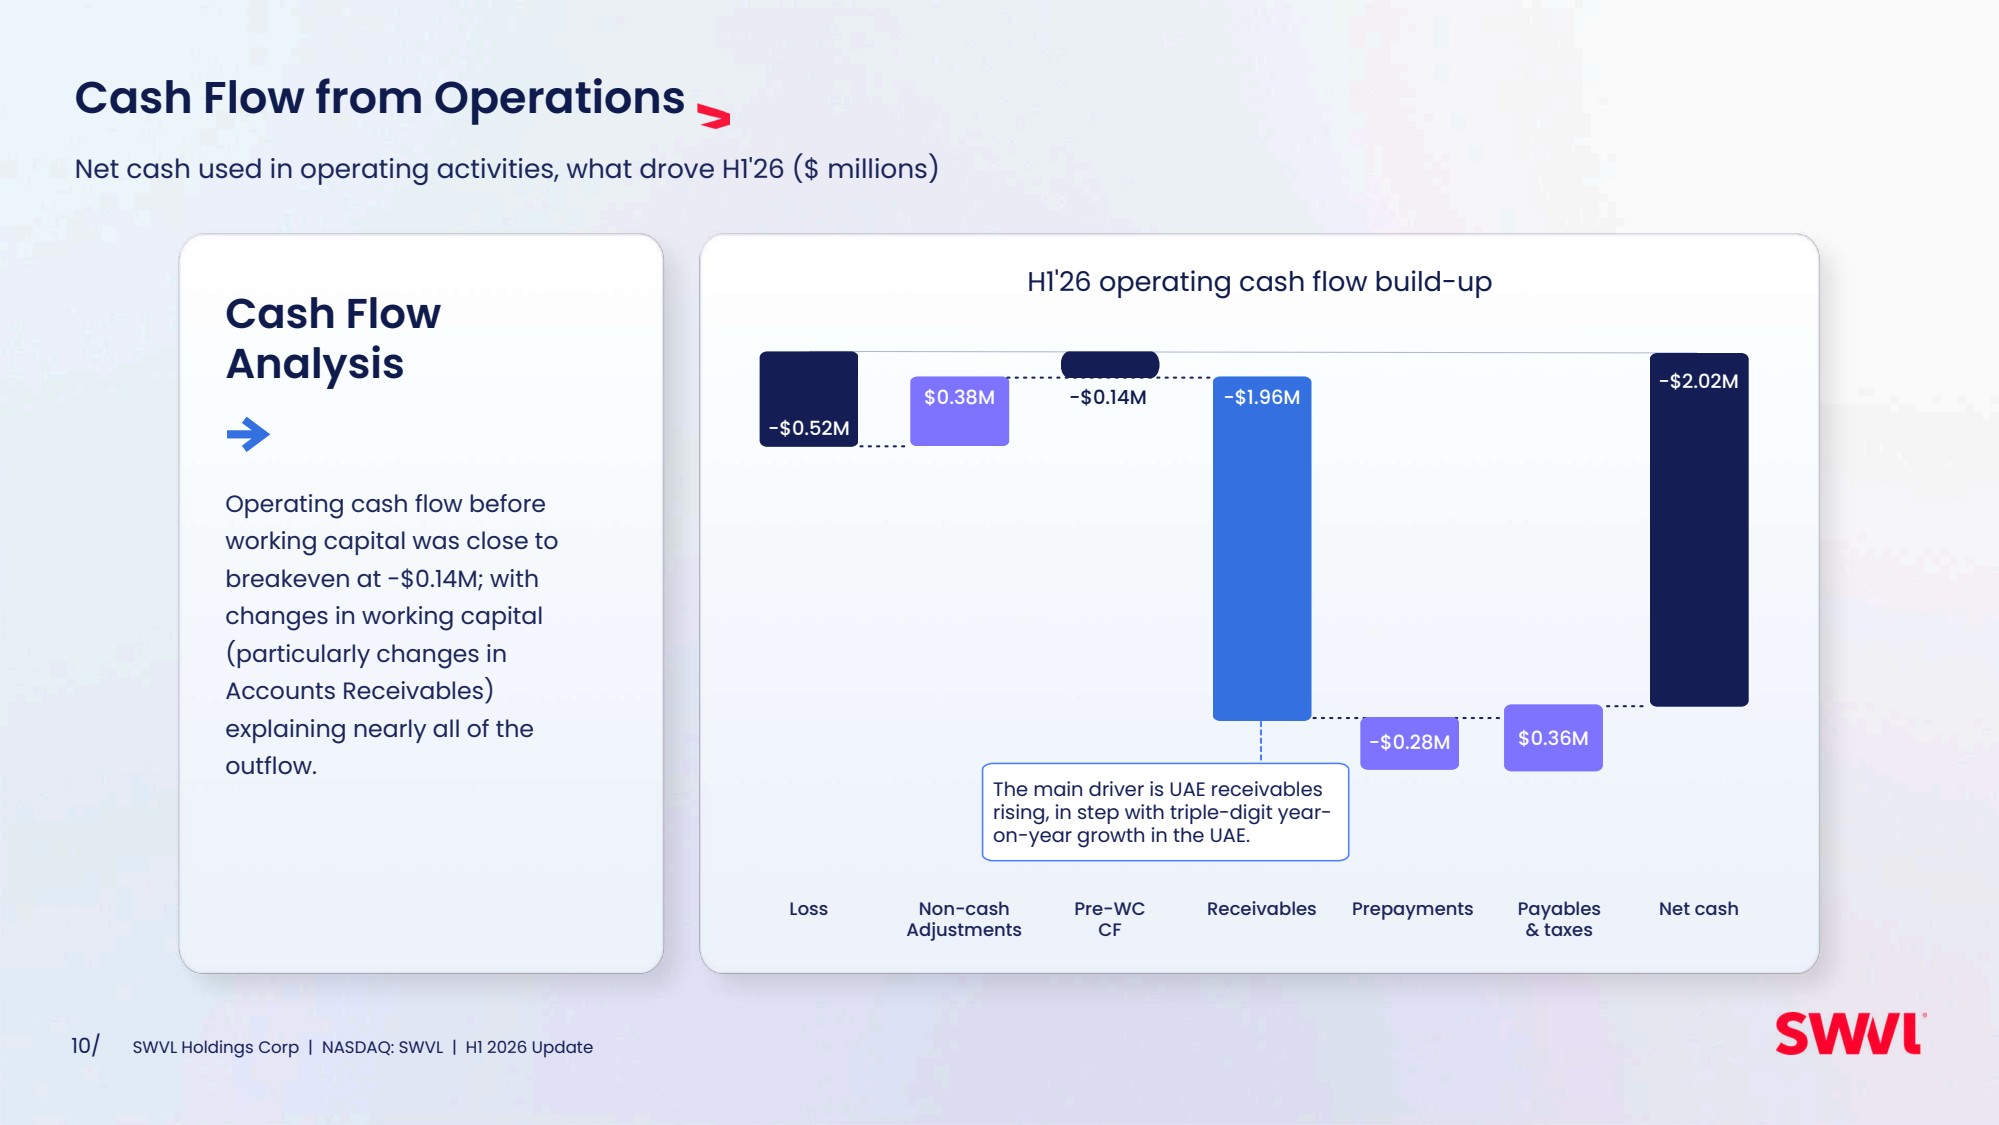
| Cash Flow from Operations Net cash used in operating activities, what drove H1'26 ($ millions) H1'26 operating cash flow build-up -$0.52M $0.38M -$0.14M -$1.96M -$0.28M $0.36M 10/ SWVL Holdings Corp | NASDAQ: SWVL | H1 2026 Update -$2.02M Loss Non-cash Adjustments Pre-WC CF Receivables Prepayments Payables & taxes Net cash Cash Flow Analysis Operating cash flow before working capital was close to breakeven at -$0.14M; with changes in working capital (particularly changes in Accounts Receivables) explaining nearly all of the outflow. The main driver is UAE receivables rising, in step with triple-digit year-on-year growth in the UAE. |
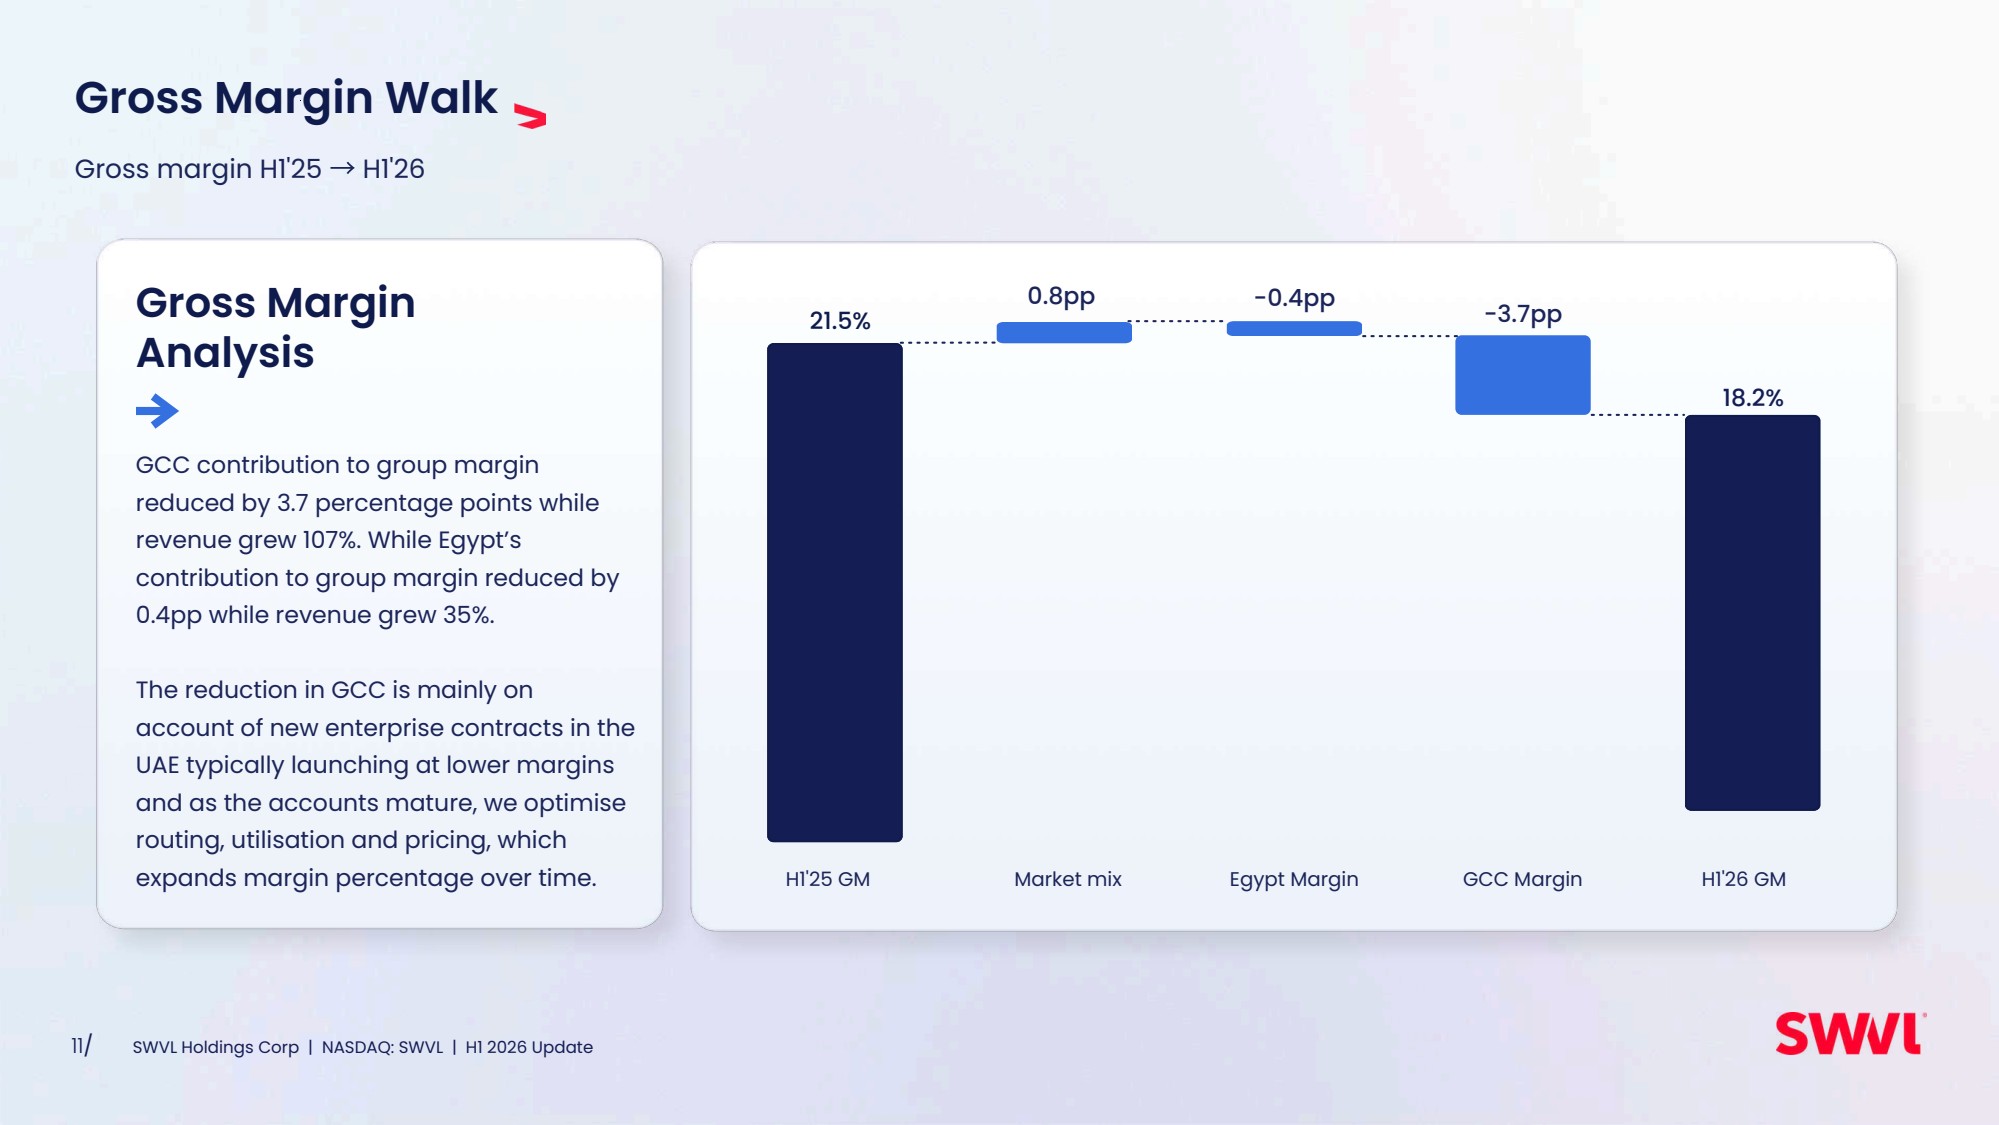
| Gross Margin Walk Gross margin H1'25 → H1'26 21.5% 0.8pp −0.4pp −3.7pp 18.2% 11/ SWVL Holdings Corp | NASDAQ: SWVL | H1 2026 Update H1'25 GM Market mix Egypt Margin GCC Margin H1'26 GM Gross Margin Analysis GCC contribution to group margin reduced by 3.7 percentage points while revenue grew 107%. While Egypt’s contribution to group margin reduced by 0.4pp while revenue grew 35%. The reduction in GCC is mainly on account of new enterprise contracts in the UAE typically launching at lower margins and as the accounts mature, we optimise routing, utilisation and pricing, which expands margin percentage over time. |
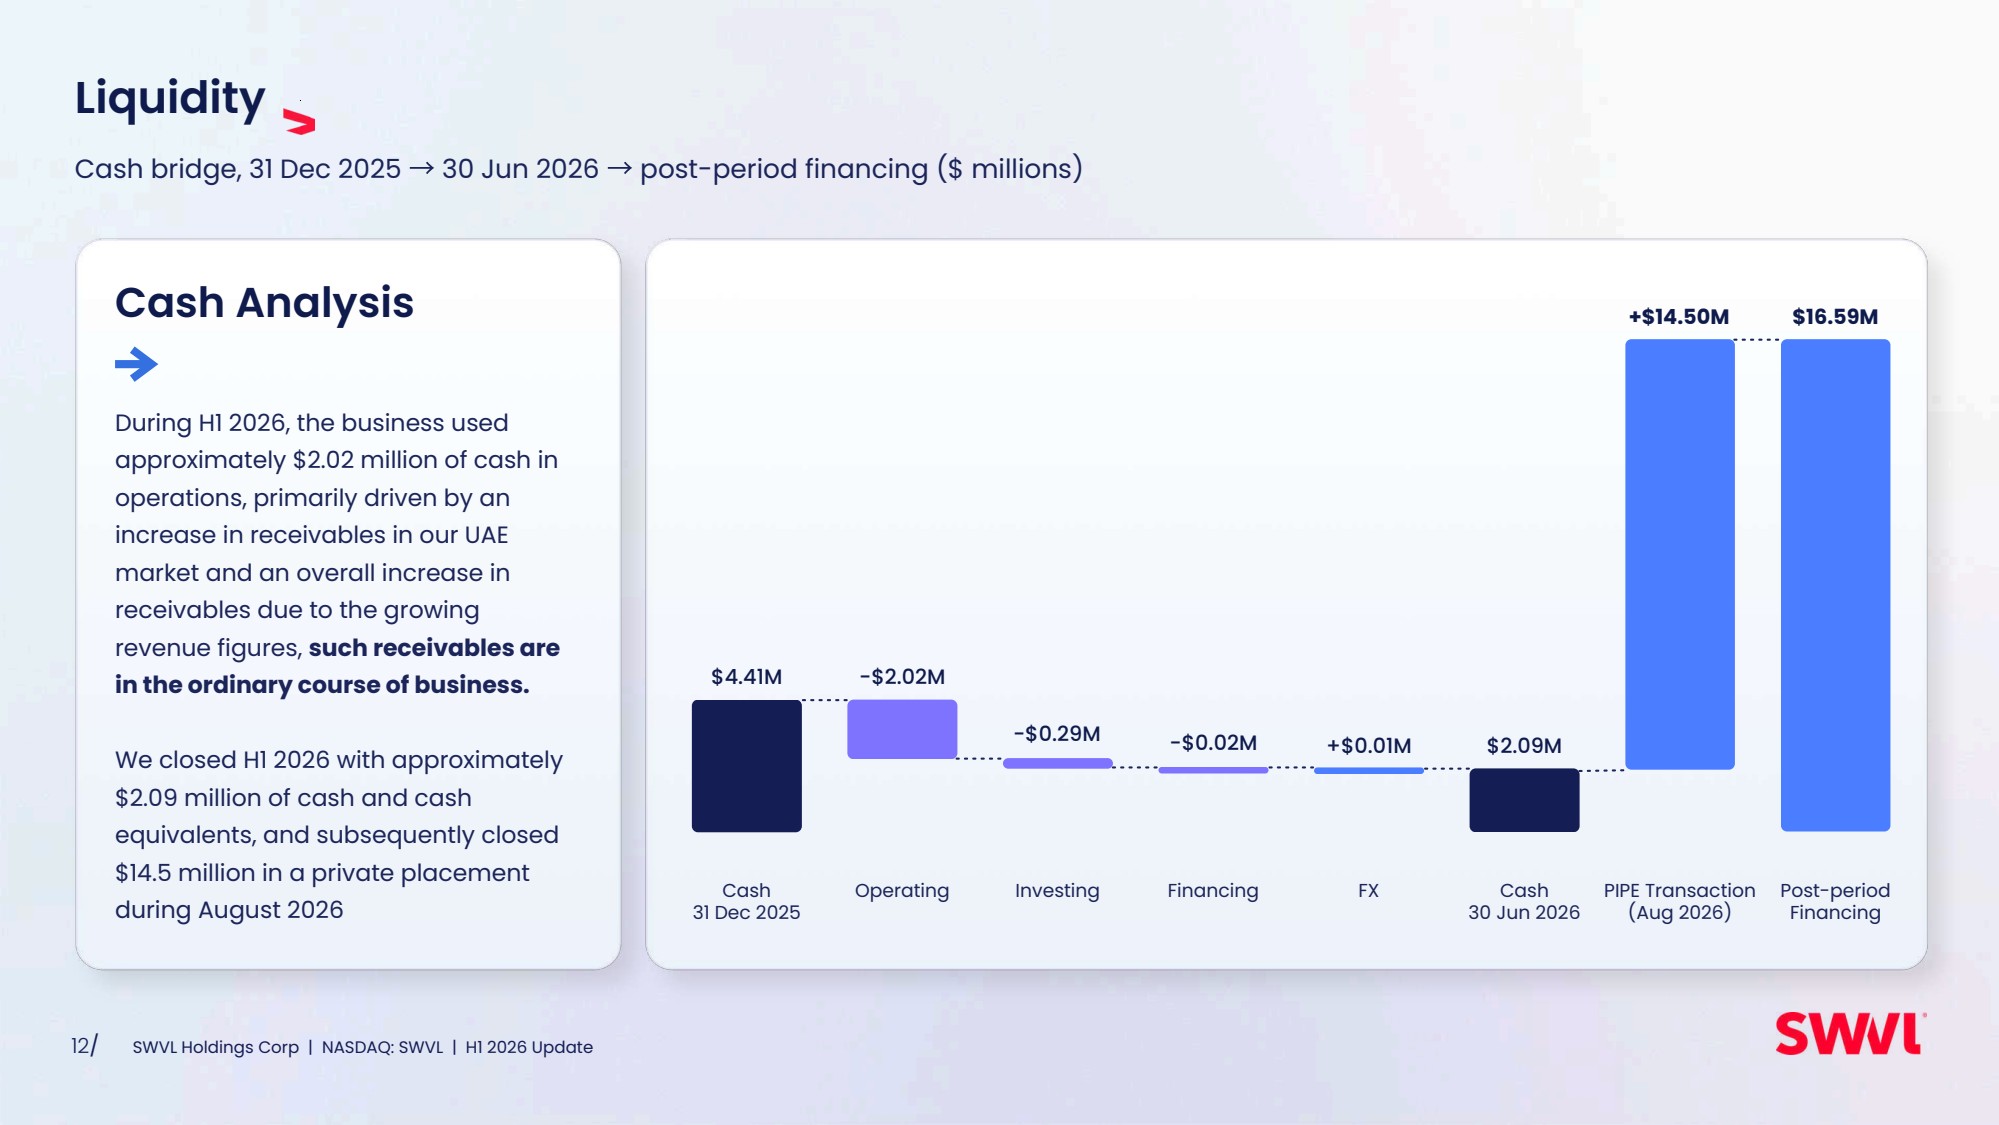
| Liquidity Cash bridge, 31 Dec 2025 → 30 Jun 2026 → post-period financing ($ millions) $4.41M Cash 31 Dec 2025 -$2.02M Operating -$0.29M Investing -$0.02M Financing +$0.01M FX $2.09M Cash 30 Jun 2026 +$14.50M PIPE Transaction (Aug 2026) $16.59M Post-period Financing 12/ SWVL Holdings Corp | NASDAQ: SWVL | H1 2026 Update Cash Analysis During H1 2026, the business used approximately $2.02 million of cash in operations, primarily driven by an increase in receivables in our UAE market and an overall increase in receivables due to the growing revenue figures, such receivables are in the ordinary course of business. We closed H1 2026 with approximately $2.09 million of cash and cash equivalents, and subsequently closed $14.5 million in a private placement during August 2026 |
| Geography deep dive 13/ SWVL Holdings Corp | NASDAQ: SWVL | H1 2026 Update |

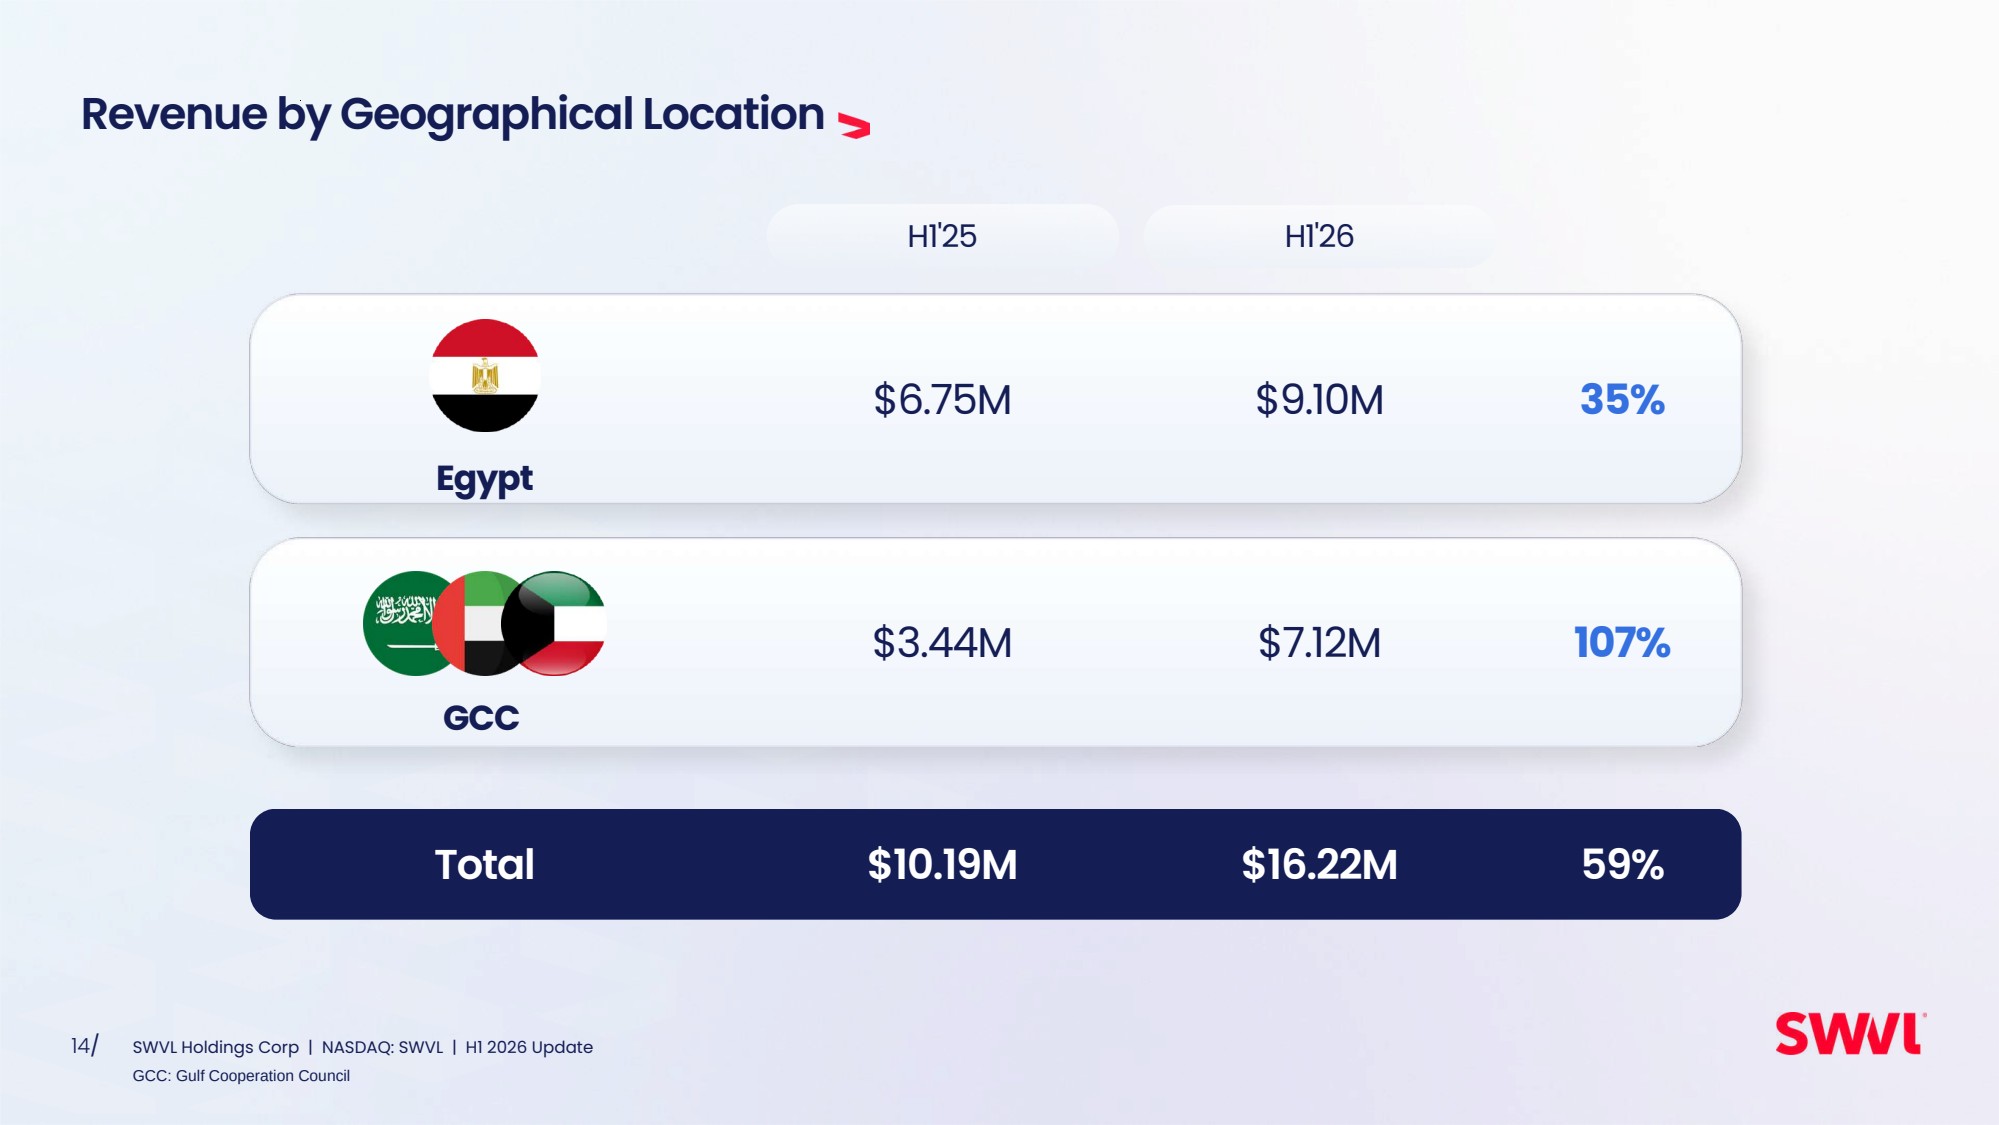
| Revenue by Geographical Location Egypt H1'25 H1'26 $6.75M $9.10M $3.44M $7.12M $10.19M $16.22M GCC Total 35% 107% 59% GCC: Gulf Cooperation Council 14/ SWVL Holdings Corp | NASDAQ: SWVL | H1 2026 Update |
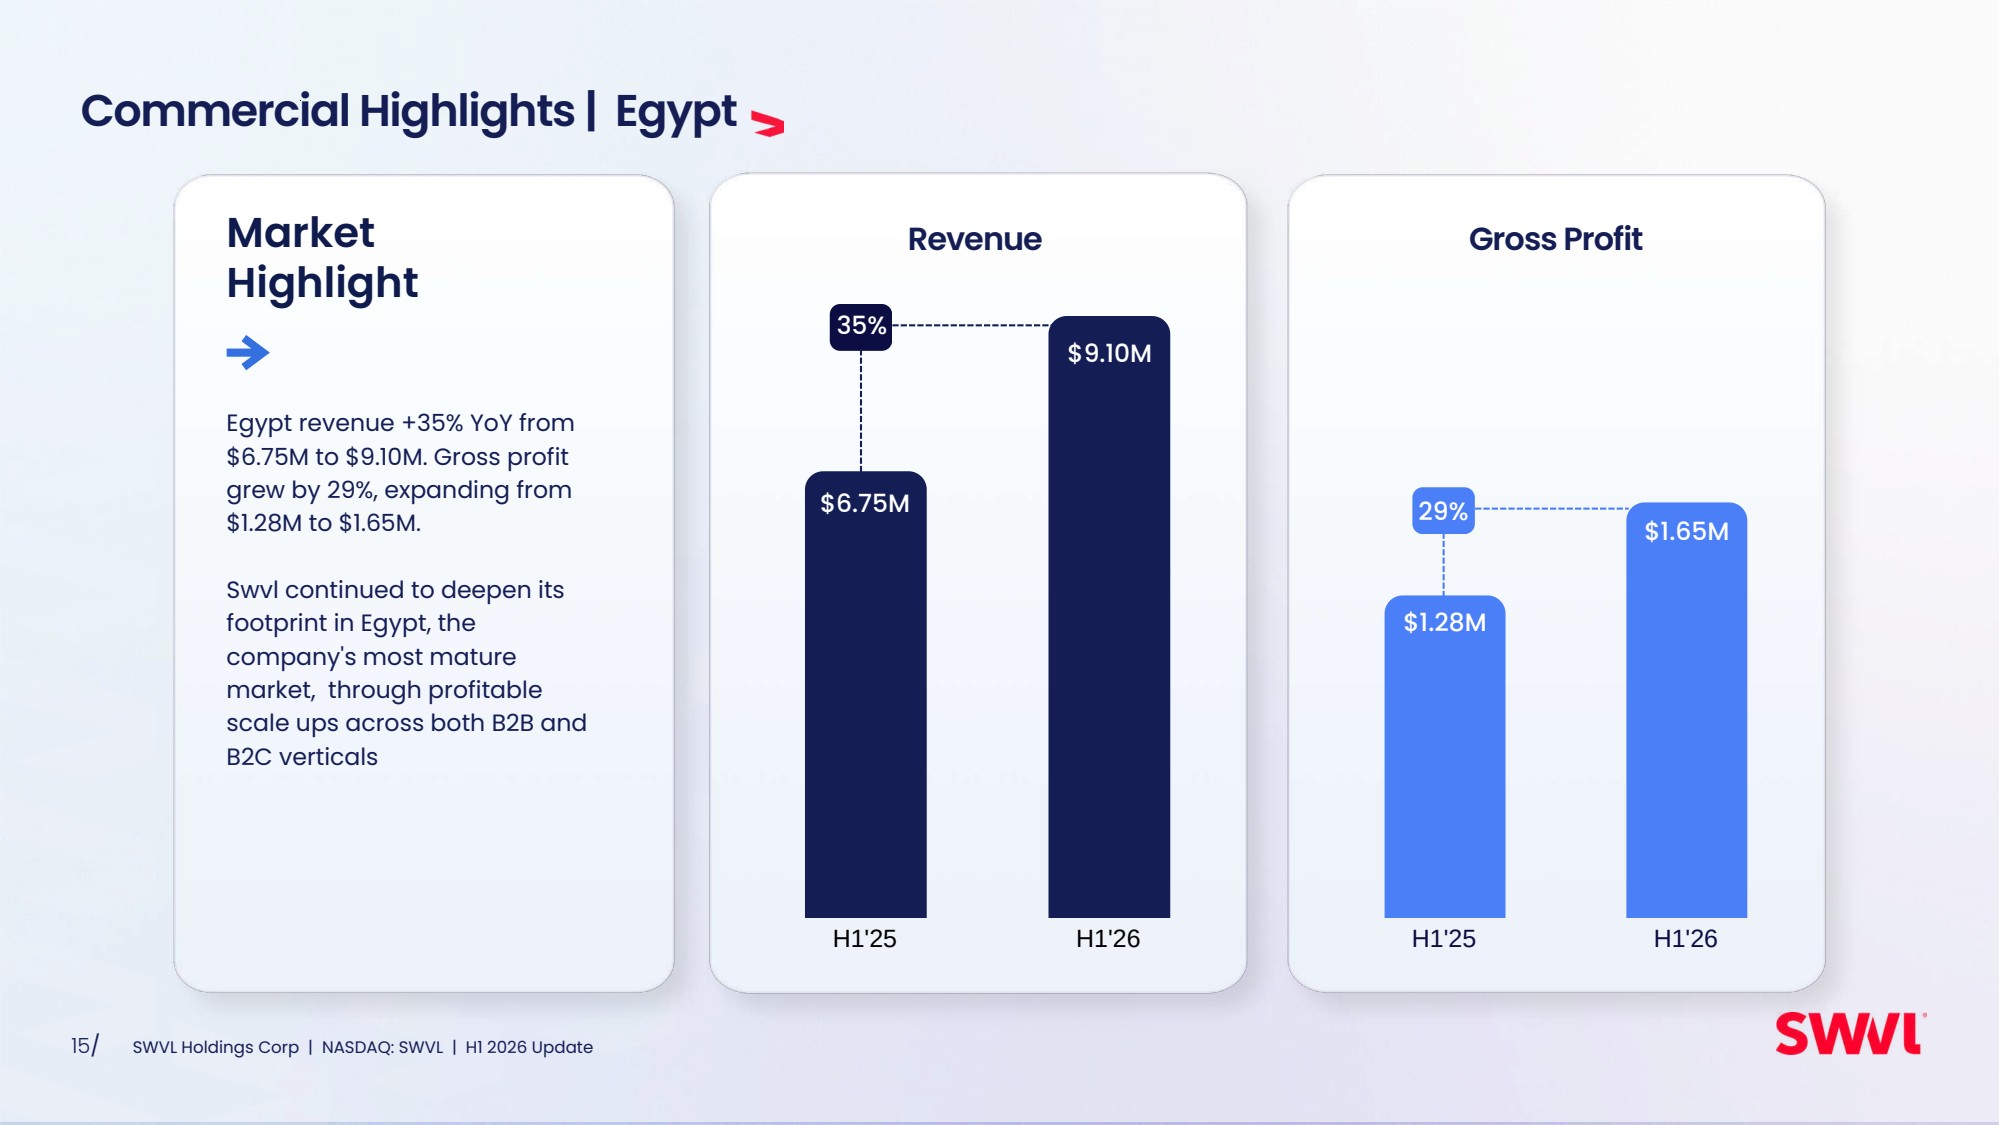
| H1'25 H1'26 H1'25 H1'26 Commercial Highlights | Egypt 29% Revenue Gross Profit 35% $6.75M $9.10M $1.65M $1.28M Egypt revenue +35% YoY from $6.75M to $9.10M. Gross profit grew by 29%, expanding from $1.28M to $1.65M. Swvl continued to deepen its footprint in Egypt, the company's most mature market, through profitable scale ups across both B2B and B2C verticals Market Highlight 15/ SWVL Holdings Corp | NASDAQ: SWVL | H1 2026 Update |
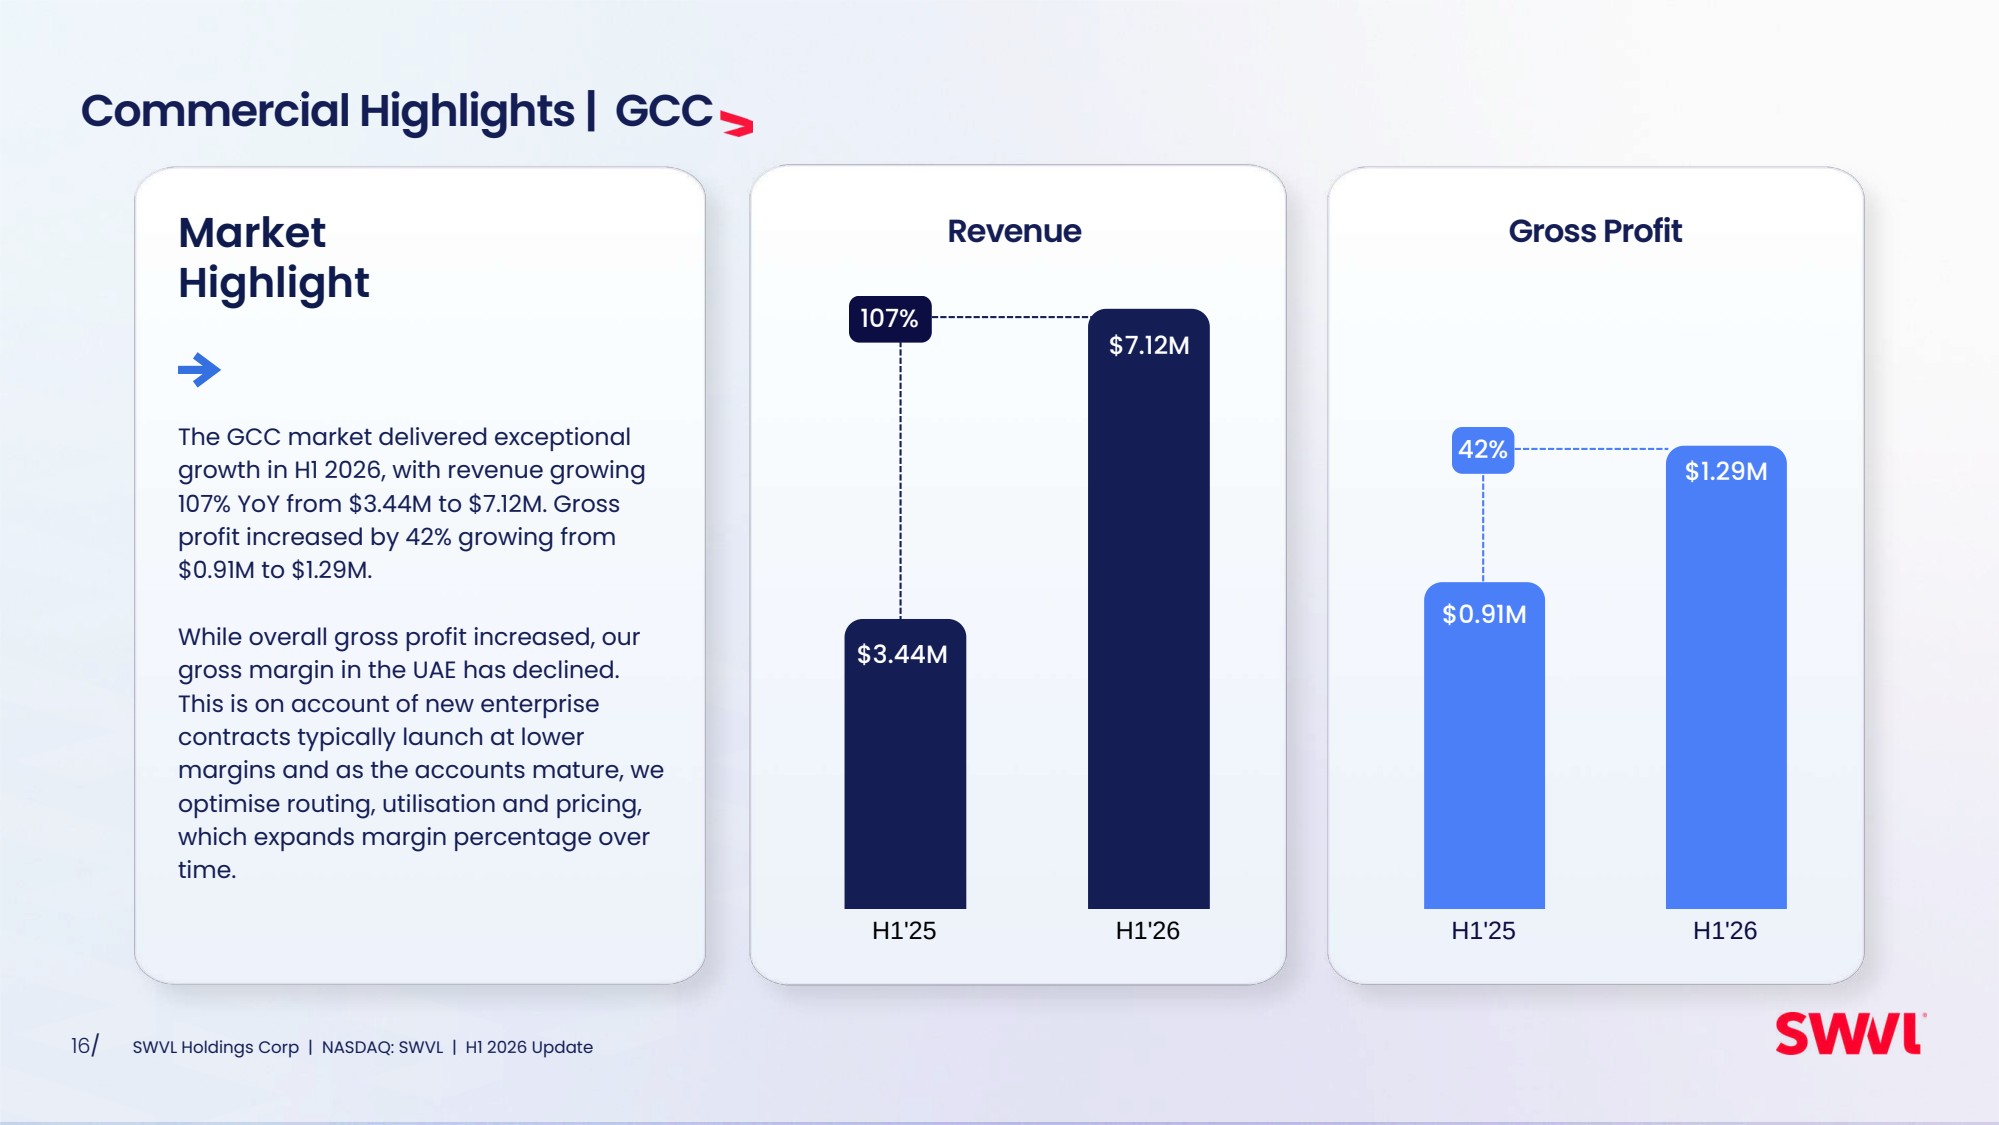
| H1'25 H1'26 H1'25 H1'26 Commercial Highlights | GCC 42% Revenue Gross Profit 107% $3.44M $7.12M $1.29M $0.91M The GCC market delivered exceptional growth in H1 2026, with revenue growing 107% YoY from $3.44M to $7.12M. Gross profit increased by 42% growing from $0.91M to $1.29M. While overall gross profit increased, our gross margin in the UAE has declined. This is on account of new enterprise contracts typically launch at lower margins and as the accounts mature, we optimise routing, utilisation and pricing, which expands margin percentage over time. Market Highlight 16/ SWVL Holdings Corp | NASDAQ: SWVL | H1 2026 Update |
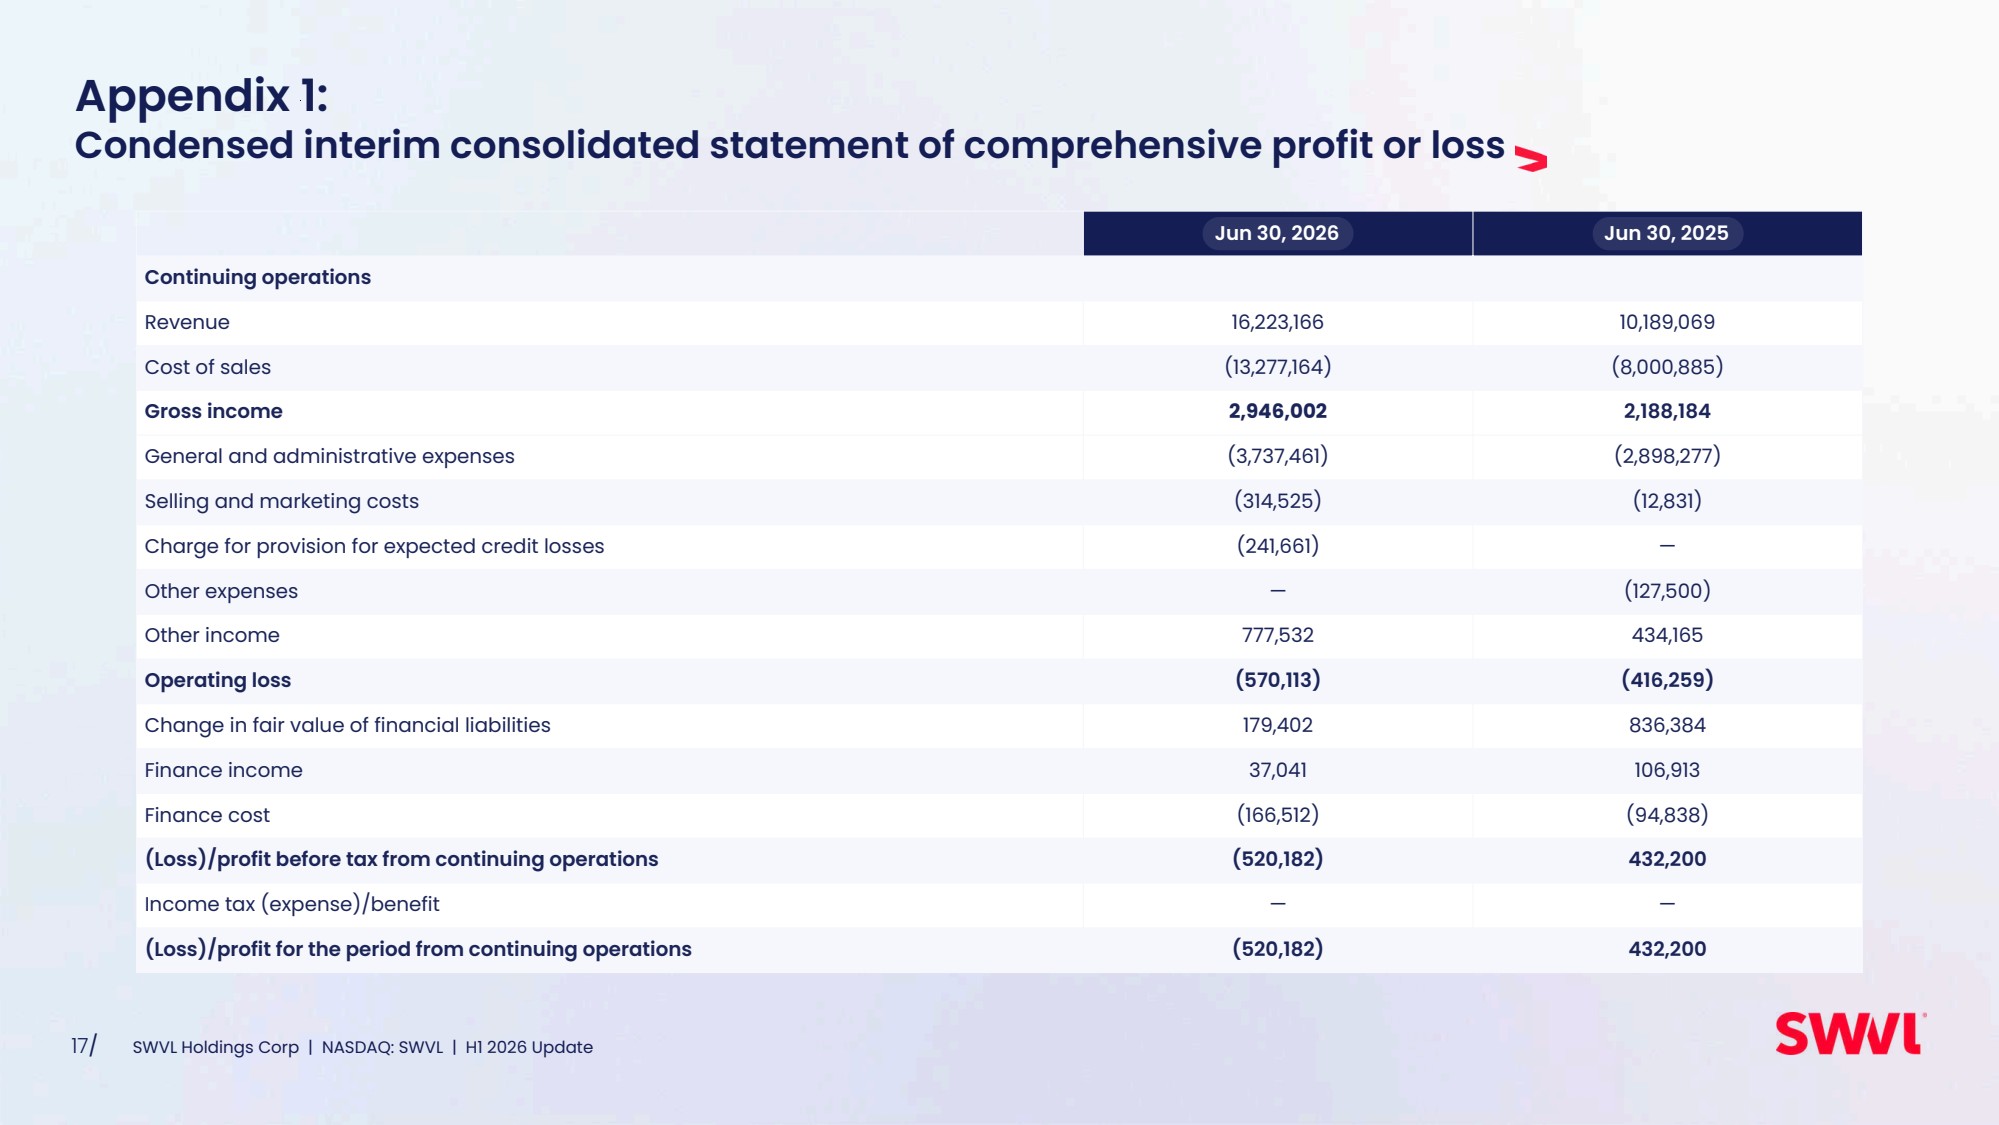
| Appendix 1: Condensed interim consolidated statement of comprehensive profit or loss 17/ SWVL Holdings Corp | NASDAQ: SWVL | H1 2026 Update Jun 30, 2026 Jun 30, 2025 Continuing operations Revenue 16,223,166 10,189,069 Cost of sales (13,277,164) (8,000,885) Gross income 2,946,002 2,188,184 General and administrative expenses (3,737,461) (2,898,277) Selling and marketing costs (314,525) (12,831) Charge for provision for expected credit losses (241,661) — Other expenses — (127,500) Other income 777,532 434,165 Operating loss (570,113) (416,259) Change in fair value of financial liabilities 179,402 836,384 Finance income 37,041 106,913 Finance cost (166,512) (94,838) (Loss)/profit before tax from continuing operations (520,182) 432,200 Income tax (expense)/benefit — — (Loss)/profit for the period from continuing operations (520,182) 432,200 |
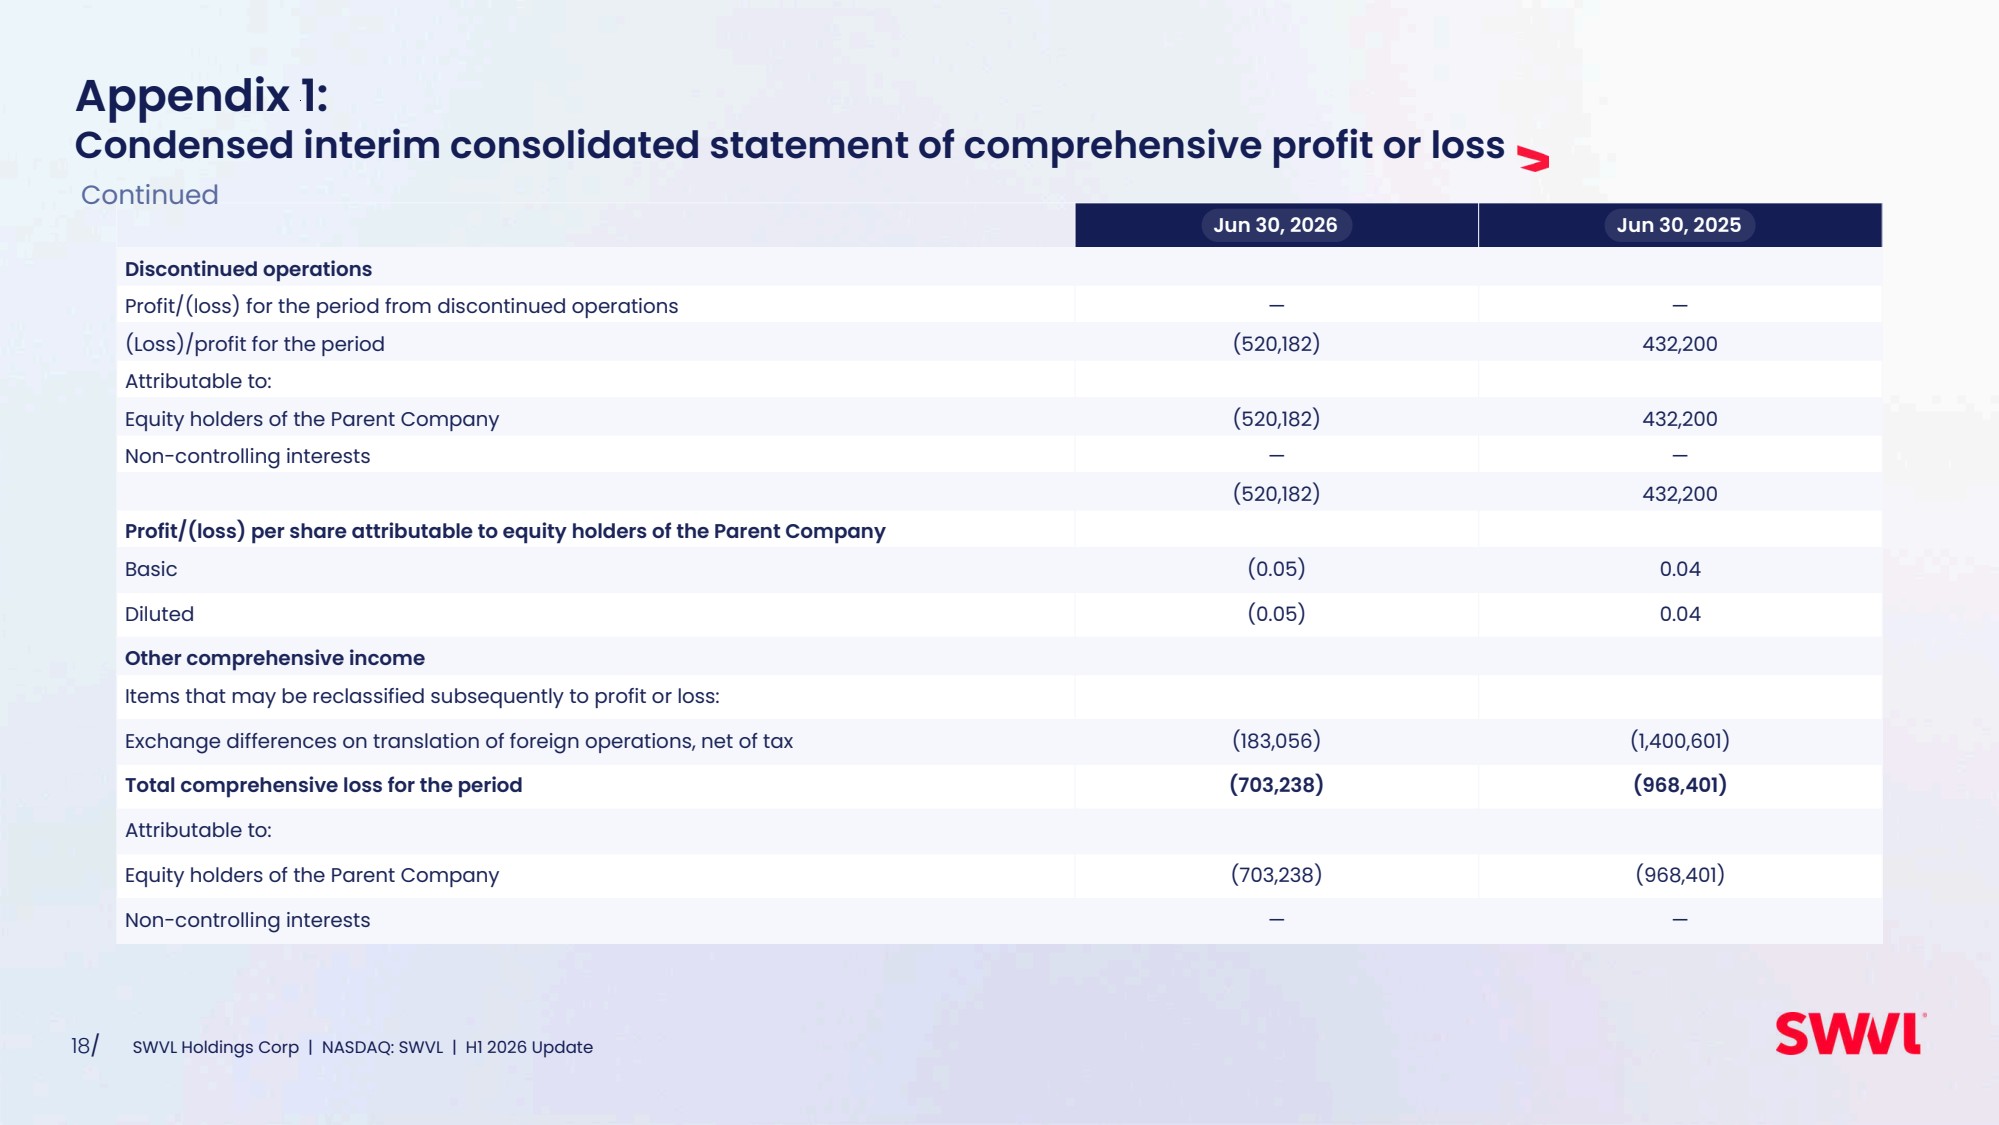
| 18/ SWVL Holdings Corp | NASDAQ: SWVL | H1 2026 Update Jun 30, 2026 Jun 30, 2025 Discontinued operations Profit/(loss) for the period from discontinued operations — — (Loss)/profit for the period (520,182) 432,200 Attributable to: Equity holders of the Parent Company (520,182) 432,200 Non-controlling interests — — (520,182) 432,200 Profit/(loss) per share attributable to equity holders of the Parent Company Basic (0.05) 0.04 Diluted (0.05) 0.04 Other comprehensive income Items that may be reclassified subsequently to profit or loss: Exchange differences on translation of foreign operations, net of tax (183,056) (1,400,601) Total comprehensive loss for the period (703,238) (968,401) Attributable to: Equity holders of the Parent Company (703,238) (968,401) Non-controlling interests — — Appendix 1: Condensed interim consolidated statement of comprehensive profit or loss Continued |
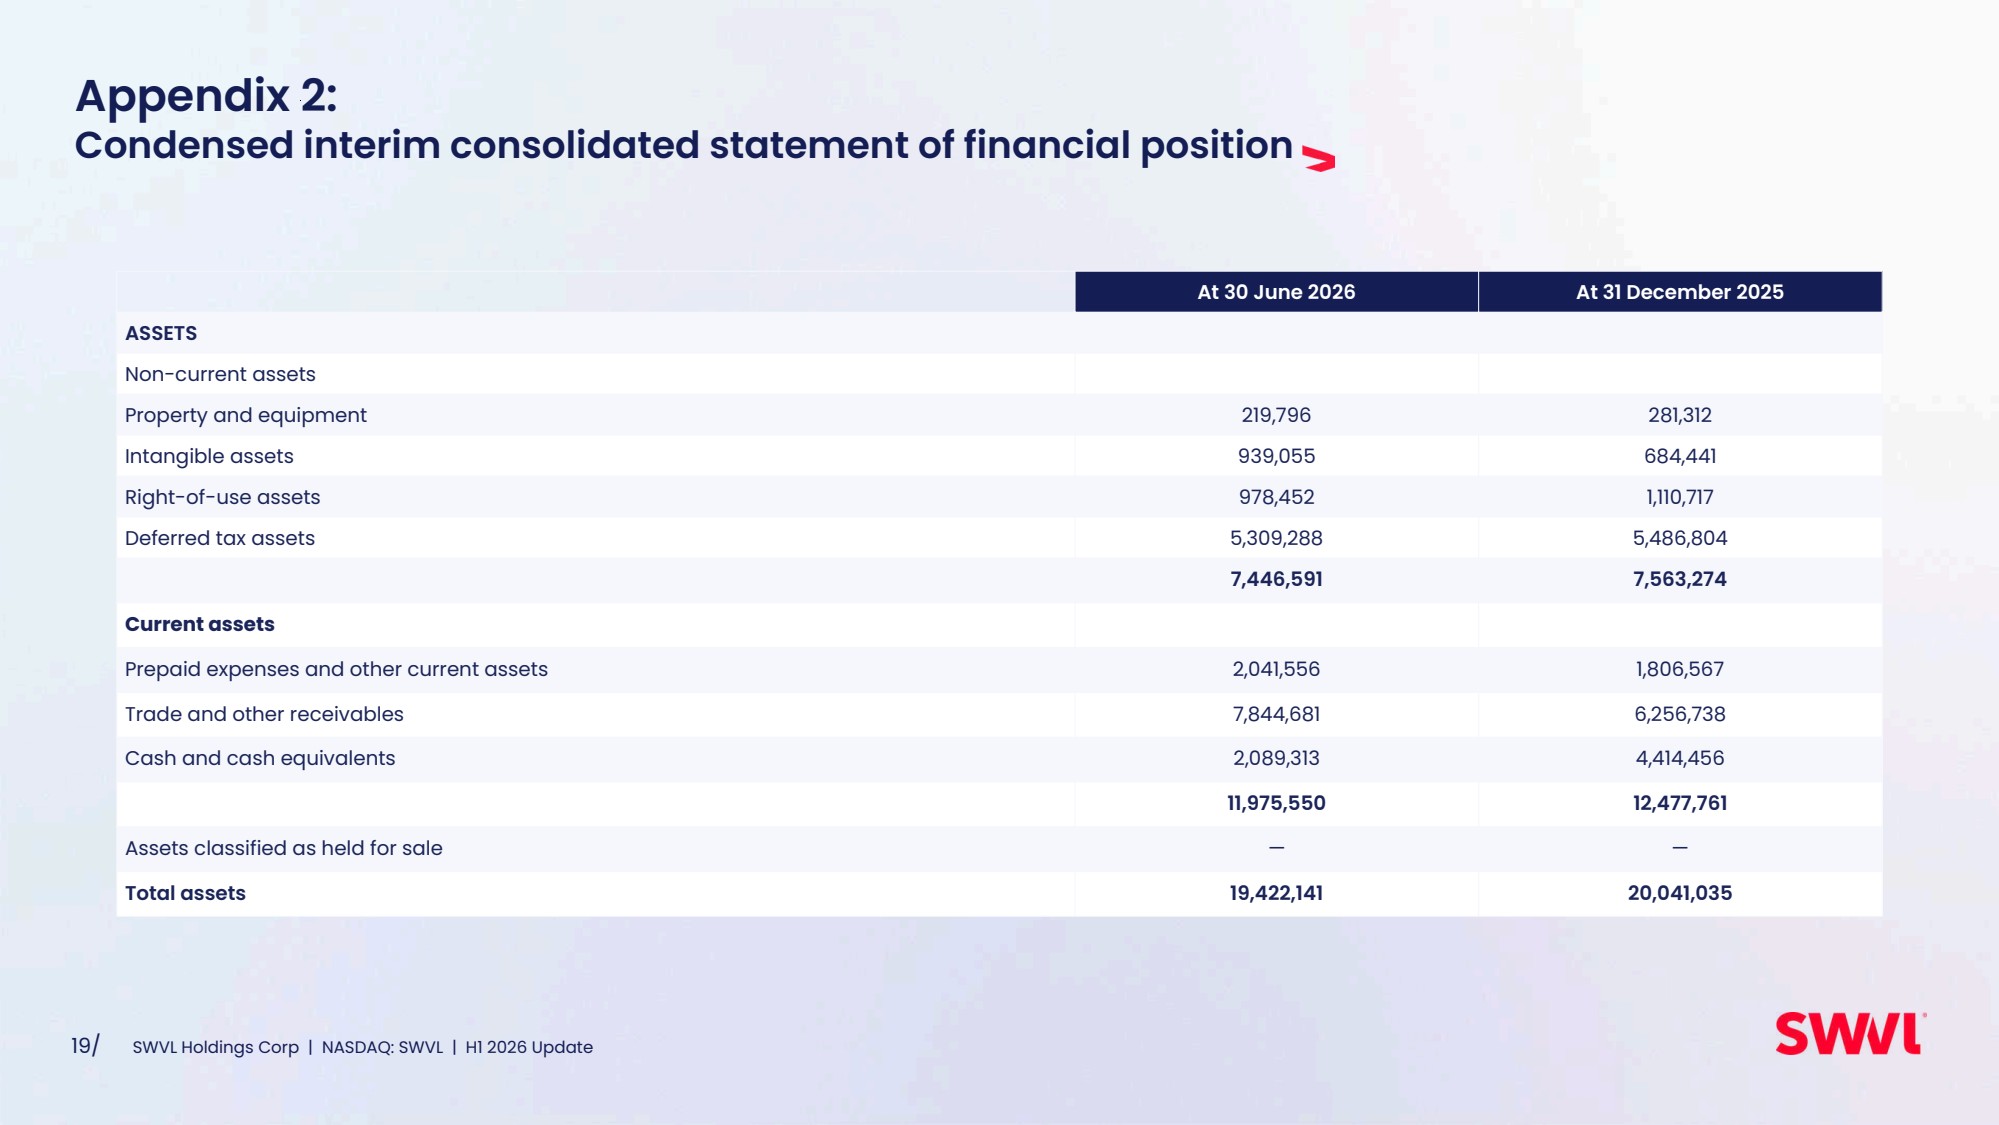
| 19/ SWVL Holdings Corp | NASDAQ: SWVL | H1 2026 Update At 30 June 2026 At 31 December 2025 ASSETS Non-current assets Property and equipment 219,796 281,312 Intangible assets 939,055 684,441 Right-of-use assets 978,452 1,110,717 Deferred tax assets 5,309,288 5,486,804 7,446,591 7,563,274 Current assets Prepaid expenses and other current assets 2,041,556 1,806,567 Trade and other receivables 7,844,681 6,256,738 Cash and cash equivalents 2,089,313 4,414,456 11,975,550 12,477,761 Assets classified as held for sale — — Total assets 19,422,141 20,041,035 Appendix 2: Condensed interim consolidated statement of financial position |
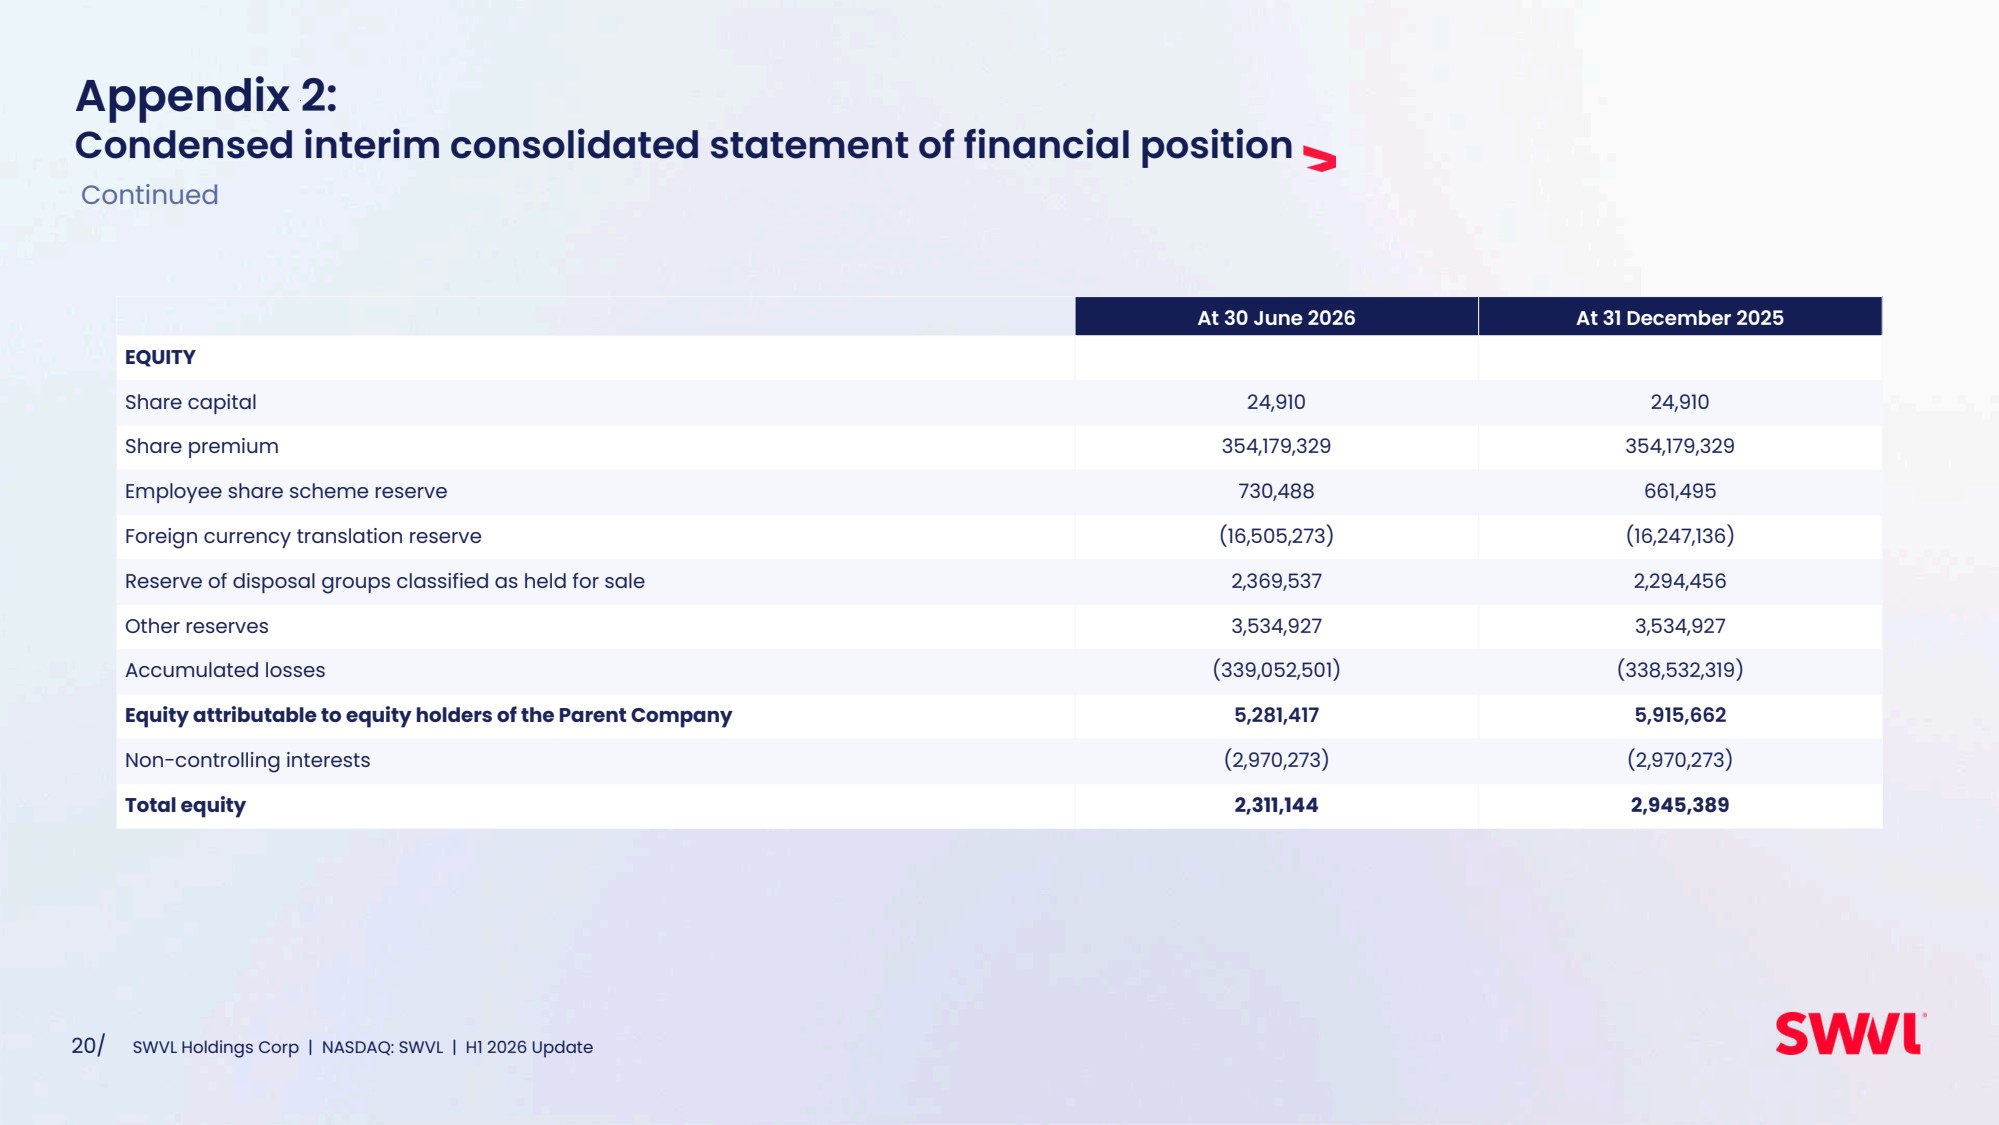
| 20/ SWVL Holdings Corp | NASDAQ: SWVL | H1 2026 Update At 30 June 2026 At 31 December 2025 EQUITY Share capital 24,910 24,910 Share premium 354,179,329 354,179,329 Employee share scheme reserve 730,488 661,495 Foreign currency translation reserve (16,505,273) (16,247,136) Reserve of disposal groups classified as held for sale 2,369,537 2,294,456 Other reserves 3,534,927 3,534,927 Accumulated losses (339,052,501) (338,532,319) Equity attributable to equity holders of the Parent Company 5,281,417 5,915,662 Non-controlling interests (2,970,273) (2,970,273) Total equity 2,311,144 2,945,389 Appendix 2: Condensed interim consolidated statement of financial position Continued |
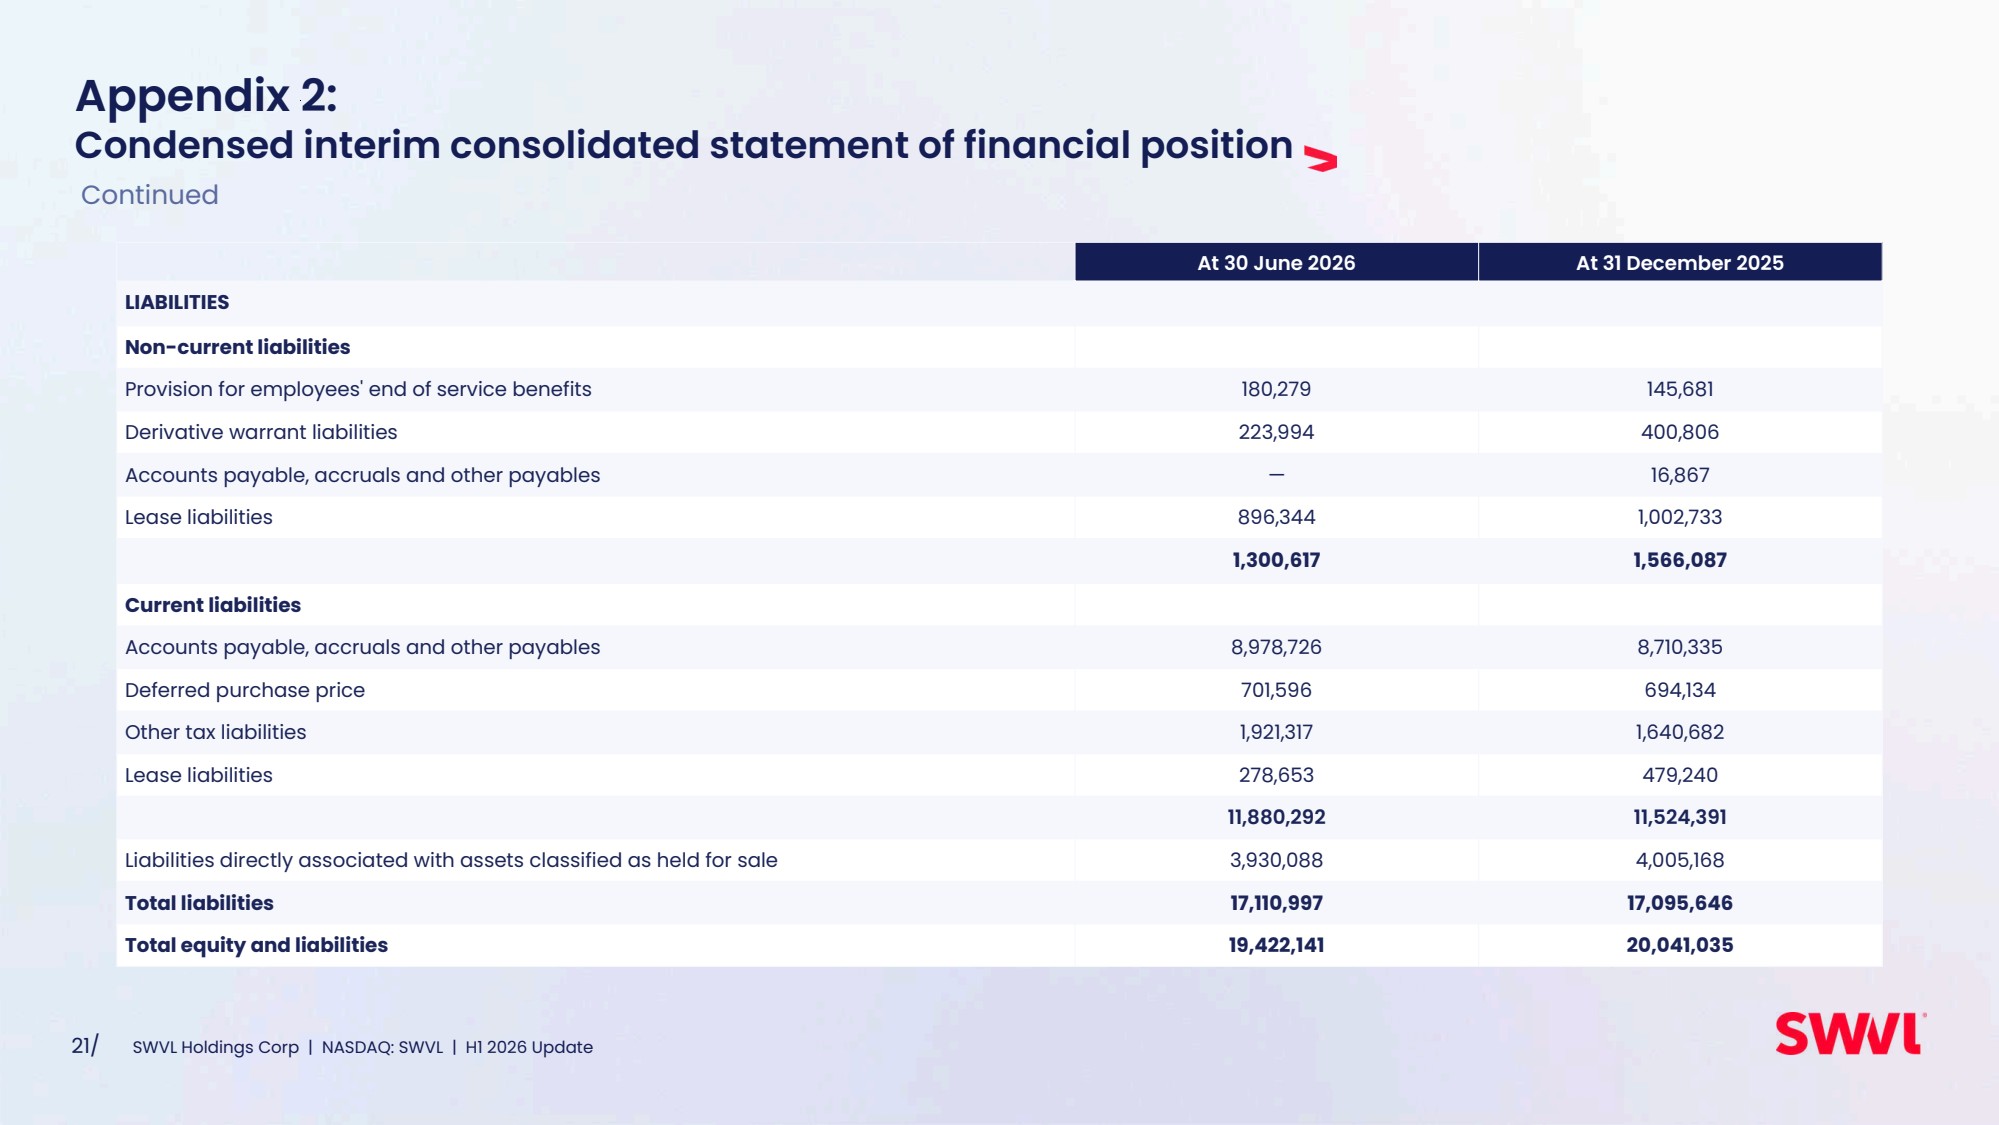
| 21/ SWVL Holdings Corp | NASDAQ: SWVL | H1 2026 Update At 30 June 2026 At 31 December 2025 LIABILITIES Non-current liabilities Provision for employees' end of service benefits 180,279 145,681 Derivative warrant liabilities 223,994 400,806 Accounts payable, accruals and other payables — 16,867 Lease liabilities 896,344 1,002,733 1,300,617 1,566,087 Current liabilities Accounts payable, accruals and other payables 8,978,726 8,710,335 Deferred purchase price 701,596 694,134 Other tax liabilities 1,921,317 1,640,682 Lease liabilities 278,653 479,240 11,880,292 11,524,391 Liabilities directly associated with assets classified as held for sale 3,930,088 4,005,168 Total liabilities 17,110,997 17,095,646 Total equity and liabilities 19,422,141 20,041,035 Appendix 2: Condensed interim consolidated statement of financial position Continued |
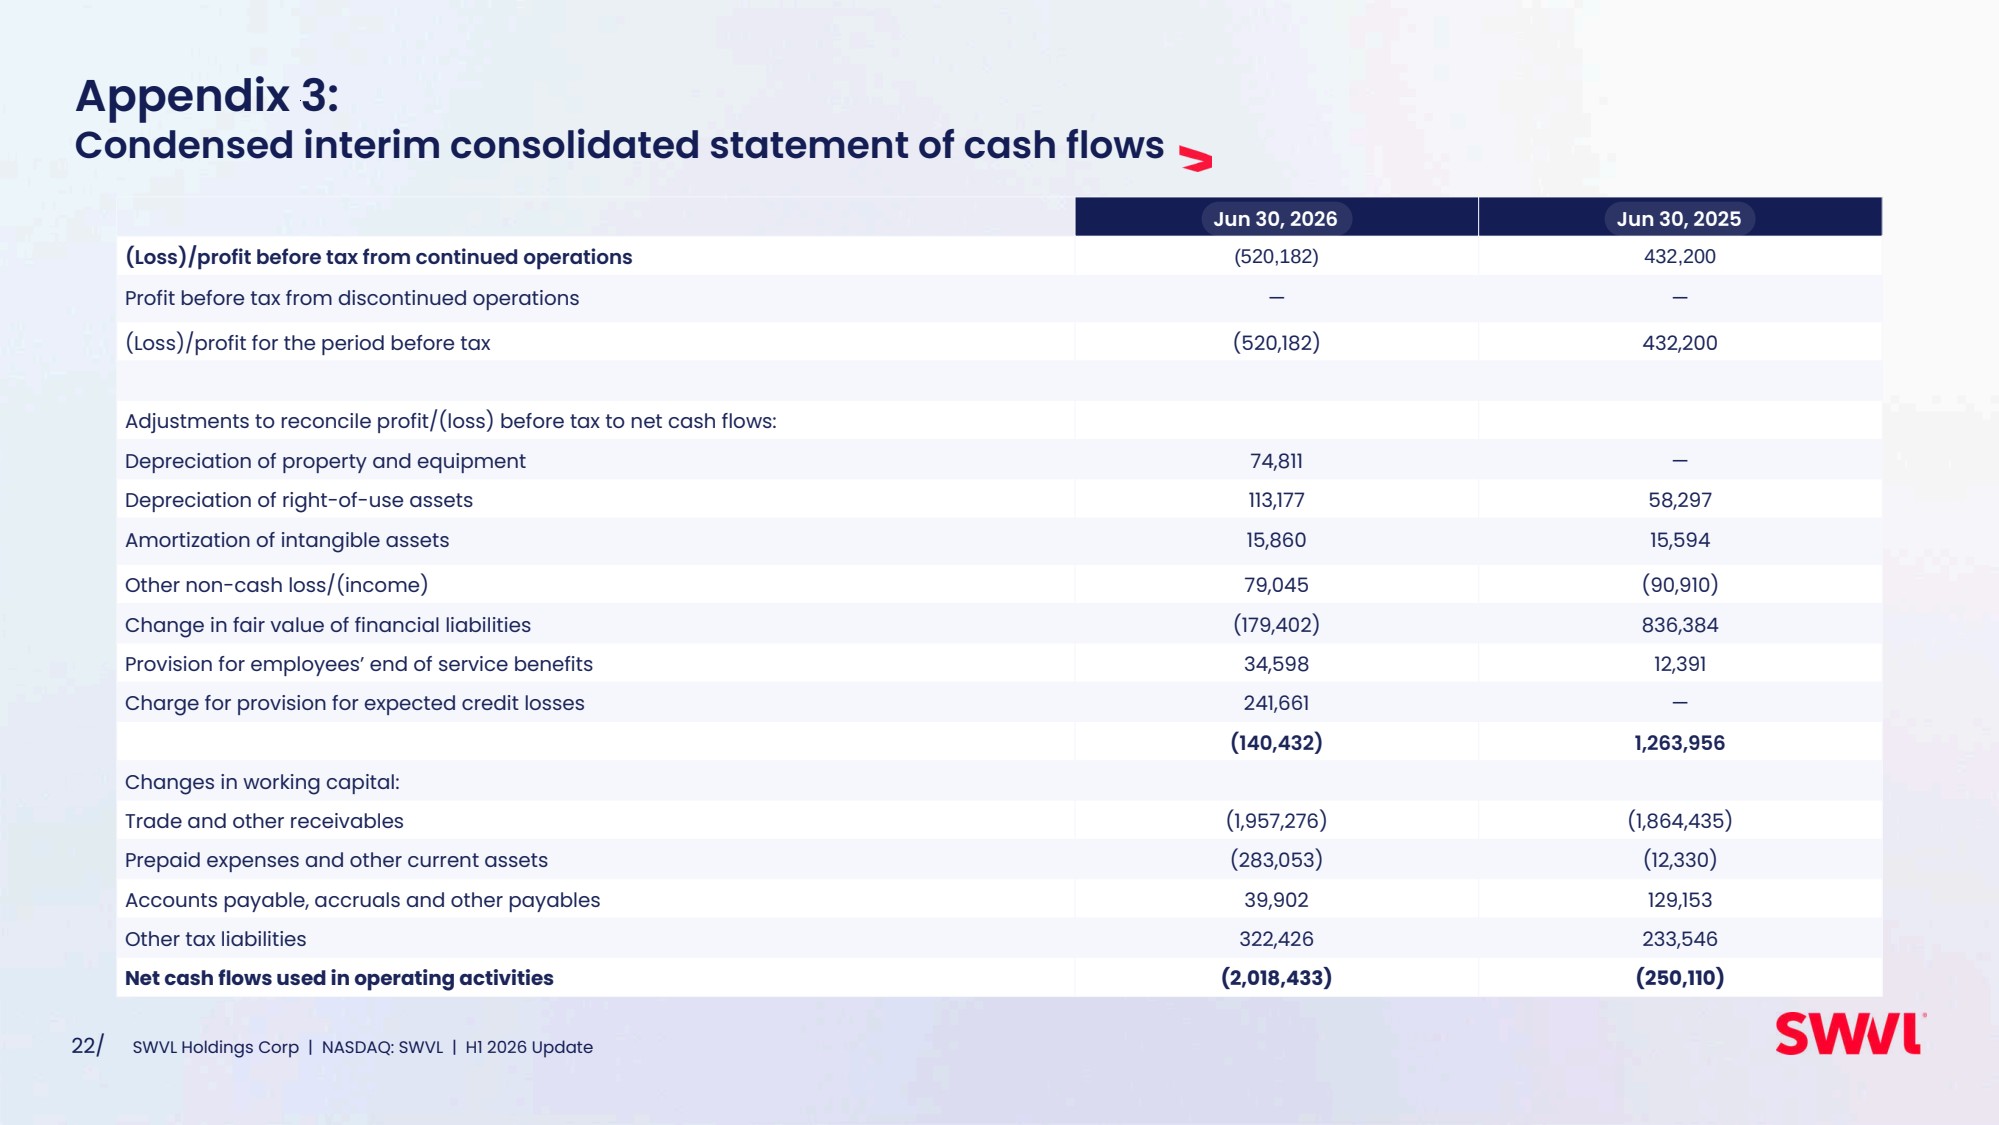
| 22/ SWVL Holdings Corp | NASDAQ: SWVL | H1 2026 Update Jun 30, 2026 Jun 30, 2025 (Loss)/profit before tax from continued operations (520,182) 432,200 Profit before tax from discontinued operations — — (Loss)/profit for the period before tax (520,182) 432,200 Adjustments to reconcile profit/(loss) before tax to net cash flows: Depreciation of property and equipment 74,811 — Depreciation of right-of-use assets 113,177 58,297 Amortization of intangible assets 15,860 15,594 Other non-cash loss/(income) 79,045 (90,910) Change in fair value of financial liabilities (179,402) 836,384 Provision for employees’ end of service benefits 34,598 12,391 Charge for provision for expected credit losses 241,661 — (140,432) 1,263,956 Changes in working capital: Trade and other receivables (1,957,276) (1,864,435) Prepaid expenses and other current assets (283,053) (12,330) Accounts payable, accruals and other payables 39,902 129,153 Other tax liabilities 322,426 233,546 Net cash flows used in operating activities (2,018,433) (250,110) Appendix 3: Condensed interim consolidated statement of cash flows |
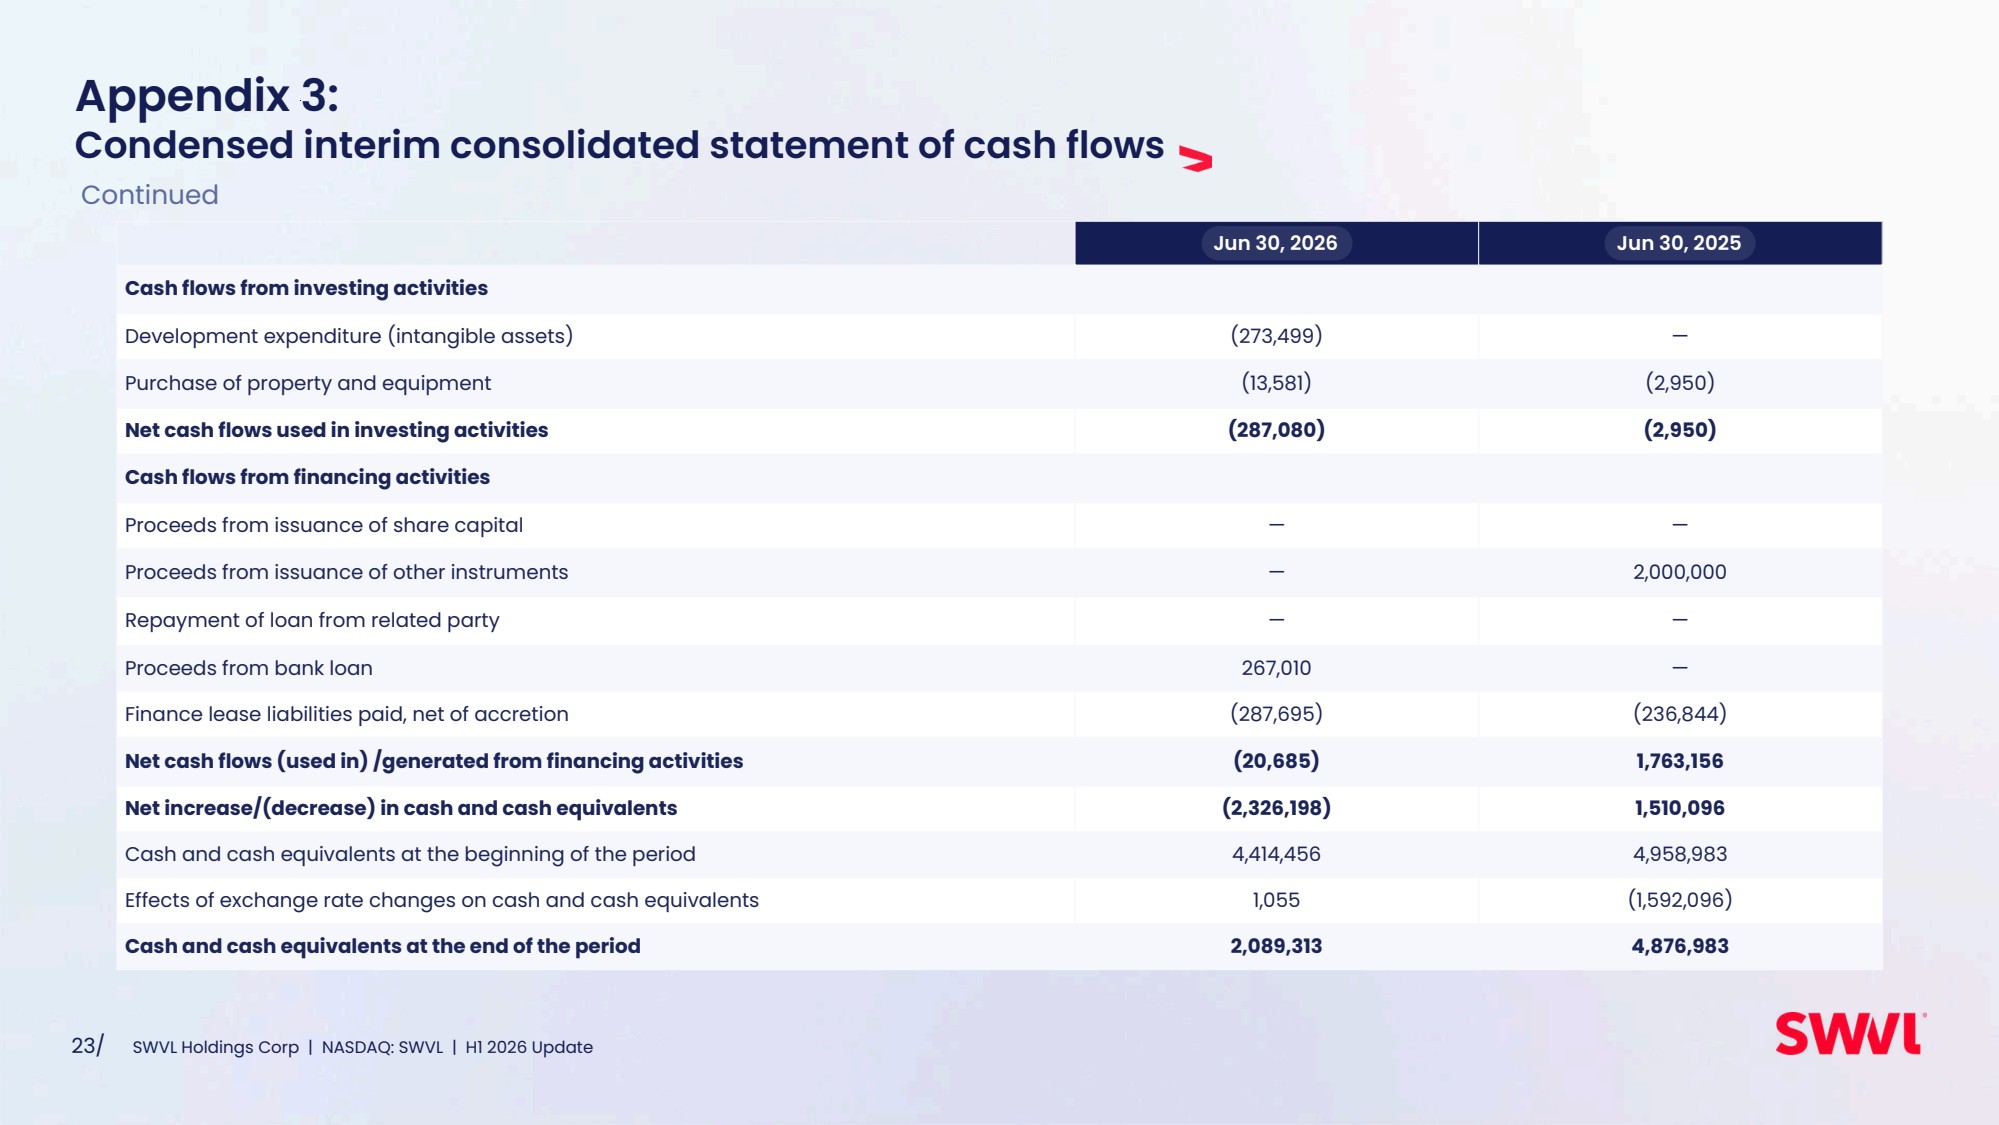
| 23/ SWVL Holdings Corp | NASDAQ: SWVL | H1 2026 Update Jun 30, 2026 Jun 30, 2025 Cash flows from investing activities Development expenditure (intangible assets) (273,499) — Purchase of property and equipment (13,581) (2,950) Net cash flows used in investing activities (287,080) (2,950) Cash flows from financing activities Proceeds from issuance of share capital — — Proceeds from issuance of other instruments — 2,000,000 Repayment of loan from related party — — Proceeds from bank loan 267,010 — Finance lease liabilities paid, net of accretion (287,695) (236,844) Net cash flows (used in) /generated from financing activities (20,685) 1,763,156 Net increase/(decrease) in cash and cash equivalents (2,326,198) 1,510,096 Cash and cash equivalents at the beginning of the period 4,414,456 4,958,983 Effects of exchange rate changes on cash and cash equivalents 1,055 (1,592,096) Cash and cash equivalents at the end of the period 2,089,313 4,876,983 Appendix 3: Condensed interim consolidated statement of cash flows Continued |
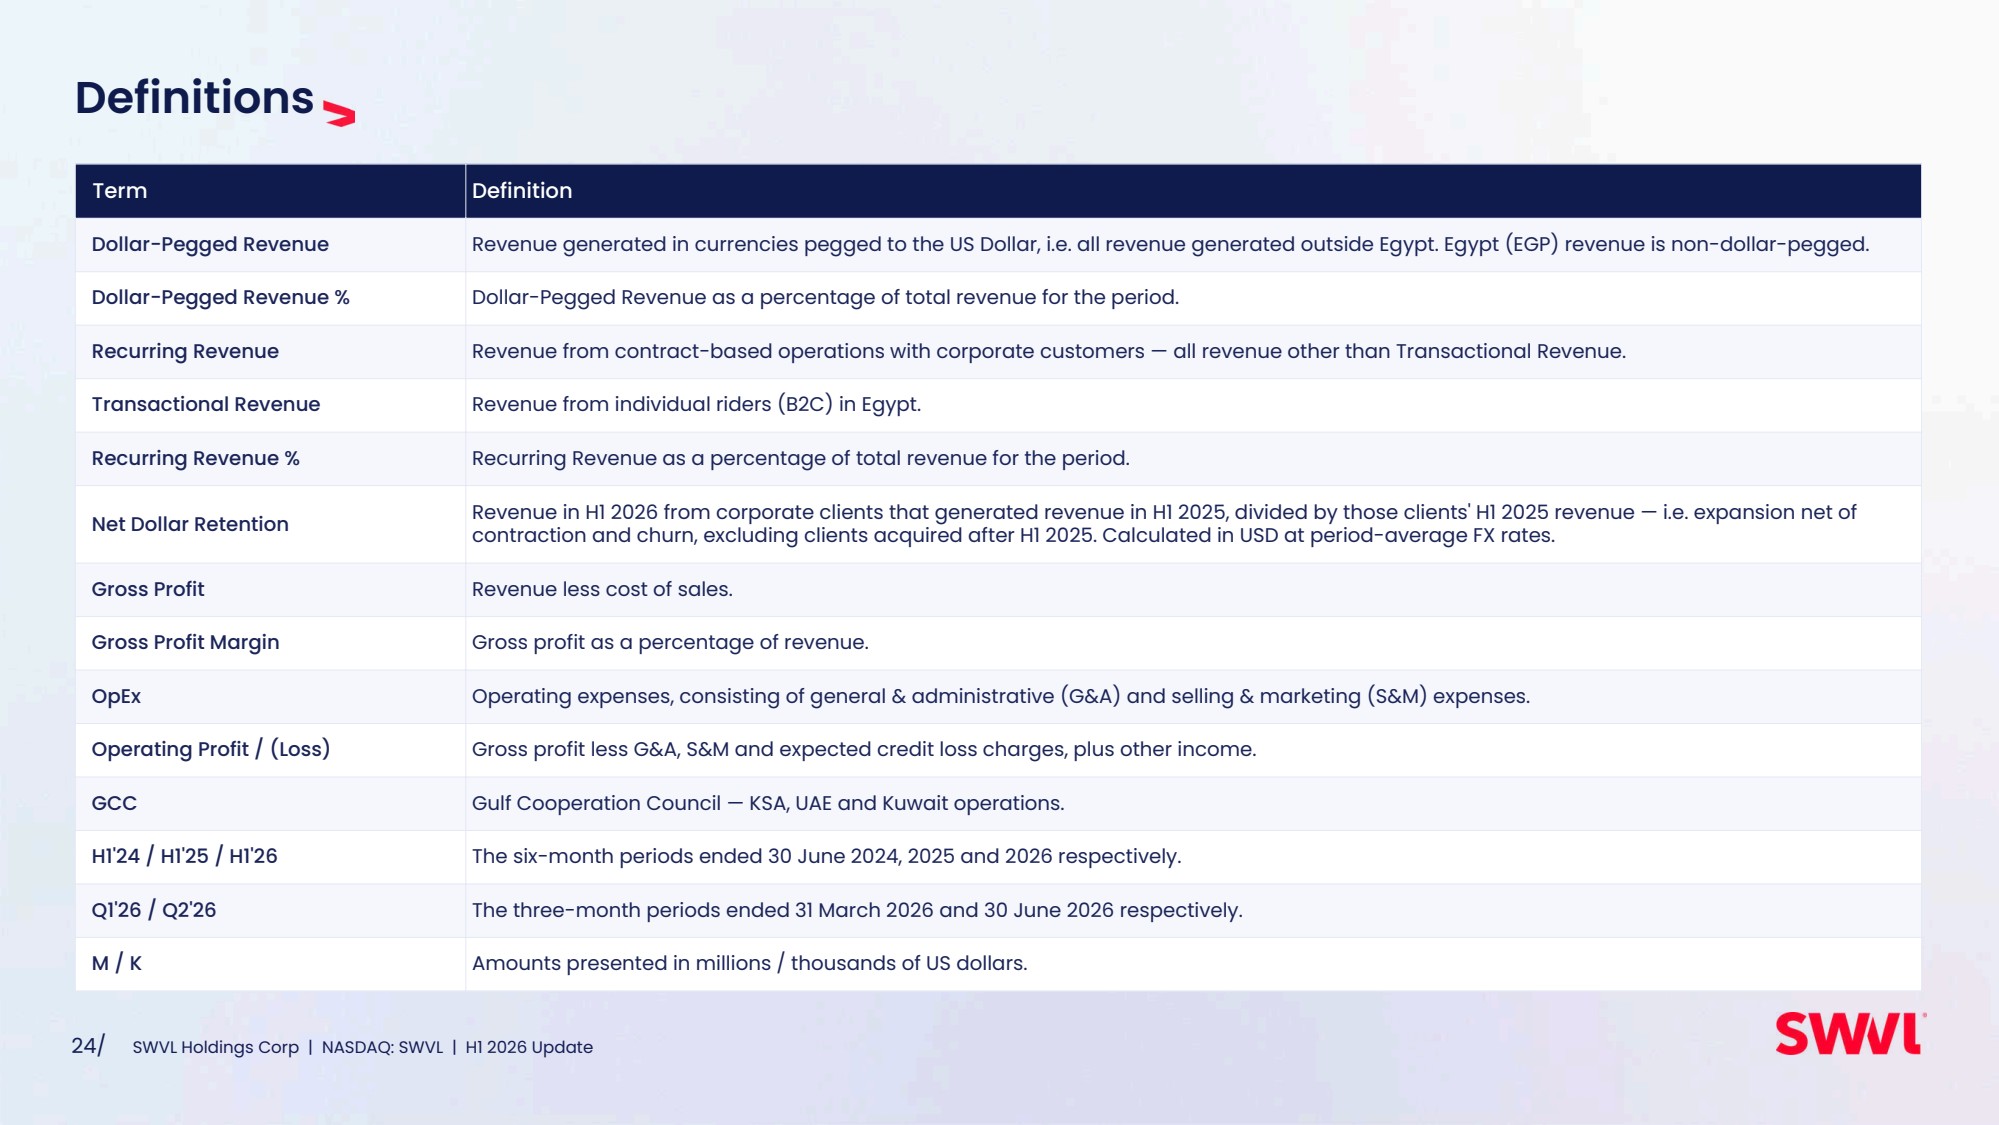
| Definitions Term Definition Dollar-Pegged Revenue Revenue generated in currencies pegged to the US Dollar, i.e. all revenue generated outside Egypt. Egypt (EGP) revenue is non-dollar-pegged. Dollar-Pegged Revenue % Dollar-Pegged Revenue as a percentage of total revenue for the period. Recurring Revenue Revenue from contract-based operations with corporate customers — all revenue other than Transactional Revenue. Transactional Revenue Revenue from individual riders (B2C) in Egypt. Recurring Revenue % Recurring Revenue as a percentage of total revenue for the period. Net Dollar Retention Revenue in H1 2026 from corporate clients that generated revenue in H1 2025, divided by those clients' H1 2025 revenue — i.e. expansion net of contraction and churn, excluding clients acquired after H1 2025. Calculated in USD at period-average FX rates. Gross Profit Revenue less cost of sales. Gross Profit Margin Gross profit as a percentage of revenue. OpEx Operating expenses, consisting of general & administrative (G&A) and selling & marketing (S&M) expenses. Operating Profit / (Loss) Gross profit less G&A, S&M and expected credit loss charges, plus other income. GCC Gulf Cooperation Council — KSA, UAE and Kuwait operations. H1'24 / H1'25 / H1'26 The six-month periods ended 30 June 2024, 2025 and 2026 respectively. Q1'26 / Q2'26 The three-month periods ended 31 March 2026 and 30 June 2026 respectively. M / K Amounts presented in millions / thousands of US dollars. 24/ SWVL Holdings Corp | NASDAQ: SWVL | H1 2026 Update |
|