Shareholder Report
Jul. 31, 2026
USD ($)
Holding
Fund Expenses
(Based on a hypothetical $10,000 investment)
| Fund (Class) | Costs of a $10,000 investment | Costs paid as a percentage of a $10,000 investment1 |
| Tradr 2X Long AAOI Daily ETF (AAOX) |
$38 | 1.49%2 |
| 1 |
The Fund commenced operations on March 23, 2026. If the Fund had been operational for the entire annual period of August 1, 2025 to July 31, 2026, expenses would have been higher.
|
| 2 |
Annualized.
|
Management's Discussion of Fund Performance
SUMMARY OF RESULTS
The Tradr 2X Long AAOI Daily ETF (“AAOX” or the “Fund”) seeks daily investment results, before fees and expenses, that correspond to two times (2x) the daily performance of the Applied Optoelectronics common stock (the “Reference Asset”). The Fund invests in financial instruments that the Advisor believes, in combination, should produce daily returns consistent with the Fund’s investment objective.
For the period ending July 31, 2026, the Fund had a total return of -58.40% since inception on March 23, 2026 and an average daily statistical correlation of over 0.99 to two times that of the return of the Reference Asset after fees and the cost of leverage financing. For the same period, the Reference Asset had a total return of -1.50% and an annualized volatility of 149.4%.
The Reference Asset performance was driven by the performance of its fiber-optic networking business. For more information on the company’s financial performance, please see the Applied Optoelectronics annual shareholders report and quarterly filings. Primary factors affecting Fund performance include the total return of the securities and derivatives held by the Fund, the performance of the assets to which any derivatives are linked, financing rates paid or earned, the types of derivative contracts used and their correlation to the Fund’s Reference Asset, expenses, transaction costs, the volatility of the Fund’s Reference Asset (and its impact on compounding), and other miscellaneous factors.
Fund Performance
The following graph and chart compare the initial and subsequent account values at the end of each of the most recently completed 10 fiscal years of the Fund or for the life of the Fund, if shorter. It assumes a $10,000 initial investment at the beginning of the first fiscal year in an appropriate, broad-based securities market index for the same period.
GROWTH OF $10,000
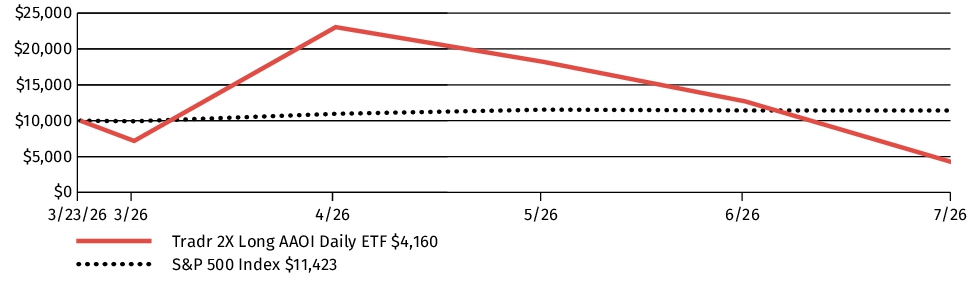
| AVERAGE ANNUAL TOTAL RETURN | Since Inception1 |
| Tradr 2X Long AAOI Daily ETF (AAOX) | -58.40% |
| S&P 500 Index | 14.23% |
|
1
|
The Fund commenced operations on March 23, 2026. Since Inception return is cumulative if time since inception is less than one year.
|
The graph and table do not reflect the deduction of taxes that a shareholder would pay on Fund distributions or redemption of Fund shares.
Visit https://www.tradretfs.com/aaox#literature for the most recent performance information.
Key Fund Statistics
The following table outlines key fund statistics that you should pay attention to.
| Fund net assets | $141,899,095 |
| Total number of portfolio holdings | 2 |
| Total advisory fees paid (net) | $1,809,031 |
| Portfolio turnover rate as of the end of the reporting period | 0% |
Graphical Representation of Holdings
The table below shows the investment makeup of the Fund, representing percentage of the total net assets of the Fund. *Cash includes cash, cash equivalents and other assets less liabilities.
Allocation of Portfolio Holdings
| Cash* | 69% |
| Swap | 31% |
| Total | 100% |
Material Fund Changes
The Fund did not have any material changes that occurred since the beginning of the reporting period.
Changes in and Disagreements with Accountants
There were no changes in or disagreements with the Fund's accountants during the reporting period.
Fund Expenses
(Based on a hypothetical $10,000 investment)
| Fund (Class) | Costs of a $10,000 investment | Costs paid as a percentage of a $10,000 investment1 |
| Tradr 2X Long LEU Daily ETF (LEUX) |
$51 | 1.49%2 |
| 1 |
The Fund commenced operations on February 18, 2026. If the Fund had been operational for the entire annual period of August 1, 2025 to July 31, 2026, expenses would have been higher.
|
| 2 |
Annualized.
|
Management's Discussion of Fund Performance
SUMMARY OF RESULTS
The Tradr 2X Long LEU Daily ETF (“LEUX” or the “Fund”) seeks daily investment results, before fees and expenses, that correspond to two times (2x) the daily performance of the Centrus Energy common stock (the “Reference Asset”). The Fund invests in financial instruments that the Advisor believes, in combination, should produce daily returns consistent with the Fund’s investment objective.
For the period ending July 31, 2026, the Fund had a total return of -48.56% since inception on February 18, 2026 and an average daily statistical correlation of over 0.99 to two times that of the return of the Reference Asset after fees and the cost of leverage financing. For the same period, the Reference Asset had a total return of -14.39% and an annualized volatility of 81.5%.
The Reference Asset performance was driven by the performance of its low-enriched uranium business. For more information on the company’s financial performance, please see the Centrus Energy annual shareholders report and quarterly filings. Primary factors affecting Fund performance include the total return of the securities and derivatives held by the Fund, the performance of the assets to which any derivatives are linked, financing rates paid or earned, the types of derivative contracts used and their correlation to the Fund’s Reference Asset, expenses, transaction costs, the volatility of the Fund’s Reference Asset (and its impact on compounding), and other miscellaneous factors.
Fund Performance
The following graph and chart compare the initial and subsequent account values at the end of each of the most recently completed 10 fiscal years of the Fund or for the life of the Fund, if shorter. It assumes a $10,000 initial investment at the beginning of the first fiscal year in an appropriate, broad-based securities market index for the same period.
GROWTH OF $10,000
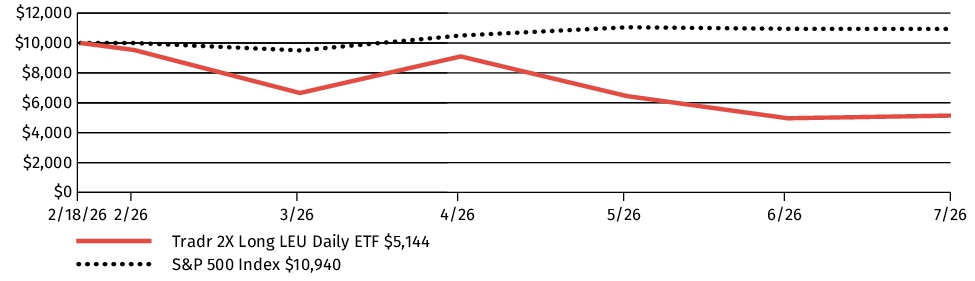
| AVERAGE ANNUAL TOTAL RETURN | Since Inception1 |
| Tradr 2X Long LEU Daily ETF (LEUX) | -48.56% |
| S&P 500 Index | 9.40% |
|
1
|
The Fund commenced operations on February 18, 2026. Since Inception return is cumulative if time since inception is less than one year.
|
The graph and table do not reflect the deduction of taxes that a shareholder would pay on Fund distributions or redemption of Fund shares.
Visit https://www.tradretfs.com/leux#literature for the most recent performance information.
Key Fund Statistics
The following table outlines key fund statistics that you should pay attention to.
| Fund net assets | $6,430,462 |
| Total number of portfolio holdings | 1 |
| Total advisory fees paid (net) | $24,083 |
| Portfolio turnover rate as of the end of the reporting period | 0% |
Graphical Representation of Holdings
The table below shows the investment makeup of the Fund, representing percentage of the total net assets of the Fund. *Cash includes cash, cash equivalents and other assets less liabilities.
Allocation of Portfolio Holdings
| Cash* | 84% |
| Swap | 16% |
| Total | 100% |
Material Fund Changes
The Fund did not have any material changes that occurred since the beginning of the reporting period.
Changes in and Disagreements with Accountants
There were no changes in or disagreements with the Fund's accountants during the reporting period.
This report describes changes to the Fund that occurred during the reporting period.
Fund Expenses
(Based on a hypothetical $10,000 investment)
| Fund (Class) | Costs of a $10,000 investment | Costs paid as a percentage of a $10,000 investment1 |
| Tradr 2X Long LITE Daily ETF (LITX) |
$136 | 1.49%2 |
| 1 |
The Fund commenced operations on January 26, 2026. If the Fund had been operational for the entire annual period of August 1, 2025 to July 31, 2026, expenses would have been higher.
|
| 2 |
Annualized.
|
Management's Discussion of Fund Performance
SUMMARY OF RESULTS
The Tradr 2X Long LITE Daily ETF (“LITX” or the “Fund”) seeks daily investment results, before fees and expenses, that correspond to two times (2x) the daily performance of the Lumentum common stock (the “Reference Asset”). The Fund invests in financial instruments that the Advisor believes, in combination, should produce daily returns consistent with the Fund’s investment objective.
For the period ending July 31, 2026, the Fund had a total return of 155.36% since inception on January 26, 2026 and an average daily statistical correlation of over 0.99 to two times that of the return of the Reference Asset after fees and the cost of leverage financing. For the same period, the Reference Asset had a total return of 114.75% and an annualized volatility of 100.8%.
The Reference Asset performance was driven by the performance of its optical and photonics products business. For more information on the company’s financial performance, please see the Lumentum annual shareholders report and quarterly filings. Primary factors affecting Fund performance include the total return of the securities and derivatives held by the Fund, the performance of the assets to which any derivatives are linked, financing rates paid or earned, the types of derivative contracts used and their correlation to the Fund’s Reference Asset, expenses, transaction costs, the volatility of the Fund’s Reference Asset (and its impact on compounding), and other miscellaneous factors.
Fund Performance
The following graph and chart compare the initial and subsequent account values at the end of each of the most recently completed 10 fiscal years of the Fund or for the life of the Fund, if shorter. It assumes a $10,000 initial investment at the beginning of the first fiscal year in an appropriate, broad-based securities market index for the same period.
GROWTH OF $10,000
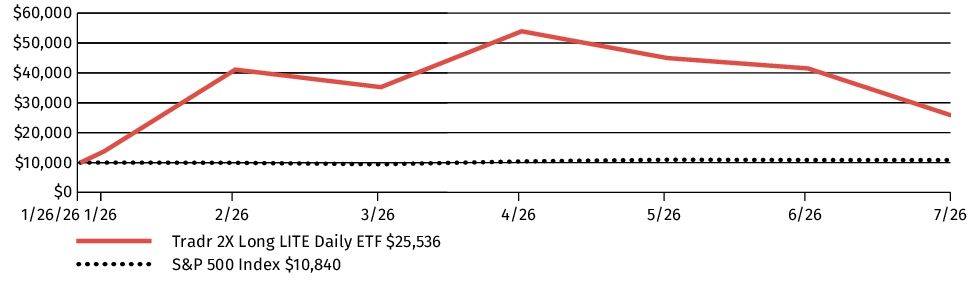
| AVERAGE ANNUAL TOTAL RETURN | Since Inception1 |
| Tradr 2X Long LITE Daily ETF (LITX) | 155.36% |
| S&P 500 Index | 8.40% |
|
1
|
The Fund commenced operations on January 26, 2026. Since Inception return is cumulative if time since inception is less than one year.
|
The graph and table do not reflect the deduction of taxes that a shareholder would pay on Fund distributions or redemption of Fund shares.
Visit https://www.tradretfs.com/litx#literature for the most recent performance information.
Key Fund Statistics
The following table outlines key fund statistics that you should pay attention to.
| Fund net assets | $192,151,197 |
| Total number of portfolio holdings | 4 |
| Total advisory fees paid (net) | $2,728,709 |
| Portfolio turnover rate as of the end of the reporting period | 0% |
Graphical Representation of Holdings
The table below shows the investment makeup of the Fund, representing percentage of the total net assets of the Fund. *Cash includes cash, cash equivalents and other assets less liabilities.
Allocation of Portfolio Holdings
| Cash* | 80% |
| Swap | 20% |
| Total | 100% |
Material Fund Changes
On February 24, 2026, the Trust’s Board approved a three-for-one forward share split for shares of the Fund, effective after the close of business on March 9, 2026.
This is a summary of certain changes to the Fund since August 1, 2025. For more complete information, you may review the Fund's prospectus, which is dated January 26, 2026, as amended February 25, 2026 at https://www.tradretfs.com/litx#literature.
This is a summary of certain changes to the Fund since August 1, 2025. For more complete information, you may review the Fund's prospectus, which is dated January 26, 2026, as amended February 25, 2026 at https://www.tradretfs.com/litx#literature.
Changes in and Disagreements with Accountants
There were no changes in or disagreements with the Fund's accountants during the reporting period.
This report describes changes to the Fund that occurred during the reporting period.
Fund Expenses
(Based on a hypothetical $10,000 investment)
| Fund (Class) | Costs of a $10,000 investment | Costs paid as a percentage of a $10,000 investment1 |
| Tradr 2X Long SNDK Daily ETF (SNXX) |
$158 | 1.54%2 |
| 1 |
The Fund commenced operations on January 26, 2026. If the Fund had been operational for the entire annual period of August 1, 2025 to July 31, 2026, expenses would have been higher.
|
| 2 |
Annualized.
|
Management's Discussion of Fund Performance
SUMMARY OF RESULTS
The Tradr 2X Long SNDK Daily ETF (“SNXX” or the “Fund”) seeks daily investment results, before fees and expenses, that correspond to two times (2x) the daily performance of the Sandisk common stock (the “Reference Asset”). The Fund invests in financial instruments that the Advisor believes, in combination, should produce daily returns consistent with the Fund’s investment objective.
For the period ending July 31, 2026, the Fund had a total return of 200.16% since inception on January 26, 2026 and an average daily statistical correlation of over 0.99 to two times that of the return of the Reference Asset after fees and the cost of leverage financing. For the same period, the Reference Asset had a total return of 158.04% and an annualized volatility of 120.0%.
The Reference Asset performance was driven by the performance of its flash memory semiconductors business. For more information on the company’s financial performance, please see the Sandisk annual shareholders report and quarterly filings. Primary factors affecting Fund performance include the total return of the securities and derivatives held by the Fund, the performance of the assets to which any derivatives are linked, financing rates paid or earned, the types of derivative contracts used and their correlation to the Fund’s Reference Asset, expenses, transaction costs, the volatility of the Fund’s Reference Asset (and its impact on compounding), and other miscellaneous factors.
Fund Performance
The following graph and chart compare the initial and subsequent account values at the end of each of the most recently completed 10 fiscal years of the Fund or for the life of the Fund, if shorter. It assumes a $10,000 initial investment at the beginning of the first fiscal year in an appropriate, broad-based securities market index for the same period.
GROWTH OF $10,000
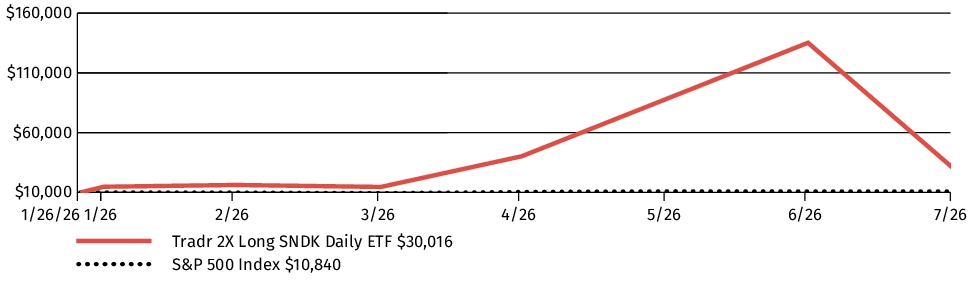
| AVERAGE ANNUAL TOTAL RETURN | Since Inception1 |
| Tradr 2X Long SNDK Daily ETF (SNXX) | 200.16% |
| S&P 500 Index | 8.40% |
|
1
|
The Fund commenced operations on January 26, 2026. Since Inception return is cumulative if time since inception is less than one year.
|
The graph and table do not reflect the deduction of taxes that a shareholder would pay on Fund distributions or redemption of Fund shares.
Visit https://www.tradretfs.com/snxx#literature for the most recent performance information.
Key Fund Statistics
The following table outlines key fund statistics that you should pay attention to.
| Fund net assets | $1,398,453,836 |
| Total number of portfolio holdings | 6 |
| Total advisory fees paid (net) | $14,032,876 |
| Portfolio turnover rate as of the end of the reporting period | 0% |
Graphical Representation of Holdings
The table below shows the investment makeup of the Fund, representing percentage of the total net assets of the Fund. *Cash includes cash, cash equivalents and other assets less liabilities.
Allocation of Portfolio Holdings
| Cash* | 88% |
| Call Options | 6% |
| Swap | 6% |
| Total | 100% |
Material Fund Changes
On May 14, 2026, the Trust’s Board approved a eight-for-one forward share split for shares of the Fund, effective after the close of business on June 2, 2026.
This is a summary of certain changes to the Fund since August 1, 2025. For more complete information, you may review the Fund's prospectus, which is dated January 26, 2026, as amended February 25, 2026 at https://www.tradretfs.com/snxx#literature.
This is a summary of certain changes to the Fund since August 1, 2025. For more complete information, you may review the Fund's prospectus, which is dated January 26, 2026, as amended February 25, 2026 at https://www.tradretfs.com/snxx#literature.
Changes in and Disagreements with Accountants
There were no changes in or disagreements with the Fund's accountants during the reporting period.
Fund Expenses
(Based on a hypothetical $10,000 investment)
| Fund (Class) | Costs of a $10,000 investment | Costs paid as a percentage of a $10,000 investment1 |
| Tradr 2X Long COHR Daily ETF (COHX) |
$64 | 1.49%2 |
| 1 |
The Fund commenced operations on February 18, 2026. If the Fund had been operational for the entire annual period of August 1, 2025 to July 31, 2026, expenses would have been higher.
|
| 2 |
Annualized.
|
Management's Discussion of Fund Performance
SUMMARY OF RESULTS
The Tradr 2X Long COHR Daily ETF (“COHX” or the “Fund”) seeks daily investment results, before fees and expenses, that correspond to two times (2x) the daily performance of the Coherent common stock (the “Reference Asset”). The Fund invests in financial instruments that the Advisor believes, in combination, should produce daily returns consistent with the Fund’s investment objective.
For the period ending July 31, 2026, the Fund had a total return of -10.16% since inception on February 18, 2026 and an average daily statistical correlation of over 0.99 to two times that of the return of the Reference Asset after fees and the cost of leverage financing. For the same period, the Reference Asset had a total return of 17.42% and an annualized volatility of 93.1%.
The Reference Asset performance was driven by the performance of its engineered materials and optoelectronic components business. For more information on the company’s financial performance, please see the Coherent annual shareholders report and quarterly filings. Primary factors affecting Fund performance include the total return of the securities and derivatives held by the Fund, the performance of the assets to which any derivatives are linked, financing rates paid or earned, the types of derivative contracts used and their correlation to the Fund’s Reference Asset, expenses, transaction costs, the volatility of the Fund’s Reference Asset (and its impact on compounding), and other miscellaneous factors.
Fund Performance
The following graph and chart compare the initial and subsequent account values at the end of each of the most recently completed 10 fiscal years of the Fund or for the life of the Fund, if shorter. It assumes a $10,000 initial investment at the beginning of the first fiscal year in an appropriate, broad-based securities market index for the same period.
GROWTH OF $10,000
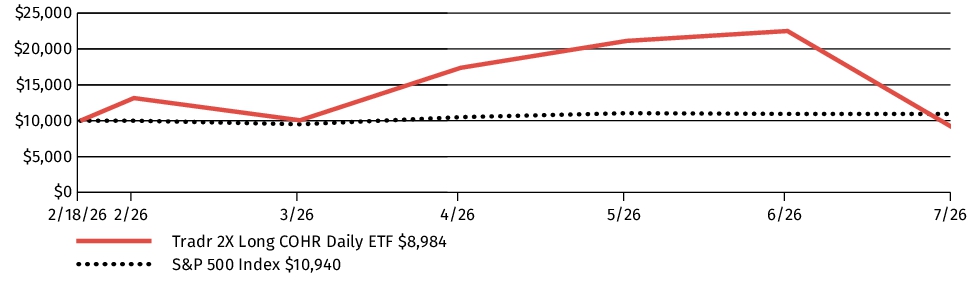
| AVERAGE ANNUAL TOTAL RETURN | Since Inception1 |
| Tradr 2X Long COHR Daily ETF (COHX) | -10.16% |
| S&P 500 Index | 9.40% |
|
1
|
The Fund commenced operations on February 18, 2026. Since Inception return is cumulative if time since inception is less than one year.
|
The graph and table do not reflect the deduction of taxes that a shareholder would pay on Fund distributions or redemption of Fund shares.
Visit https://www.tradretfs.com/cohx#literature for the most recent performance information.
Key Fund Statistics
The following table outlines key fund statistics that you should pay attention to.
| Fund net assets | $48,632,615 |
| Total number of portfolio holdings | 1 |
| Total advisory fees paid (net) | $548,377 |
| Portfolio turnover rate as of the end of the reporting period | 0% |
Graphical Representation of Holdings
The table below shows the investment makeup of the Fund, representing percentage of the total net assets of the Fund. *Cash includes cash, cash equivalents and other assets less liabilities.
Allocation of Portfolio Holdings
| Cash* | 88% |
| Swap | 12% |
| Total | 100% |
Material Fund Changes
The Fund did not have any material changes that occurred since the beginning of the reporting period.
Changes in and Disagreements with Accountants
There were no changes in or disagreements with the Fund's accountants during the reporting period.
Fund Expenses
(Based on a hypothetical $10,000 investment)
| Fund (Class) | Costs of a $10,000 investment | Costs paid as a percentage of a $10,000 investment1 |
| Tradr 2X Long SpaceX Daily ETF (SPCM) |
$14 | 1.49%2 |
| 1 |
The Fund commenced operations on June 12, 2026. If the Fund had been operational for the entire annual period of August 1, 2025 to July 31, 2026, expenses would have been higher.
|
| 2 |
Annualized.
|
Management's Discussion of Fund Performance
SUMMARY OF RESULTS
The Tradr 2X Long SpaceX Daily ETF (“SPCM” or the “Fund”) seeks daily investment results, before fees and expenses, that correspond to two times (2x) the daily performance of the SpaceX common stock (the “Reference Asset”). The Fund invests in financial instruments that the Advisor believes, in combination, should produce daily returns consistent with the Fund’s investment objective.
For the period ending July 31, 2026, the Fund had a total return of -60.08% since inception on June 12, 2026 and an average daily statistical correlation of over 0.99 to two times that of the return of the Reference Asset after fees and the cost of leverage financing. For the same period, the Reference Asset had a total return of -8.08% and an annualized volatility of 93.5%.
The Reference Asset performance was driven by the performance of its aerospace and space technology business. For more information on the company’s financial performance, please see the SpaceX annual shareholders report and quarterly filings. Primary factors affecting Fund performance include the total return of the securities and derivatives held by the Fund, the performance of the assets to which any derivatives are linked, financing rates paid or earned, the types of derivative contracts used and their correlation to the Fund’s Reference Asset, expenses, transaction costs, the volatility of the Fund’s Reference Asset (and its impact on compounding), and other miscellaneous factors.
Fund Performance
The following graph and chart compare the initial and subsequent account values at the end of each of the most recently completed 10 fiscal years of the Fund or for the life of the Fund, if shorter. It assumes a $10,000 initial investment at the beginning of the first fiscal year in an appropriate, broad-based securities market index for the same period.
GROWTH OF $10,000
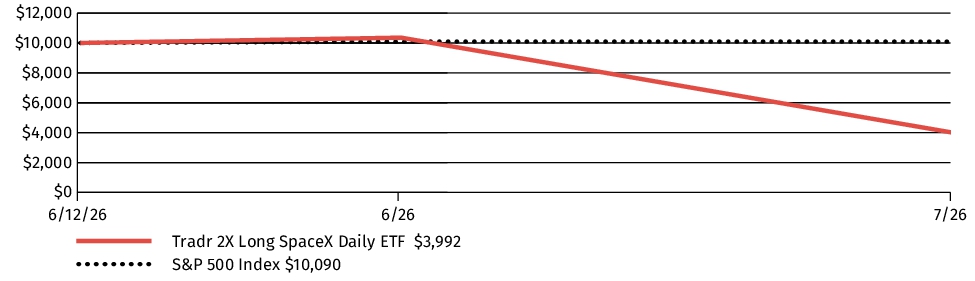
| AVERAGE ANNUAL TOTAL RETURN | Since Inception1 |
| Tradr 2X Long SpaceX Daily ETF (SPCM) | -60.08% |
| S&P 500 Index | 0.90% |
|
1
|
The Fund commenced operations on June 12, 2026. Since Inception return is cumulative if time since inception is less than one year.
|
The graph and table do not reflect the deduction of taxes that a shareholder would pay on Fund distributions or redemption of Fund shares.
Visit https://www.tradretfs.com/spcm#literature for the most recent performance information.
Key Fund Statistics
The following table outlines key fund statistics that you should pay attention to.
| Fund net assets | $10,474,797 |
| Total number of portfolio holdings | 1 |
| Total advisory fees paid (net) | $26,029 |
| Portfolio turnover rate as of the end of the reporting period | 0% |
Graphical Representation of Holdings
The table below shows the investment makeup of the Fund, representing percentage of the total net assets of the Fund. *Cash includes cash, cash equivalents and other assets less liabilities.
Allocation of Portfolio Holdings
| Cash* | 116% |
| Swap | (16)% |
| Total | 100% |
Material Fund Changes
The Fund did not have any material changes that occurred since the beginning of the reporting period.
Changes in and Disagreements with Accountants
There were no changes in or disagreements with the Fund's accountants during the reporting period.
Fund Expenses
(Based on a hypothetical $10,000 investment)
| Fund (Class) | Costs of a $10,000 investment | Costs paid as a percentage of a $10,000 investment1 |
| Tradr 2X Short SpaceX Daily ETF (SPCG) |
$26 | 1.49%2 |
| 1 |
The Fund commenced operations on June 12, 2026. If the Fund had been operational for the entire annual period of August 1, 2025 to July 31, 2026, expenses would have been higher.
|
| 2 |
Annualized.
|
Management's Discussion of Fund Performance
SUMMARY OF RESULTS
The Tradr 2X Short SpaceX Daily ETF (“SPCG” or the “Fund”) seeks daily investment results, before fees and expenses, that correspond to two times (2x) the daily performance of the SpaceX common stock (the “Reference Asset”). The Fund invests in financial instruments that the Advisor believes, in combination, should produce daily returns consistent with the Fund’s investment objective.
For the period ending July 31, 2026, the Fund had a total return of 56.36% since inception on June 12, 2026 and an average daily statistical correlation of over 0.99 to two times that of the return of the Reference Asset after fees and the cost of leverage financing. For the same period, the Reference Asset had a total return of -8.08% and an annualized volatility of 93.5%.
The Reference Asset performance was driven by the performance of its aerospace and space technology business. For more information on the company’s financial performance, please see the SpaceX annual shareholders report and quarterly filings. Primary factors affecting Fund performance include the total return of the securities and derivatives held by the Fund, the performance of the assets to which any derivatives are linked, financing rates paid or earned, the types of derivative contracts used and their correlation to the Fund’s Reference Asset, expenses, transaction costs, the volatility of the Fund’s Reference Asset (and its impact on compounding), and other miscellaneous factors.
Fund Performance
The following graph and chart compare the initial and subsequent account values at the end of each of the most recently completed 10 fiscal years of the Fund or for the life of the Fund, if shorter. It assumes a $10,000 initial investment at the beginning of the first fiscal year in an appropriate, broad-based securities market index for the same period.
GROWTH OF $10,000
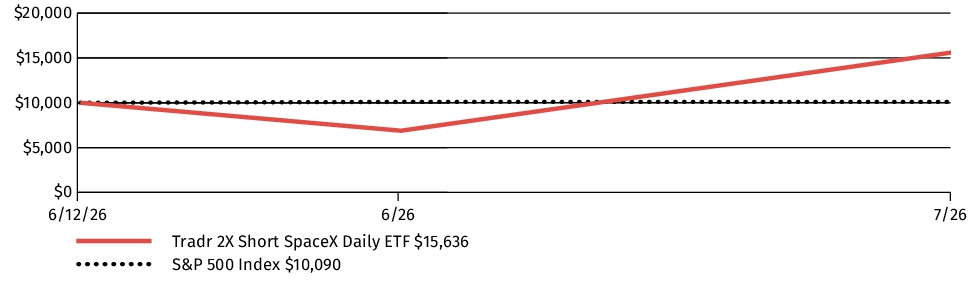
| AVERAGE ANNUAL TOTAL RETURN | Since Inception1 |
| Tradr 2X Short SpaceX Daily ETF (SPCG) | 56.36% |
| S&P 500 Index | 0.90% |
|
1
|
The Fund commenced operations on June 12, 2026. Since Inception return is cumulative if time since inception is less than one year.
|
The graph and table do not reflect the deduction of taxes that a shareholder would pay on Fund distributions or redemption of Fund shares.
Visit https://www.tradretfs.com/spcg#literature for the most recent performance information.
Key Fund Statistics
The following table outlines key fund statistics that you should pay attention to.
| Fund net assets | $25,411,317 |
| Total number of portfolio holdings | 1 |
| Total advisory fees paid (net) | $34,903 |
| Portfolio turnover rate as of the end of the reporting period | 0% |
Graphical Representation of Holdings
The table below shows the investment makeup of the Fund, representing percentage of the total net assets of the Fund. *Cash includes cash, cash equivalents and other assets less liabilities.
Allocation of Portfolio Holdings
| Swap | 74% |
| Cash* | 26% |
| Total | 100% |
Material Fund Changes
The Fund did not have any material changes that occurred since the beginning of the reporting period.
Changes in and Disagreements with Accountants
There were no changes in or disagreements with the Fund's accountants during the reporting period.
Fund Expenses
(Based on a hypothetical $10,000 investment)
| Fund (Class) | Costs of a $10,000 investment | Costs paid as a percentage of a $10,000 investment1 |
| Tradr 2X Long QNT Daily ETF (QNTU) |
$9 | 1.49%2 |
| 1 |
The Fund commenced operations on June 30, 2026. If the Fund had been operational for the entire annual period of August 1, 2025 to July 31, 2026, expenses would have been higher.
|
| 2 |
Annualized.
|
Management's Discussion of Fund Performance
SUMMARY OF RESULTS
The Tradr 2X Long QNT Daily ETF (“QNTU” or the “Fund”) seeks daily investment results, before fees and expenses, that correspond to two times (2x) the daily performance of the Quantinuum common stock (the “Reference Asset”). The Fund invests in financial instruments that the Advisor believes, in combination, should produce daily returns consistent with the Fund’s investment objective.
For the period ending July 31, 2026, the Fund had a total return of -63.84% since inception on June 30, 2026 and an average daily statistical correlation of over 0.99 to two times that of the return of the Reference Asset after fees and the cost of leverage financing. For the same period, the Reference Asset had a total return of -37.11% and an annualized volatility of 89.8%.
The Reference Asset performance was driven by the performance of its quantum computing and software solutions business. For more information on the company’s financial performance, please see the Quantinuum annual shareholders report and quarterly filings. Primary factors affecting Fund performance include the total return of the securities and derivatives held by the Fund, the performance of the assets to which any derivatives are linked, financing rates paid or earned, the types of derivative contracts used and their correlation to the Fund’s Reference Asset, expenses, transaction costs, the volatility of the Fund’s Reference Asset (and its impact on compounding), and other miscellaneous factors.
Fund Performance
The following graph and chart compare the initial and subsequent account values at the end of each of the most recently completed 10 fiscal years of the Fund or for the life of the Fund, if shorter. It assumes a $10,000 initial investment at the beginning of the first fiscal year in an appropriate, broad-based securities market index for the same period.
GROWTH OF $10,000
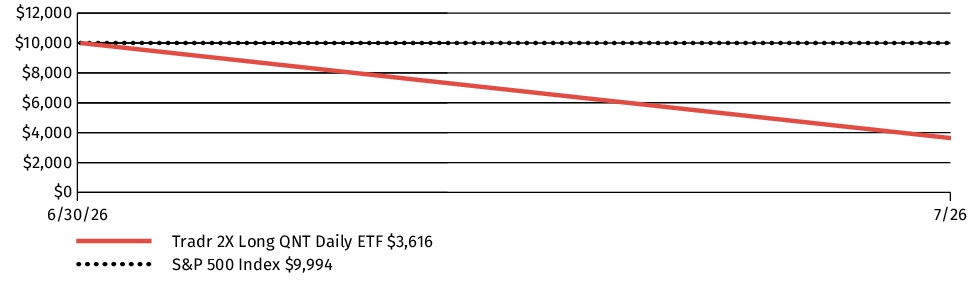
| AVERAGE ANNUAL TOTAL RETURN | Since Inception1 |
| Tradr 2X Long QNT Daily ETF (QNTU) | -63.84% |
| S&P 500 Index | -0.06% |
|
1
|
The Fund commenced operations on June 30, 2026. Since Inception return is cumulative if time since inception is less than one year.
|
The graph and table do not reflect the deduction of taxes that a shareholder would pay on Fund distributions or redemption of Fund shares.
Visit https://www.tradretfs.com/qntu#literature for the most recent performance information.
Key Fund Statistics
The following table outlines key fund statistics that you should pay attention to.
| Fund net assets | $497,005 |
| Total number of portfolio holdings | 1 |
| Total advisory fees paid (net) | $876 |
| Portfolio turnover rate as of the end of the reporting period | 0% |
Graphical Representation of Holdings
The table below shows the investment makeup of the Fund, representing percentage of the total net assets of the Fund. *Cash includes cash, cash equivalents and other assets less liabilities.
Allocation of Portfolio Holdings
| Cash* | 105% |
| Swap | (5)% |
| Total | 100% |
Material Fund Changes
The Fund did not have any material changes that occurred since the beginning of the reporting period.
Changes in and Disagreements with Accountants
There were no changes in or disagreements with the Fund's accountants during the reporting period.
Fund Expenses
(Based on a hypothetical $10,000 investment)
| Fund (Class) | Costs of a $10,000 investment | Costs paid as a percentage of a $10,000 investment1 |
| Tradr 2X Long CBRS Daily ETF (CBRX) |
$20 | 1.49%2 |
| 1 |
The Fund commenced operations on May 28, 2026. If the Fund had been operational for the entire annual period of August 1, 2025 to July 31, 2026, expenses would have been higher.
|
| 2 |
Annualized.
|
Management's Discussion of Fund Performance
SUMMARY OF RESULTS
The Tradr 2X Long CBRS Daily ETF (“CBRX” or the “Fund”) seeks daily investment results, before fees and expenses, that correspond to two times (2x) the daily performance of the Cerebras common stock (the “Reference Asset”). The Fund invests in financial instruments that the Advisor believes, in combination, should produce daily returns consistent with the Fund’s investment objective.
For the period ending July 31, 2026, the Fund had a total return of -52.52% since inception on May 28, 2026 and an average daily statistical correlation of over 0.99 to two times that of the return of the Reference Asset after fees and the cost of leverage financing. For the same period, the Reference Asset had a total return of -18.09% and an annualized volatility of 139.8%.
The Reference Asset performance was driven by the performance of its artificial intelligence infrastructure solutions business. For more information on the company’s financial performance, please see the Cerebras annual shareholders report and quarterly filings. Primary factors affecting Fund performance include the total return of the securities and derivatives held by the Fund, the performance of the assets to which any derivatives are linked, financing rates paid or earned, the types of derivative contracts used and their correlation to the Fund’s Reference Asset, expenses, transaction costs, the volatility of the Fund’s Reference Asset (and its impact on compounding), and other miscellaneous factors.
Fund Performance
The following graph and chart compare the initial and subsequent account values at the end of each of the most recently completed 10 fiscal years of the Fund or for the life of the Fund, if shorter. It assumes a $10,000 initial investment at the beginning of the first fiscal year in an appropriate, broad-based securities market index for the same period.
GROWTH OF $10,000
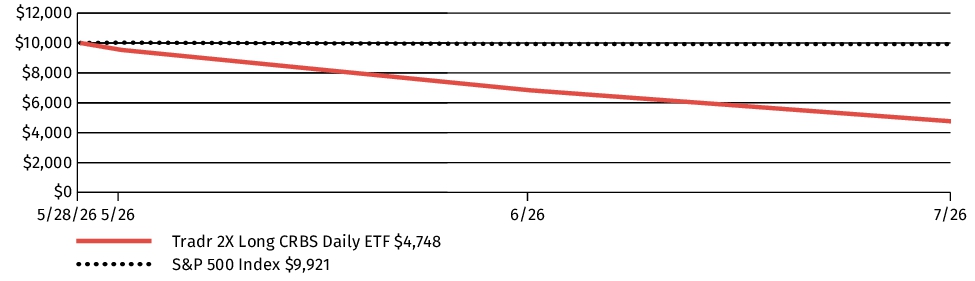
| AVERAGE ANNUAL TOTAL RETURN | Since Inception1 |
| Tradr 2X Long CBRS Daily ETF (CBRX) | -52.52% |
| S&P 500 Index | -0.79% |
|
1
|
The Fund commenced operations on May 28, 2026. Since Inception return is cumulative if time since inception is less than one year.
|
The graph and table do not reflect the deduction of taxes that a shareholder would pay on Fund distributions or redemption of Fund shares.
Visit https://www.tradretfs.com/cbrx#literature for the most recent performance information.
Key Fund Statistics
The following table outlines key fund statistics that you should pay attention to.
| Fund net assets | $3,561,822 |
| Total number of portfolio holdings | 1 |
| Total advisory fees paid (net) | $12,276 |
| Portfolio turnover rate as of the end of the reporting period | 0% |
Graphical Representation of Holdings
The table below shows the investment makeup of the Fund, representing percentage of the total net assets of the Fund. *Cash includes cash, cash equivalents and other assets less liabilities.
Allocation of Portfolio Holdings
| Cash* | 118% |
| Swap | (18)% |
| Total | 100% |
Material Fund Changes
The Fund did not have any material changes that occurred since the beginning of the reporting period.
Changes in and Disagreements with Accountants
There were no changes in or disagreements with the Fund's accountants during the reporting period.
Fund Expenses
(Based on a hypothetical $10,000 investment)
| Fund (Class) | Costs of a $10,000 investment | Costs paid as a percentage of a $10,000 investment1 |
| Tradr 2X Short CBRS Daily ETF (CBRZ) |
$20 | 1.49%2 |
| 1 |
The Fund commenced operations on May 28, 2026. If the Fund had been operational for the entire annual period of August 1, 2025 to July 31, 2026, expenses would have been higher.
|
| 2 |
Annualized.
|
Management's Discussion of Fund Performance
SUMMARY OF RESULTS
The Tradr 2X Short CBRS Daily ETF (“CBRZ” or the “Fund”) seeks daily investment results, before fees and expenses, that correspond to two times (2x) the daily performance of the Cerebras common stock (the “Reference Asset”). The Fund invests in financial instruments that the Advisor believes, in combination, should produce daily returns consistent with the Fund’s investment objective.
For the period ending July 31, 2026, the Fund had a total return of -47.80% since inception on May 28, 2026 and an average daily statistical correlation of over 0.99 to two times that of the return of the Reference Asset after fees and the cost of leverage financing. For the same period, the Reference Asset had a total return of -18.09% and an annualized volatility of 139.8%.
The Reference Asset performance was driven by the performance of its artificial intelligence infrastructure solutions business. For more information on the company’s financial performance, please see the Cerebras annual shareholders report and quarterly filings. Primary factors affecting Fund performance include the total return of the securities and derivatives held by the Fund, the performance of the assets to which any derivatives are linked, financing rates paid or earned, the types of derivative contracts used and their correlation to the Fund’s Reference Asset, expenses, transaction costs, the volatility of the Fund’s Reference Asset (and its impact on compounding), and other miscellaneous factors.
Fund Performance
The following graph and chart compare the initial and subsequent account values at the end of each of the most recently completed 10 fiscal years of the Fund or for the life of the Fund, if shorter. It assumes a $10,000 initial investment at the beginning of the first fiscal year in an appropriate, broad-based securities market index for the same period.
GROWTH OF $10,000
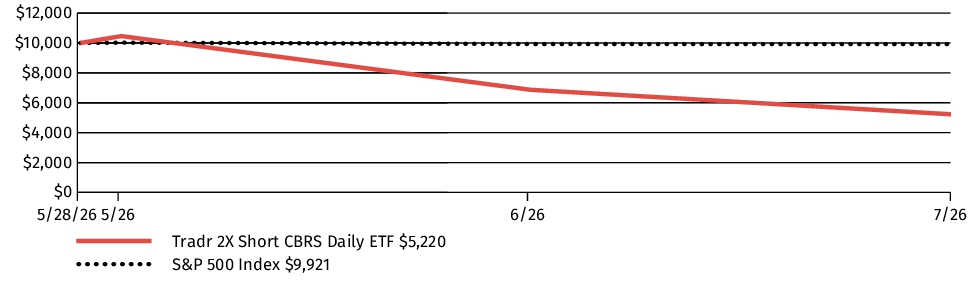
| AVERAGE ANNUAL TOTAL RETURN | Since Inception1 |
| Tradr 2X Short CBRS Daily ETF (CBRZ) | -47.80% |
| S&P 500 Index | -0.79% |
|
1
|
The Fund commenced operations on May 28, 2026. Since Inception return is cumulative if time since inception is less than one year.
|
The graph and table do not reflect the deduction of taxes that a shareholder would pay on Fund distributions or redemption of Fund shares.
Visit https://www.tradretfs.com/cbrz#literature for the most recent performance information.
Key Fund Statistics
The following table outlines key fund statistics that you should pay attention to.
| Fund net assets | $3,130,881 |
| Total number of portfolio holdings | 1 |
| Total advisory fees paid (net) | $8,222 |
| Portfolio turnover rate as of the end of the reporting period | 0% |
Graphical Representation of Holdings
The table below shows the investment makeup of the Fund, representing percentage of the total net assets of the Fund. *Cash includes cash, cash equivalents and other assets less liabilities.
Allocation of Portfolio Holdings
| Cash* | 58% |
| Swap | 42% |
| Total | 100% |
Material Fund Changes
The Fund did not have any material changes that occurred since the beginning of the reporting period.
Changes in and Disagreements with Accountants
There were no changes in or disagreements with the Fund's accountants during the reporting period.
| [1] | Annualized. |
| [2] | The Fund commenced operations on March 23, 2026. If the Fund had been operational for the entire annual period of August 1, 2025 to July 31, 2026, expenses would have been higher. |
| [3] | Annualized. |
| [4] | The Fund commenced operations on February 18, 2026. If the Fund had been operational for the entire annual period of August 1, 2025 to July 31, 2026, expenses would have been higher. |
| [5] | Annualized. |
| [6] | The Fund commenced operations on January 26, 2026. If the Fund had been operational for the entire annual period of August 1, 2025 to July 31, 2026, expenses would have been higher. |
| [7] | Annualized. |
| [8] | The Fund commenced operations on January 26, 2026. If the Fund had been operational for the entire annual period of August 1, 2025 to July 31, 2026, expenses would have been higher. |
| [9] | Annualized. |
| [10] | The Fund commenced operations on February 18, 2026. If the Fund had been operational for the entire annual period of August 1, 2025 to July 31, 2026, expenses would have been higher. |
| [11] | Annualized. |
| [12] | The Fund commenced operations on June 12, 2026. If the Fund had been operational for the entire annual period of August 1, 2025 to July 31, 2026, expenses would have been higher. |
| [13] | Annualized. |
| [14] | The Fund commenced operations on June 12, 2026. If the Fund had been operational for the entire annual period of August 1, 2025 to July 31, 2026, expenses would have been higher. |
| [15] | Annualized. |
| [16] | The Fund commenced operations on June 30, 2026. If the Fund had been operational for the entire annual period of August 1, 2025 to July 31, 2026, expenses would have been higher. |
| [17] | Annualized. |
| [18] | The Fund commenced operations on May 28, 2026. If the Fund had been operational for the entire annual period of August 1, 2025 to July 31, 2026, expenses would have been higher. |
| [19] | Annualized. |
| [20] | The Fund commenced operations on May 28, 2026. If the Fund had been operational for the entire annual period of August 1, 2025 to July 31, 2026, expenses would have been higher. |