Pay Versus Performance
We are required by SEC rules to disclose information regarding the relationship between “compensation actually paid,” as that term is used in Item 402(v) of Regulation S-K, to our NEOs, including (i) Mr. Howard Lutnick, who served as our PEO from 2021 until February 18, 2025 and (ii) Messrs. Abularrage, Aubin, and Windeatt, who have served as our PEOs since February 18, 2025, following Mr. Howard Lutnick’s departure, and the NEOs listed in the following table other than the PEO (the “non-PEO NEOs”), and the financial performance of the Company. The following table sets forth additional compensation information for our PEO and non-PEO NEOs during the periods described below along with total stockholder return (“TSR”), net income, and the “Company Selected Measure,” which we have selected as Total Revenues, each for fiscal years 2021, 2022, 2023, 2024 and 2025. The amounts set forth below under the headings “Compensation Actually Paid to PEO(s)” and “Average Compensation Actually Paid to Non-PEO NEOs” differ significantly from the Summary Compensation Table calculation of compensation, as well as from the way in which we and our Compensation Committee view annual compensation decisions, as discussed in the Compensation Discussion and Analysis. It does not reflect the amount of compensation actually realized or received by our NEOs during the applicable year. Footnote (5) below sets forth the adjustments from the Total Compensation for the PEOs and Average Total Compensation for the non-PEO NEOs reported in the Summary Compensation Table to arrive at the values presented for “compensation actually paid” for each of the fiscal years shown.
| Year | Name of | Summary | Compensation | Average | Average |
| Total | |||||||||||||||||||
| Total | Peer Group | Net | ||||||||||||||||||||||||
| PEO | (b) | (c) | (d) | (e) | (f) | (g) | (h) | (i) | ||||||||||||||||||
| 2025 | John Abularrage | $ | 11,066,057 | $ | 11,084,724 |
|
|
|
|
|
| |||||||||||||||
| JP Aubin | $ | 8,410,743 | $ | 8,945,281 |
|
|
|
|
|
| ||||||||||||||||
| Sean Windeatt | $ | 8,036,938 | $ | 8,064,245 |
|
|
|
|
|
| ||||||||||||||||
| Howard Lutnick | $ | 2,668,422 | $ | 3,304,717 | $ | 2,368,629 | $ | 2,370,363 | $ | 232.93 | $ | 226.97 | $ | 146,539 | $ | 2,941,460 | ||||||||||
| 2024 | $ | 15,000,000 | $ | 16,895,142 | $ | 2,699,507 | $ | 3,382,160 | $ | 234.30 | $ | 159.99 | $ | 123,228 | $ | 2,262,818 | ||||||||||
| 2023 | $ | 17,044,535 | $ | 17,129,973 | $ | 2,813,060 | $ | 2,875,959 | $ | 185.31 | $ | 111.72 | $ | 38,775 | $ | 2,025,401 | ||||||||||
| 2022 | $ | 13,000,000 | $ | 13,098,272 | $ | 1,677,060 | $ | 1,742,607 | $ | 96.03 | $ | 87.21 | $ | 58,867 | $ | 1,795,302 | ||||||||||
| 2021 | $ | 19,831,245 | $ | 19,926,553 | $ | 2,144,445 | $ | 2,189,041 | $ | 117.20 | $ | 81.54 | $ | 153,488 | $ | 2,015,364 | ||||||||||
____________
(1) The PEO was Mr. Howard Lutnick until February 18, 2025, when he stepped down following his confirmation by the United States Senate as the 41st Secretary of Commerce. Following Mr. Howard Lutnick’s departure, Messrs. Abularrage, Aubin, and Windeatt were appointed Co-PEOs.
(2) The non-PEO NEOs in fiscal year 2025 consisted of Messrs. Merkel and Hauf. The non-PEO NEOs in fiscal years 2023 and 2024 consisted of Messrs. Merkel, Windeatt, and Hauf. The non-PEO NEOs in fiscal year 2022 consisted of Messrs. Merkel, Windeatt, Hauf and Mr. Steven Bisgay. Mr. Bisgay served as Chief Financial Officer of the Company until June 6, 2022, and Mr. Hauf began serving as Chief Financial Officer on that date. When calculating the average compensation for the non-PEO NEOs in fiscal year 2022, each of Messrs. Bisgay and Hauf are included in the denominator of such calculation. The non-PEO NEOs in fiscal year 2021 consisted of Messrs. Merkel, Windeatt, and Bisgay, who each served for the entirety of the year. When calculating Mr. Windeatt’s portion of the average compensation for the non-PEO NEOs for each fiscal year, his portion was calculated using the applicable exchange rate as set forth in the notes to the Summary Compensation Table.
(3) The peer group consists of Compagnie Financière Tradition SA and TP ICAP Group plc. The returns of the peer group companies have been weighted according to their U.S. dollar stock market capitalization for purposes of arriving at a peer group average. TSR is calculated as the cumulative total stockholder return, on a gross dividend reinvestment basis, of $100 invested in shares of each of the Company and the peer group on December 31, 2020.
(4) The Company selected Total Revenues to be the most important financial performance measure that is not otherwise required to be disclosed in the table above used by the Company to link “compensation actually paid” to its NEOs for the most recently completed fiscal year to its performance. While Total Revenues was chosen for this table, our executive compensation programs use a balanced portfolio of measures to drive short- and long-term objectives aligned with our strategy and shareholder interests as further described in our Compensation Discussion and Analysis above.
(5) “Compensation Actually Paid to PEO(s)” in column (c) and “Average Compensation Actually Paid to Non-PEO NEOs” in column (e) reflect the following adjustments from Total Compensation amounts reported in the Summary Compensation Table (all amounts are averages for the non-PEO NEOs). Additionally, in the “Adjustments to Determine Compensation Actually Paid to PEO(s)” table below, for 2025, adjustments for both Mr. Howard Lutnick and Messrs. Abularrage, Aubin, and Windeatt are shown. For prior years in which Messrs. Abularrage, Aubin, and Windeatt did not serve as PEOs, these rows are designated with an asterisk.
Because our Incentive Plan bonus opportunities, and Mr. Abularrage’s bonus opportunities pursuant to the Abularrage Bonus Letter and guaranteed bonus under the Abularrage Employment Agreement, are initially denominated in cash and do not include a right to receive stock, when the Compensation Committee decides after the performance year is over to pay a portion of such awards in RSUs, as described in the footnotes to the Summary Compensation Table, we present such RSUs as Non-Equity Incentive Plan Compensation in column (g) or as Bonus in column (d) of the Summary Compensation Table, as applicable, for the performance year rather than as Equity Awards in column (e) of the Summary Compensation Table in the year of grant. To avoid double-counting such awards when calculating “Compensation Actually Paid to PEO(s)” in column (c) and “Average Compensation Actually Paid to Non-PEO NEOs” in column (e), they are neither deducted nor added in the year of grant, consistent with their presentation in the Summary Compensation Table. Similarly, for periods prior to the Corporate Conversion, the adjustments below do not include partnership-unit based awards that were granted pursuant to the Incentive Plan and reported in column (g) in the Summary Compensation Table in the applicable performance year at full notional value and not subsequently reportable as “Equity Awards” in column (e) of the Summary Compensation Table.
For full fiscal years after the Corporate Conversion, “Compensation Actually Paid to PEO” in column (c) and “Average Compensation Actually Paid to Non-PEO NEOs” in column (e) reflect the following adjustments from Total Compensation amounts reported in the Summary Compensation Table: (i) deductions for amounts reported under the “Equity Awards” column in the Summary Compensation Table; (ii) the dividend or dividend equivalents paid in the applicable period; (iii) the increase or decrease in fair value of any unvested RSUs or RSAs issued in previous years and held by the PEOs or non-PEO NEOs as of December 31 of the applicable period from their fair value as of December 31 of the prior period; (iv) the increase or decrease from the grant date in fair value of any unvested RSUs issued in the applicable period that were not reported under the “Equity Awards” column in the Summary Compensation Table held by the PEO and non-PEO NEOs as of December 31 of the applicable period from their grant date; (v) the increase or decrease in fair value from December 31 of the prior year of any RSUs or RSAs issued in previous years that vested during the applicable period; and (vi) the fair value as of the end of the fiscal year of all awards granted during the fiscal year and reported under the “Equity Awards” column in the Summary Compensation Table.
| Adjustments to Determine Compensation | Name of PEO | 2025 | 2024 | 2023 | 2022 | 2021 | |||||||||||||
| Deduction for change in actuarial present | • John Abularrage |
|
|
|
|
|
|
|
|
|
|
|
| ||||||
| value of accumulated benefit under | • JP Aubin |
|
|
|
|
|
|
|
|
|
|
|
| ||||||
| all defined benefit and actuarial | • Sean Windeatt |
|
|
|
|
|
|
|
|
|
|
|
| ||||||
| pension plans reported in the Summary | • Howard Lutnick |
|
|
|
|
|
|
|
|
|
|
|
| ||||||
| Compensation Table |
|
|
|
|
|
|
| ||||||||||||
| Increase for aggregate of service cost and | • John Abularrage |
|
|
|
|
|
|
|
|
|
|
|
| ||||||
| prior service cost for all defined benefit | • JP Aubin |
|
|
|
|
|
|
|
|
|
|
|
| ||||||
| and actuarial pension plans reported in the | • Sean Windeatt |
|
|
|
|
|
|
|
|
|
|
|
| ||||||
| Summary Compensation Table | • Howard Lutnick |
|
|
|
|
|
|
|
|
|
|
|
| ||||||
| Deduction for amounts reported | • John Abularrage | $ | (1,416,057 | ) |
|
|
|
|
|
|
|
|
| ||||||
| under the “Equity Awards” column | • JP Aubin | $ | (673,772 | ) |
|
|
|
|
|
|
|
|
| ||||||
| in the Summary Compensation Table | • Sean Windeatt |
|
|
|
|
|
|
|
|
|
|
|
| ||||||
| • Howard Lutnick | $ | (2,531,436 | ) |
|
| $ | (2,044,535 | ) |
| $ | (7,831,243 | ) | |||||||
| Deduction for amounts reported under the | • John Abularrage |
|
|
|
|
|
|
|
|
|
|
|
| ||||||
| “Option Awards” column in the Summary | • JP Aubin |
|
|
|
|
|
|
|
|
|
|
|
| ||||||
| Compensation Table | • Sean Windeatt |
|
|
|
|
|
|
|
|
|
|
|
| ||||||
| • Howard Lutnick |
|
|
|
|
|
|
|
|
|
|
|
| |||||||
| Increase/deduction for change in fair value from | • John Abularrage |
|
|
|
|
|
|
|
|
|
|
|
| ||||||
| grant date of stock and option awards granted | • JP Aubin |
|
|
|
|
|
|
|
|
|
|
|
| ||||||
| during year that were not reported under the | • Sean Windeatt | $ | 1,303 |
|
|
|
|
|
|
|
|
|
| ||||||
| “Equity Awards” column in the Summary | • Howard Lutnick |
|
|
| $ | 1,895,142 |
|
|
|
|
|
|
| ||||||
| Compensation Table and are outstanding and |
|
|
|
|
|
|
| ||||||||||||
| unvested as of year-end |
|
|
|
|
|
|
| ||||||||||||
| Increase/deduction for change in fair value as | • John Abularrage | $ | (24,310 | ) |
|
|
|
|
|
|
|
|
| ||||||
| of year-end (from prior year-end) of stock | • JP Aubin | $ | (37,191 | ) |
|
|
|
|
|
|
|
|
| ||||||
| and option awards granted in any prior year | • Sean Windeatt | $ | (31,047 | ) |
|
|
|
|
|
|
|
|
| ||||||
| that were outstanding and unvested as of | • Howard Lutnick |
|
|
|
|
|
|
|
|
|
|
|
| ||||||
| year-end |
|
|
|
|
|
|
| ||||||||||||
| Increase for fair value as of vesting date | • John Abularrage |
|
|
|
|
|
|
|
|
|
|
|
| ||||||
| of stock and option awards granted and | • JP Aubin |
|
|
|
|
|
|
|
|
|
|
|
| ||||||
| vested in the same year | • Sean Windeatt |
|
|
|
|
|
|
|
|
|
|
|
| ||||||
| • Howard Lutnick |
|
|
|
|
| $ | 2,044,535 |
|
| $ | 7,831,243 |
| |||||||
| Increase/deduction for fair value as of the end | • John Abularrage | $ | 1,444,499 |
|
|
|
|
|
|
|
|
|
| ||||||
| of the fiscal year of all awards granted | • JP Aubin | $ | 687,304 |
|
|
|
|
|
|
|
|
|
| ||||||
| during the fiscal year and reported under the | • Sean Windeatt |
|
|
|
|
|
|
|
|
|
|
|
| ||||||
| “Equity Awards” column in the Summary | • Howard Lutnick |
|
|
|
|
|
|
|
|
|
|
|
| ||||||
| Compensation Table and outstanding and |
|
|
|
|
|
|
| ||||||||||||
| unvested as of year-end |
|
|
|
|
|
|
| ||||||||||||
| Adjustments to Determine Compensation | Name of PEO | 2025 | 2024 | 2023 | 2022 | 2021 | |||||||||||
| Increase/deduction for change in fair value | • John Abularrge | $ | 14,536 |
|
|
|
|
|
|
|
| ||||||
| as of vesting date (from prior year-end) | • JP Aubin | $ | 519,602 |
|
|
|
|
|
|
|
| ||||||
| of stock and option awards granted in any | • Sean Windeatt | $ | 42,336 |
|
|
|
|
|
|
|
| ||||||
| prior year for which all vesting conditions | • Howard Lutnick | $ | 3,167,731 |
|
|
|
|
|
|
|
| ||||||
| were satisfied during year or at year-end |
|
|
|
|
| ||||||||||||
| Deduction for fair value as of prior year-end | • John Abularrage |
|
|
|
|
|
|
|
|
|
| ||||||
| of stock and option awards granted in any | • JP Aubin |
|
|
|
|
|
|
|
|
|
| ||||||
| prior year that were forfeited during year | • Sean Windeatt |
|
|
|
|
|
|
|
|
|
| ||||||
| • Howard Lutnick |
|
|
|
|
|
|
|
|
|
| |||||||
| Increase for dollar value of any dividends | • John Abularrage |
|
|
|
|
|
|
|
|
|
| ||||||
| or other earnings paid on stock or option | • JP Aubin | $ | 38,593 |
|
|
|
|
|
|
|
| ||||||
| awards in the year prior to the vesting date | • Sean Windeatt | $ | 14,695 |
|
|
|
|
|
|
|
| ||||||
| that are not otherwise included in total | • Howard Lutnick |
|
|
|
| $ | 62,899 | $ | 87,397 | $ | 44,596 | ||||||
| compensation for the year |
|
|
|
|
| ||||||||||||
| Total Adjustments | • John Abularrage | $ | 18,668 |
|
|
|
|
|
|
|
| ||||||
| • JP Aubin | $ | 534,537 |
|
|
|
|
|
|
|
| |||||||
| • Sean Windeatt | $ | 27,287 |
|
|
|
|
|
|
|
| |||||||
| • Howard Lutnick | $ | 636,295 | $ | 1,895,142 | $ | 62,899 | $ | 87,397 | $ | 44,596 | |||||||
| Adjustments to Determine Compensation | 2025 | 2024 | 2023 | 2022 | 2021 | ||||||||||||
| Deduction for change in actuarial present value of accumulated benefit under all defined benefit and actuarial pension plans reported in the Summary Compensation Table |
|
|
|
|
|
|
|
|
|
|
|
| |||||
| Increase for aggregate of service cost and prior service cost for all defined benefit and actuarial pension plans reported in the Summary Compensation Table |
|
|
|
|
|
|
|
|
|
|
|
| |||||
| Deduction for amounts reported under the “Equity Awards” column in the Summary Compensation Table | $ | (43,629 | ) |
|
| $ | (406,908 | ) |
| $ | (111,565 | ) | |||||
| Deduction for amounts reported under the “Option Awards” column in the Summary Compensation Table |
|
|
|
|
|
|
|
|
|
|
|
| |||||
| Increase/deduction for change in fair value from grant date of stock and option awards granted during year that were not reported under the “Equity Awards” column in the Summary Compensation Table and are outstanding and unvested as of year-end | $ | (13,313 | ) | $ | 149,256 |
|
|
|
|
|
|
| |||||
| Increase/deduction for change in fair value as of year-end (from prior year-end) of stock and option awards granted in any prior year that were outstanding and unvested as of year-end | $ | (3,645 | ) | $ | 306,511 |
|
|
|
|
|
|
| |||||
| Increase for fair value as of vesting date of stock and option awards granted and vested in the same year |
|
|
|
|
| $ | 406,908 |
|
| $ | 111,565 |
| |||||
| Increase/deduction for fair value as of the end of the fiscal year of all awards granted during the fiscal year and reported under the “Equity Awards” column in the Summary Compensation Table and outstanding and unvested as of year-end |
|
|
|
|
|
|
|
|
|
|
|
| |||||
| Adjustments to Determine Compensation | 2025 | 2024 | 2023 | 2022 | 2021 | ||||||||||
| Increase/deduction for change in fair value as of vesting date (from prior year-end) of stock and option awards granted in any prior year for which all vesting conditions were satisfied during year or at year-end | $ | 59,708 | $ | 174,057 |
|
|
|
|
|
| |||||
| Deduction for fair value as of prior year-end of stock and option awards granted in any prior year that were forfeited during year |
|
|
|
|
|
|
|
|
|
| |||||
| Increase for dollar value of any dividends or other earnings paid on stock or option awards in the year prior to the vesting date that are not otherwise included in total compensation for the year | $ | 2,613 | $ | 52,829 | $ | 62,899 | $ | 87,397 | $ | 44,596 | |||||
| Total Adjustments | $ | 1,734 | $ | 682,653 | $ | 62,899 | $ | 87,397 | $ | 44,596 | |||||
| Adjustments to Determine Compensation | Name of PEO | 2025 | 2024 | 2023 | 2022 | 2021 | |||||||||||||
| Deduction for change in actuarial present | • John Abularrage |
|
|
|
|
|
|
|
|
|
|
|
| ||||||
| value of accumulated benefit under | • JP Aubin |
|
|
|
|
|
|
|
|
|
|
|
| ||||||
| all defined benefit and actuarial | • Sean Windeatt |
|
|
|
|
|
|
|
|
|
|
|
| ||||||
| pension plans reported in the Summary | • Howard Lutnick |
|
|
|
|
|
|
|
|
|
|
|
| ||||||
| Compensation Table |
|
|
|
|
|
|
| ||||||||||||
| Increase for aggregate of service cost and | • John Abularrage |
|
|
|
|
|
|
|
|
|
|
|
| ||||||
| prior service cost for all defined benefit | • JP Aubin |
|
|
|
|
|
|
|
|
|
|
|
| ||||||
| and actuarial pension plans reported in the | • Sean Windeatt |
|
|
|
|
|
|
|
|
|
|
|
| ||||||
| Summary Compensation Table | • Howard Lutnick |
|
|
|
|
|
|
|
|
|
|
|
| ||||||
| Deduction for amounts reported | • John Abularrage | $ | (1,416,057 | ) |
|
|
|
|
|
|
|
|
| ||||||
| under the “Equity Awards” column | • JP Aubin | $ | (673,772 | ) |
|
|
|
|
|
|
|
|
| ||||||
| in the Summary Compensation Table | • Sean Windeatt |
|
|
|
|
|
|
|
|
|
|
|
| ||||||
| • Howard Lutnick | $ | (2,531,436 | ) |
|
| $ | (2,044,535 | ) |
| $ | (7,831,243 | ) | |||||||
| Deduction for amounts reported under the | • John Abularrage |
|
|
|
|
|
|
|
|
|
|
|
| ||||||
| “Option Awards” column in the Summary | • JP Aubin |
|
|
|
|
|
|
|
|
|
|
|
| ||||||
| Compensation Table | • Sean Windeatt |
|
|
|
|
|
|
|
|
|
|
|
| ||||||
| • Howard Lutnick |
|
|
|
|
|
|
|
|
|
|
|
| |||||||
| Increase/deduction for change in fair value from | • John Abularrage |
|
|
|
|
|
|
|
|
|
|
|
| ||||||
| grant date of stock and option awards granted | • JP Aubin |
|
|
|
|
|
|
|
|
|
|
|
| ||||||
| during year that were not reported under the | • Sean Windeatt | $ | 1,303 |
|
|
|
|
|
|
|
|
|
| ||||||
| “Equity Awards” column in the Summary | • Howard Lutnick |
|
|
| $ | 1,895,142 |
|
|
|
|
|
|
| ||||||
| Compensation Table and are outstanding and |
|
|
|
|
|
|
| ||||||||||||
| unvested as of year-end |
|
|
|
|
|
|
| ||||||||||||
| Increase/deduction for change in fair value as | • John Abularrage | $ | (24,310 | ) |
|
|
|
|
|
|
|
|
| ||||||
| of year-end (from prior year-end) of stock | • JP Aubin | $ | (37,191 | ) |
|
|
|
|
|
|
|
|
| ||||||
| and option awards granted in any prior year | • Sean Windeatt | $ | (31,047 | ) |
|
|
|
|
|
|
|
|
| ||||||
| that were outstanding and unvested as of | • Howard Lutnick |
|
|
|
|
|
|
|
|
|
|
|
| ||||||
| year-end |
|
|
|
|
|
|
| ||||||||||||
| Increase for fair value as of vesting date | • John Abularrage |
|
|
|
|
|
|
|
|
|
|
|
| ||||||
| of stock and option awards granted and | • JP Aubin |
|
|
|
|
|
|
|
|
|
|
|
| ||||||
| vested in the same year | • Sean Windeatt |
|
|
|
|
|
|
|
|
|
|
|
| ||||||
| • Howard Lutnick |
|
|
|
|
| $ | 2,044,535 |
|
| $ | 7,831,243 |
| |||||||
| Increase/deduction for fair value as of the end | • John Abularrage | $ | 1,444,499 |
|
|
|
|
|
|
|
|
|
| ||||||
| of the fiscal year of all awards granted | • JP Aubin | $ | 687,304 |
|
|
|
|
|
|
|
|
|
| ||||||
| during the fiscal year and reported under the | • Sean Windeatt |
|
|
|
|
|
|
|
|
|
|
|
| ||||||
| “Equity Awards” column in the Summary | • Howard Lutnick |
|
|
|
|
|
|
|
|
|
|
|
| ||||||
| Compensation Table and outstanding and |
|
|
|
|
|
|
| ||||||||||||
| unvested as of year-end |
|
|
|
|
|
|
| ||||||||||||
| Adjustments to Determine Compensation | Name of PEO | 2025 | 2024 | 2023 | 2022 | 2021 | |||||||||||
| Increase/deduction for change in fair value | • John Abularrge | $ | 14,536 |
|
|
|
|
|
|
|
| ||||||
| as of vesting date (from prior year-end) | • JP Aubin | $ | 519,602 |
|
|
|
|
|
|
|
| ||||||
| of stock and option awards granted in any | • Sean Windeatt | $ | 42,336 |
|
|
|
|
|
|
|
| ||||||
| prior year for which all vesting conditions | • Howard Lutnick | $ | 3,167,731 |
|
|
|
|
|
|
|
| ||||||
| were satisfied during year or at year-end |
|
|
|
|
| ||||||||||||
| Deduction for fair value as of prior year-end | • John Abularrage |
|
|
|
|
|
|
|
|
|
| ||||||
| of stock and option awards granted in any | • JP Aubin |
|
|
|
|
|
|
|
|
|
| ||||||
| prior year that were forfeited during year | • Sean Windeatt |
|
|
|
|
|
|
|
|
|
| ||||||
| • Howard Lutnick |
|
|
|
|
|
|
|
|
|
| |||||||
| Increase for dollar value of any dividends | • John Abularrage |
|
|
|
|
|
|
|
|
|
| ||||||
| or other earnings paid on stock or option | • JP Aubin | $ | 38,593 |
|
|
|
|
|
|
|
| ||||||
| awards in the year prior to the vesting date | • Sean Windeatt | $ | 14,695 |
|
|
|
|
|
|
|
| ||||||
| that are not otherwise included in total | • Howard Lutnick |
|
|
|
| $ | 62,899 | $ | 87,397 | $ | 44,596 | ||||||
| compensation for the year |
|
|
|
|
| ||||||||||||
| Total Adjustments | • John Abularrage | $ | 18,668 |
|
|
|
|
|
|
|
| ||||||
| • JP Aubin | $ | 534,537 |
|
|
|
|
|
|
|
| |||||||
| • Sean Windeatt | $ | 27,287 |
|
|
|
|
|
|
|
| |||||||
| • Howard Lutnick | $ | 636,295 | $ | 1,895,142 | $ | 62,899 | $ | 87,397 | $ | 44,596 | |||||||
| Adjustments to Determine Compensation | 2025 | 2024 | 2023 | 2022 | 2021 | ||||||||||||
| Deduction for change in actuarial present value of accumulated benefit under all defined benefit and actuarial pension plans reported in the Summary Compensation Table |
|
|
|
|
|
|
|
|
|
|
|
| |||||
| Increase for aggregate of service cost and prior service cost for all defined benefit and actuarial pension plans reported in the Summary Compensation Table |
|
|
|
|
|
|
|
|
|
|
|
| |||||
| Deduction for amounts reported under the “Equity Awards” column in the Summary Compensation Table | $ | (43,629 | ) |
|
| $ | (406,908 | ) |
| $ | (111,565 | ) | |||||
| Deduction for amounts reported under the “Option Awards” column in the Summary Compensation Table |
|
|
|
|
|
|
|
|
|
|
|
| |||||
| Increase/deduction for change in fair value from grant date of stock and option awards granted during year that were not reported under the “Equity Awards” column in the Summary Compensation Table and are outstanding and unvested as of year-end | $ | (13,313 | ) | $ | 149,256 |
|
|
|
|
|
|
| |||||
| Increase/deduction for change in fair value as of year-end (from prior year-end) of stock and option awards granted in any prior year that were outstanding and unvested as of year-end | $ | (3,645 | ) | $ | 306,511 |
|
|
|
|
|
|
| |||||
| Increase for fair value as of vesting date of stock and option awards granted and vested in the same year |
|
|
|
|
| $ | 406,908 |
|
| $ | 111,565 |
| |||||
| Increase/deduction for fair value as of the end of the fiscal year of all awards granted during the fiscal year and reported under the “Equity Awards” column in the Summary Compensation Table and outstanding and unvested as of year-end |
|
|
|
|
|
|
|
|
|
|
|
| |||||
| Adjustments to Determine Compensation | 2025 | 2024 | 2023 | 2022 | 2021 | ||||||||||
| Increase/deduction for change in fair value as of vesting date (from prior year-end) of stock and option awards granted in any prior year for which all vesting conditions were satisfied during year or at year-end | $ | 59,708 | $ | 174,057 |
|
|
|
|
|
| |||||
| Deduction for fair value as of prior year-end of stock and option awards granted in any prior year that were forfeited during year |
|
|
|
|
|
|
|
|
|
| |||||
| Increase for dollar value of any dividends or other earnings paid on stock or option awards in the year prior to the vesting date that are not otherwise included in total compensation for the year | $ | 2,613 | $ | 52,829 | $ | 62,899 | $ | 87,397 | $ | 44,596 | |||||
| Total Adjustments | $ | 1,734 | $ | 682,653 | $ | 62,899 | $ | 87,397 | $ | 44,596 | |||||
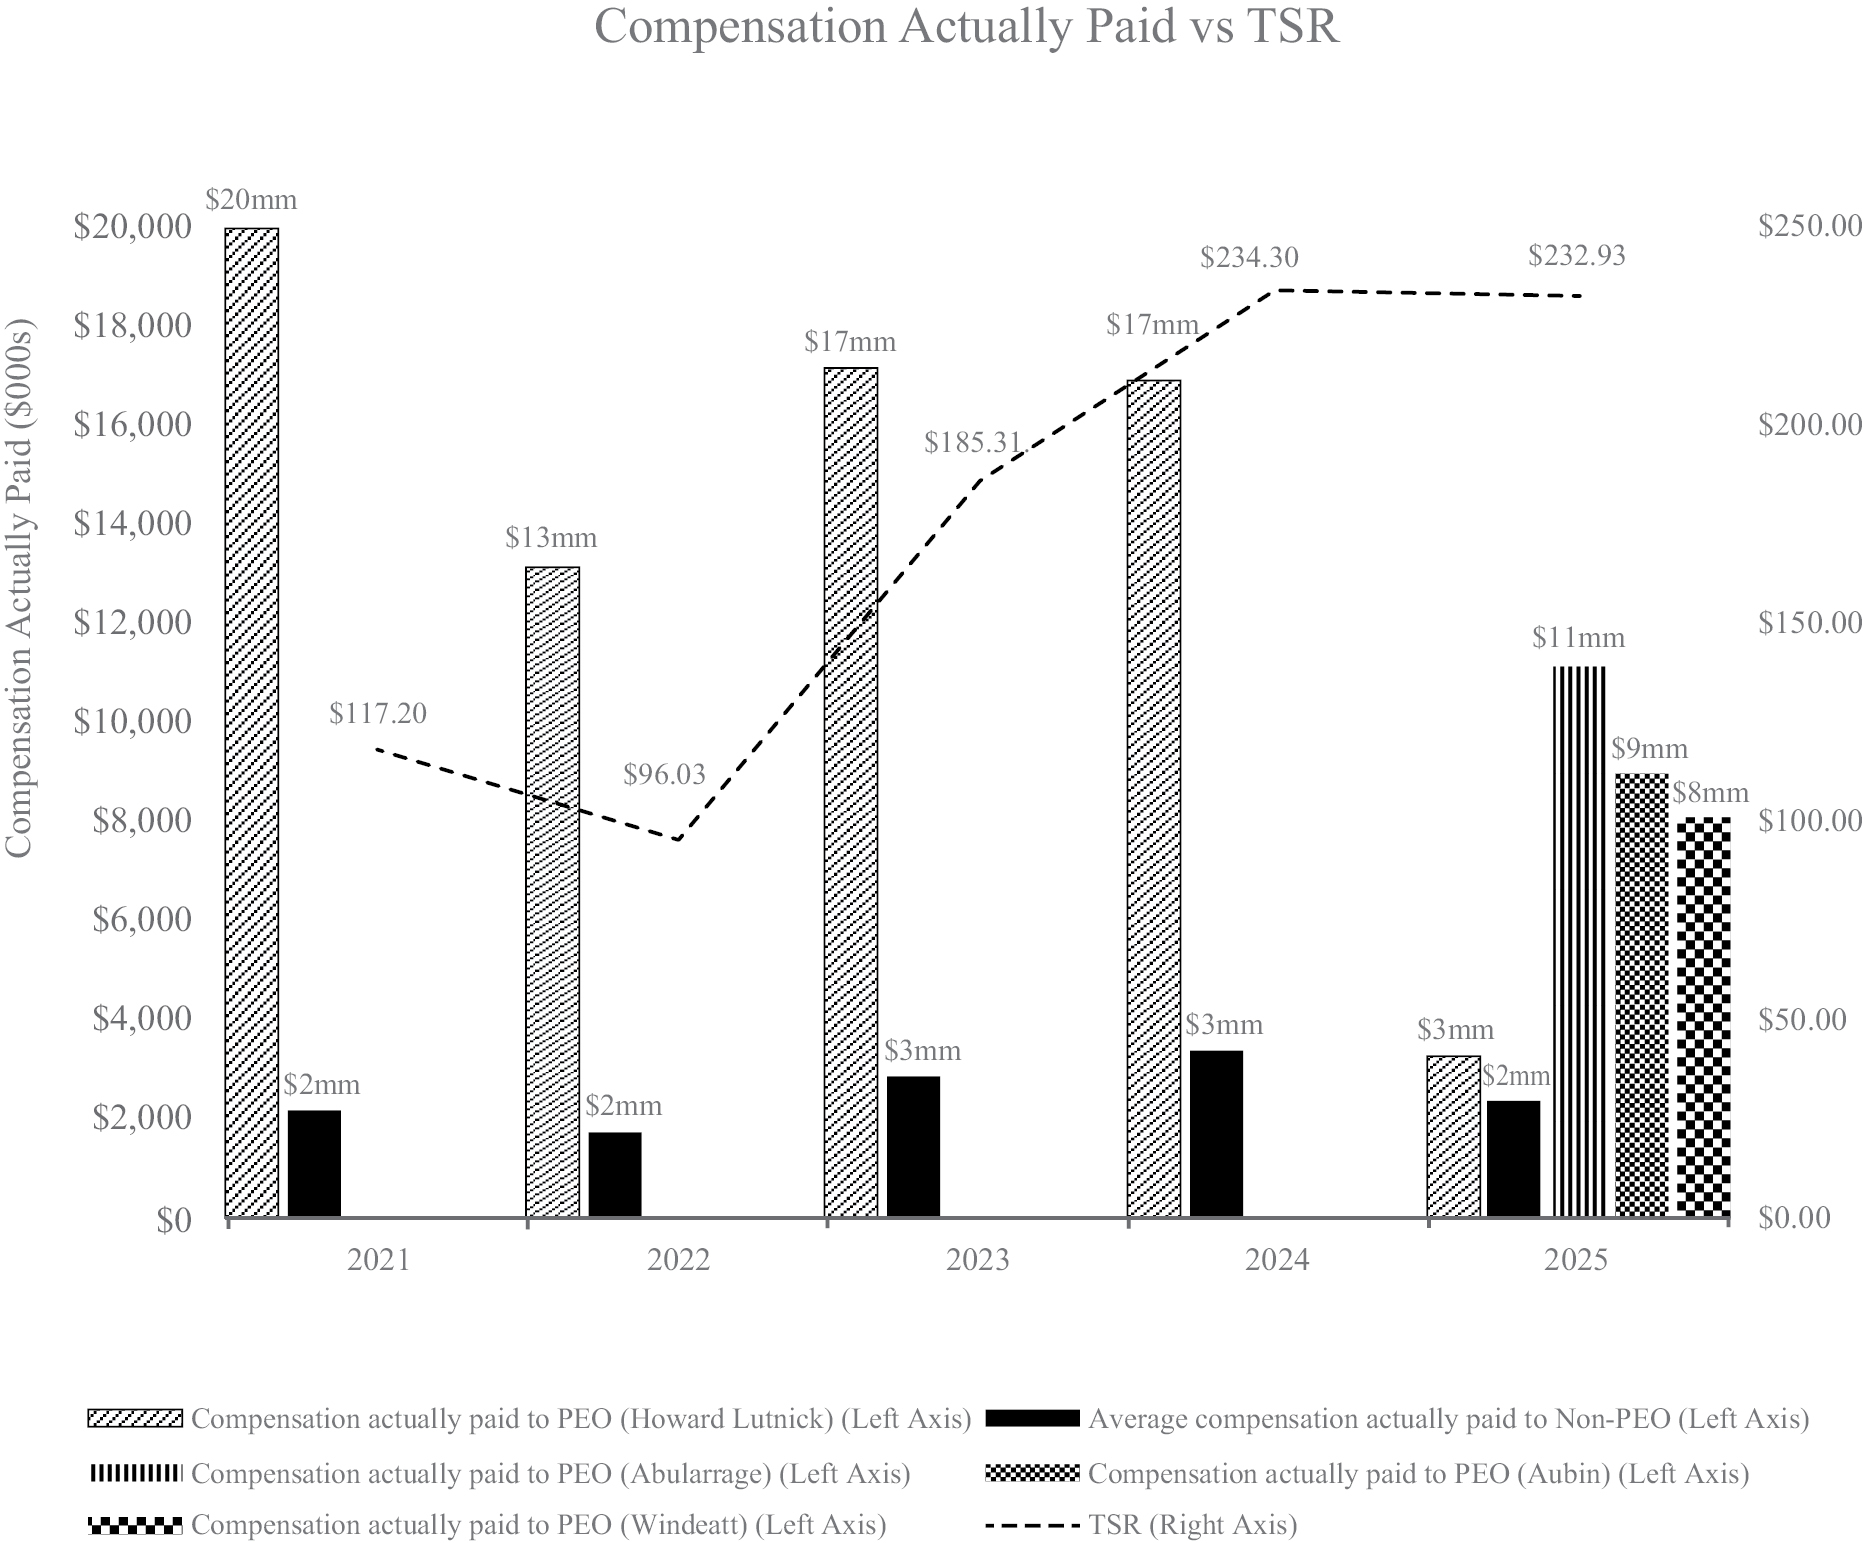
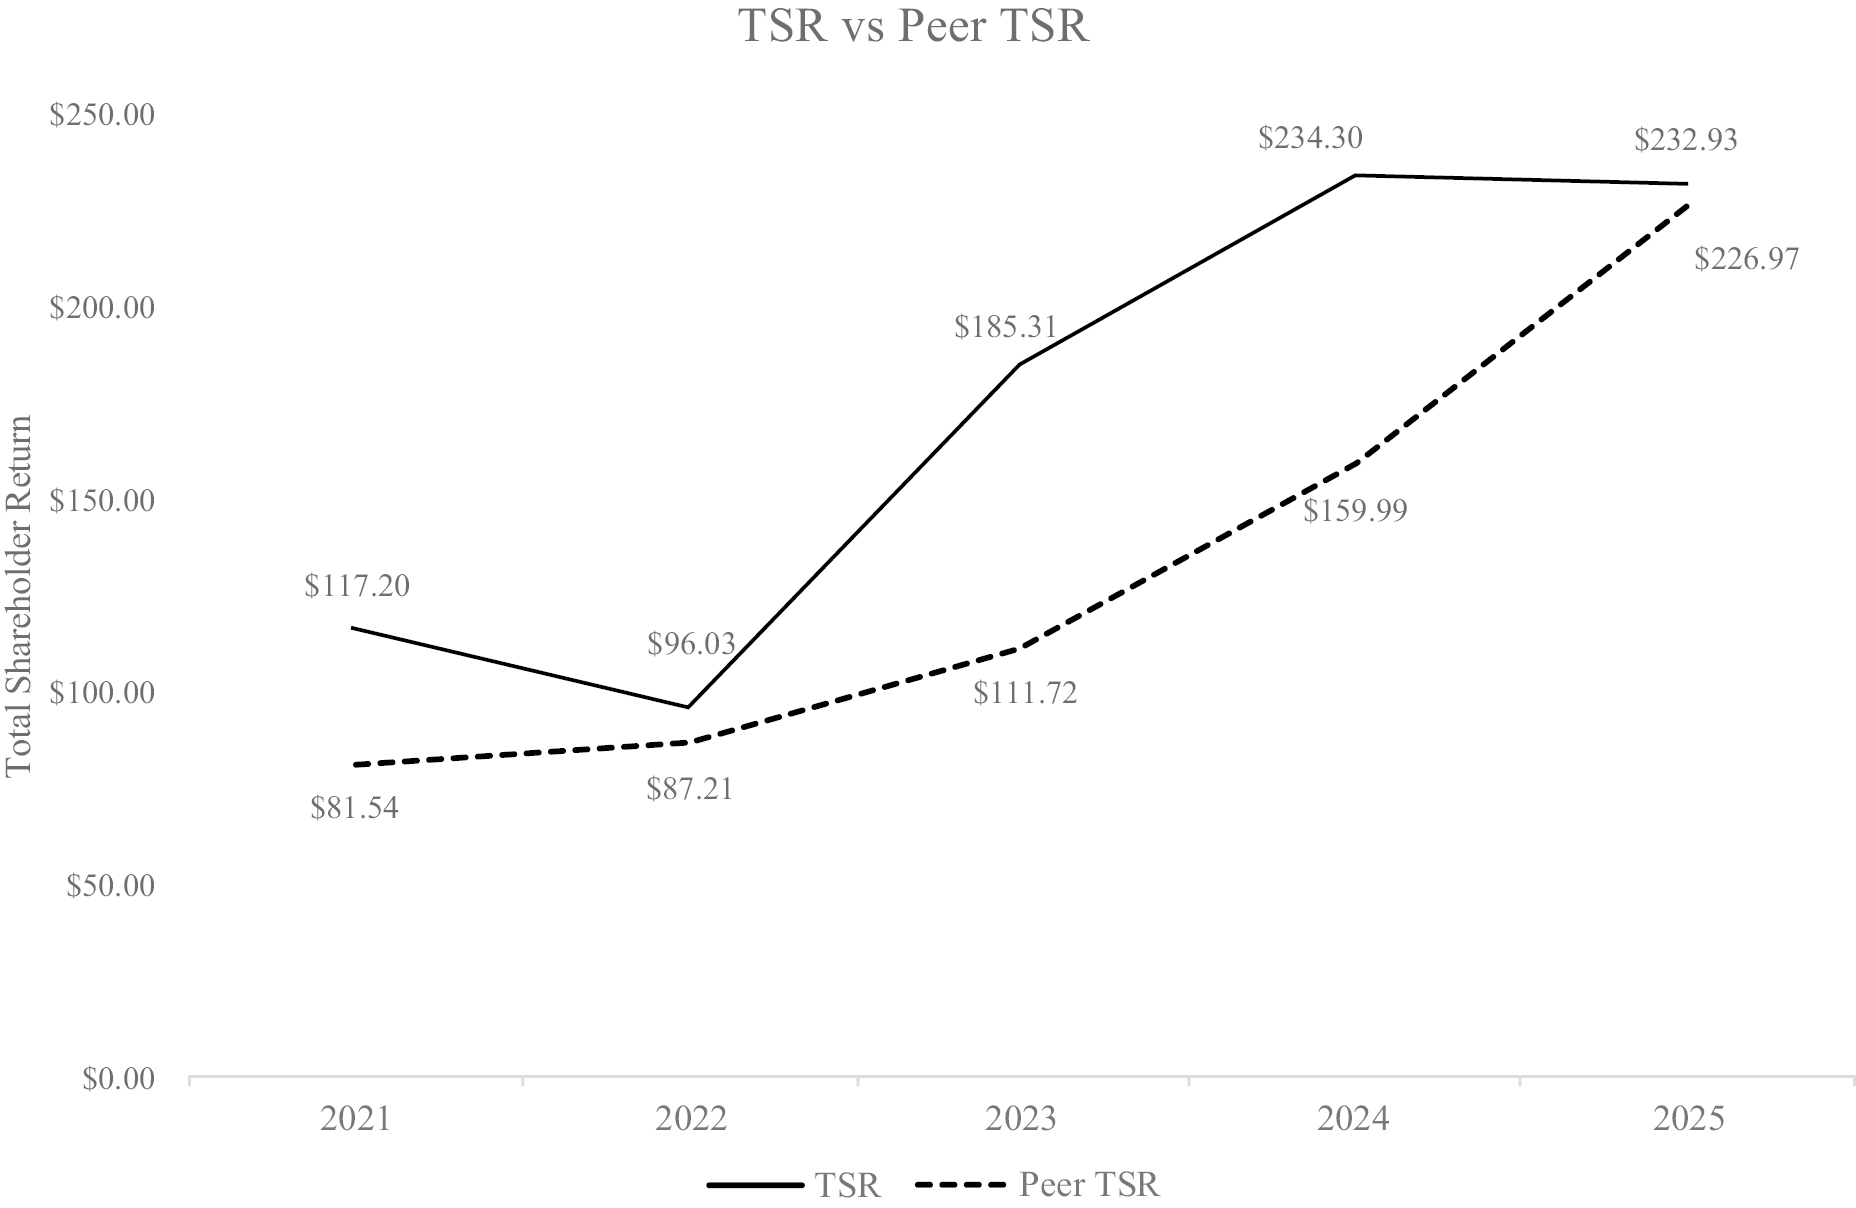
TSR. The graphs below show the relationship between (1) “compensation actually paid” to our PEO(s) and the average of “compensation actually paid” to our non-PEO NEOs and our cumulative TSR and (2) our cumulative TSR and peer group TSR, over the five fiscal years ended December 31, 2025. Values below are rounded to the nearest whole number. Messrs. Abularrage, Aubin, and Windeatt are not included in “Compensation Actually Paid to PEO” in periods prior to 2025 when they were appointed Co-PEOs. Including these amounts, the aggregate compensation attributed to 2024 for Messrs. Abularrage, Aubin, Windeatt, and Lutnick was higher than the aggregate compensation attributed to 2025 for Messrs. Abularrage, Aubin, Windeatt, and Lutnick.
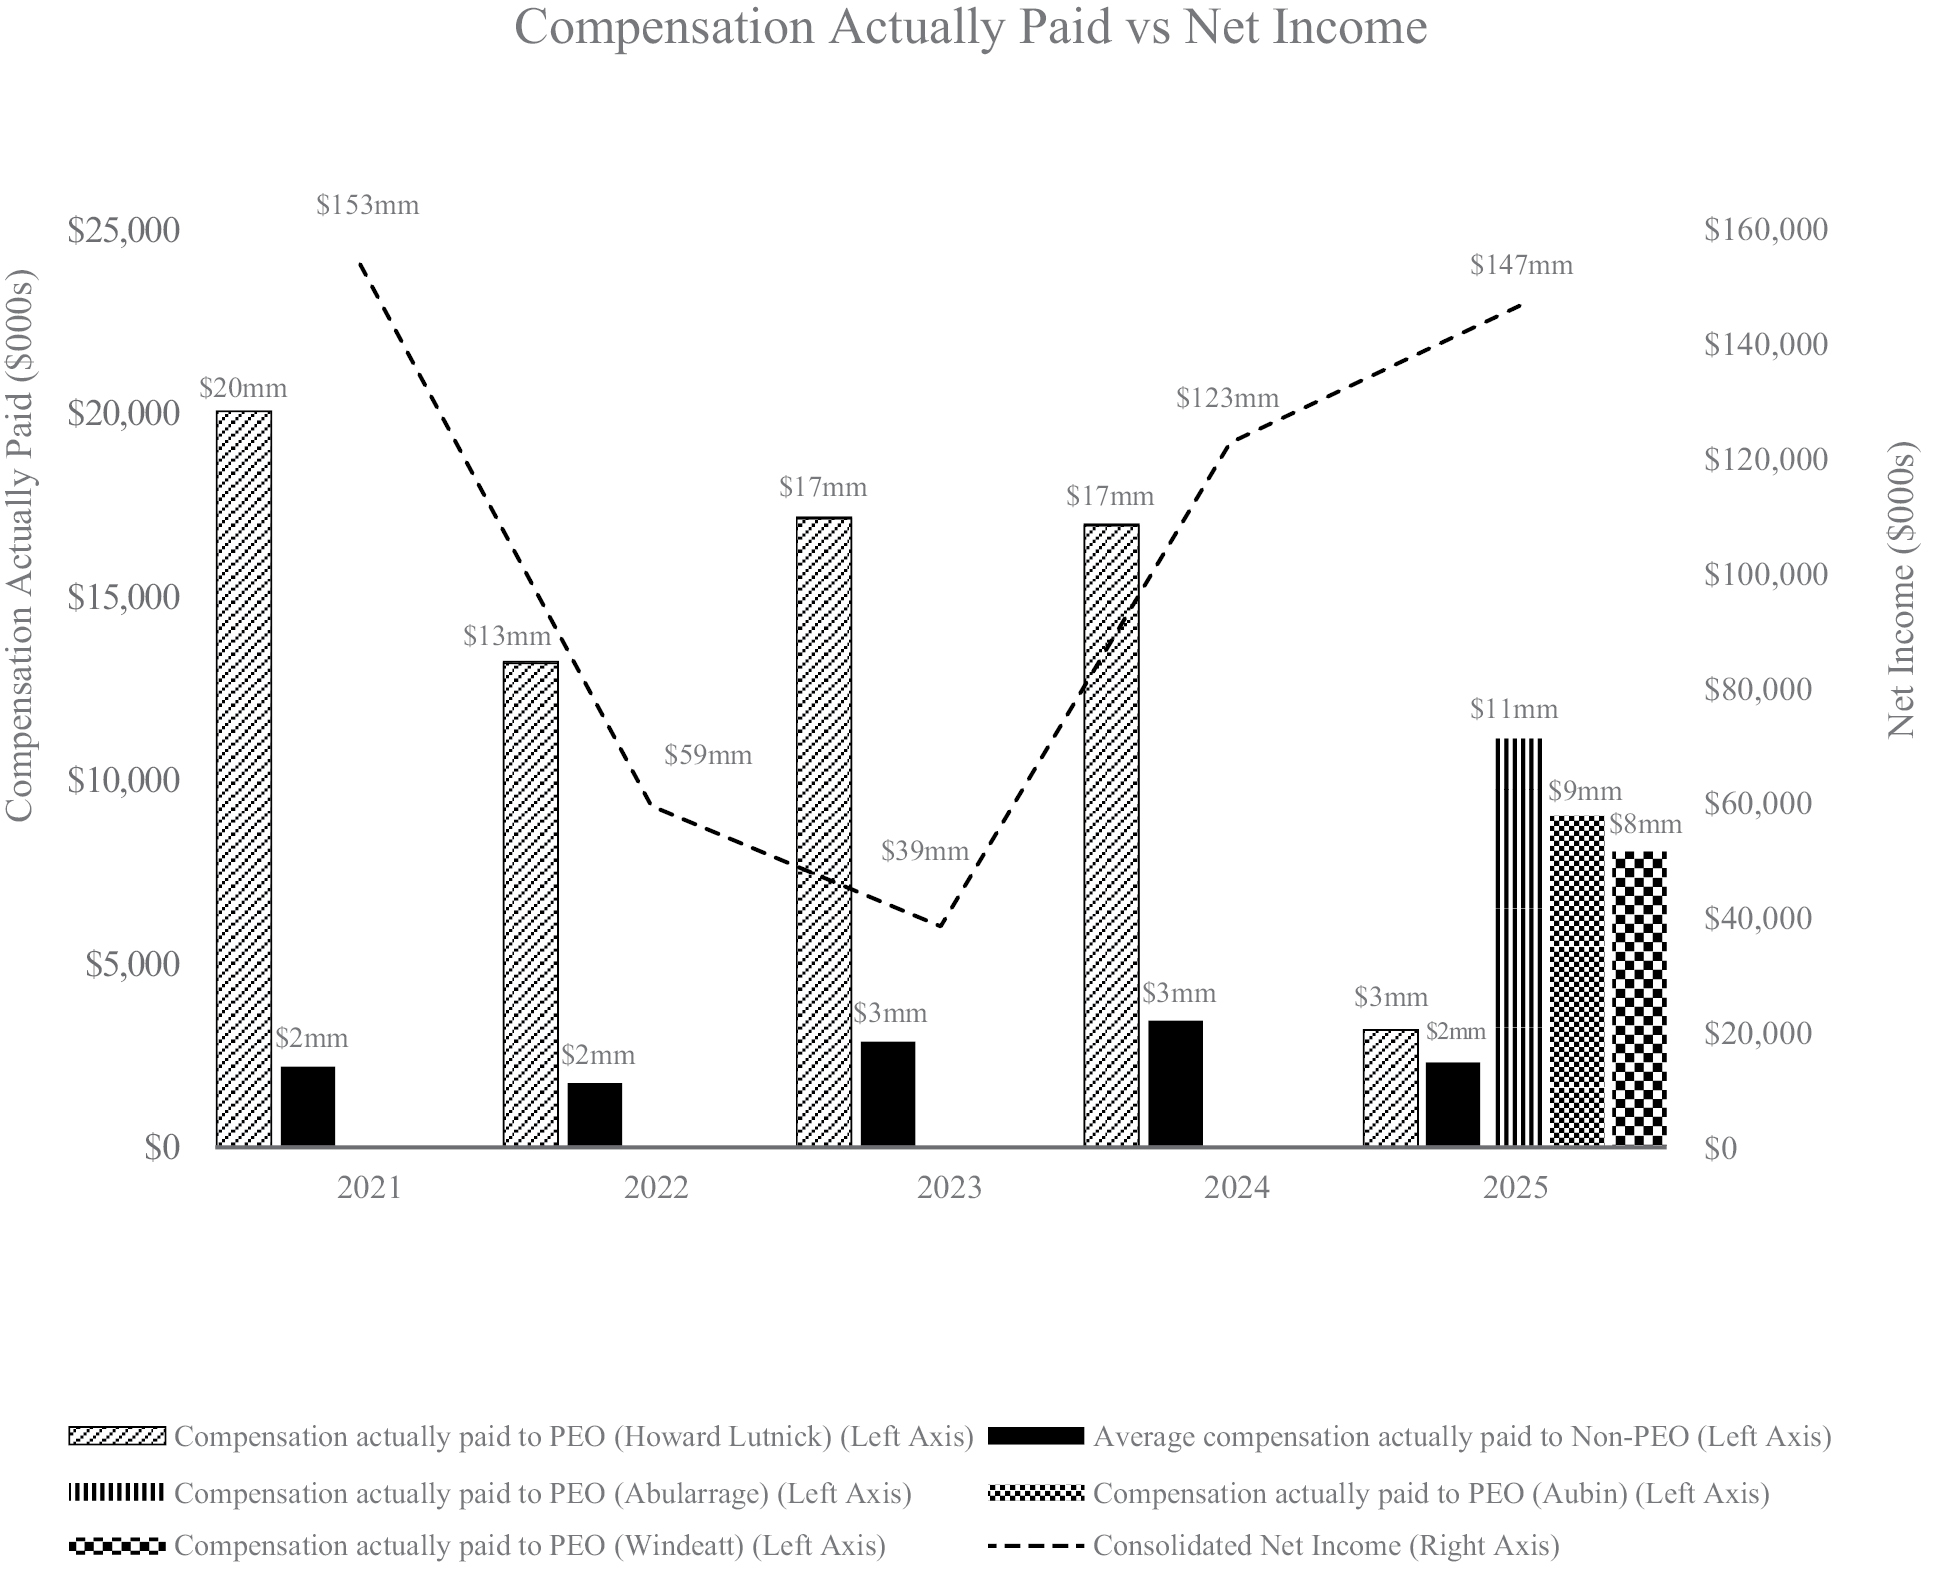
Net Income. The graph below shows the relationship between “compensation actually paid” to our PEO(s) and the average of the “compensation actually paid” to our non-PEO NEOs and net income, as reported in our consolidated financial statements, over the five fiscal years ended December 31, 2025. Values below are rounded to the nearest whole number. Messrs. Abularrage, Aubin, and Windeatt are not included in “Compensation Actually Paid to PEO” in periods prior to 2025 when they were appointed Co-PEOs. Including these amounts, the aggregate compensation attributed to 2024 for Messrs. Abularrage, Aubin, Windeatt, and Lutnick was higher than the aggregate compensation attributed to 2025 for Messrs. Abularrage, Aubin, Windeatt, and Lutnick.
Company Selected Measure (CSM). The graph below shows the relationship between “compensation actually paid” to our PEO(s) and the average of the “compensation actually paid” to our non-PEO NEOs and our Total Revenues over the five fiscal years ended December 31, 2025. Values below are rounded to the nearest whole number. Messrs. Abularrage, Aubin, and Windeatt are not included in “Compensation Actually Paid to PEO” in periods prior to 2025 when they were appointed Co-PEOs. Including these amounts, the aggregate compensation attributed to 2024 for Messrs. Abularrage, Aubin, Windeatt, and Lutnick was higher than the aggregate compensation attributed to 2025 for Messrs. Abularrage, Aubin, Windeatt, and Lutnick.
Performance Measures Tabular List
The table below lists our most important performance measures, including the Company Selected Measure, used to link “compensation actually paid” for our NEOs to Company performance for the fiscal year ended December 31, 2025. The performance measures included in this table are not ranked by relative importance.
Performance Measures
| Total Revenues | ||
| Total Fenics Revenues | ||
| Pre-tax Adjusted Earnings | ||
| Profit Before Tax | ||
| Data, Software & Post-Trade Growth | ||
| Catalyst Transactions and Hires, Acquisitions, and Strategy Development | ||
| Retentive Compensation Considerations |
| [1] | The PEO was Mr. Howard Lutnick until February 18, 2025, when he stepped down following his confirmation by the United States Senate as the 41st Secretary of Commerce. Following Mr. Howard Lutnick’s departure, Messrs. Abularrage, Aubin, and Windeatt were appointed Co-PEOs. |
| [2] | “Compensation Actually Paid to PEO(s)” in column (c) and “Average Compensation Actually Paid to Non-PEO NEOs” in column (e) reflect the following adjustments from Total Compensation amounts reported in the Summary Compensation Table (all amounts are averages for the non-PEO NEOs). Additionally, in the “Adjustments to Determine Compensation Actually Paid to PEO(s)” table below, for 2025, adjustments for both Mr. Howard Lutnick and Messrs. Abularrage, Aubin, and Windeatt are shown. For prior years in which Messrs. Abularrage, Aubin, and Windeatt did not serve as PEOs, these rows are designated with an asterisk. |
| [3] | The non-PEO NEOs in fiscal year 2025 consisted of Messrs. Merkel and Hauf. The non-PEO NEOs in fiscal years 2023 and 2024 consisted of Messrs. Merkel, Windeatt, and Hauf. The non-PEO NEOs in fiscal year 2022 consisted of Messrs. Merkel, Windeatt, Hauf and Mr. Steven Bisgay. Mr. Bisgay served as Chief Financial Officer of the Company until June 6, 2022, and Mr. Hauf began serving as Chief Financial Officer on that date. When calculating the average compensation for the non-PEO NEOs in fiscal year 2022, each of Messrs. Bisgay and Hauf are included in the denominator of such calculation. The non-PEO NEOs in fiscal year 2021 consisted of Messrs. Merkel, Windeatt, and Bisgay, who each served for the entirety of the year. When calculating Mr. Windeatt’s portion of the average compensation for the non-PEO NEOs for each fiscal year, his portion was calculated using the applicable exchange rate as set forth in the notes to the Summary Compensation Table. |
| [4] | The peer group consists of Compagnie Financière Tradition SA and TP ICAP Group plc. The returns of the peer group companies have been weighted according to their U.S. dollar stock market capitalization for purposes of arriving at a peer group average. TSR is calculated as the cumulative total stockholder return, on a gross dividend reinvestment basis, of $100 invested in shares of each of the Company and the peer group on December 31, 2020. |