v3.26.3
Shareholder Report
12 Months Ended
Jul. 31, 2026
USD ($)
Holdings
Shareholder Report [Line Items]  
Document Type N-CSR
Amendment Flag false
Registrant Name Tidal Trust I
Entity Central Index Key 0001742912
Entity Investment Company Type N-1A
Document Period End Date Jul. 31, 2026
Shareholder Report Annual or Semi-Annual annual shareholder report
Academy Veteran Bond ETF  
Shareholder Report [Line Items]  
Fund Name Academy Veteran Bond ETF
Class Name Academy Veteran Bond ETF
Trading Symbol VETZ
Security Exchange Name NYSEArca
Annual or Semi-Annual Statement [Text Block] This annual shareholder report contains important information about the Academy Veteran Bond ETF (the "Fund") for the period August 1, 2025 to July 31, 2026.
Shareholder Report Annual or Semi-Annual annual shareholder report
Additional Information [Text Block] You can find additional information about the Fund at www.academyetfs.com. You can also request this information by contacting us at (866) 631-0504 or by writing the Fund at Academy Veteran Bond ETF, c/o U.S. Bank Global Fund Services, P.O. Box 701, Milwaukee, Wisconsin 53201‑0701.
Material Fund Change Notice [Text Block] This report describes changes to the Fund that occurred during the reporting period.
Additional Information Phone Number (866) 631-0504
Additional Information Website www.academyetfs.com
Expenses [Text Block]

What were the Fund costs for the past year?

(based on a hypothetical $10,000 investment)

Fund Name
Costs of a $10,000 investment
Costs paid as a percentage of a $10,000 investment
Academy Veteran Bond ETF
$36
0.35%
Expenses Paid, Amount $ 36
Expense Ratio, Percent 0.35%
Factors Affecting Performance [Text Block]

How did the Fund perform in the past year?

The Fund is an actively managed exchange-traded fund that invests primarily in high-quality mortgage-backed securities ("MBS") and asset-backed securities ("ABS"). The Adviser uses loan-level analysis and quantitative modeling to identify undervalued securities with favorable borrower characteristics. Through this approach, the Fund seeks to provide broad portfolio diversification, limit exposure to corporate credit risk, and outperform the Bloomberg U.S. Mortgage-Backed Securities Index. For the fiscal year ended July 31, 2026, the Fund returned 4.21% at NAV, compared with returns of 4.13% for the Bloomberg U.S. Mortgage-Backed Securities Index and 2.71% for the Bloomberg U.S. Aggregate Bond Index.

What factors influenced performance?

Active security selection within the agency MBS and ABS markets contributed positively to the Fund's performance during the fiscal year. Higher-coupon securities generally performed better than lower-coupon securities during the period, consistent with their generally lower sensitivity to changes in interest rates.

Agency MBS performance was affected by interest-rate volatility and rising longer-term interest rates. Although the Federal Reserve lowered the target range for the federal funds rate by a total of 75 basis points ("bps"), the yield on the 10-year U.S. Treasury increased from 4.38% to 4.74%, weighing on MBS price returns. By contrast, the option-adjusted spread of the Bloomberg U.S. Mortgage-Backed Securities Index narrowed by 9 bps to 31 bps amid increased investor demand, supporting MBS prices. Spreads on small-business loan ABS also narrowed by 5 bps amid increased demand, supporting ABS prices. Mortgage rates remained elevated by historical standards. The national average rate for a 30-year fixed-rate mortgage ended the period at 6.73%, broadly unchanged from the end of the prior fiscal year despite fluctuations during the period. Elevated mortgage rates and affordability challenges kept refinancing and housing activity subdued, while limited housing supply continued to support home prices. The S&P Cotality Case-Shiller U.S. National Home Price NSA Index increased 1.1% year over year as of May 21, 2026, the last adjustment period.

Performance Past Does Not Indicate Future [Text] The Fund's past performance is not a good indicator of how the Fund will perform in the future.
Line Graph [Table Text Block]

Cumulative Performance

(Initial Investment of $10,000)
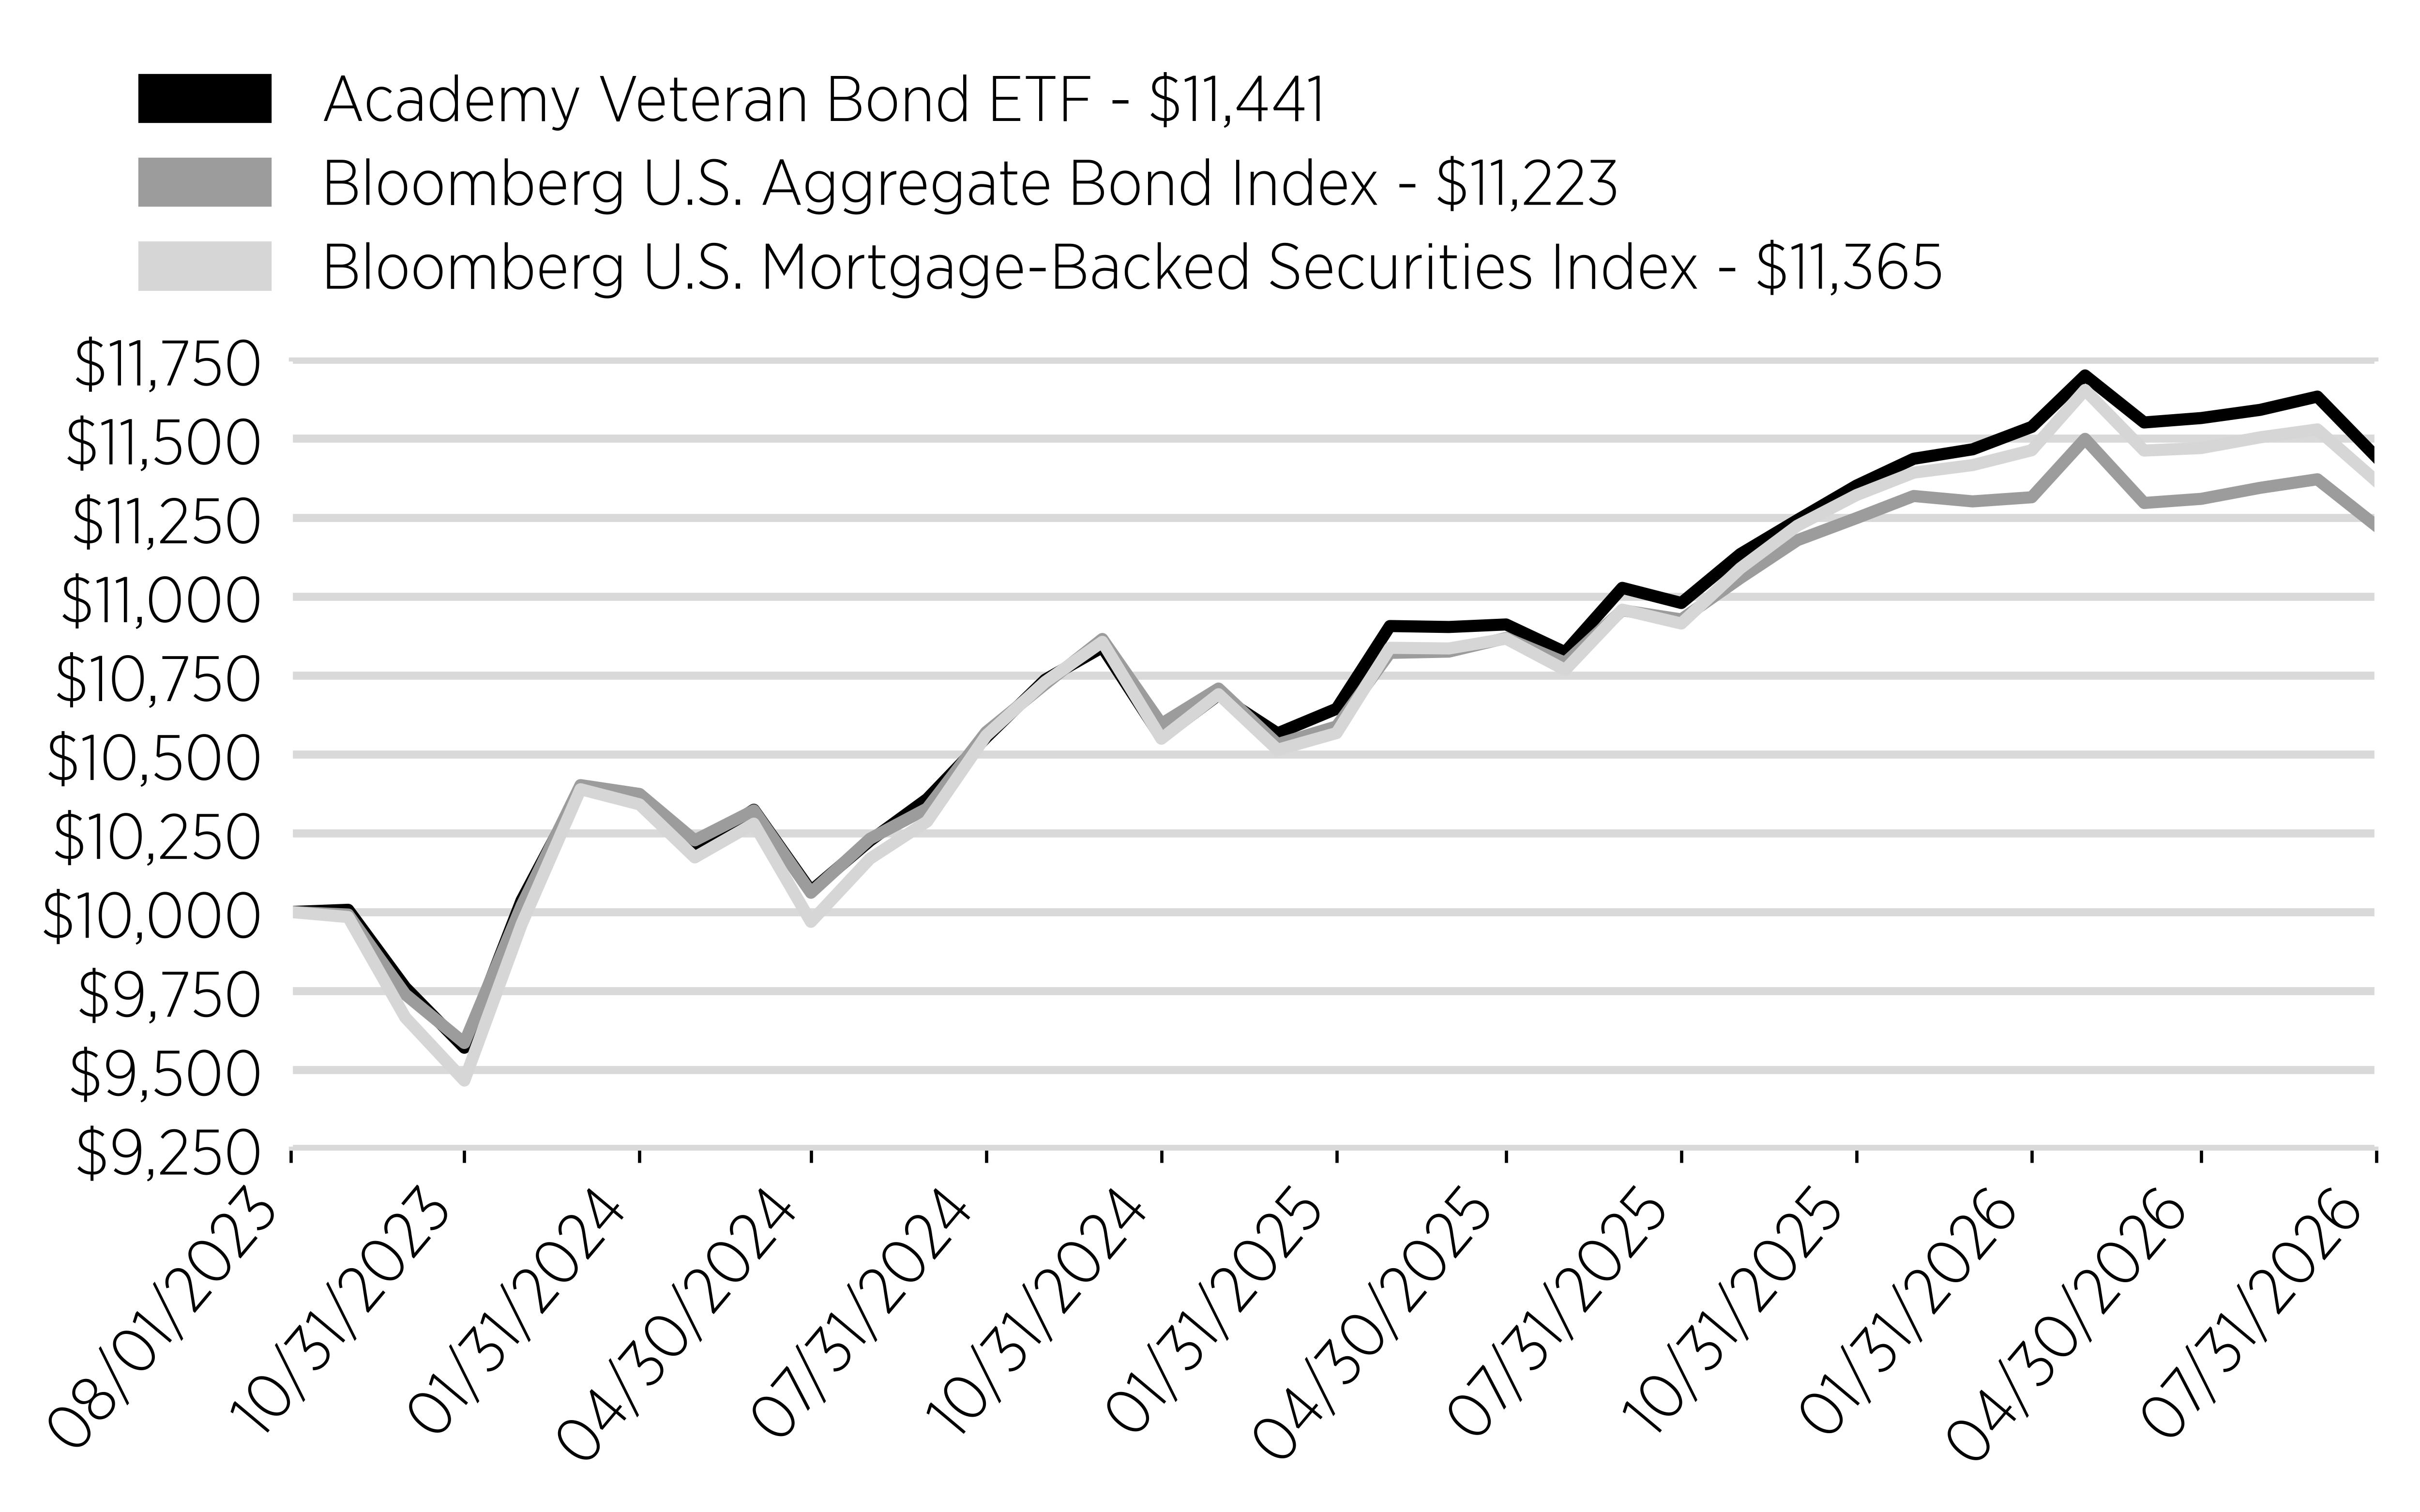
Date
Academy Veteran Bond ETF - $11,441
Bloomberg U.S. Aggregate Bond Index - $11,223
Bloomberg U.S. Mortgage-Backed Securities Index - $11,365
8/1/2023
10000
10000
10000
8/31/2023
10007
9992
9984
9/30/2023
9761
9739
9666
10/31/2023
9570
9585
9466
11/30/2023
10036
10019
9960
12/31/2023
10389
10402
10389
1/31/2024
10372
10374
10341
2/29/2024
10205
10227
10173
3/31/2024
10324
10322
10280
4/30/2024
10067
10061
9969
5/31/2024
10226
10232
10169
6/30/2024
10358
10328
10287
7/31/2024
10553
10570
10559
8/31/2024
10736
10722
10729
9/30/2024
10839
10865
10856
10/31/2024
10552
10596
10549
11/30/2024
10688
10708
10690
12/31/2024
10566
10532
10514
1/31/2025
10644
10588
10567
2/28/2025
10906
10821
10837
3/31/2025
10903
10825
10835
4/30/2025
10911
10868
10866
5/31/2025
10823
10790
10767
6/30/2025
11027
10956
10958
7/31/2025
10979
10927
10914
8/31/2025
11134
11058
11089
9/30/2025
11242
11178
11224
10/31/2025
11351
11248
11321
11/30/2025
11436
11318
11392
12/31/2025
11466
11301
11416
1/31/2026
11537
11314
11463
2/28/2026
11700
11499
11654
3/31/2026
11551
11296
11462
4/30/2026
11565
11309
11470
5/31/2026
11591
11344
11504
6/30/2026
11633
11371
11529
7/31/2026
11441
11223
11365
line
Average Annual Return [Table Text Block]

Annual Performance

Average Annual Returns for the
Periods Ended July 31, 2026
One Year
Since Inception (8/1/2023)
Academy Veteran Bond ETF
4.21%
4.59%
Bloomberg U.S. Aggregate
Bond Index
2.71%
3.92%
Bloomberg U.S. Mortgage-Backed Securities Index
4.13%
4.36%
Performance Inception Date Aug. 01, 2023
No Deduction of Taxes [Text Block] The graph and table do not reflect the deduction of taxes that a shareholder would pay on fund distributions or redemption of fund shares.
Material Change Description [Text Block] This is a summary of certain changes to the Fund. For more complete information, you may review the Fund's prospectus.
Material Change Date Aug. 01, 2025
Updated Performance Information Location [Text Block] Visit www.academyetfs.com for more recent performance information.
Net Assets $ 124,485,000
Holdings Count | Holdings 153
Advisory Fees Paid, Amount $ 325,233
Investment Company, Portfolio Turnover 23.00%
Additional Fund Statistics [Text Block]

Key Fund Statistics

(as of July 31, 2026)

Fund Size (Thousands)
$124,485
Number of Holdings
153
Total Advisory Fee Paid
$325,233
Portfolio Turnover Rate
23%
Holdings [Text Block]

What did the Fund invest in?

(as of July 31, 2026)

Sector Breakdown

(% of Total Net Assets)
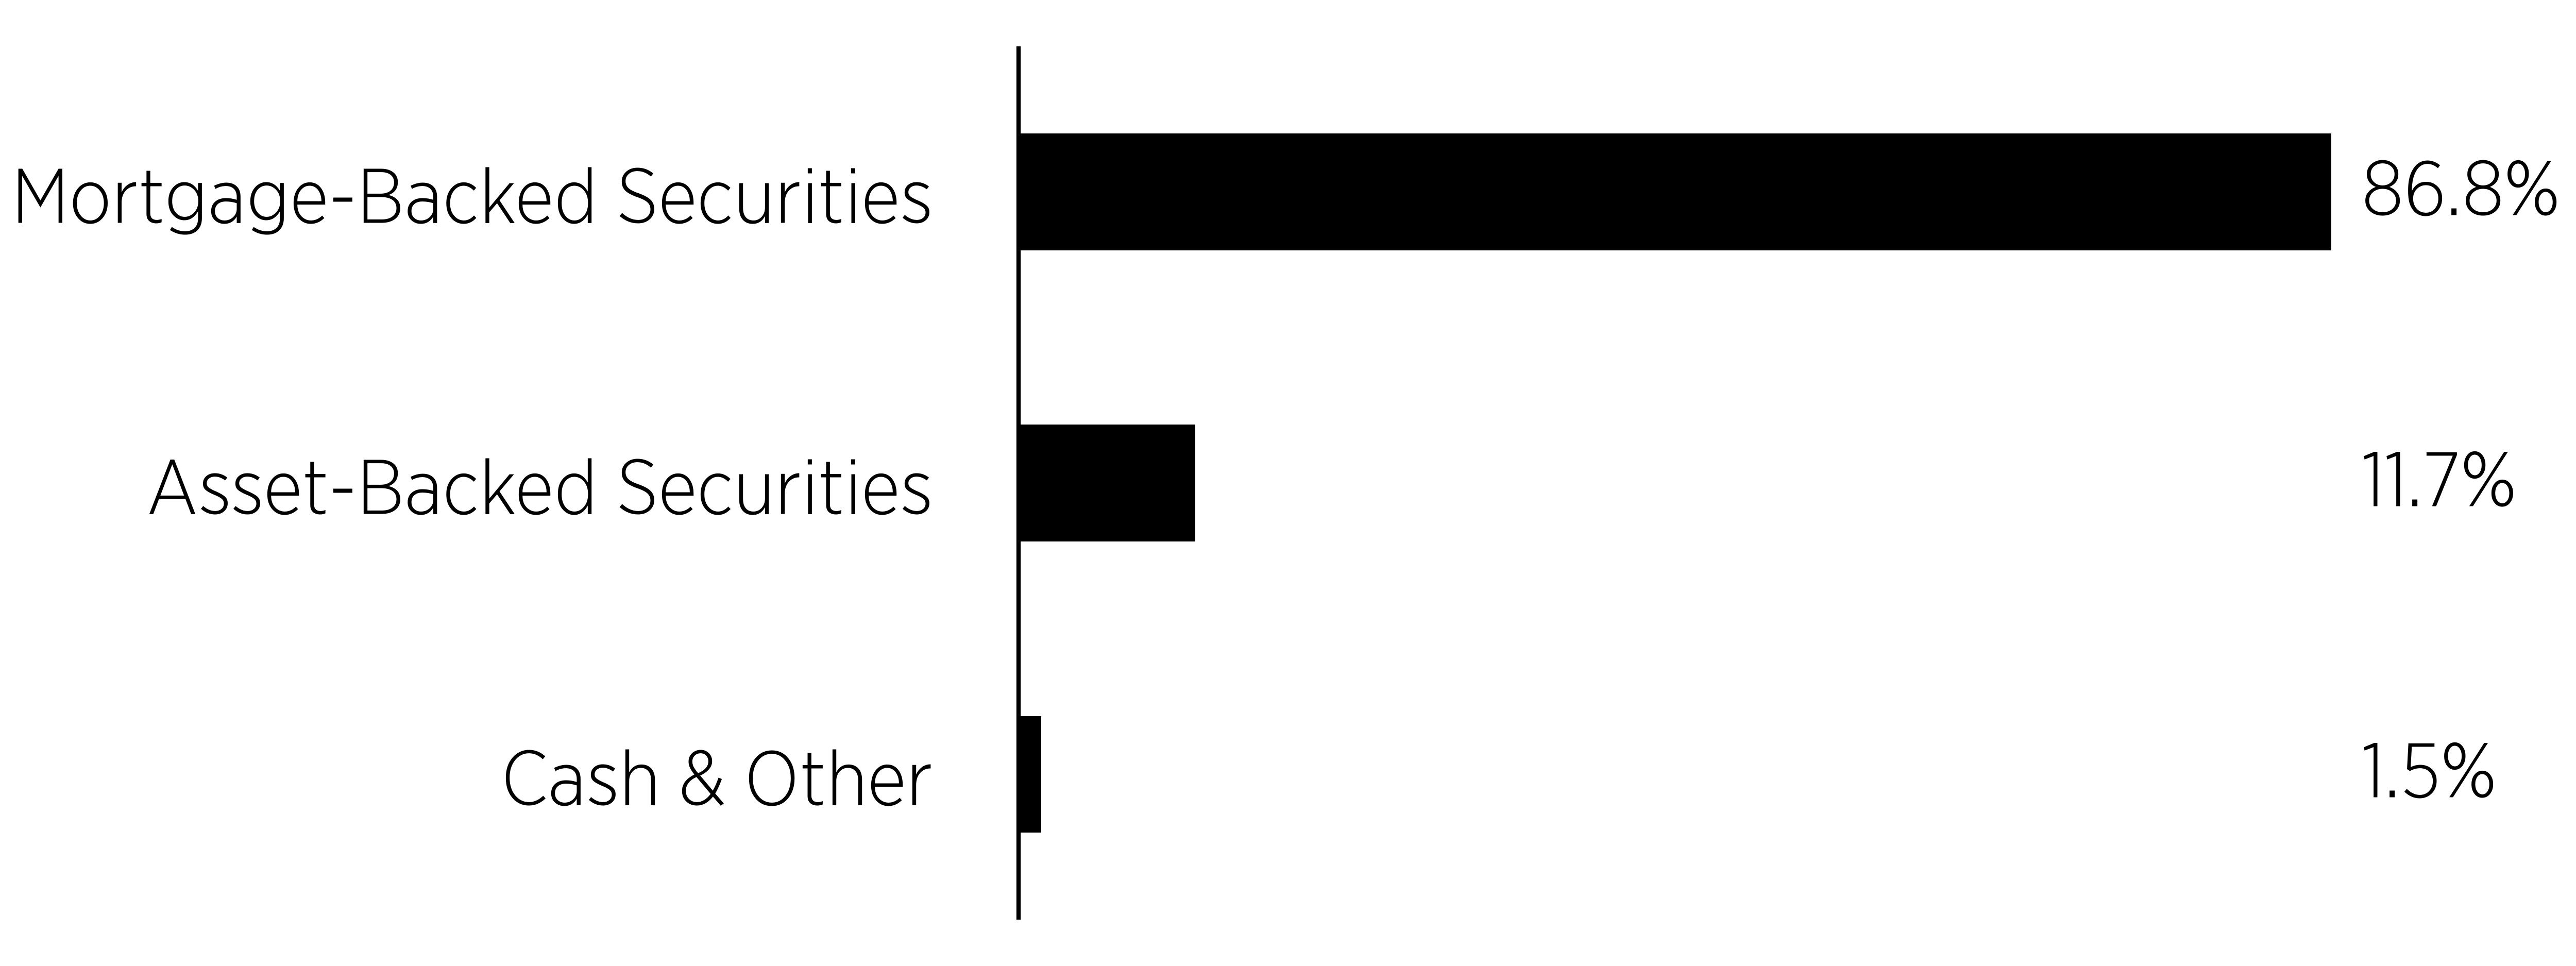
Sector
%
Mortgage-Backed Securities
0.868
Asset-Backed Securities
0.117
Cash & Other
0.015
bar


Largest Holdings [Text Block]
Top Issuers
(% of Total Net Assets)
Ginnie Mae II Pool
78.7%
Small Business Administration Pools
11.7%
Ginnie Mae I Pool
8.2%
Material Fund Change [Text Block]

Fund Changes

Effective August 1, 2025, U.S. Bancorp Fund Services, LLC, doing business as Global Fund Services, no longer serves as the Sub‐Administrator for each series of Tidal Trust I, including the Fund.