Shareholder Report
|
12 Months Ended |
|
Jul. 31, 2026
USD ($)
Holdings
|
|---|
| Shareholder Report [Line Items] |
|
| Document Type |
N-CSR
|
| Amendment Flag |
false
|
| Registrant Name |
Tidal Trust I
|
| Entity Central Index Key |
0001742912
|
| Entity Investment Company Type |
N-1A
|
| Document Period End Date |
Jul. 31, 2026
|
| Shareholder Report Annual or Semi-Annual |
annual shareholder report
|
| Aztlan Global Stock Selection DM SMID ETF |
|
| Shareholder Report [Line Items] |
|
| Fund Name |
Aztlan Global Stock Selection DM SMID ETF
|
| Class Name |
Aztlan Global Stock Selection DM SMID ETF
|
| Trading Symbol |
AZTD
|
| Security Exchange Name |
NYSEArca
|
| Annual or Semi-Annual Statement [Text Block] |
This annual shareholder report contains important information about the Aztlan Global Stock Selection DM SMID ETF (the "Fund") for the period August 1, 2025 to July 31, 2026.
|
| Shareholder Report Annual or Semi-Annual |
annual shareholder report
|
| Additional Information [Text Block] |
You can find additional information about the Fund at https://aztlanetfs.com/aztd. You can also request this information by contacting us at (800) 886-4107 or by writing the Fund at Aztlan Global Stock Selection DM SMID ETF, c/o U.S. Bank Global Fund Services, P.O. Box 701, Milwaukee, Wisconsin 53201‑0701.
|
| Material Fund Change Notice [Text Block] |
This report describes changes to the Fund that occurred during the reporting period.
|
| Additional Information Phone Number |
(800) 886-4107
|
| Additional Information Website |
https://aztlanetfs.com/aztd
|
| Expenses [Text Block] |
What were the Fund costs for the past year?
(based on a hypothetical $10,000 investment)
|
Fund Name |
Costs of a $10,000 investment |
Costs paid as a percentage of a $10,000 investment |
|
Aztlan Global Stock Selection DM SMID ETF |
$82 |
0.75% |
|
| Expenses Paid, Amount |
$ 82
|
| Expense Ratio, Percent |
0.75%
|
| Factors Affecting Performance [Text Block] |
How did the Fund perform in the past year?
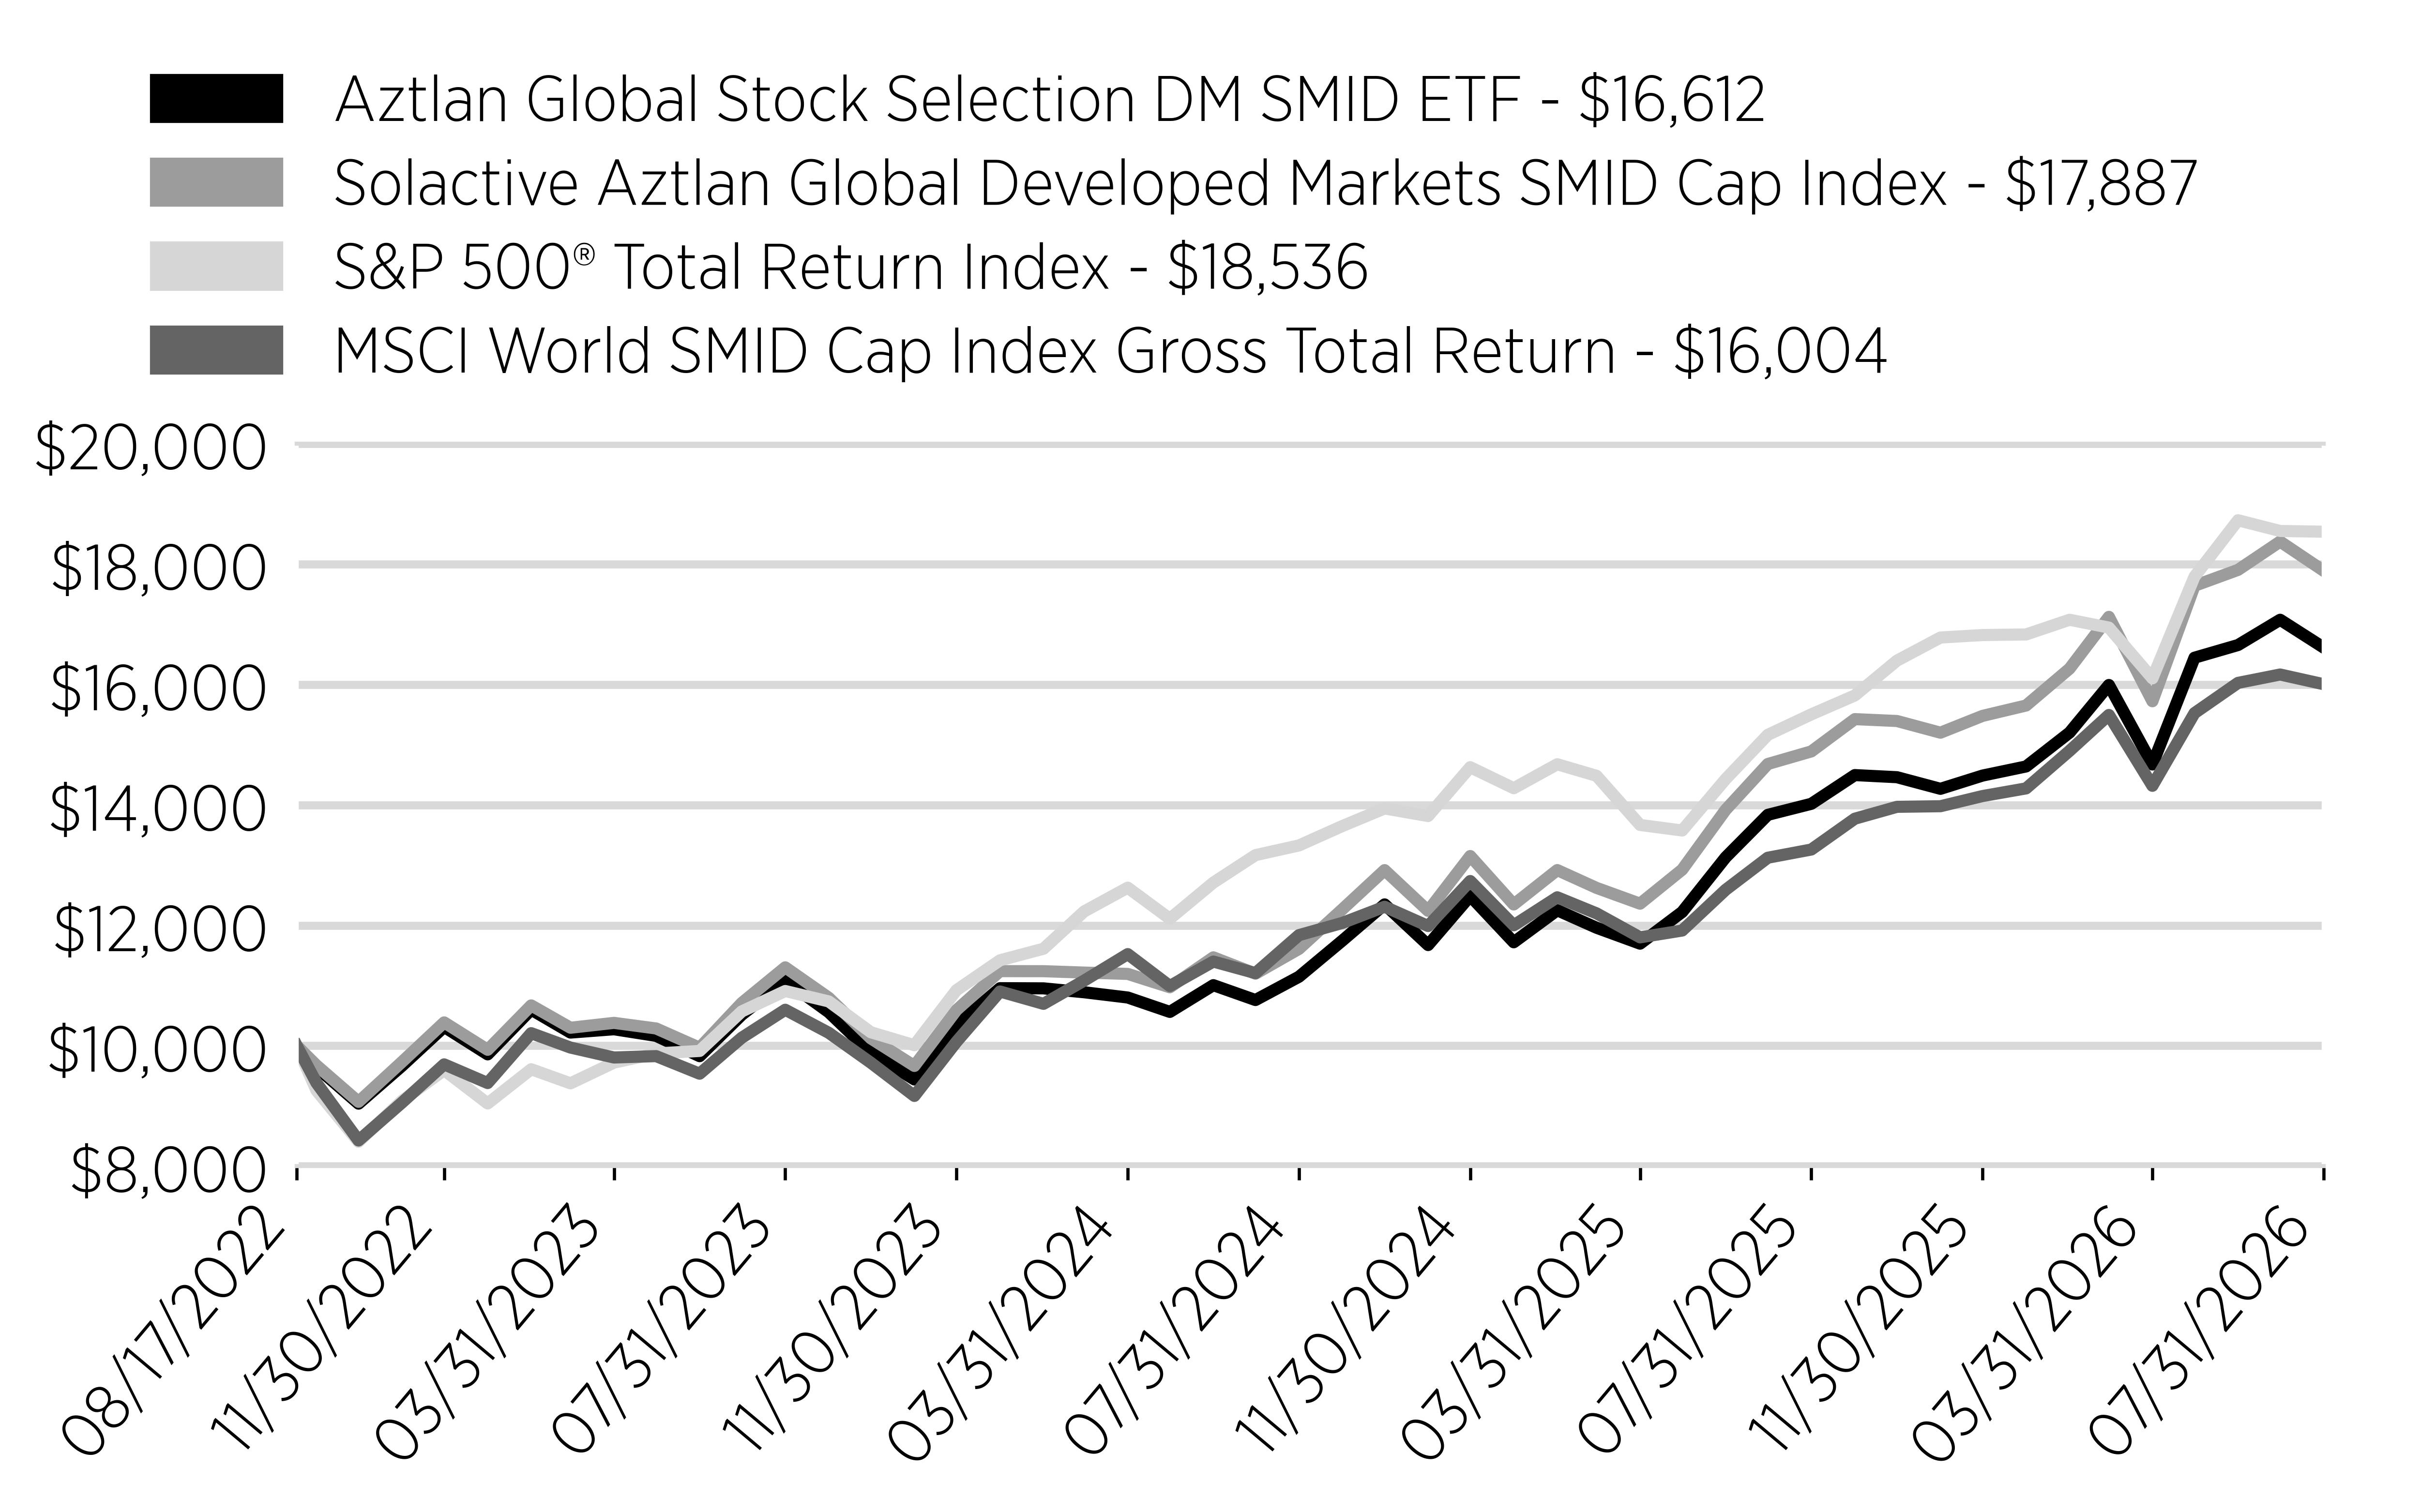
During the reporting period, the Fund generated a total return of 18.45%. This compares to the 20.15% total return of the Solactive Aztlan Global Developed Markets SMID Cap Index, the 19.56% total return of the benchmark, the S&P 500® Total Return Index, and 20.71% for the MSCI World SMID Cap Index Gross Total Return for the same period.
From a sector perspective, based on performance attribution to the overall portfolio, Industrials and Information Technology were the leading contributors, while Consumer Discretionary and Utilities were the leading detractors.
Reviewing individual stocks based on performance attribution to the overall portfolio, leading contributors included Lumentum Holdings Inc., Enova International Inc., and Sterling Infrastructure Inc. Conversely, the leading detractors included HelloFresh SE, VusionGroup S.A., and Catapult Sports Ltd.
|
| Performance Past Does Not Indicate Future [Text] |
The Fund's past performance is not a good indicator of how the Fund will perform in the future.
|
| Line Graph [Table Text Block] |
Cumulative Performance
(Initial Investment of $10,000)
|
Date |
Aztlan Global Stock Selection DM SMID ETF - $16,612 |
Solactive Aztlan Global Developed Markets SMID Cap Index - $17,887 |
S&P 500® Total Return Index - $18,536 |
MSCI World SMID Cap Index Gross Total Return - $16,004 |
|
8/17/2022 |
10000 |
10000 |
10000 |
10000 |
|
8/31/2022 |
9646 |
9677 |
9260 |
9386 |
|
9/30/2022 |
9040 |
9070 |
8407 |
8428 |
|
10/31/2022 |
9668 |
9734 |
9088 |
9058 |
|
11/30/2022 |
10315 |
10389 |
9596 |
9692 |
|
12/31/2022 |
9858 |
9934 |
9043 |
9382 |
|
1/31/2023 |
10601 |
10671 |
9611 |
10210 |
|
2/28/2023 |
10220 |
10300 |
9377 |
9971 |
|
3/31/2023 |
10275 |
10381 |
9721 |
9806 |
|
4/30/2023 |
10165 |
10288 |
9873 |
9829 |
|
5/31/2023 |
9828 |
9968 |
9915 |
9537 |
|
6/30/2023 |
10515 |
10711 |
10571 |
10134 |
|
7/31/2023 |
11080 |
11303 |
10910 |
10599 |
|
8/31/2023 |
10558 |
10798 |
10737 |
10216 |
|
9/30/2023 |
9888 |
10123 |
10225 |
9719 |
|
10/31/2023 |
9441 |
9666 |
10010 |
9168 |
|
11/30/2023 |
10341 |
10593 |
10924 |
10067 |
|
12/31/2023 |
10957 |
11240 |
11420 |
10902 |
|
1/31/2024 |
10954 |
11239 |
11612 |
10697 |
|
2/29/2024 |
10889 |
11216 |
12232 |
11083 |
|
3/31/2024 |
10802 |
11194 |
12626 |
11523 |
|
4/30/2024 |
10563 |
10972 |
12110 |
10993 |
|
5/31/2024 |
11007 |
11469 |
12710 |
11399 |
|
6/30/2024 |
10760 |
11198 |
13166 |
11207 |
|
7/31/2024 |
11147 |
11610 |
13327 |
11838 |
|
8/31/2024 |
11749 |
12269 |
13650 |
12041 |
|
9/30/2024 |
12348 |
12917 |
13941 |
12309 |
|
10/31/2024 |
11673 |
12241 |
13815 |
11989 |
|
11/30/2024 |
12488 |
13151 |
14626 |
12736 |
|
12/31/2024 |
11719 |
12347 |
14277 |
12001 |
|
1/31/2025 |
12251 |
12918 |
14675 |
12466 |
|
2/28/2025 |
11960 |
12622 |
14483 |
12199 |
|
3/31/2025 |
11696 |
12360 |
13667 |
11801 |
|
4/30/2025 |
12222 |
12925 |
13575 |
11914 |
|
5/31/2025 |
13130 |
13919 |
14429 |
12591 |
|
6/30/2025 |
13835 |
14679 |
15163 |
13123 |
|
7/31/2025 |
14018 |
14888 |
15503 |
13259 |
|
8/31/2025 |
14495 |
15424 |
15817 |
13771 |
|
9/30/2025 |
14460 |
15393 |
16395 |
13968 |
|
10/31/2025 |
14267 |
15199 |
16779 |
13978 |
|
11/30/2025 |
14487 |
15478 |
16820 |
14147 |
|
12/31/2025 |
14638 |
15650 |
16830 |
14274 |
|
1/31/2026 |
15201 |
16263 |
17074 |
14898 |
|
2/28/2026 |
15991 |
17122 |
16944 |
15493 |
|
3/31/2026 |
14671 |
15721 |
16101 |
14317 |
|
4/30/2026 |
16444 |
17638 |
17790 |
15524 |
|
5/31/2026 |
16654 |
17902 |
18726 |
16026 |
|
6/30/2026 |
17074 |
18372 |
18548 |
16165 |
|
7/31/2026 |
16612 |
17887 |
18536 |
16004 |
|
| Average Annual Return [Table Text Block] |
Annual Performance
|
Average Annual Returns for the Periods
Ended July 31, 2026 |
One Year |
Since Inception
(8/17/2022) |
|
Aztlan Global Stock Selection
DM SMID ETF |
18.45% |
13.70% |
|
Solactive Aztlan Global Developed
Markets SMID Cap Index |
20.15% |
15.85% |
|
S&P 500® Total Return Index |
19.56% |
16.89% |
|
MSCI World SMID Cap Index
Gross Total Return |
20.71% |
12.63% |
|
| Performance Inception Date |
Aug. 17, 2022
|
| No Deduction of Taxes [Text Block] |
The graph and table do not reflect the deduction of taxes that a shareholder would pay on fund distributions or redemption of fund shares.
|
| Material Change Description [Text Block] |
This is a summary of certain changes to the Fund. For more complete information, you may review the Fund's prospectus.
|
| Material Change Date |
Aug. 01, 2025
|
| Updated Performance Information Location [Text Block] |
Visit www.aztlanetfs.com/aztd/ for more recent performance information.
|
| Net Assets |
$ 37,863,000
|
| Holdings Count | Holdings |
51
|
| Advisory Fees Paid, Amount |
$ 253,105
|
| Investment Company, Portfolio Turnover |
170.00%
|
| Additional Fund Statistics [Text Block] |
Key Fund Statistics
(as of July 31, 2026)
|
Fund Size (Thousands) |
$37,863 |
|
Number of Holdings |
51 |
|
Total Advisory Fee Paid |
$253,105 |
|
Portfolio Turnover Rate |
170% |
|
| Holdings [Text Block] |
What did the Fund invest in?
(as of July 31, 2026)
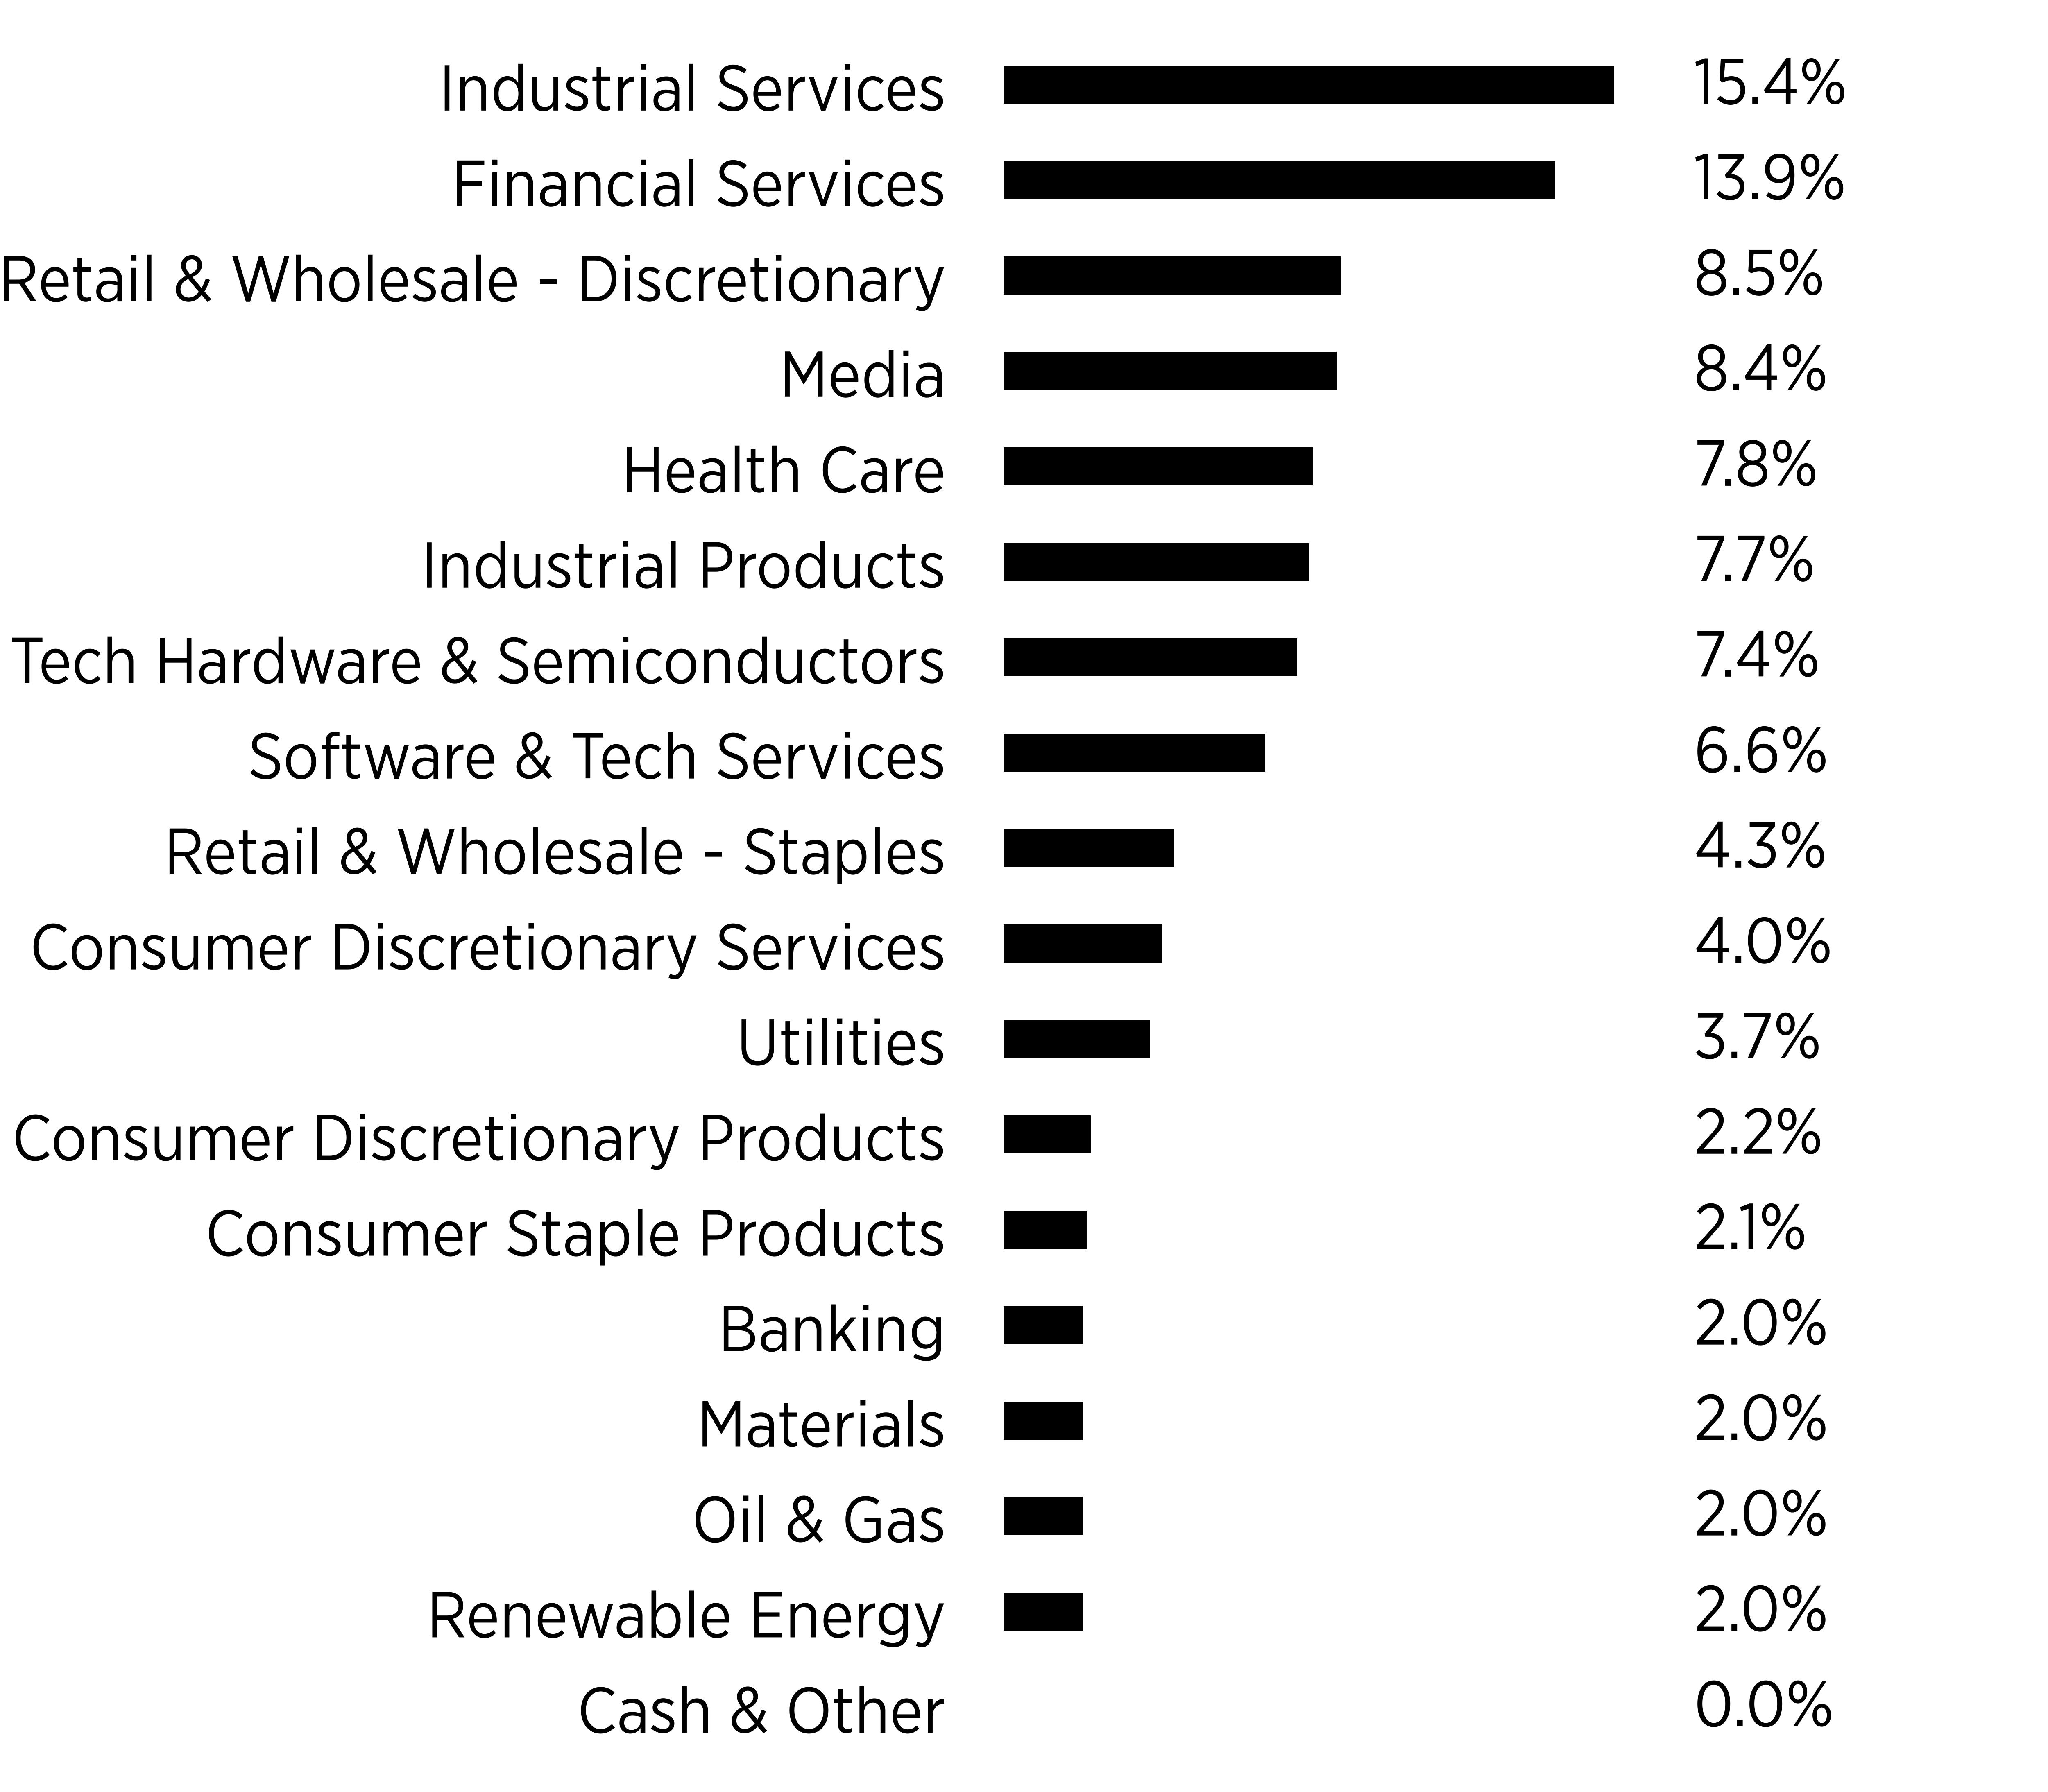
Sector Breakdown
(% of Total Net Assets)
|
sector |
% |
|
Industrial Services |
0.154 |
|
Financial Services |
0.139 |
|
Retail & Wholesale - Discretionary |
0.085 |
|
Media |
0.084 |
|
Health Care |
0.078 |
|
Industrial Products |
0.077 |
|
Tech Hardware & Semiconductors |
0.074 |
|
Software & Tech Services |
0.066 |
|
Retail & Wholesale - Staples |
0.043 |
|
Consumer Discretionary Services |
0.04 |
|
Utilities |
0.037 |
|
Consumer Discretionary Products |
0.022 |
|
Consumer Staple Products |
0.021 |
|
Banking |
0.02 |
|
Materials |
0.02 |
|
Oil & Gas |
0.02 |
|
Renewable Energy |
0.02 |
|
Cash & Other |
0 |
|
| Largest Holdings [Text Block] |
|
Top Ten Holdings |
(% of Total
Net Assets) |
|
Sprouts Farmers Market, Inc. |
2.3% |
|
Kyndryl Holdings, Inc. |
2.2% |
|
Happinet Corp. |
2.2% |
|
Cybozu, Inc. |
2.2% |
|
Toyo Tire Corp. |
2.2% |
|
DocuSign, Inc. |
2.2% |
|
CarGurus, Inc. - Class A |
2.2% |
|
JB Hi-Fi Ltd. |
2.2% |
|
Enova International, Inc. |
2.1% |
|
CyberAgent, Inc. |
2.1% |
|
| Material Fund Change [Text Block] |
Fund Changes
Effective August 1, 2025, U.S. Bancorp Fund Services, LLC, doing business as Global Fund Services, no longer serves as the Sub‐Administrator for each series of Tidal Trust I, including the Fund.
|
| Aztlan North America Nearshoring Stock Selection ETF |
|
| Shareholder Report [Line Items] |
|
| Fund Name |
Aztlan North America Nearshoring Stock Selection ETF
|
| Class Name |
Aztlan North America Nearshoring Stock Selection ETF
|
| Trading Symbol |
NRSH
|
| Security Exchange Name |
NYSEArca
|
| Annual or Semi-Annual Statement [Text Block] |
This annual shareholder report contains important information about the Aztlan North America Nearshoring Stock Selection ETF (the "Fund") for the period August 1, 2025 to July 31, 2026.
|
| Shareholder Report Annual or Semi-Annual |
annual shareholder report
|
| Additional Information [Text Block] |
You can find additional information about the Fund at https://aztlanetfs.com/nrsh. You can also request this information by contacting us at (800) 886-4107 or by writing the Fund at Aztlan North America Nearshoring Stock Selection ETF, c/o U.S. Bank Global Fund Services, P.O. Box 701, Milwaukee, Wisconsin 53201-0701.
|
| Material Fund Change Notice [Text Block] |
This report describes changes to the Fund that occurred during the reporting period.
|
| Additional Information Phone Number |
(800) 886-4107
|
| Additional Information Website |
https://aztlanetfs.com/nrsh
|
| Expenses [Text Block] |
What were the Fund costs for the past year?
(based on a hypothetical $10,000 investment)
|
Fund Name |
Costs of a $10,000 investment |
Costs paid as a percentage of a $10,000 investment |
|
Aztlan North America Nearshoring Stock Selection ETF |
$92 |
0.75% |
|
| Expenses Paid, Amount |
$ 92
|
| Expense Ratio, Percent |
0.75%
|
| Factors Affecting Performance [Text Block] |
How did the Fund perform in the past year?
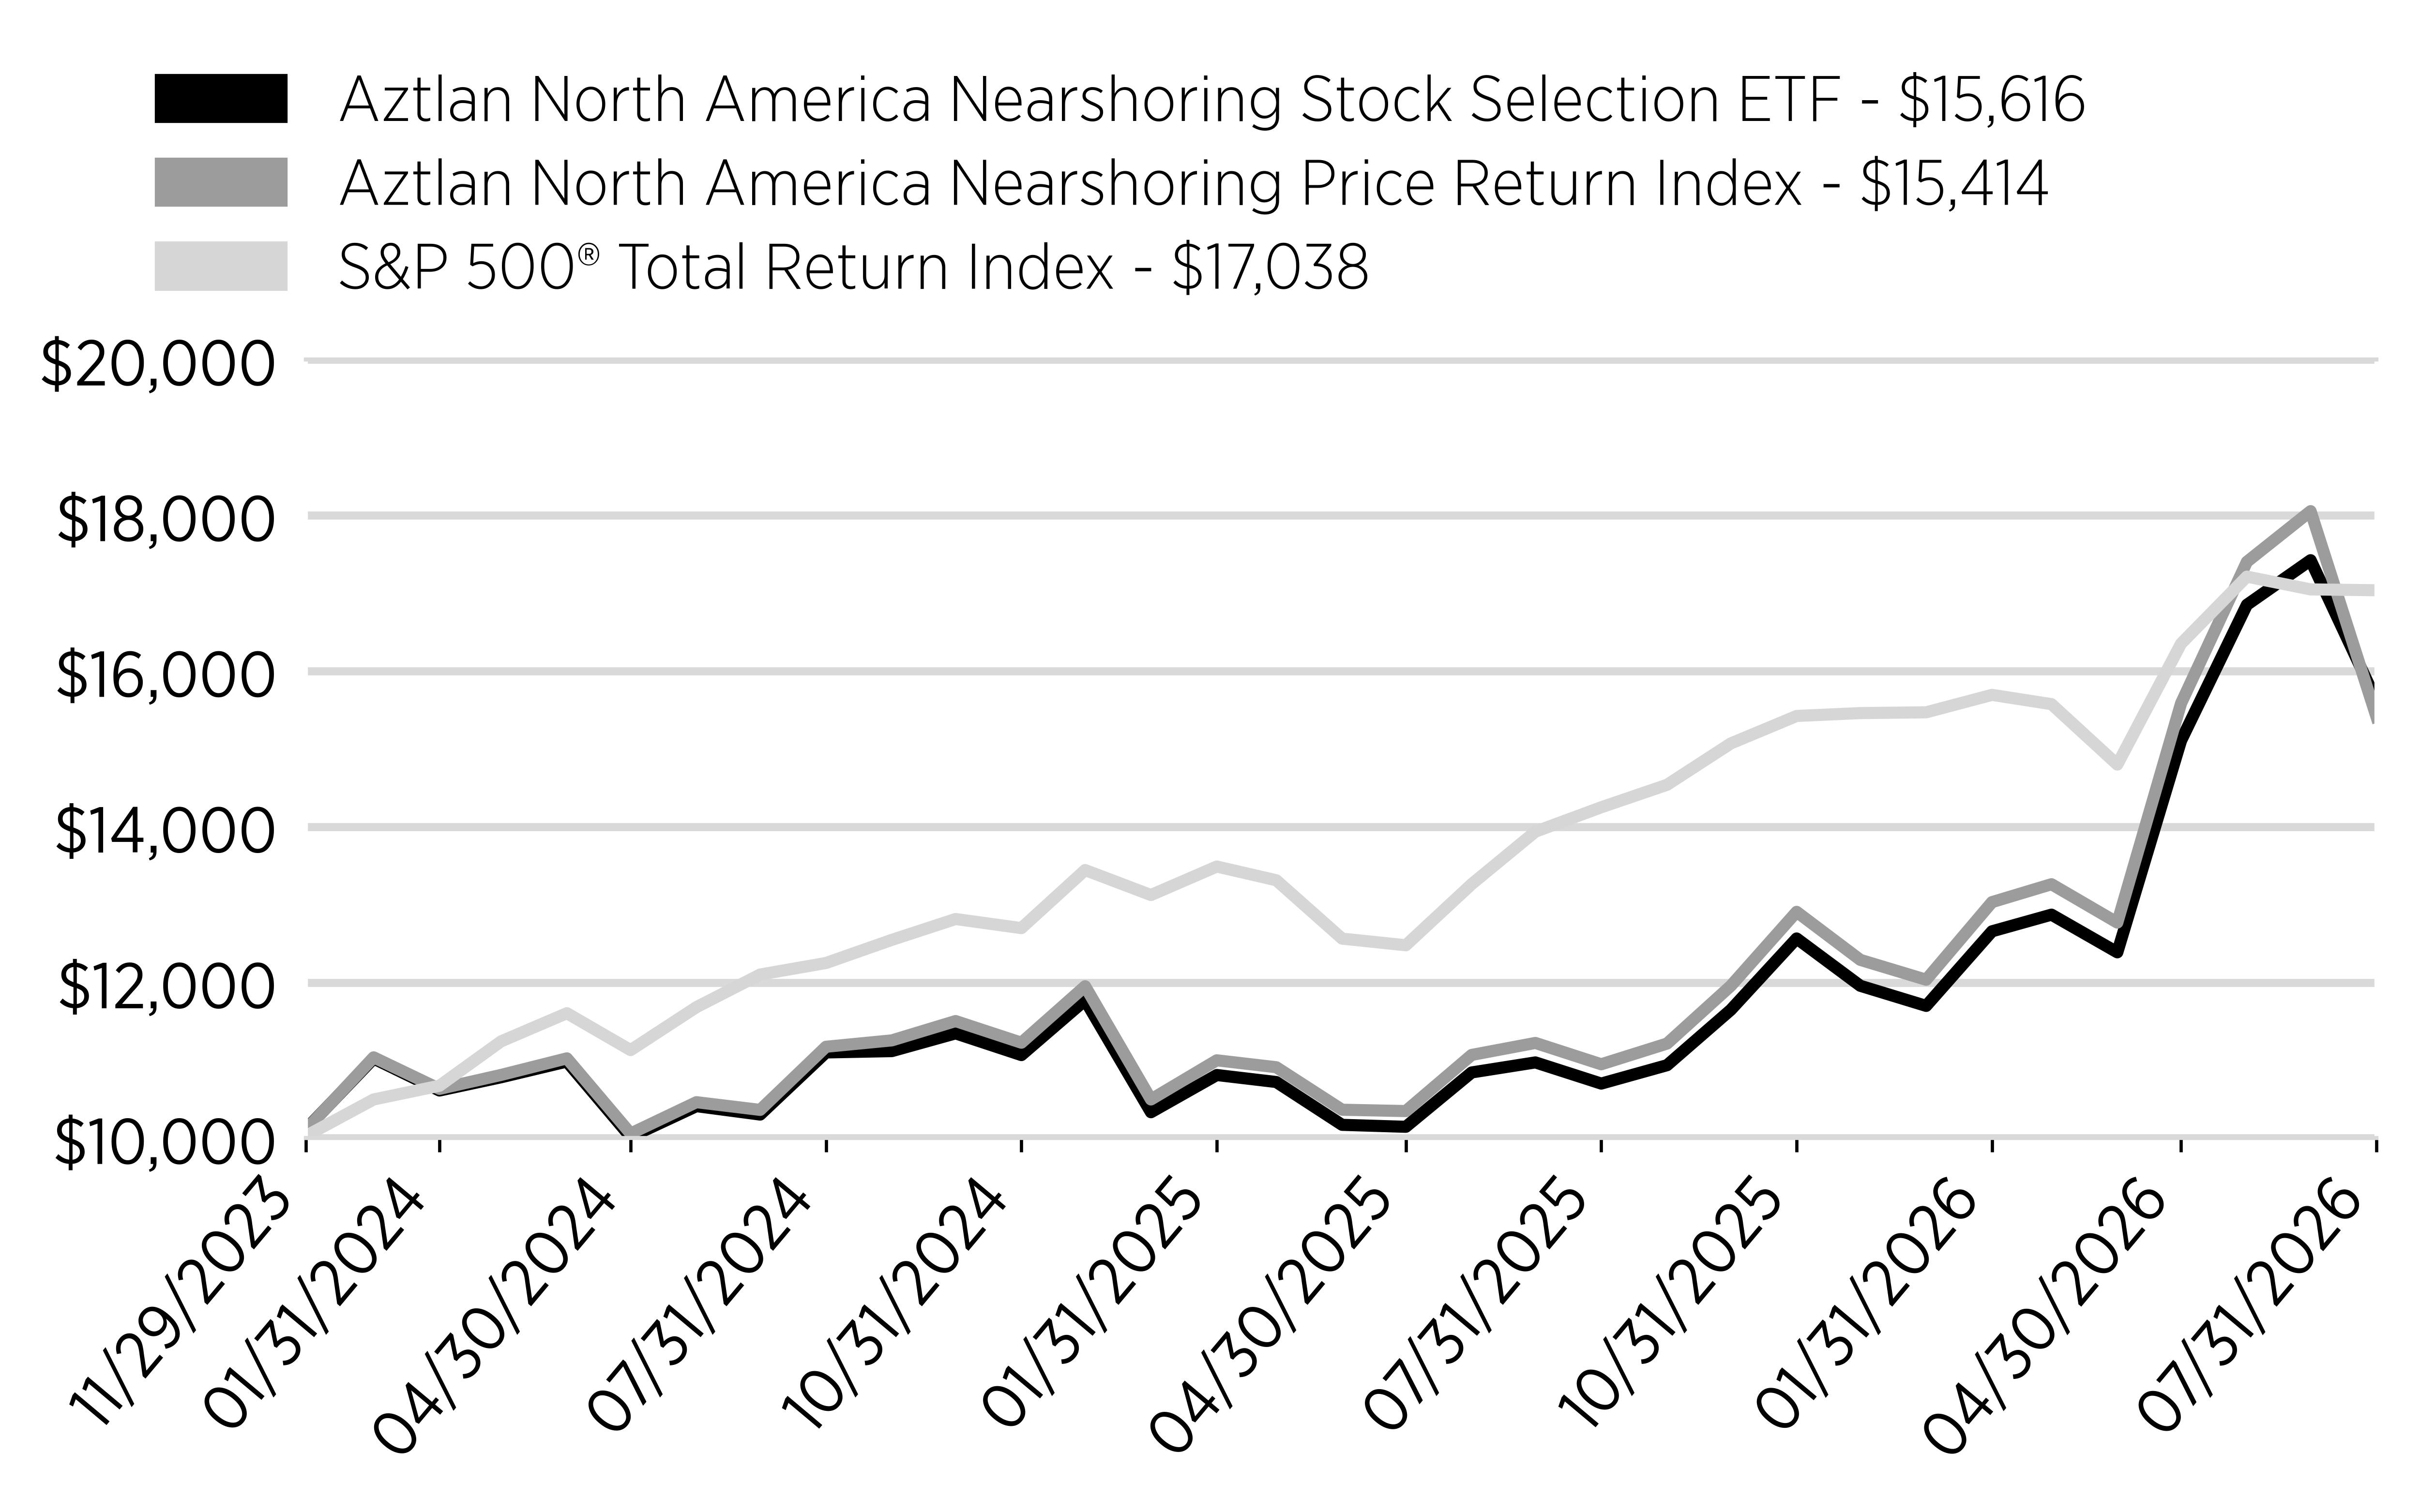
During the reporting period, the Fund generated a total return of 45.93%. This compares to the 46.84% total return of the Aztlan North America Nearshoring Price Return Index, and the 19.56% total return of the benchmark, the S&P 500® Total Return Index.
From a sector perspective, based on performance attribution to the overall portfolio, Industrials and Information Technology were the leading contributors, while a small position in Energy company, Centrus, was the only detractor on a sector basis.
Reviewing individual stocks based on performance attribution to the overall portfolio, leading contributors included Micron Technology Inc. and Sterling Infrastructure Inc.
|
| Performance Past Does Not Indicate Future [Text] |
The Fund's past performance is not a good indicator of how the Fund will perform in the future.
|
| Line Graph [Table Text Block] |
Cumulative Performance
(Initial Investment of $10,000)
|
Date |
Aztlan North America Nearshoring Stock Selection ETF - $15,616 |
Aztlan North America Nearshoring Price Return Index - $15,414 |
S&P 500® Total Return Index - $17,038 |
|
11/29/2023 |
10000 |
10000 |
10000 |
|
11/30/2023 |
10141 |
10133 |
10041 |
|
12/31/2023 |
11023 |
11038 |
10497 |
|
1/31/2024 |
10612 |
10633 |
10673 |
|
2/29/2024 |
10782 |
10812 |
11243 |
|
3/31/2024 |
10984 |
11025 |
11605 |
|
4/30/2024 |
10016 |
10059 |
11131 |
|
5/31/2024 |
10411 |
10462 |
11683 |
|
6/30/2024 |
10303 |
10363 |
12102 |
|
7/31/2024 |
11101 |
11174 |
12250 |
|
8/31/2024 |
11118 |
11256 |
12547 |
|
9/30/2024 |
11346 |
11504 |
12815 |
|
10/31/2024 |
11067 |
11226 |
12698 |
|
11/30/2024 |
11772 |
11951 |
13444 |
|
12/31/2024 |
10333 |
10497 |
13123 |
|
1/31/2025 |
10811 |
11000 |
13489 |
|
2/28/2025 |
10721 |
10911 |
13313 |
|
3/31/2025 |
10171 |
10365 |
12563 |
|
4/30/2025 |
10146 |
10348 |
12478 |
|
5/31/2025 |
10844 |
11069 |
13263 |
|
6/30/2025 |
10973 |
11223 |
13937 |
|
7/31/2025 |
10701 |
10949 |
14250 |
|
8/31/2025 |
10937 |
11215 |
14539 |
|
9/30/2025 |
11648 |
11956 |
15070 |
|
10/31/2025 |
12565 |
12907 |
15423 |
|
11/30/2025 |
11957 |
12290 |
15460 |
|
12/31/2025 |
11699 |
12035 |
15470 |
|
1/31/2026 |
12657 |
13032 |
15694 |
|
2/28/2026 |
12871 |
13262 |
15575 |
|
3/31/2026 |
12387 |
12769 |
14799 |
|
4/30/2026 |
15106 |
15585 |
16352 |
|
5/31/2026 |
16851 |
17403 |
17213 |
|
6/30/2026 |
17424 |
18054 |
17049 |
|
7/31/2026 |
15616 |
15414 |
17038 |
|
| Average Annual Return [Table Text Block] |
Annual Performance
|
Average Annual Returns for the Periods
Ended July 31, 2026 |
One Year |
Since Inception
(11/29/2023) |
|
Aztlan North America Nearshoring
Stock Selection ETF |
45.93% |
18.16% |
|
Aztlan North America Nearshoring
Price Return Index |
46.84% |
17.58% |
|
S&P 500® Total Return Index |
19.56% |
22.08% |
|
| Performance Inception Date |
Nov. 29, 2023
|
| No Deduction of Taxes [Text Block] |
The graph and table do not reflect the deduction of taxes that a shareholder would pay on fund distributions or redemption of fund shares.
|
| Material Change Description [Text Block] |
This is a summary of certain changes to the Fund. For more complete information, you may review the Fund's prospectus.
|
| Material Change Date |
Aug. 01, 2025
|
| Updated Performance Information Location [Text Block] |
Visit www.aztlanetfs.com/nrsh/ for more recent performance information.
|
| Net Assets |
$ 30,009,000
|
| Holdings Count | Holdings |
32
|
| Advisory Fees Paid, Amount |
$ 169,995
|
| Investment Company, Portfolio Turnover |
272.00%
|
| Additional Fund Statistics [Text Block] |
Key Fund Statistics
(as of July 31, 2026)
|
Fund Size (Thousands) |
$30,009 |
|
Number of Holdings |
32 |
|
Total Advisory Fee Paid |
$169,995 |
|
Portfolio Turnover Rate |
272% |
|
| Holdings [Text Block] |
What did the Fund invest in?
(as of July 31, 2026)
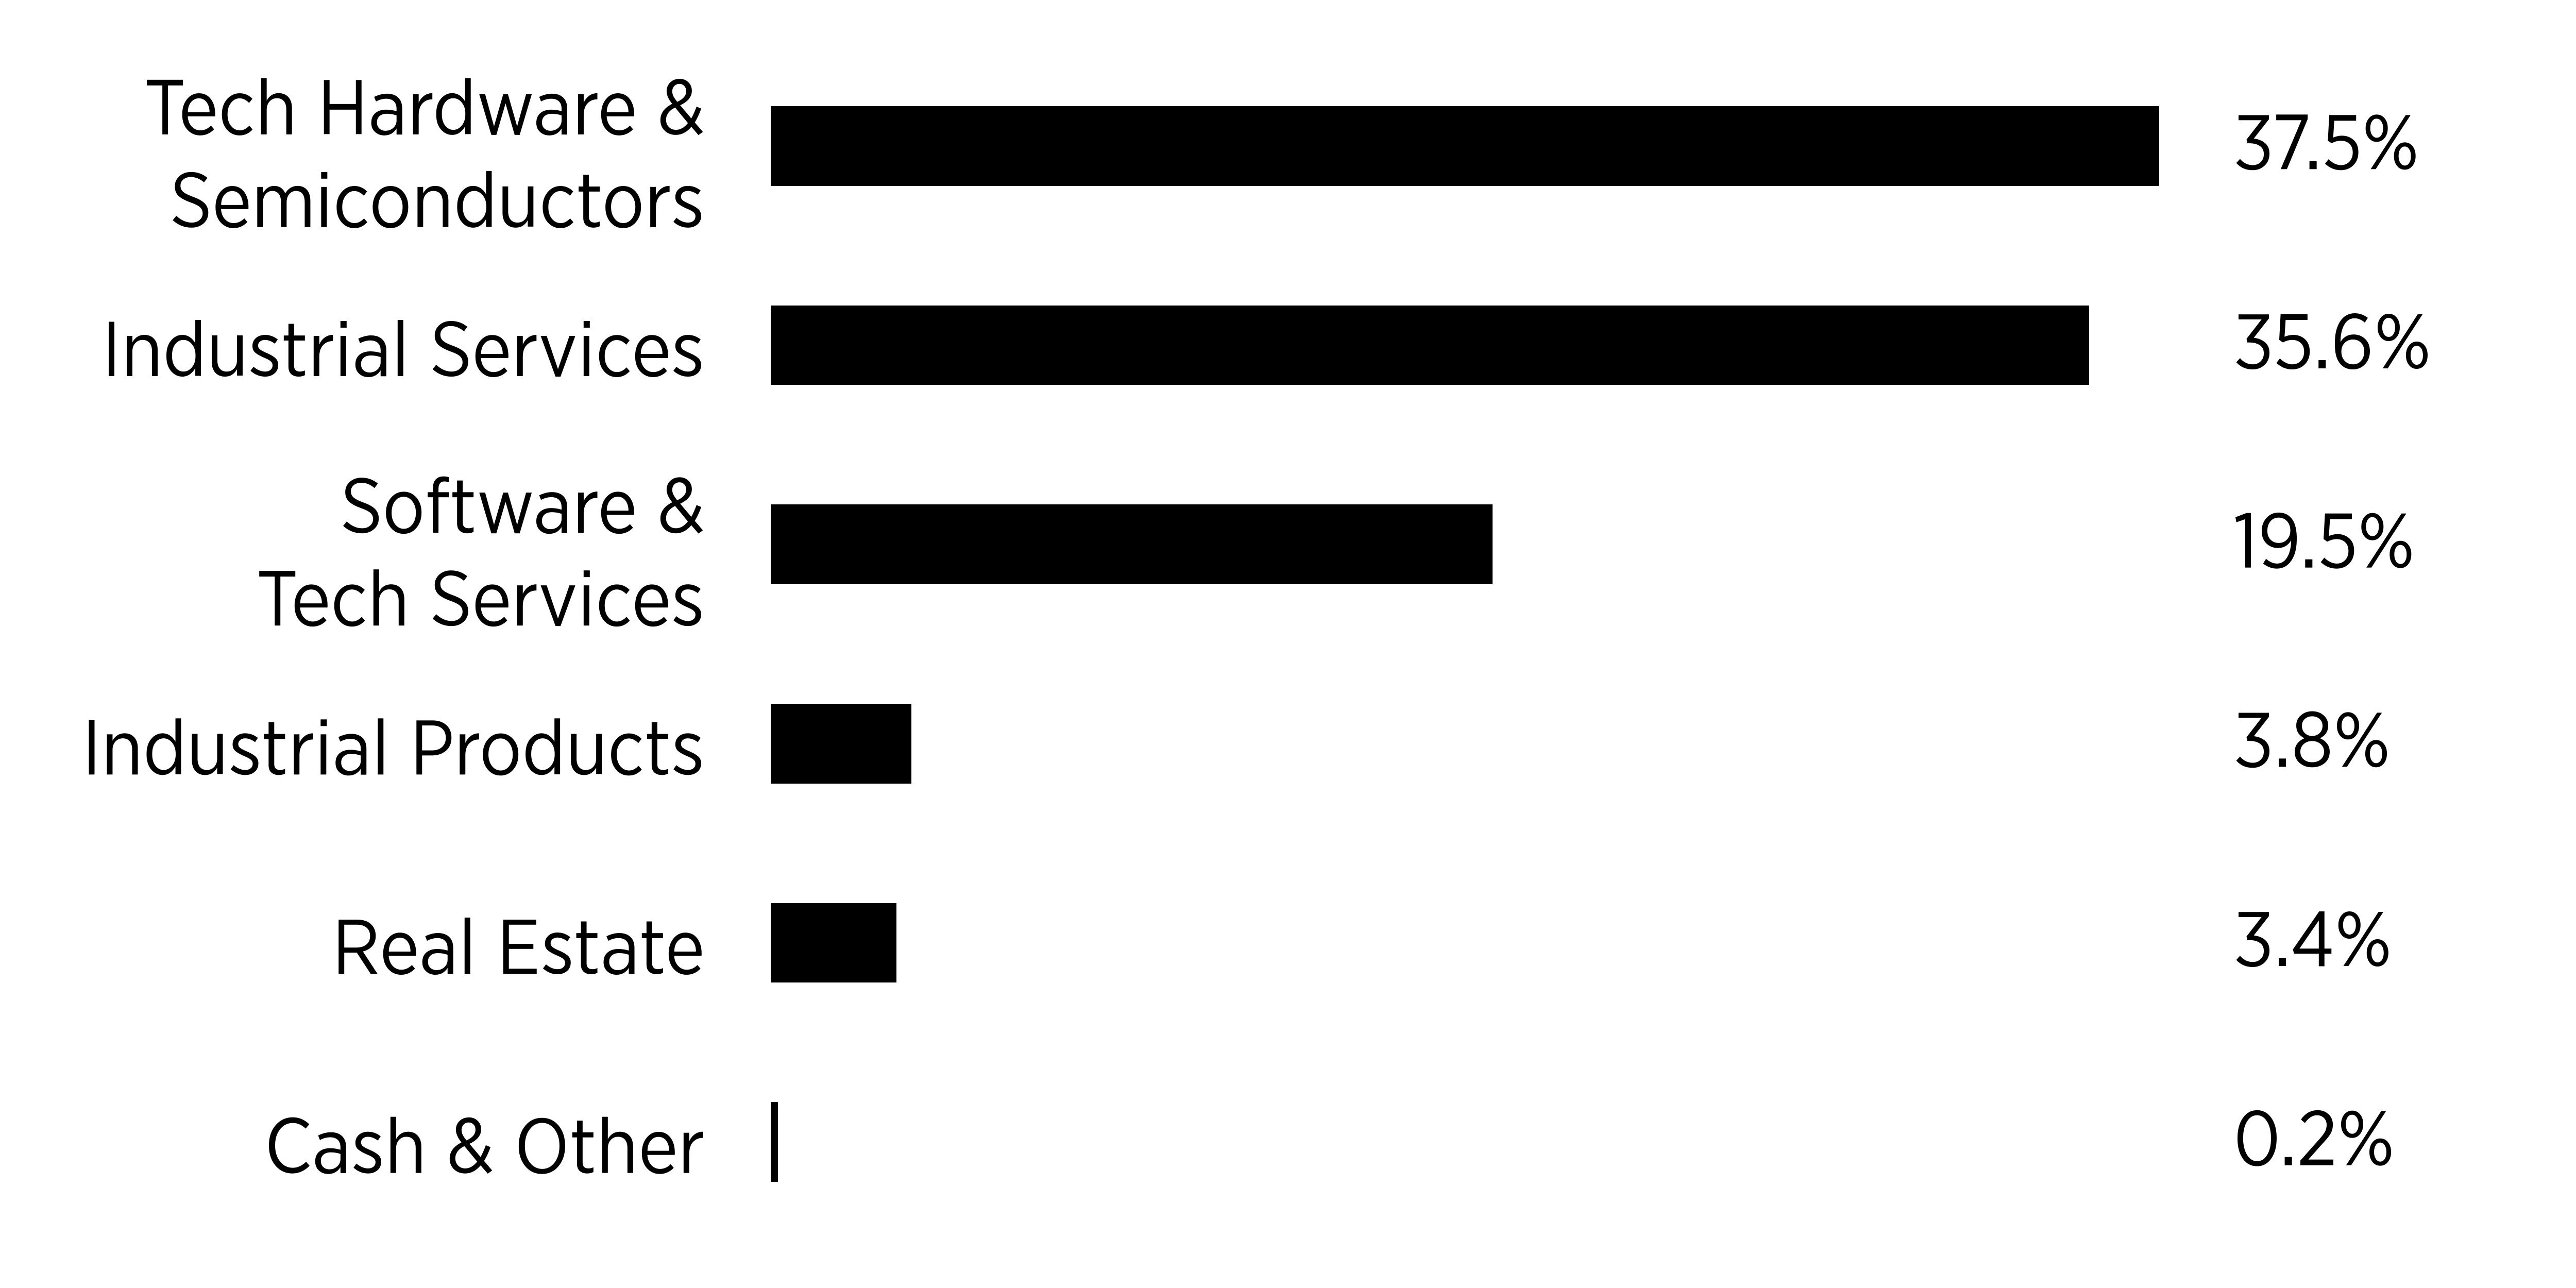
Sector Breakdown
(% of Total Net Assets)
|
sector |
% |
|
Tech Hardware & Semiconductors |
0.375 |
|
Industrial Services |
0.356 |
|
Software & Tech Services |
0.195 |
|
Industrial Products |
0.038 |
|
Real Estate |
0.034 |
|
Cash & Other |
0.002 |
|
| Largest Holdings [Text Block] |
|
Top Ten Holdings |
(% of Total
Net Assets) |
|
Tenable Holdings, Inc. |
4.4% |
|
Mullen Group Ltd. |
4.3% |
|
Intuit, Inc. |
4.1% |
|
CrowdStrike Holdings, Inc. - Class A |
4.1% |
|
NetApp, Inc. |
4.0% |
|
Grupo Aeroportuario del Centro
Norte SAB de CV - Class B |
3.8% |
|
Rockwell Automation, Inc. |
3.8% |
|
Broadcom, Inc. |
3.7% |
|
NetScout Systems, Inc. |
3.6% |
|
NVIDIA Corp. |
3.5% |
|
| Material Fund Change [Text Block] |
Fund Changes
Effective August 1, 2025, U.S. Bancorp Fund Services, LLC, doing business as Global Fund Services, no longer serves as the Sub‐Administrator for each series of Tidal Trust I, including the Fund.
|