Pay Versus Performance Table | ||||||||||||||||||
Average | Average | Value of Initial | ||||||||||||||||
Summary | Compensation | Fixed $100 | ||||||||||||||||
Summary | Compensation | Compensation | Actually | Investment | ||||||||||||||
Compensation | Actually | Table Total | Paid to | Based On Rezolute | ||||||||||||||
Table Total | Paid | for Non-PEO | Non-PEO | Total Stockholder | Net | |||||||||||||
Fiscal Year(1) | for PEO(2) | to PEO(3) | NEOs(2) | NEOs(4) | Return(5) | Income(6) | ||||||||||||
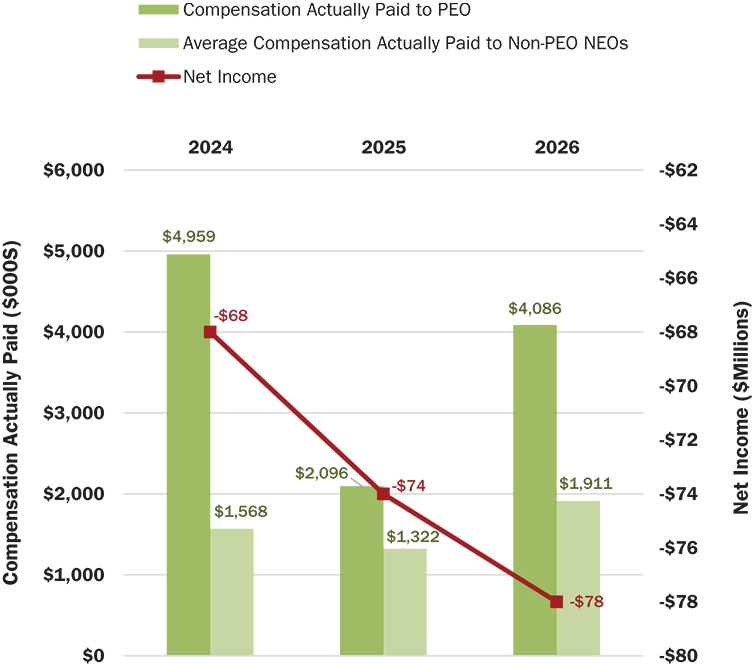
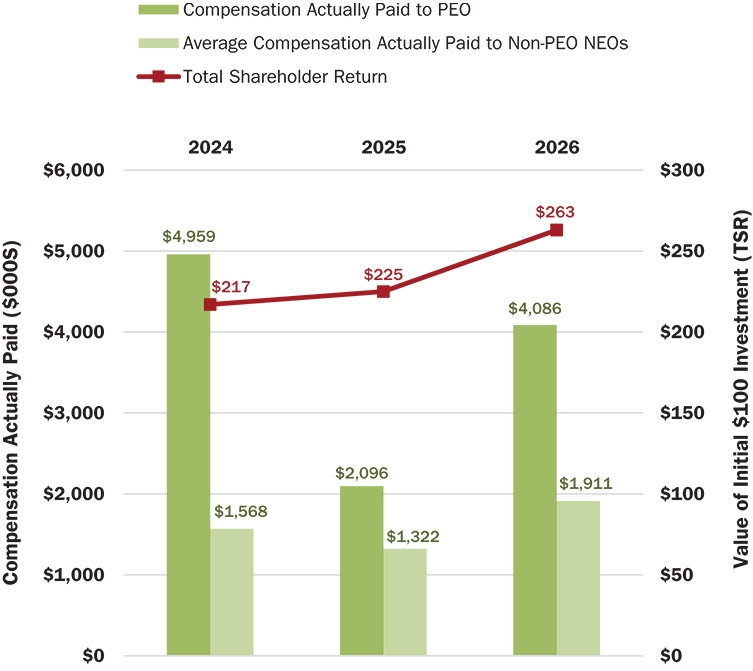
2026 | | $ | 5,711,410 | | $ | 4,086,292 | | $ | 2,491,444 | | $ | 1,911,200 | | $ | 263 | | $ | (77,586,000) |
2025 | | $ | 2,851,109 | | $ | 2,095,714 | | $ | 1,575,194 | | $ | 1,321,984 | | $ | 225 | | $ | (74,412,000) |
2024 | | $ | 1,192,700 | | $ | 4,958,776 | | $ | 601,012 | | $ | 1,568,002 | | $ | 217 | | $ | (68,459,000) |
| (1) | Nevan Charles Elam served as the Company’s Principal Executive Officer (our “PEO”) for the entirety of fiscal years 2024, 2025, and 2026. The Company’s Non-PEO NEOs for fiscal years 2024 and 2025, were Brian Roberts, M.D. and Daron Evans and its Non-PEO NEOs for 2026, were Brian Roberts, M.D., Daron Evans, and Sunil Karnawat (the “Reported NEOs”). |
| (2) | Amounts reported in these columns represent (i) the total compensation reported in the Summary Compensation Table for the indicated fiscal year in the case of our PEO and (ii) the average of the total compensation reported in the Summary Compensation Table for the Reported NEOs in the indicated fiscal year for each such fiscal year. |
| (3) | Amounts reported in this column represent the CAP to our PEO for the indicated fiscal years, as calculated under Item 402(v) of Regulation S-K based on his total compensation reported in the Summary Compensation Table for the indicated fiscal years and adjusted as shown in the table below: |
PEO | |||||||||||
| | 2024 | | 2025 | | 2026 | |||||
| Summary Compensation Table — Total Compensation(a) | $ | 1,192,700 | $ | 2,851,109 | $ | 5,711,410 | ||||
- |
| Grant Date Fair Value of Stock Awards and Option Awards Granted in Fiscal Year(b) | $ | 227,032 | $ | 1,767,204 | $ | 4,579,692 | |||
+ |
| Fair Value at Covered Fiscal Year End of All Outstanding and Unvested Stock Awards and Option Awards Granted in Covered Fiscal Year(c) | $ | 1,155,477 | $ | 1,772,905 | $ | 2,168,554 | |||
+ |
| Change in Fair Value as of Prior Fiscal Year End of Any Outstanding and Unvested Stock Awards and Option Awards Granted in Any Prior Fiscal Year(d) | $ | 2,754,621 | $ | (506,720) | $ | 239,123 | |||
+ |
| Fair Value at Vesting Date of Stock Awards and Option Awards Granted in Covered Fiscal Year That Vested During Covered Fiscal Year(e) | $ | 114,525 | $ | 42,355 | $ | 60,284 | |||
+ |
| Change in Fair Value as of Vesting Date of Any Stock Awards and Option Awards Granted in Any Prior Fiscal Year For Which All Applicable Vesting Conditions Were Satisfied at End of or During Covered Fiscal Year(f) | $ | (31,515) | $ | (296,731) | $ | 486,613 | |||
- |
| Fair Value as of Prior Fiscal Year End of Any Stock Awards and Option Awards Granted in Any Prior Fiscal Year That Failed to Meet Applicable Vesting Conditions During Covered Fiscal Year(g) | $ | — | $ | — | $ | — | |||
= |
| Compensation Actually Paid | $ | 4,958,776 | $ | 2,095,714 | $ | 4,086,292 | |||
| (a) | Represents Total Compensation as reported in the Summary Compensation Table for the indicated fiscal year. |
| (b) | Represents the aggregate grant date fair value of all stock awards and option awards granted to the PEO during the indicated fiscal year, computed in accordance with FASB ASC Topic 718. |
| (c) | Represents the aggregate fair value as of the indicated fiscal year-end of the PEO’s outstanding and unvested stock awards and option awards granted during such fiscal year, computed in accordance with FASB ASC Topic 718. |
| (d) | Represents the aggregate change in fair value as of the indicated fiscal year-end of any outstanding and unvested stock awards and option awards held by the PEO as of the end of the indicated fiscal year, computed in accordance with FASB ASC Topic 718 and, for any awards subject to performance-based vesting conditions, based on the probable outcome of such performance-based vesting conditions as of the end of the fiscal year. |
| (e) | Represents the aggregate fair value as of the vesting date of the stock awards and option awards that were granted to the PEO and vested during the indicated fiscal year, computed in accordance with FASB ASC Topic 718. |
| (f) | Represents the aggregate change in fair value, measured from the prior fiscal year-end to the vesting date, of any stock awards and option awards held by the PEO that were granted in any prior fiscal year and which vested during the indicated fiscal year, computed in accordance with FASB ASC Topic 718. |
| (g) | Represents the aggregate fair value as of the last day of any prior fiscal year of any stock awards and option awards held by the PEO that were granted in any prior fiscal year and which failed to meet the applicable vesting conditions during the indicated fiscal year, computed in accordance with FASB ASC Topic 718. |
Equity award values are calculated in accordance with FASB ASC Topic 718, and the valuation assumptions used to calculate fair values did not materially differ from those disclosed at the time of grant.
| (4) | Amounts reported in this column represent the CAP to the Reported NEOs in the indicated fiscal year, as calculated under Item 402(v) of Regulation S-K based on the average total compensation for such NEOs reported in the Summary Compensation Table for the indicated fiscal year and adjusted as shown in the table below: |
NEO Average(a) | |||||||||||
| 2024 | | 2025 | | 2026 | ||||||
| Summary Compensation Table — Total Compensation(b) | $ | 601,012 | $ | 1,575,194 | $ | 2,491,444 | ||||
- |
| Grant Date Fair Value of Stock Awards and Option Awards Granted in Fiscal Year(c) | $ | 153,475 | $ | 841,827 | $ | 1,756,085 | |||
+ |
| Fair Value at Covered Fiscal Year End of All Outstanding and Unvested Stock Awards and Option Awards Granted in Covered Fiscal Year(d) | $ | 731,761 | $ | 669,299 | $ | 986,767 | |||
+ |
| Change in Fair Value as of Prior Fiscal Year End of Any Outstanding and Unvested Stock Awards and Option Awards Granted in Any Prior Fiscal Year(e) | $ | 370,814 | $ | (70,421) | $ | 86,825 | |||
+ |
| Fair Value at Vesting Date of Stock Awards and Option Awards Granted in Covered Fiscal Year That Vested During Covered Fiscal Year(f) | $ | 21,894 | $ | 15,883 | $ | 16,638 | |||
+ | Change in Fair Value as of Vesting Date of Any Stock Awards and Option Awards Granted in Any Prior Fiscal Year For Which All Applicable Vesting Conditions Were Satisfied at End of or During Covered Fiscal Year(g) | $ | (4,004) | $ | (26,144) | $ | 85,611 | ||||
- | Fair Value as of Prior Fiscal Year End of Any Stock Awards and Option Awards Granted in Any Prior Fiscal Year That Failed to Meet Applicable Vesting Conditions During Covered Fiscal Year(h) | $ | — | $ | — | $ | — | ||||
= |
| Compensation Actually Paid | $ | 1,568,002 | $ | 1,321,984 | $ | 1,911,200 | |||
| (a) | Please see footnote 1 for the Reported NEOs included in the average for the indicated fiscal year. |
| (b) | Represents the average Total Compensation as reported in the Summary Compensation Table for the Reported NEOs in the indicated fiscal year. |
| (c) | Represents the average aggregate grant date fair value of all stock awards and option awards granted to the Reported NEOs during the indicated fiscal year, computed in accordance with FASB ASC Topic 718. |
| (d) | Represents the average aggregate fair value as of the indicated fiscal year-end of the Reported NEOs’ outstanding and unvested stock awards and option awards granted during such fiscal year, computed in accordance with FASB ASC Topic 718. |
| (e) | Represents the average aggregate change in fair value as of the indicated fiscal year-end of any outstanding and unvested stock awards and option awards held by the Reported NEOs as of the end of the indicated fiscal year, computed in accordance with FASB ASC Topic 718 and, for awards subject to performance-based vesting conditions, based on the probable outcome of such performance-based vesting conditions as of the end of the fiscal year. |
| (f) | Represents the average aggregate fair value as of the vesting date of the stock awards and option awards that were granted to the Reported NEOs and vested during the indicated fiscal year, computed in accordance with FASB ASC Topic 718. |
| (g) | Represents the average aggregate change in fair value, measured from the prior fiscal year-end to the vesting date, of any stock awards and option awards held by the Reported NEOs that were granted in any prior fiscal year and which vested during the indicated fiscal year, computed in accordance with FASB ASC Topic 718. |
| (h) | Represents the average aggregate fair value as of the last day of any prior fiscal year of any Reported NEOs’ stock awards and option awards held by the Reported NEOs that were granted in any prior fiscal year and which failed to meet the applicable vesting conditions during the indicated fiscal year, computed in accordance with FASB ASC Topic 718. |
Equity award values are calculated in accordance with FASB ASC Topic 718, and the valuation assumptions used to calculate fair values did not materially differ from those disclosed at the time of grant.
| (5) | Pursuant to Item 402(v) of Regulation S-K, the comparison assumes $100 was invested in our common stock on June 30, 2023, using the closing stock price on that date. Historic stock price performance is not necessarily indicative of future stock price performance. |
| (6) | Represents the net income as reported in the Annual Report of the Company on Form 10-K, for the fiscal years ended June 30, 2026, 2025, and 2024. |
| (1) | Nevan Charles Elam served as the Company’s Principal Executive Officer (our “PEO”) for the entirety of fiscal years 2024, 2025, and 2026. The Company’s Non-PEO NEOs for fiscal years 2024 and 2025, were Brian Roberts, M.D. and Daron Evans and its Non-PEO NEOs for 2026, were Brian Roberts, M.D., Daron Evans, and Sunil Karnawat (the “Reported NEOs”). |
| (3) | Amounts reported in this column represent the CAP to our PEO for the indicated fiscal years, as calculated under Item 402(v) of Regulation S-K based on his total compensation reported in the Summary Compensation Table for the indicated fiscal years and adjusted as shown in the table below: |
PEO | |||||||||||
| | 2024 | | 2025 | | 2026 | |||||
| Summary Compensation Table — Total Compensation(a) | $ | 1,192,700 | $ | 2,851,109 | $ | 5,711,410 | ||||
- |
| Grant Date Fair Value of Stock Awards and Option Awards Granted in Fiscal Year(b) | $ | 227,032 | $ | 1,767,204 | $ | 4,579,692 | |||
+ |
| Fair Value at Covered Fiscal Year End of All Outstanding and Unvested Stock Awards and Option Awards Granted in Covered Fiscal Year(c) | $ | 1,155,477 | $ | 1,772,905 | $ | 2,168,554 | |||
+ |
| Change in Fair Value as of Prior Fiscal Year End of Any Outstanding and Unvested Stock Awards and Option Awards Granted in Any Prior Fiscal Year(d) | $ | 2,754,621 | $ | (506,720) | $ | 239,123 | |||
+ |
| Fair Value at Vesting Date of Stock Awards and Option Awards Granted in Covered Fiscal Year That Vested During Covered Fiscal Year(e) | $ | 114,525 | $ | 42,355 | $ | 60,284 | |||
+ |
| Change in Fair Value as of Vesting Date of Any Stock Awards and Option Awards Granted in Any Prior Fiscal Year For Which All Applicable Vesting Conditions Were Satisfied at End of or During Covered Fiscal Year(f) | $ | (31,515) | $ | (296,731) | $ | 486,613 | |||
- |
| Fair Value as of Prior Fiscal Year End of Any Stock Awards and Option Awards Granted in Any Prior Fiscal Year That Failed to Meet Applicable Vesting Conditions During Covered Fiscal Year(g) | $ | — | $ | — | $ | — | |||
= |
| Compensation Actually Paid | $ | 4,958,776 | $ | 2,095,714 | $ | 4,086,292 | |||
| (a) | Represents Total Compensation as reported in the Summary Compensation Table for the indicated fiscal year. |
| (b) | Represents the aggregate grant date fair value of all stock awards and option awards granted to the PEO during the indicated fiscal year, computed in accordance with FASB ASC Topic 718. |
| (c) | Represents the aggregate fair value as of the indicated fiscal year-end of the PEO’s outstanding and unvested stock awards and option awards granted during such fiscal year, computed in accordance with FASB ASC Topic 718. |
| (d) | Represents the aggregate change in fair value as of the indicated fiscal year-end of any outstanding and unvested stock awards and option awards held by the PEO as of the end of the indicated fiscal year, computed in accordance with FASB ASC Topic 718 and, for any awards subject to performance-based vesting conditions, based on the probable outcome of such performance-based vesting conditions as of the end of the fiscal year. |
| (e) | Represents the aggregate fair value as of the vesting date of the stock awards and option awards that were granted to the PEO and vested during the indicated fiscal year, computed in accordance with FASB ASC Topic 718. |
| (f) | Represents the aggregate change in fair value, measured from the prior fiscal year-end to the vesting date, of any stock awards and option awards held by the PEO that were granted in any prior fiscal year and which vested during the indicated fiscal year, computed in accordance with FASB ASC Topic 718. |
| (g) | Represents the aggregate fair value as of the last day of any prior fiscal year of any stock awards and option awards held by the PEO that were granted in any prior fiscal year and which failed to meet the applicable vesting conditions during the indicated fiscal year, computed in accordance with FASB ASC Topic 718. |
| (4) | Amounts reported in this column represent the CAP to the Reported NEOs in the indicated fiscal year, as calculated under Item 402(v) of Regulation S-K based on the average total compensation for such NEOs reported in the Summary Compensation Table for the indicated fiscal year and adjusted as shown in the table below: |
NEO Average(a) | |||||||||||
| 2024 | | 2025 | | 2026 | ||||||
| Summary Compensation Table — Total Compensation(b) | $ | 601,012 | $ | 1,575,194 | $ | 2,491,444 | ||||
- |
| Grant Date Fair Value of Stock Awards and Option Awards Granted in Fiscal Year(c) | $ | 153,475 | $ | 841,827 | $ | 1,756,085 | |||
+ |
| Fair Value at Covered Fiscal Year End of All Outstanding and Unvested Stock Awards and Option Awards Granted in Covered Fiscal Year(d) | $ | 731,761 | $ | 669,299 | $ | 986,767 | |||
+ |
| Change in Fair Value as of Prior Fiscal Year End of Any Outstanding and Unvested Stock Awards and Option Awards Granted in Any Prior Fiscal Year(e) | $ | 370,814 | $ | (70,421) | $ | 86,825 | |||
+ |
| Fair Value at Vesting Date of Stock Awards and Option Awards Granted in Covered Fiscal Year That Vested During Covered Fiscal Year(f) | $ | 21,894 | $ | 15,883 | $ | 16,638 | |||
+ | Change in Fair Value as of Vesting Date of Any Stock Awards and Option Awards Granted in Any Prior Fiscal Year For Which All Applicable Vesting Conditions Were Satisfied at End of or During Covered Fiscal Year(g) | $ | (4,004) | $ | (26,144) | $ | 85,611 | ||||
- | Fair Value as of Prior Fiscal Year End of Any Stock Awards and Option Awards Granted in Any Prior Fiscal Year That Failed to Meet Applicable Vesting Conditions During Covered Fiscal Year(h) | $ | — | $ | — | $ | — | ||||
= |
| Compensation Actually Paid | $ | 1,568,002 | $ | 1,321,984 | $ | 1,911,200 | |||
| (a) | Please see footnote 1 for the Reported NEOs included in the average for the indicated fiscal year. |
| (b) | Represents the average Total Compensation as reported in the Summary Compensation Table for the Reported NEOs in the indicated fiscal year. |
| (c) | Represents the average aggregate grant date fair value of all stock awards and option awards granted to the Reported NEOs during the indicated fiscal year, computed in accordance with FASB ASC Topic 718. |
| (d) | Represents the average aggregate fair value as of the indicated fiscal year-end of the Reported NEOs’ outstanding and unvested stock awards and option awards granted during such fiscal year, computed in accordance with FASB ASC Topic 718. |
| (e) | Represents the average aggregate change in fair value as of the indicated fiscal year-end of any outstanding and unvested stock awards and option awards held by the Reported NEOs as of the end of the indicated fiscal year, computed in accordance with FASB ASC Topic 718 and, for awards subject to performance-based vesting conditions, based on the probable outcome of such performance-based vesting conditions as of the end of the fiscal year. |
| (f) | Represents the average aggregate fair value as of the vesting date of the stock awards and option awards that were granted to the Reported NEOs and vested during the indicated fiscal year, computed in accordance with FASB ASC Topic 718. |
| (g) | Represents the average aggregate change in fair value, measured from the prior fiscal year-end to the vesting date, of any stock awards and option awards held by the Reported NEOs that were granted in any prior fiscal year and which vested during the indicated fiscal year, computed in accordance with FASB ASC Topic 718. |
| (h) | Represents the average aggregate fair value as of the last day of any prior fiscal year of any Reported NEOs’ stock awards and option awards held by the Reported NEOs that were granted in any prior fiscal year and which failed to meet the applicable vesting conditions during the indicated fiscal year, computed in accordance with FASB ASC Topic 718. |
Equity award values are calculated in accordance with FASB ASC Topic 718, and the valuation assumptions used to calculate fair values did not materially differ from those disclosed at the time of grant.
Compensation Actually Paid vs. TSR
Compensation Actually Paid vs. Net Income