Shareholder Report
Jul. 31, 2026
USD ($)
$ / shares
WHAT WERE THE FUND COSTS FOR THE PAST YEAR? (based on a hypothetical $10,000 investment)
|
Fund Name
|
Costs of a $10,000 investment
|
Costs paid as a percentage of a $10,000 investment
|
|
US Vegan Climate ETF
|
$70
|
0.60%
|
HOW DID THE FUND PERFORM LAST YEAR AND WHAT AFFECTED ITS PERFORMANCE?
Strong performers for the fiscal year were semiconductor stocks such as Advanced Micro Devices (AMD), Broadcom (AVGO), Cisco (CSCO), Micron Technology (MU), with the majority of those returns coming in the second half of the fiscal year. Additional support in the second half came from UnitedHealth (UNH) whereas Alphabet (GOOG), another performer in this fiscal year, was mainly a contributor in the first half. Detractors were American Express (AXP), Salesforce (CRM), Intuit (INTU), and Marvell Technology, Inc. (MRVL) and ServiceNow (NOW), and Oracle (ORCL), with the latter stocks weak on fears that SaaS stocks market shares would be cannibalised by generative AI and the massive capital expenditure required by AI being borne by cloud service providers. During the full fiscal year, all exclusion categories contributed to returns, except for animal-derived products, with energy production from fossil fuels and military and defense being the two largest contributors. Over the second half of the fiscal year, all categories were contributors, with the two leaders for the year joined by captive animals, human rights violations, other environmental and tobacco. Sector tilts in utilities, financials and materials were important contributors to fiscal year performance, joined by communications and consumer discretionary over and underweights in the second half.
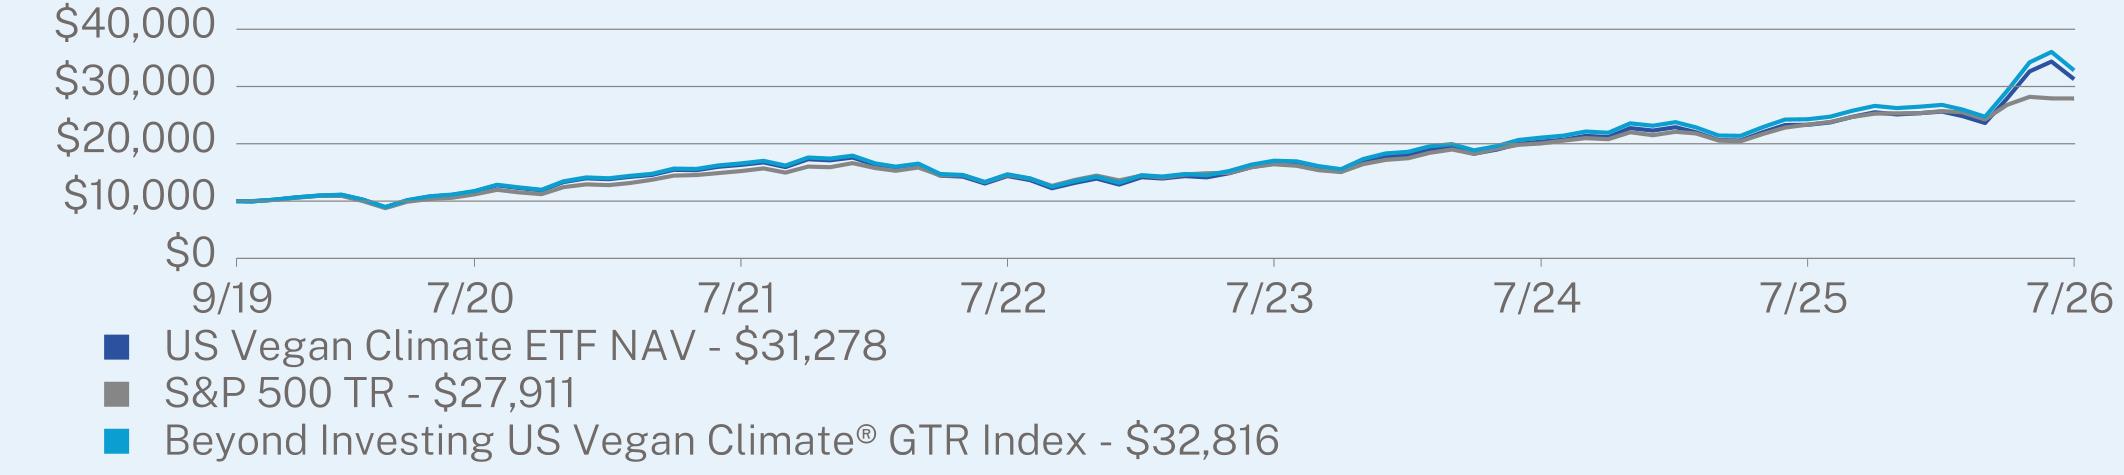
ANNUAL AVERAGE TOTAL RETURN (%)
|
|
1 Year
|
5 Year
|
Since Inception
(09/09/2019) |
|
US Vegan Climate ETF NAV
|
34.14
|
13.89
|
17.99
|
|
S&P 500 TR
|
19.56
|
12.86
|
16.06
|
|
Beyond Investing US Vegan Climate® GTR Index
|
35.11
|
14.63
|
18.81
|
Visit https://veganetf.com/ for more recent performance information.
KEY FUND STATISTICS (as of July 31, 2026)
|
Net Assets
|
$177,645,574
|
|
Number of Holdings
|
262
|
|
Net Advisory Fee
|
$858,848
|
|
Portfolio Turnover
|
32%
|
|
30-Day SEC Yield
|
0.39%
|
|
30-Day SEC Yield Unsubsidized
|
0.39%
|
WHAT DID THE FUND INVEST IN? (as of July 31, 2026)
|
Top 10 Issuers
|
(% of Net Assets)
|
|
|
Micron Technology, Inc.
|
4.6
|
%
|
|
Apple, Inc.
|
4.5
|
%
|
|
Advanced Micro Devices, Inc.
|
4.1
|
%
|
|
Broadcom, Inc.
|
4.1
|
%
|
|
Alphabet, Inc.
|
4.0
|
%
|
|
NVIDIA Corp.
|
3.9
|
%
|
|
Visa, Inc.
|
3.6
|
%
|
|
Mastercard, Inc.
|
3.1
|
%
|
|
Applied Materials, Inc.
|
3.0
|
%
|
|
Cisco Systems, Inc.
|
3.0
|
%
|
|
Top Sectors
|
(% of Net Assets)
|
|
|
Technology
|
53.3
|
%
|
|
Financial
|
17.2
|
%
|
|
Communications
|
16.7
|
%
|
|
Consumer, Non-cyclical
|
5.9
|
%
|
|
Industrial
|
4.4
|
%
|
|
Consumer, Cyclical
|
1.9
|
%
|
|
Energy
|
0.1
|
%
|
|
Utilities
|
0.1
|
%
|
|
Basic Materials
|
0.0
|
%*
|
|
Cash & Other
|
0.4
|
%
|