Shareholder Report
Jul. 31, 2026
USD ($)
Holding
For information on the Green Century Funds®, call 1-800-93-GREEN. For information on how to open an account and account services, call 1-800-221-5519 8:00 am to 6:00 pm Eastern Time, Monday through Friday. For daily share price information twenty-four hours a day, visit www.greencentury.com.
What were the Fund costs for the last year?
(Based on a hypothetical $10,000 investment)
The below table explains the costs that you would have paid within the reporting period.
| Fund (Class) | Costs of a $10,000 investment | Costs paid as a percentage of a $10,000 investment |
| Green Century Balanced Fund (Institutional Class/GCBUX) |
$108 | 1.02% |
Management’s Discussion of Fund Performance
How did the Fund perform last year? What affected the Fund’s performance?
The fund’s performance during the reporting period was influenced by a more cautious equity allocation in the early months, which served as a headwind to relative performance as equity markets grinded higher. However, entering 2026, the fund repositioned toward a more risk-on allocation based on expectations for a supportive macroeconomic environment and continued strength in corporate earnings. While this shift contributed positively to relative performance, it was not sufficient to fully offset the earlier drag, resulting in the fund modestly underperforming its benchmark for the period from August 1, 2025 through July 31, 2026.
Within equities, performance was influenced by broader market participation than the highly concentrated market environment of prior years, with gains spread across many companies. The Energy sector had volatile but high returns, driven by the impact of global conflicts on fossil fuel prices. Despite this relative performance headwind, the Fund’s tilt toward high-quality companies led to outperformance in other sectors and allowed our equity exposure to keep pace with the benchmark return for the year.
The fixed income portfolio modestly outperformed the Bloomberg US Intermediate Credit Index year-to-date (12/31/2025- 7/31/2026), generating 1.8 bps of excess return. Performance was driven primarily by issuer selection, with strong contributions from holdings in Services, Financial Services, and Basic Industry. Sector positioning was a headwind. The portfolio maintained below-benchmark exposure to several of the strongest-performing sectors, particularly Energy and Utilities. One of the defining macro themes of 2026 has been the surge in electricity demand driven by AI data center buildout, which has had a direct and meaningful impact on Energy and Utility credit supported by ongoing investment in power infrastructure, increased financing activity, and growing demand from data center development. Overweights in Real Estate and select financial issuers provided a partial offset. Duration and curve positioning were modestly positive for performance, although most of the excess return came from issuer-specific positions rather than broader market exposures. Trading activity had a small negative impact, reflecting normal portfolio repositioning during the period. Overall, the period was characterized by strong security selection offset by unfavorable sector allocation. While underweights to Energy and Utilities detracted from relative returns, issuer selection across several sectors more than compensated, resulting in modest outperformance versus the benchmark.
Fund Performance
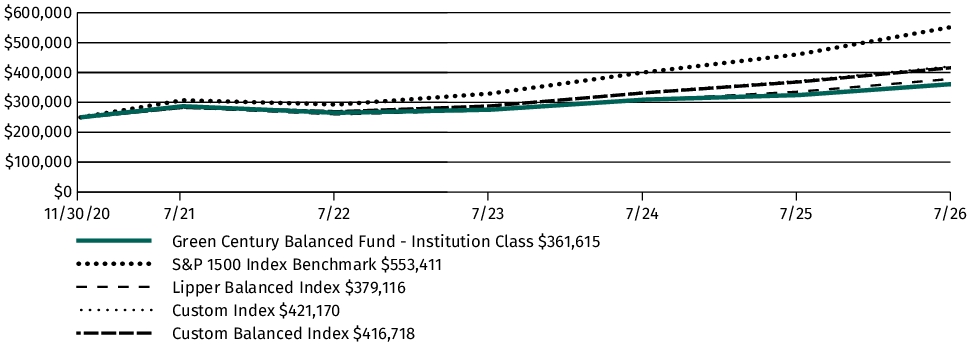
The following graph compares the initial and subsequent account values at the end of each of the most recently completed 10 fiscal years of the Fund. It assumes a $250,000 initial investment at the beginning of the first fiscal year in an appropriate broad-based securities market index for the same period. Institutional Shares were offered as of November 28, 2020. The Institutional Share Class performance prior to November 28, 2020 reflects the performance of the Fund’s Individual Investor Class.
| AVERAGE ANNUAL TOTAL RETURN | 1 Year | 5 Years | 10 Years |
| Green Century Balanced Fund (Institutional Class/GCBUX) | 11.39% | 4.71% | 8.18% |
| S&P Composite 15001,2 | 19.97% | 12.49% | 14.72% |
| Lipper Balanced3 | 12.84% | 6.04% | 8.19% |
| Custom Index4,5 | 13.19% | 8.20% | 9.96% |
| Custom Balanced Index6 | 13.02% | 8.02% | 9.70% |
| 1 |
The Regulatory Index is provided as a broad measure of market performance. |
| 2 |
The S&P 1500 Index is an unmanaged index of 1500 stocks. |
| 3 |
The Lipper Balanced Index is an equally weighted index of the 30 largest U.S. Balanced Funds. |
| 4 |
The Performance Index is provided because the advisor believes it is more reflective of the fund’s investment strategy. The investment return and principal value of shares of the Fund fluctuate, so your shares, when sold, may be worth more or less than their original cost. |
| 5 |
The Custom Index is comprised of a 60% weighting in the S&P 1500 Index and a 40% weighting in the Bloomberg U.S. Intermediate Credit (1-10 Year) Index. |
| 6 |
The Custom Balanced Index is comprised of a 60% weighting in the S&P 1500 Index and a 40% weighting in the BofA Merrill Lynch 1-10 Year US Corporate & Government Index. Effective December 1, 2025 the Custom Index replaced the Custom Balanced Index as the primary benchmark. |
Key Fund Statistics
The following table outlines key fund statistic that you should pay attention to
| Fund net assets | $374 mil. |
| Total number of portfolio holdings | 451 |
| Total advisory fees paid (net) | $1.9 mil. |
| Portfolio turnover rate as of the end of the reporting period | 62% |
Graphical Representation of Holdings
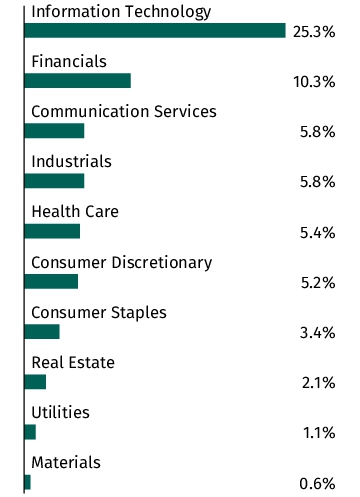
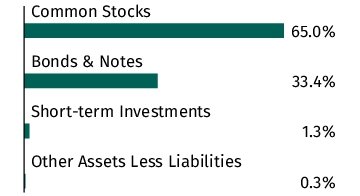
The tables below show the investment make up of the Fund, representing percentage of total net assets of the Fund. The Top Ten Holdings and Sector Allocation exclude short-term holdings, if any. The Sector Allocation chart represents Common Stocks of the Fund.
Top Ten Holdings
| NVIDIA Corporation | 5.6% |
| Apple, Inc. | 5.0% |
| Microsoft Corporation | 4.5% |
| Alphabet, Inc., Class A | 4.2% |
| Mastercard, Inc., Class A | 2.3% |
| Bank of America Corporation | 1.7% |
| Costco Wholesale Corporation | 1.6% |
| PNC Financial Services Group, Inc. (The) | 1.6% |
| TJX Companies, Inc. (The) | 1.5% |
| Broadcom, Inc. | 1.4% |
Sector Allocation
Asset Allocation
Top Ten Holdings
| NVIDIA Corporation | 5.6% |
| Apple, Inc. | 5.0% |
| Microsoft Corporation | 4.5% |
| Alphabet, Inc., Class A | 4.2% |
| Mastercard, Inc., Class A | 2.3% |
| Bank of America Corporation | 1.7% |
| Costco Wholesale Corporation | 1.6% |
| PNC Financial Services Group, Inc. (The) | 1.6% |
| TJX Companies, Inc. (The) | 1.5% |
| Broadcom, Inc. | 1.4% |
For information on the Green Century Funds®, call 1-800-93-GREEN. For information on how to open an account and account services, call 1-800-221-5519 8:00 am to 6:00 pm Eastern Time, Monday through Friday. For daily share price information twenty-four hours a day, visit www.greencentury.com.
What were the Fund costs for the last year?
(Based on a hypothetical $10,000 investment)
The below table explains the costs that you would have paid within the reporting period.
| Fund (Class) | Costs of a $10,000 investment | Costs paid as a percentage of a $10,000 investment |
| Green Century Balanced Fund (Individual Investor Class/GCBLX) |
$139 | 1.32% |
Management’s Discussion of Fund Performance
How did the Fund perform last year? What affected the Fund’s performance?
The fund’s performance during the reporting period was influenced by a more cautious equity allocation in the early months, which served as a headwind to relative performance as equity markets grinded higher. However, entering 2026, the fund repositioned toward a more risk-on allocation based on expectations for a supportive macroeconomic environment and continued strength in corporate earnings. While this shift contributed positively to relative performance, it was not sufficient to fully offset the earlier drag, resulting in the fund modestly underperforming its benchmark for the period from August 1, 2025 through July 31, 2026.
Within equities, performance was influenced by broader market participation than the highly concentrated market environment of prior years, with gains spread across many companies. The Energy sector had volatile but high returns, driven by the impact of global conflicts on fossil fuel prices. Despite this relative performance headwind, the Fund’s tilt toward high-quality companies led to outperformance in other sectors and allowed our equity exposure to keep pace with the benchmark return for the year.
The fixed income portfolio modestly outperformed the Bloomberg US Intermediate Credit Index year-to-date (12/31/2025- 7/31/2026), generating 1.8 bps of excess return. Performance was driven primarily by issuer selection, with strong contributions from holdings in Services, Financial Services, and Basic Industry. Sector positioning was a headwind. The portfolio maintained below-benchmark exposure to several of the strongest-performing sectors, particularly Energy and Utilities. One of the defining macro themes of 2026 has been the surge in electricity demand driven by AI data center buildout, which has had a direct and meaningful impact on Energy and Utility credit supported by ongoing investment in power infrastructure, increased financing activity, and growing demand from data center development. Overweights in Real Estate and select financial issuers provided a partial offset. Duration and curve positioning were modestly positive for performance, although most of the excess return came from issuer-specific positions rather than broader market exposures. Trading activity had a small negative impact, reflecting normal portfolio repositioning during the period. Overall, the period was characterized by strong security selection offset by unfavorable sector allocation. While underweights to Energy and Utilities detracted from relative returns, issuer selection across several sectors more than compensated, resulting in modest outperformance versus the benchmark.
Fund Performance
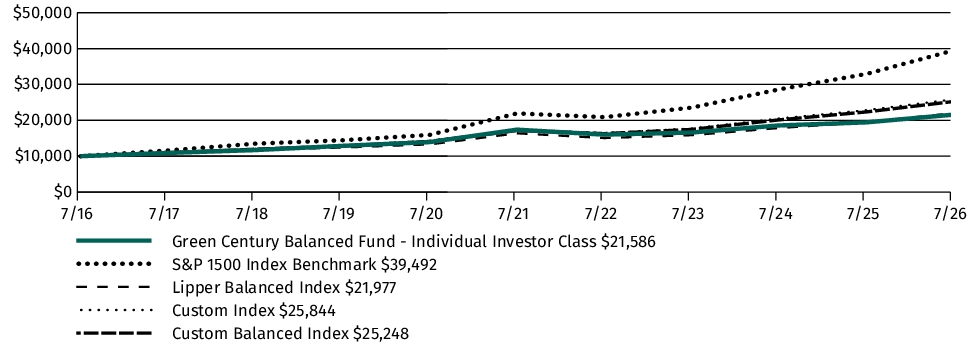
The following graph compares the initial and subsequent account values at the end of each of the most recently completed 10 fiscal years of the Fund. It assumes a $10,000 initial investment at the beginning of the first fiscal year in an appropriate broad-based securities market index for the same period.
| AVERAGE ANNUAL TOTAL RETURN | 1 Year | 5 Years | 10 Years |
| Green Century Balanced Fund (Individual Investor Class/GCBLX) | 11.08% | 4.41% | 8.00% |
| S&P Composite 15001,2 | 19.97% | 12.49% | 14.72% |
| Lipper Balanced3 | 12.84% | 6.04% | 8.19% |
| Custom Index4,5 | 13.19% | 8.20% | 9.96% |
| Custom Balanced Index6 | 13.02% | 8.02% | 9.70% |
| 1 |
The Regulatory Index is provided as a broad measure of market performance. |
| 2 |
The S&P 1500 Index is an unmanaged index of 1500 stocks. |
| 3 |
The Lipper Balanced Index is an equally weighted index of the 30 largest U.S. Balanced Funds. |
| 4 |
The Performance Index is provided because the advisor believes it is more reflective of the fund’s investment strategy. The investment return and principal value of shares of the Fund fluctuate, so your shares, when sold, may be worth more or less than their original cost. |
| 5 |
The Custom Index is comprised of a 60% weighting in the S&P 1500 Index and a 40% weighting in the Bloomberg U.S. Intermediate Credit (1-10 Year) Index. |
| 6 |
The Custom Balanced Index is comprised of a 60% weighting in the S&P 1500 Index and a 40% weighting in the BofA Merrill Lynch 1-10 Year US Corporate & Government Index. Effective December 1, 2025 the Custom Index replaced the Custom Balanced Index as the primary benchmark. |
Key Fund Statistics
The following table outlines key fund statistic that you should pay attention to
| Fund net assets | $374 mil. |
| Total number of portfolio holdings | 451 |
| Total advisory fees paid (net) | $1.9 mil. |
| Portfolio turnover rate as of the end of the reporting period | 62% |
Graphical Representation of Holdings
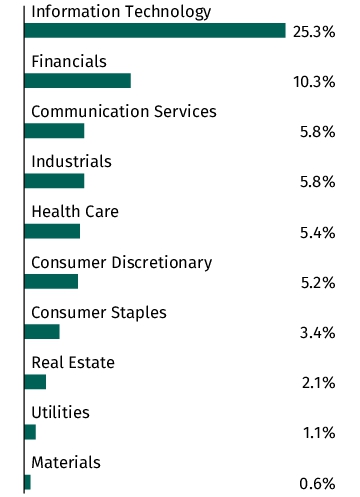
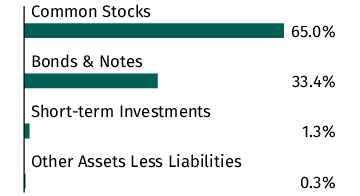
The tables below show the investment make up of the Fund, representing percentage of total net assets of the Fund. The Top Ten Holdings and Sector Allocation exclude short-term holdings, if any. The Sector Allocation chart represents Common Stocks of the Fund.
Top Ten Holdings
| NVIDIA Corporation | 5.6% |
| Apple, Inc. | 5.0% |
| Microsoft Corporation | 4.5% |
| Alphabet, Inc., Class A | 4.2% |
| Mastercard, Inc., Class A | 2.3% |
| Bank of America Corporation | 1.7% |
| Costco Wholesale Corporation | 1.6% |
| PNC Financial Services Group, Inc. (The) | 1.6% |
| TJX Companies, Inc. (The) | 1.5% |
| Broadcom, Inc. | 1.4% |
Sector Allocation
Asset Allocation
Top Ten Holdings
| NVIDIA Corporation | 5.6% |
| Apple, Inc. | 5.0% |
| Microsoft Corporation | 4.5% |
| Alphabet, Inc., Class A | 4.2% |
| Mastercard, Inc., Class A | 2.3% |
| Bank of America Corporation | 1.7% |
| Costco Wholesale Corporation | 1.6% |
| PNC Financial Services Group, Inc. (The) | 1.6% |
| TJX Companies, Inc. (The) | 1.5% |
| Broadcom, Inc. | 1.4% |
For information on the Green Century Funds®, call 1-800-93-GREEN. For information on how to open an account and account services, call 1-800-221-5519 8:00 am to 6:00 pm Eastern Time, Monday through Friday. For daily share price information twenty-four hours a day, visit www.greencentury.com.
What were the Fund costs for the last year?
(Based on a hypothetical $10,000 investment)
The below table explains the costs that you would have paid within the reporting period.
| Fund (Class) | Costs of a $10,000 investment | Costs paid as a percentage of a $10,000 investment |
| Green Century Equity Fund (Individual Investor Class/GCEQX) |
$130 | 1.20% |
Management’s Discussion of Fund Performance
How did the Fund perform last year? What affected the Fund’s performance?
The Investor share class of the Green Century Equity Fund returned 17.27%, for the one year period ended July 31, 2026. Over the same time period, the S&P 500 Index returned 19.56%. The strongest performing sectors in the Equity Fund were Communication Services, Health Care, and Real Estate which returned 70.25%, 25.03%, 19.96%, respectively. The worst performing sectors were Utilities, Consumer Discretionary, and Consumer Staples, which returned -1.40%, -0.69%, and +8.24% respectively, for the year. Within the S&P 500 Index, Energy, Health Care, and Information Technology were the strongest performing sectors, gaining 41.17%, 26.93%, and 26.22%, respectively. The worst performing sectors were Utilities, Consumer Discretionary, and Consumer Staples, which returned 6.41%, 7.52%, and 10.32%, respectively, for the year.
AI-INFRASTRUCTURE BOOM
U.S. technology and technology-enabled companies remained a primary driver of equity market returns over the trailing twelve months. Continued investment in artificial intelligence, data centers, semiconductors, and digital infrastructure supported strong earnings growth among many large-cap Technology and Communication Services companies, reinforcing the market leadership of innovation-oriented businesses.
ENERGY MARKET VOLATILITY
Energy markets experienced periods of heightened volatility as commodity prices responded to geopolitical developments, shifting supply expectations, and changing global demand trends. While traditional energy companies benefited from episodes of higher oil prices, investor attention increasingly focused on the long-term buildout of electric infrastructure, grid modernization, and energy efficiency solutions needed to support growing power demand from AI and electrification trends.
BROADENING MARKET LEADERSHIP
Unlike prior periods when returns were concentrated in a narrow group of mega-cap companies, market leadership broadened across several sectors during the year. Industrials, Financials, Health Care, and selected infrastructure-oriented businesses contributed more meaningfully to market performance as investors balanced enthusiasm for AI-driven growth with opportunities tied to economic resilience, capital investment, and improving corporate fundamentals.
Fund Performance
The following graph compares the initial and subsequent account values at the end of each of the most recently completed 10 fiscal years of the Fund. It assumes a $10,000 initial investment at the beginning of the first fiscal year in an appropriate broad-based securities market index for the same period.
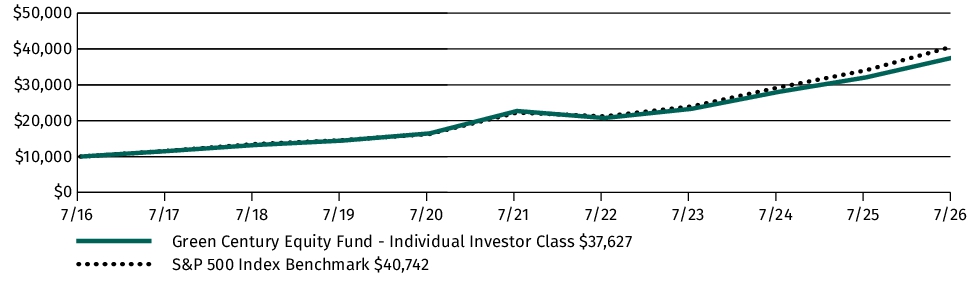
| AVERAGE ANNUAL TOTAL RETURN | 1 Year | 5 Years | 10 Years |
| Green Century Equity Fund (Individual Investor Class/GCEQX) | 17.27% | 10.63% | 14.17% |
| S&P 500 Index | 19.56% | 12.86% | 15.08% |
Key Fund Statistics
The following table outlines key fund statistic that you should pay attention to
| Fund net assets | $799 mil. |
| Total number of portfolio holdings | 336 |
| Total advisory fees paid (net) | $1.6 mil. |
| Portfolio turnover rate as of the end of the reporting period | 5% |
Graphical Representation of Holdings
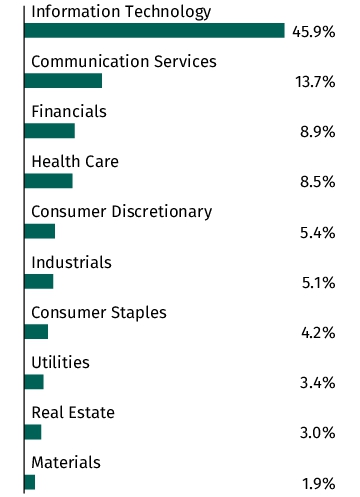
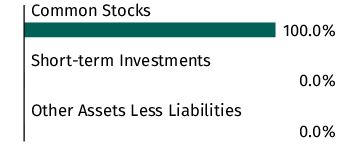
The tables below show the investment make up of the Fund, representing percentage of total net assets of the Fund. The Top Ten Holdings and Sector Allocation exclude short-term holdings, if any. The Sector Allocation chart represents Common Stocks of the Fund.
Top Ten Holdings
| NVIDIA Corporation | 15.1% |
| Microsoft Corporation | 10.6% |
| Alphabet, Inc., Class A | 6.7% |
| Alphabet, Inc., Class C | 5.4% |
| Tesla, Inc. | 2.9% |
| Advanced Micro Devices, Inc. | 2.5% |
| Visa, Inc., Class A | 2.0% |
| Mastercard, Inc., Class A | 1.5% |
| AbbVie, Inc. | 1.5% |
| Applied Materials, Inc. | 1.3% |
Sector Allocation
Asset Allocation
Top Ten Holdings
| NVIDIA Corporation | 15.1% |
| Microsoft Corporation | 10.6% |
| Alphabet, Inc., Class A | 6.7% |
| Alphabet, Inc., Class C | 5.4% |
| Tesla, Inc. | 2.9% |
| Advanced Micro Devices, Inc. | 2.5% |
| Visa, Inc., Class A | 2.0% |
| Mastercard, Inc., Class A | 1.5% |
| AbbVie, Inc. | 1.5% |
| Applied Materials, Inc. | 1.3% |
For information on the Green Century Funds®, call 1-800-93-GREEN. For information on how to open an account and account services, call 1-800-221-5519 8:00 am to 6:00 pm Eastern Time, Monday through Friday. For daily share price information twenty-four hours a day, visit www.greencentury.com.
What were the Fund costs for the last year?
(Based on a hypothetical $10,000 investment)
The below table explains the costs that you would have paid within the reporting period.
| Fund (Class) | Costs of a $10,000 investment | Costs paid as a percentage of a $10,000 investment |
| Green Century Equity Fund (Institutional Class/GCEUX) |
$98 | 0.90% |
Management’s Discussion of Fund Performance
How did the Fund perform last year? What affected the Fund’s performance?
The Institutional share class of the Green Century Equity Fund returned 17.62%, for the one year period ended July 31, 2026. Over the same time period, the S&P 500 Index returned 19.56%. The strongest performing sectors in the Equity Fund were Communication Services, Health Care, and Real Estate which returned 70.25%, 25.03%, 19.96%, respectively. The worst performing sectors were Utilities, Consumer Discretionary, and Consumer Staples, which returned -1.40%, -0.69%, and +8.24% respectively, for the year. Within the S&P 500 Index, Energy, Health Care, and Information Technology were the strongest performing sectors, gaining 41.17%, 26.93%, and 26.22%, respectively. The worst performing sectors were Utilities, Consumer Discretionary, and Consumer Staples, which returned 6.41%, 7.52%, and 10.32%, respectively, for the year.
AI-INFRASTRUCTURE BOOM
U.S. technology and technology-enabled companies remained a primary driver of equity market returns over the trailing twelve months. Continued investment in artificial intelligence, data centers, semiconductors, and digital infrastructure supported strong earnings growth among many large-cap Technology and Communication Services companies, reinforcing the market leadership of innovation-oriented businesses.
ENERGY MARKET VOLATILITY
Energy markets experienced periods of heightened volatility as commodity prices responded to geopolitical developments, shifting supply expectations, and changing global demand trends. While traditional energy companies benefited from episodes of higher oil prices, investor attention increasingly focused on the long-term buildout of electric infrastructure, grid modernization, and energy efficiency solutions needed to support growing power demand from AI and electrification trends.
BROADENING MARKET LEADERSHIP
Unlike prior periods when returns were concentrated in a narrow group of mega-cap companies, market leadership broadened across several sectors during the year. Industrials, Financials, Health Care, and selected infrastructure-oriented businesses contributed more meaningfully to market performance as investors balanced enthusiasm for AI-driven growth with opportunities tied to economic resilience, capital investment, and improving corporate fundamentals.
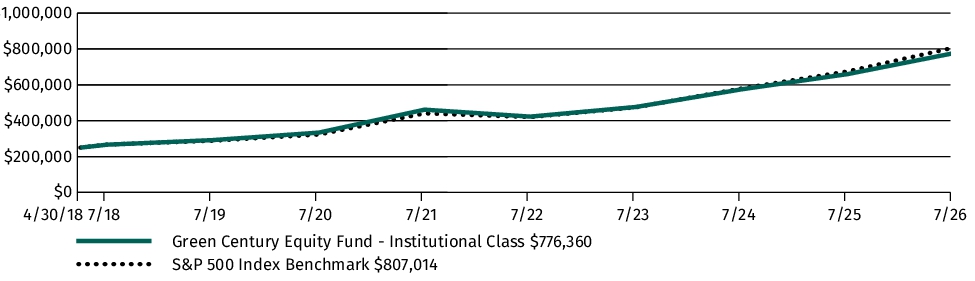
Fund Performance
The following graph compares the initial and subsequent account values at the end of each of the most recently completed 10 fiscal years of the Fund. It assumes a $250,000 initial investment at the beginning of the first fiscal year in an appropriate broad-based securities market index for the same period. The Institutional Share Class performance for periods prior to April 30, 2018 reflects the performance of the Fund’s Individual Investor Class.
| AVERAGE ANNUAL TOTAL RETURN | 1 Year | 5 Years | 10 Years |
| Green Century Equity Fund (Institutional Class/GCEUX) | 17.62% | 10.96% | 14.45% |
| S&P 500 Index | 19.56% | 12.86% | 15.08% |
Key Fund Statistics
The following table outlines key fund statistic that you should pay attention to
| Fund net assets | $799 mil. |
| Total number of portfolio holdings | 336 |
| Total advisory fees paid (net) | $1.6 mil. |
| Portfolio turnover rate as of the end of the reporting period | 5% |
Graphical Representation of Holdings
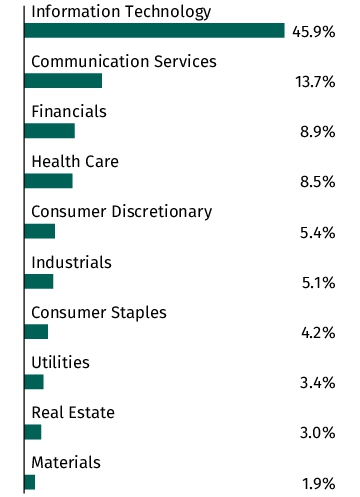
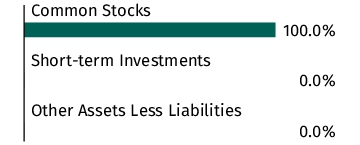
The tables below show the investment make up of the Fund, representing percentage of total net assets of the Fund. The Top Ten Holdings and Sector Allocation exclude short-term holdings, if any. The Sector Allocation chart represents Common Stocks of the Fund.
Top Ten Holdings
| NVIDIA Corporation | 15.1% |
| Microsoft Corporation | 10.6% |
| Alphabet, Inc., Class A | 6.7% |
| Alphabet, Inc., Class C | 5.4% |
| Tesla, Inc. | 2.9% |
| Advanced Micro Devices, Inc. | 2.5% |
| Visa, Inc., Class A | 2.0% |
| Mastercard, Inc., Class A | 1.5% |
| AbbVie, Inc. | 1.5% |
| Applied Materials, Inc. | 1.3% |
Sector Allocation
Asset Allocation
Top Ten Holdings
| NVIDIA Corporation | 15.1% |
| Microsoft Corporation | 10.6% |
| Alphabet, Inc., Class A | 6.7% |
| Alphabet, Inc., Class C | 5.4% |
| Tesla, Inc. | 2.9% |
| Advanced Micro Devices, Inc. | 2.5% |
| Visa, Inc., Class A | 2.0% |
| Mastercard, Inc., Class A | 1.5% |
| AbbVie, Inc. | 1.5% |
| Applied Materials, Inc. | 1.3% |
For information on the Green Century Funds®, call 1-800-93-GREEN. For information on how to open an account and account services, call 1-800-221-5519 8:00 am to 6:00 pm Eastern Time, Monday through Friday. For daily share price information twenty-four hours a day, visit www.greencentury.com.
What were the Fund costs for the last year?
(Based on a hypothetical $10,000 investment)
The below table explains the costs that you would have paid within the reporting period.
| Fund (Class) | Costs of a $10,000 investment | Costs paid as a percentage of a $10,000 investment |
| Green Century MSCI International Index Fund (Individual Investor Class/GCINX) |
$138 | 1.28% |
Management’s Discussion of Fund Performance
How did the Fund perform last year? What affected the Fund’s performance?
The Investor share class of the Green Century MSCI International Index Fund returned 15.12%, for the one year period ended July 31, 2026. Over the same time period, the MSCI World ex USA Index returned 25.00%. The strongest performing sectors in the International Fund were Information Technology, Financials, and Real Estate which returned 75.20%, 24.67%, and 15.65%, respectively. The worst performing sectors were Health Care, Consumer Discretionary, Communication Services, which returned -7.21%, -6.12%, and +1.75% respectively, for the year. Within the MSCI World ex USA Index, Energy, Information Technology, and Financials were the strongest performing sectors, gaining 46.05%, 40.34%, and 39.04%, respectively. The worst performing sectors were Communication Services, Real Estate, and Consumer Discretionary, which returned -3.36%, +9.65%, and +9.78%, respectively, for the year.
AI-INFRASTRUCTURE BOOM
U.S. technology and technology-enabled companies remained a primary driver of equity market returns over the trailing twelve months. Continued investment in artificial intelligence, data centers, semiconductors, and digital infrastructure supported strong earnings growth among many large-cap Technology and Communication Services companies, reinforcing the market leadership of innovation-oriented businesses.
ENERGY MARKET VOLATILITY
Energy markets experienced periods of heightened volatility as commodity prices responded to geopolitical developments, shifting supply expectations, and changing global demand trends. While traditional energy companies benefited from episodes of higher oil prices, investor attention increasingly focused on the long-term buildout of electric infrastructure, grid modernization, and energy efficiency solutions needed to support growing power demand from AI and electrification trends.
BROADENING MARKET LEADERSHIP
Unlike prior periods when returns were concentrated in a narrow group of mega-cap companies, market leadership broadened across several sectors during the year. Industrials, Financials, Health Care, and selected infrastructure-oriented businesses contributed more meaningfully to market performance as investors balanced enthusiasm for AI-driven growth with opportunities tied to economic resilience, capital investment, and improving corporate fundamentals.
Fund Performance
The following graph compares the initial and subsequent account values at the end of each of the most recently completed 10 fiscal years of the Fund. It assumes a $10,000 initial investment at the beginning of the first fiscal year in an appropriate broad-based securities market index for the same period.
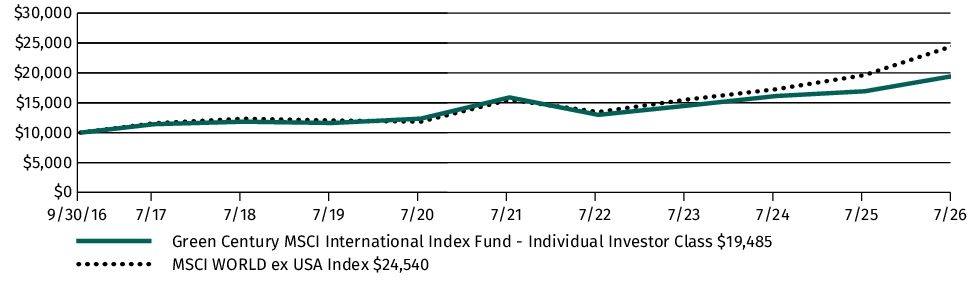
| AVERAGE ANNUAL TOTAL RETURN | 1 Year | 5 Years | Since Inception1 |
| Green Century MSCI International Index Fund (Individual Investor Class/GCINX) | 15.12% | 4.15% | 7.02% |
| MSCI World ex USA Index2 | 25.00% | 9.62% | 9.56% |
| 1 |
Inception Date September 30, 2016 |
| 2 |
The MSCI World EX USA Index is a custom index calculated by MSCI Inc. The index includes large and mid-cap stocks across 22 of 23 Developed Markets countries and excludes the United States |
Key Fund Statistics
The following table outlines key fund statistic that you should pay attention to
| Fund net assets | $174 mil. |
| Total number of portfolio holdings | 188 |
| Total advisory fee paid (net) | $478 k. |
| Portfolio turnover rate as of the end of the reporting period | 30% |
Graphical Representation of Holdings
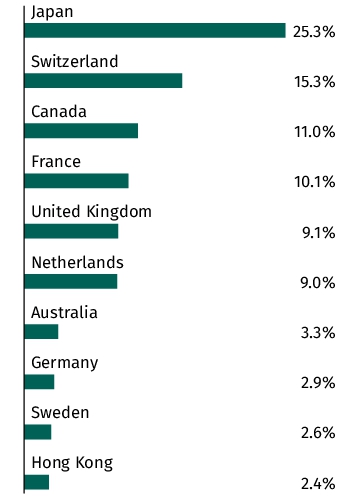
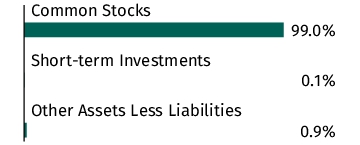
The tables below show the investment make up of the Fund, representing percentage of total net assets of the Fund. The Top Ten Holdings and Country Allocation exclude short-term holdings, if any. The Country Allocation chart represents Common Stocks of the Fund.
Top Ten Holdings
| ASML Holding NV | 5.3% |
| Novartis AG | 4.4% |
| Schneider Electric SE | 3.2% |
| ABB Ltd. | 2.7% |
| Sumitomo Mitsui Financial Group, Inc. | 2.5% |
| Unilever PLC | 2.4% |
| Tokyo Electron Ltd. | 2.4% |
| Hitachi Ltd. | 2.3% |
| Sony Group Corporation | 2.2% |
| Zurich Insurance Group AG | 2.0% |
Top Ten Country Allocation
Asset Allocation
Top Ten Holdings
| ASML Holding NV | 5.3% |
| Novartis AG | 4.4% |
| Schneider Electric SE | 3.2% |
| ABB Ltd. | 2.7% |
| Sumitomo Mitsui Financial Group, Inc. | 2.5% |
| Unilever PLC | 2.4% |
| Tokyo Electron Ltd. | 2.4% |
| Hitachi Ltd. | 2.3% |
| Sony Group Corporation | 2.2% |
| Zurich Insurance Group AG | 2.0% |
For information on the Green Century Funds®, call 1-800-93-GREEN. For information on how to open an account and account services, call 1-800-221-5519 8:00 am to 6:00 pm Eastern Time, Monday through Friday. For daily share price information twenty-four hours a day, visit www.greencentury.com.
What were the Fund costs for the last year?
(Based on a hypothetical $10,000 investment)
The below table explains the costs that you would have paid within the reporting period.
| Fund (Class) | Costs of a $10,000 investment | Costs paid as a percentage of a $10,000 investment |
| Green Century MSCI International Index Fund (Institutional Class/GCIFX) |
$106 | 0.98% |
Management’s Discussion of Fund Performance
How did the Fund perform last year? What affected the Fund’s performance?
The Institutional share class of the Green Century MSCI International Index Fund returned 15.47%, for the one year period ended July 31, 2026. Over the same time period, the MSCI World ex USA Index returned 25.00%. The strongest performing sectors in the International Fund were Information Technology, Financials, and Real Estate which returned 75.20%, 24.67%, and 15.65%, respectively. The worst performing sectors were Health Care, Consumer Discretionary, Communication Services, which returned -7.21%, -6.12%, and +1.75% respectively, for the year. Within the MSCI World ex USA Index, Energy, Information Technology, and Financials were the strongest performing sectors, gaining 46.05%, 40.34%, and 39.04%, respectively. The worst performing sectors were Communication Services, Real Estate, and Consumer Discretionary, which returned -3.36%, +9.65%, and +9.78%, respectively, for the year.
AI-INFRASTRUCTURE BOOM
U.S. technology and technology-enabled companies remained a primary driver of equity market returns over the trailing twelve months. Continued investment in artificial intelligence, data centers, semiconductors, and digital infrastructure supported strong earnings growth among many large-cap Technology and Communication Services companies, reinforcing the market leadership of innovation-oriented businesses.
ENERGY MARKET VOLATILITY
Energy markets experienced periods of heightened volatility as commodity prices responded to geopolitical developments, shifting supply expectations, and changing global demand trends. While traditional energy companies benefited from episodes of higher oil prices, investor attention increasingly focused on the long-term buildout of electric infrastructure, grid modernization, and energy efficiency solutions needed to support growing power demand from AI and electrification trends.
BROADENING MARKET LEADERSHIP
Unlike prior periods when returns were concentrated in a narrow group of mega-cap companies, market leadership broadened across several sectors during the year. Industrials, Financials, Health Care, and selected infrastructure-oriented businesses contributed more meaningfully to market performance as investors balanced enthusiasm for AI-driven growth with opportunities tied to economic resilience, capital investment, and improving corporate fundamentals.
Fund Performance
The following graph compares the initial and subsequent account values at the end of each of the most recently completed 10 fiscal years of the Fund. It assumes a $250,000 initial investment at the beginning of the first fiscal year in an appropriate broad-based securities market index for the same period.
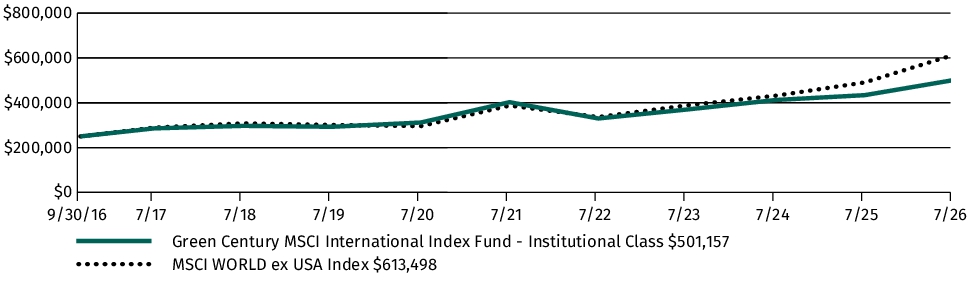
| AVERAGE ANNUAL TOTAL RETURN | 1 Year | 5 Years | Since Inception1 |
| Green Century MSCI International Index Fund (Institutional Class/GCIFX) | 15.47% | 4.48% | 7.33% |
| MSCI World ex USA Index2 | 25.00% | 9.62% | 9.56% |
| 1 |
Inception Date September 30, 2016 |
| 2 |
The MSCI World EX USA Index is a custom index calculated by MSCI Inc. The index includes large and mid-cap stocks across 22 of 23 Developed Markets countries and excludes the United States |
Key Fund Statistics
The following table outlines key fund statistic that you should pay attention to
| Fund net assets | $174 mil. |
| Total number of portfolio holdings | 188 |
| Total advisory fee paid (net) | $478 k. |
| Portfolio turnover rate as of the end of the reporting period | 30% |
Graphical Representation of Holdings
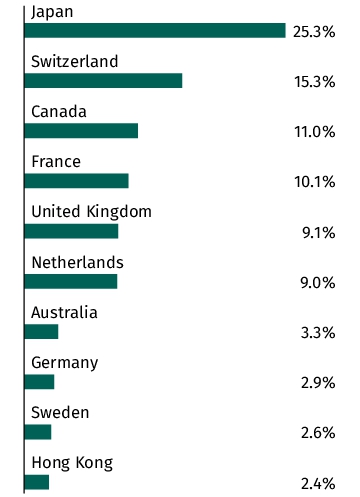
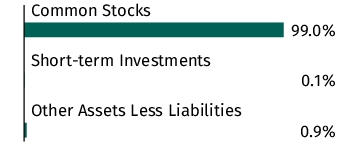
The tables below show the investment make up of the Fund, representing percentage of total net assets of the Fund. The Top Ten Holdings and Country Allocation exclude short-term holdings, if any. The Country Allocation chart represents Common Stocks of the Fund.
Top Ten Holdings
| ASML Holding NV | 5.3% |
| Novartis AG | 4.4% |
| Schneider Electric SE | 3.2% |
| ABB Ltd. | 2.7% |
| Sumitomo Mitsui Financial Group, Inc. | 2.5% |
| Unilever PLC | 2.4% |
| Tokyo Electron Ltd. | 2.4% |
| Hitachi Ltd. | 2.3% |
| Sony Group Corporation | 2.2% |
| Zurich Insurance Group AG | 2.0% |
Top Ten Country Allocation
Asset Allocation
Top Ten Holdings
| ASML Holding NV | 5.3% |
| Novartis AG | 4.4% |
| Schneider Electric SE | 3.2% |
| ABB Ltd. | 2.7% |
| Sumitomo Mitsui Financial Group, Inc. | 2.5% |
| Unilever PLC | 2.4% |
| Tokyo Electron Ltd. | 2.4% |
| Hitachi Ltd. | 2.3% |
| Sony Group Corporation | 2.2% |
| Zurich Insurance Group AG | 2.0% |