What were the Fund costs for the period?
(based on a hypothetical $10,000 investment)
|
Fund
Name |
Costs
of a $10,000 investment |
Costs
paid as a percentage of a $10,000 investment* |
|---|---|---|
|
VistaShares
Target 15 ACKtivist Distribution ETF |
$86 |
0.96% |
| * | Costs paid as a percentage of investment are annualized. |
How did the Fund perform during the period ended July 31, 2026?
The VistaShares Target 15™ ACKtivist Distribution ETF (“ACKY” or the “Fund”) commenced operations on September 8, 2025. The discussion that follows covers the period from that date through July 31, 2026, which represents the Fund’s first fiscal period and is shorter than a full fiscal year. Over that period the Fund pursued its primary objective of current income while holding a concentrated portfolio of equity securities constructed to reflect the publicly disclosed positions of a well known activist investment manager. The Fund paid distributions monthly from the first full month of operations in a manner consistent with its stated annual income target of 15% of net asset value. Results reflected the concentrated nature of the underlying portfolio, premium income produced by the Fund’s options strategy, and the effect of that strategy on participation in advancing markets. Because the portfolio holds a small number of positions at significant weights, individual holdings had a proportionally larger influence on results than would be the case in a broadly diversified fund.
What factors influenced the Fund's performance?
Concentration in a focused equity portfolio. The Fund’s equity sleeve consists of a small number of positions held at substantial weights, spanning large capitalization technology and internet businesses, consumer facing franchises, real estate and alternative asset management. This structure means that Fund results were shaped principally by developments at individual companies rather than by broad market movement. Several positions carried double digit portfolio weights during the period, and changes in the market’s view of those specific businesses were the dominant influence on the equity component of return. Concentration of this kind increases both the potential contribution and the potential detraction from any single holding.
Activist catalysts and company specific developments. The reference portfolio is built around positions in which an activist manager has taken a public stake, and such positions frequently carry identifiable catalysts, including operational restructuring, capital allocation changes, governance actions and corporate transactions. Progress or delay on those catalysts, rather than sector level trends, was a principal driver of individual position performance during the period. Positions where operating improvement became evident generally contributed more consistently than those where the market awaited further evidence.
Income generation through the options strategy. Premium collected through the Fund’s options strategy was the principal source of distributions during the period. The concentrated, event driven character of the underlying portfolio generally supported implied volatility levels above those of the broad market, which was constructive for premium capture. That same characteristic required attentive management of strike selection, expiration and coverage levels, since sharp single stock moves can both increase premium and limit upside participation. In periods when individual holdings advanced beyond written strikes, participation in those advances was limited by the design of the strategy.
Portfolio construction, disclosure timing and distribution policy. The Adviser maintained the equity portfolio in accordance with a rules based methodology tied to publicly disclosed position data. Because such data is reported on a lagged basis, the portfolio reflects positions as of the most recent available reporting date rather than positions held in real time, and this timing difference can affect results in periods when the underlying manager changes positioning. Periodic reconstitution and rebalancing were used to refresh exposures and to manage position level concentration. Distributions were paid monthly in accordance with the Fund’s income objective. To the extent distributions exceeded net investment income and net realized gains, they constituted a return of capital, which reduces a shareholder’s cost basis. Shareholders should refer to the Financial Highlights and the notes to the financial statements for the character of distributions paid.
Cumulative Performance
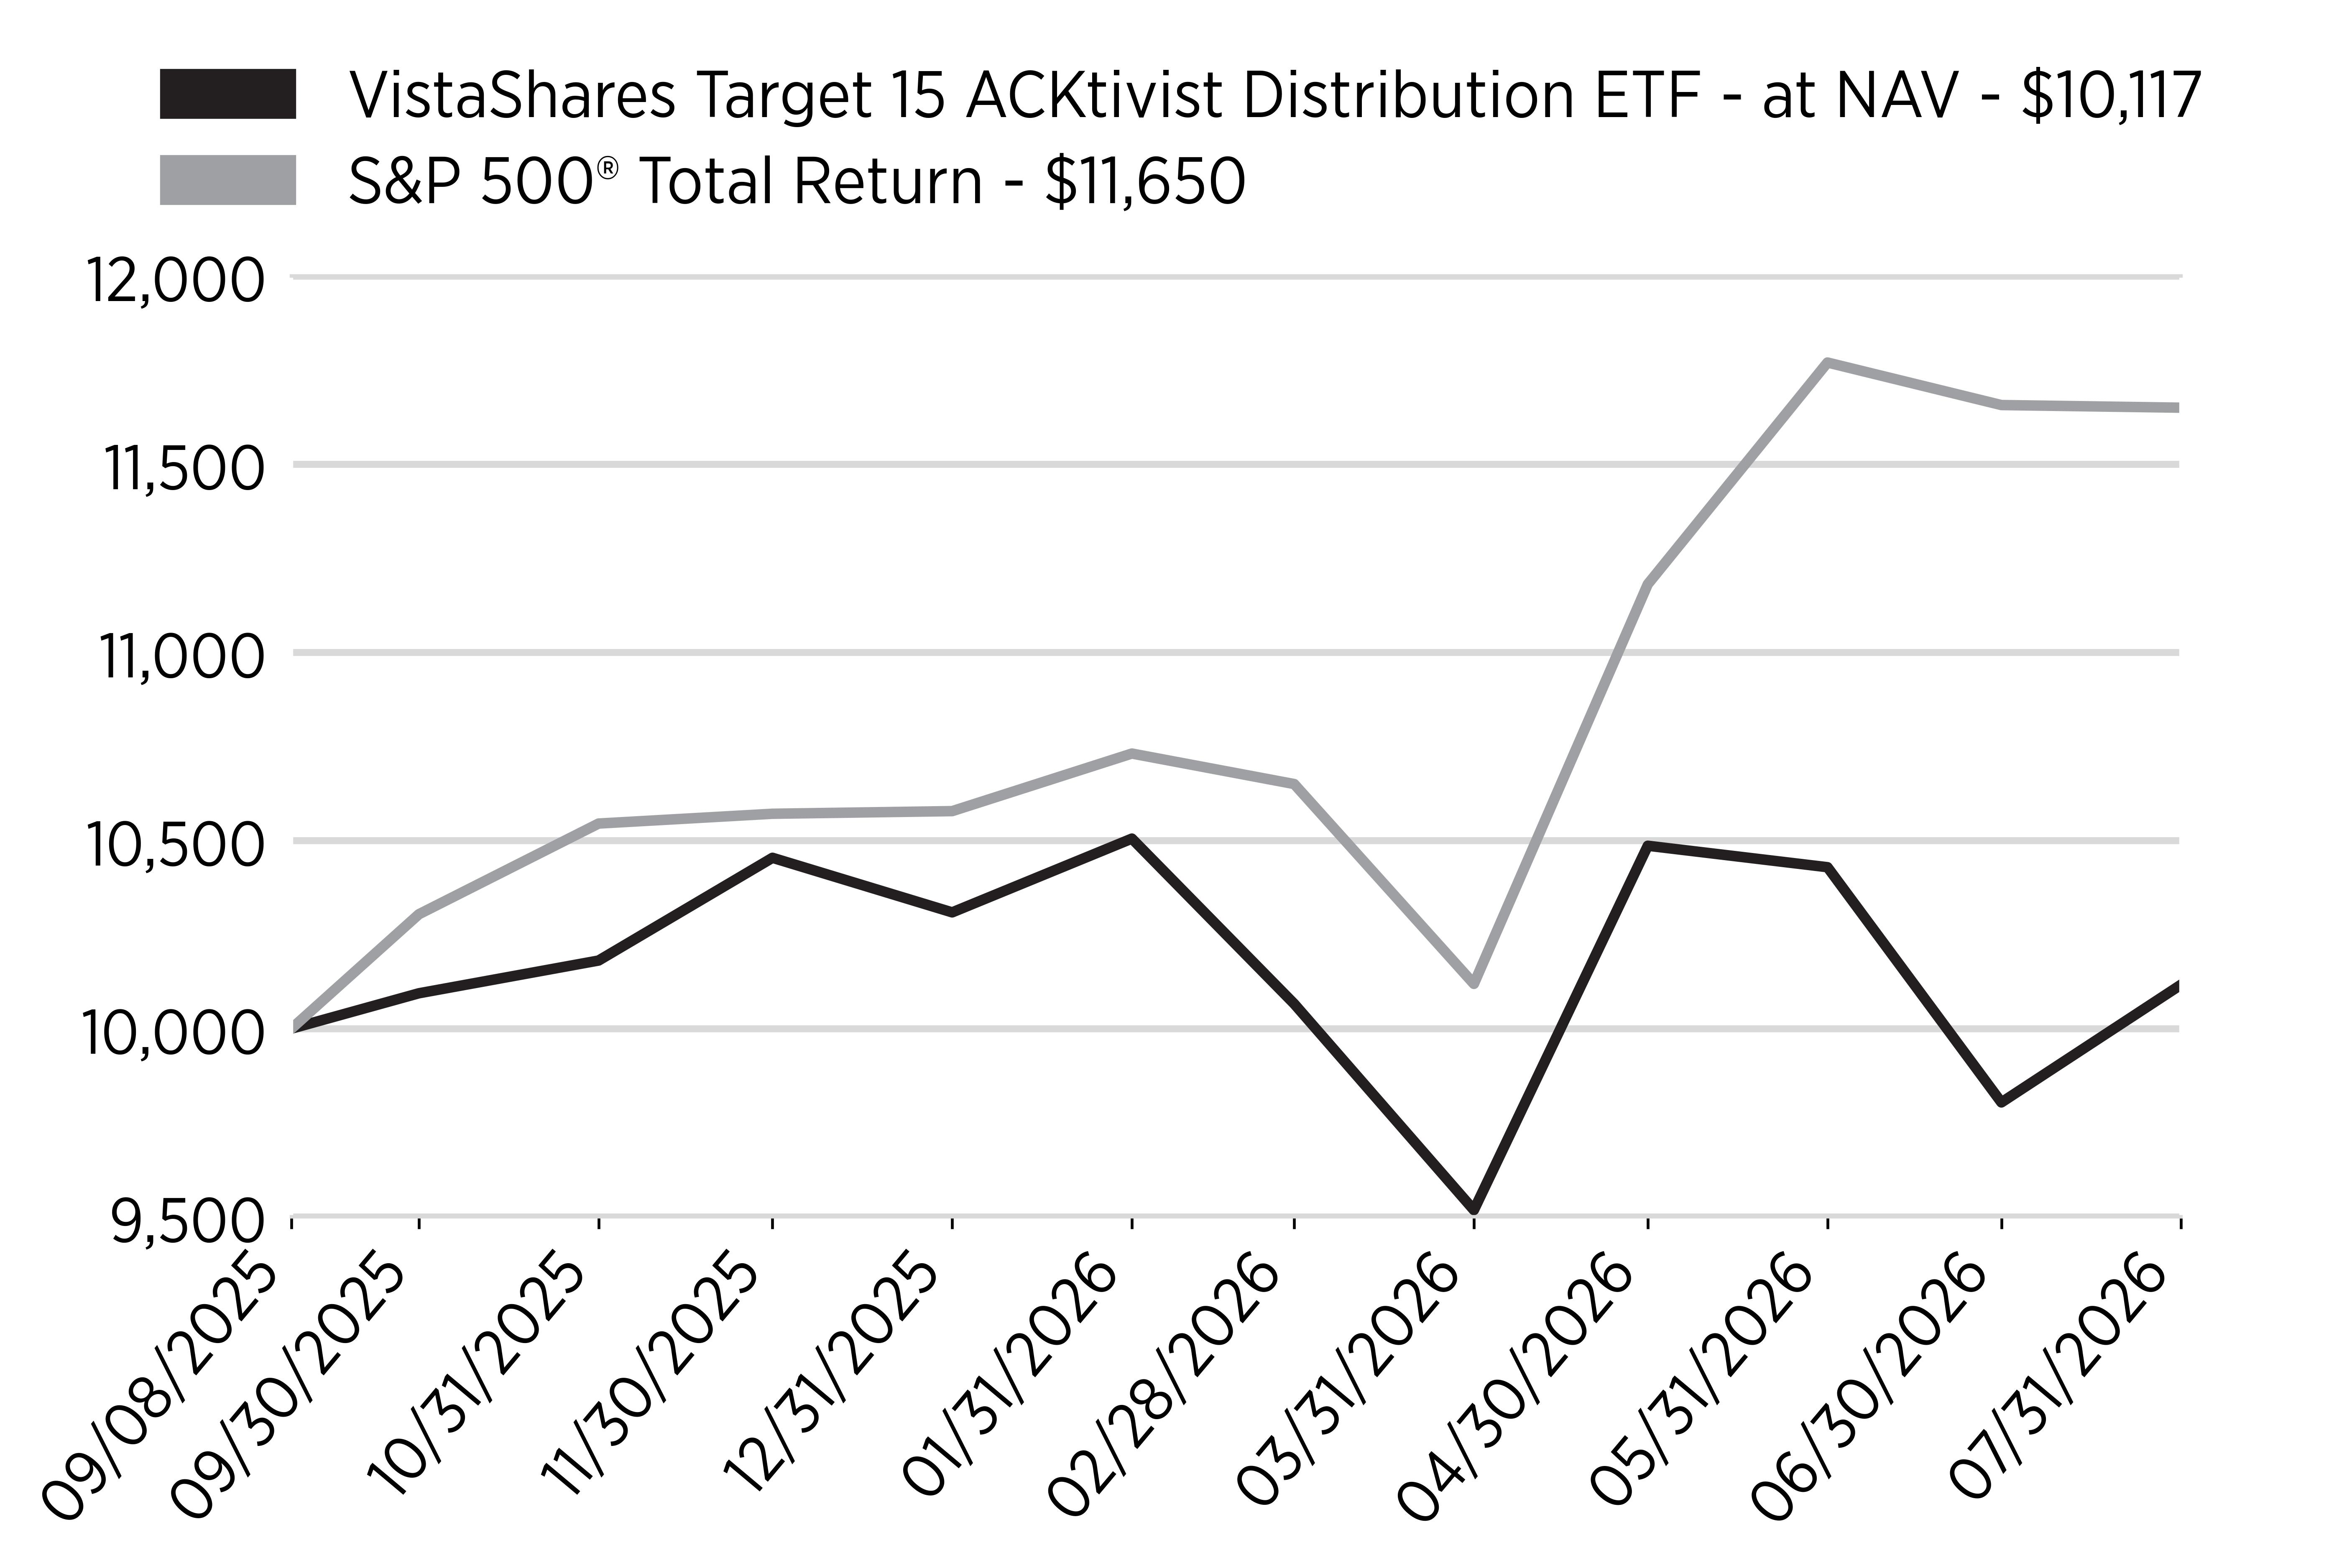
Annual Performance
|
|
Since
Inception
(9/8/2025) |
|---|---|
|
VistaShares
Target 15 ACKtivist
Distribution
ETF - at NAV |
1.16% |
|
S&P
500® Total Return |
16.50% |
Key Fund Statistics
(as of July 31, 2026)
|
Fund
Size (Thousands) |
$44,947 |
|
Number
of Holdings |
43 |
|
Total
Advisory Fee |
$372,873 |
|
Portfolio
Turnover Rate |
360% |
What did the Fund invest in?
(as of July 31, 2026)
Sector Breakdown
(% of Total Net Assets)
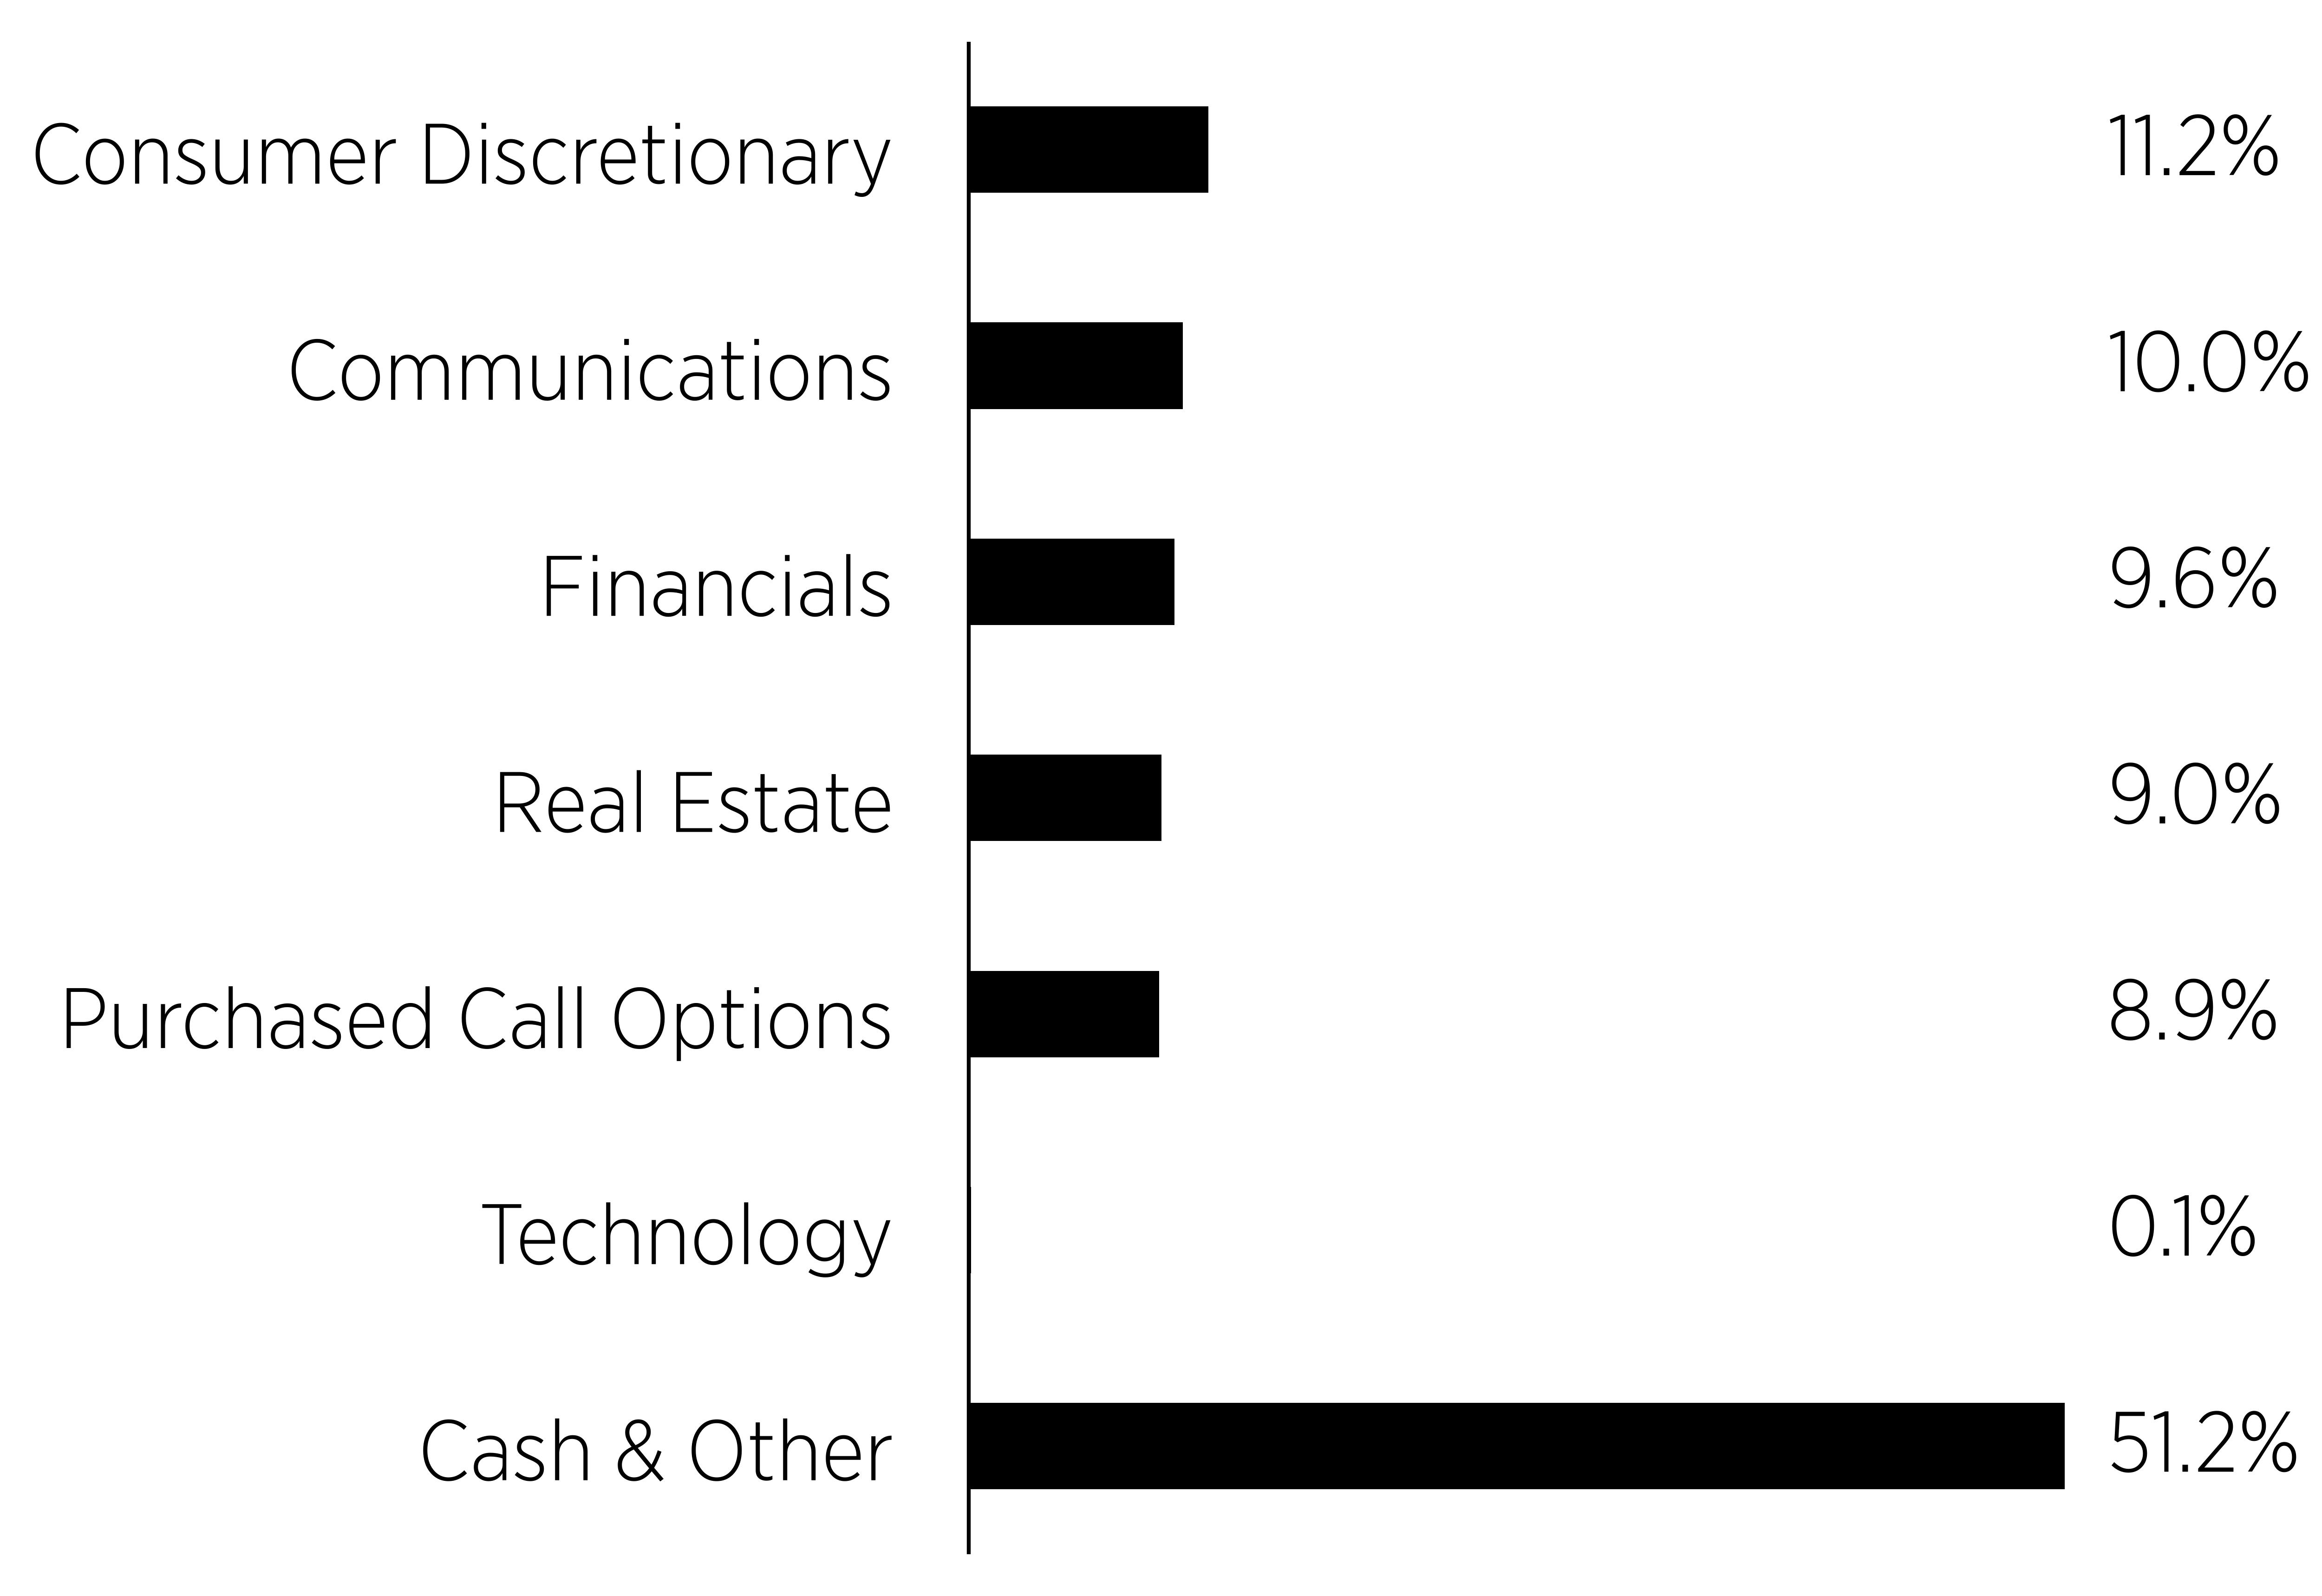
|
Top
Ten Holdings |
(%
of Total Net Assets) |
|---|---|
|
Restaurant
Brands International, Inc. |
|
|
Pershing
Square USA Ltd. |
|
|
Meta
Platforms, Inc. - Class A |
|
|
Howard
Hughes Holdings, Inc. |
|
|
Amazon.com,
Inc., Purchased Call Option, Expiration: 8/21/2026; Exercise Price: $230.00 |
|
|
Microsoft
Corp., Purchased Call Option, Expiration: 8/21/2026; Exercise Price: $390.00 |
|
|
Microsoft
Corp., Purchased Call Option, Expiration: 8/21/2026; Exercise Price: $435.00 |
|
|
Uber
Technologies, Inc., Purchased Call Option, Expiration: 8/21/2026; Exercise Price: $67.50 |
|
|
Seaport
Entertainment Group, Inc. |
|
|
Brookfield
Corp., Purchased Call Option, Expiration: 8/21/2026; Exercise Price: $42.00 |
What were the Fund costs for the period?
(based on a hypothetical $10,000 investment)
|
Fund
Name |
Costs
of a $10,000 investment |
Costs
paid as a percentage of a $10,000 investment* |
|---|---|---|
|
VistaShares
Target 15 Berkshire Select Income ETF |
$42 |
0.95% |
| * | Costs paid as a percentage of investment are annualized. |
How did the Fund perform during the period ended July 31, 2026?
During the fiscal year ended July 31, 2026, the VistaShares Target 15™ Berkshire Select Income ETF (“OMAH” or the “Fund”) pursued its primary objective of current income while maintaining equity exposure to a portfolio constructed to reflect the largest publicly disclosed equity holdings of Berkshire Hathaway Inc., together with direct exposure to Berkshire Hathaway Class B shares. The Fund paid distributions monthly throughout the period in a manner consistent with its stated annual income target of 15% of net asset value. The Fund’s total return reflected three components working together: appreciation and depreciation within the underlying equity portfolio, premium income generated by the Fund’s options strategy, and the effect of that options strategy on participation in advancing markets. Consistent with the design of the strategy, upside participation was moderated in periods when individual holdings advanced sharply, while option premium supported the income stream and provided a partial cushion during weaker windows. The Fund’s market price generally tracked net asset value over the period, and the Fund maintained its monthly distribution schedule without interruption.
What factors influenced the Fund's performance?
Composition of the underlying equity portfolio. The Fund’s equity sleeve is concentrated in large capitalization U.S. businesses with established earnings power and long operating histories, spanning financial services, consumer staples, energy, technology and health care services, alongside a direct position in Berkshire Hathaway itself. Results over the period were driven more by company level fundamentals within this comparatively narrow group than by broad market direction. The portfolio’s orientation toward cash generative, valuation sensitive businesses meant that Fund returns did not move in step with the more growth led segments of the market, and dispersion among the underlying positions was a meaningful influence on results.
Market environment and rate expectations. Shifts in interest rate expectations, the trajectory of corporate earnings and changes in risk appetite influenced the broader equity market during the fiscal year. Holdings weighted toward durable franchises with comparatively stable cash flows generally showed less sensitivity to sentiment driven rotations than the market as a whole. Energy and financial positions responded to commodity price movements and to the shape of the yield curve, while consumer staples exposure contributed relative stability during more volatile stretches.
Income generation through the options strategy. The Fund employs a data driven options strategy written against its equity positions and against Berkshire Hathaway Class B shares. Option premium collected across the fiscal year was the principal source of the Fund’s distributions. The premium available varied with implied volatility, which in turn reflected both market wide conditions and single stock events among the underlying holdings. Periods of elevated volatility improved premium capture, while quieter periods called for more active management of strike selection and expiration in order to maintain the income profile. The strategy is calibrated to balance income generation against retained upside participation, and in months when underlying holdings advanced beyond written strikes that participation was limited by design.
Portfolio construction, rebalancing and distribution policy. The Adviser maintained the equity portfolio in accordance with its rules based methodology, with periodic reconstitution to reflect changes in the publicly disclosed holdings the portfolio is designed to track. Because those holdings are disclosed on a lagged basis, the portfolio reflects positions as of the most recent available reporting date rather than positions held in real time. Rebalancing was used to manage position level concentration and to refresh exposures as the reference portfolio evolved. Distributions were paid monthly in accordance with the Fund’s income objective. To the extent distributions exceeded net investment income and net realized gains, they constituted a return of capital, which reduces a shareholder’s cost basis. Shareholders should refer to the Financial Highlights and the notes to the financial statements for the character of distributions paid.
Cumulative Performance
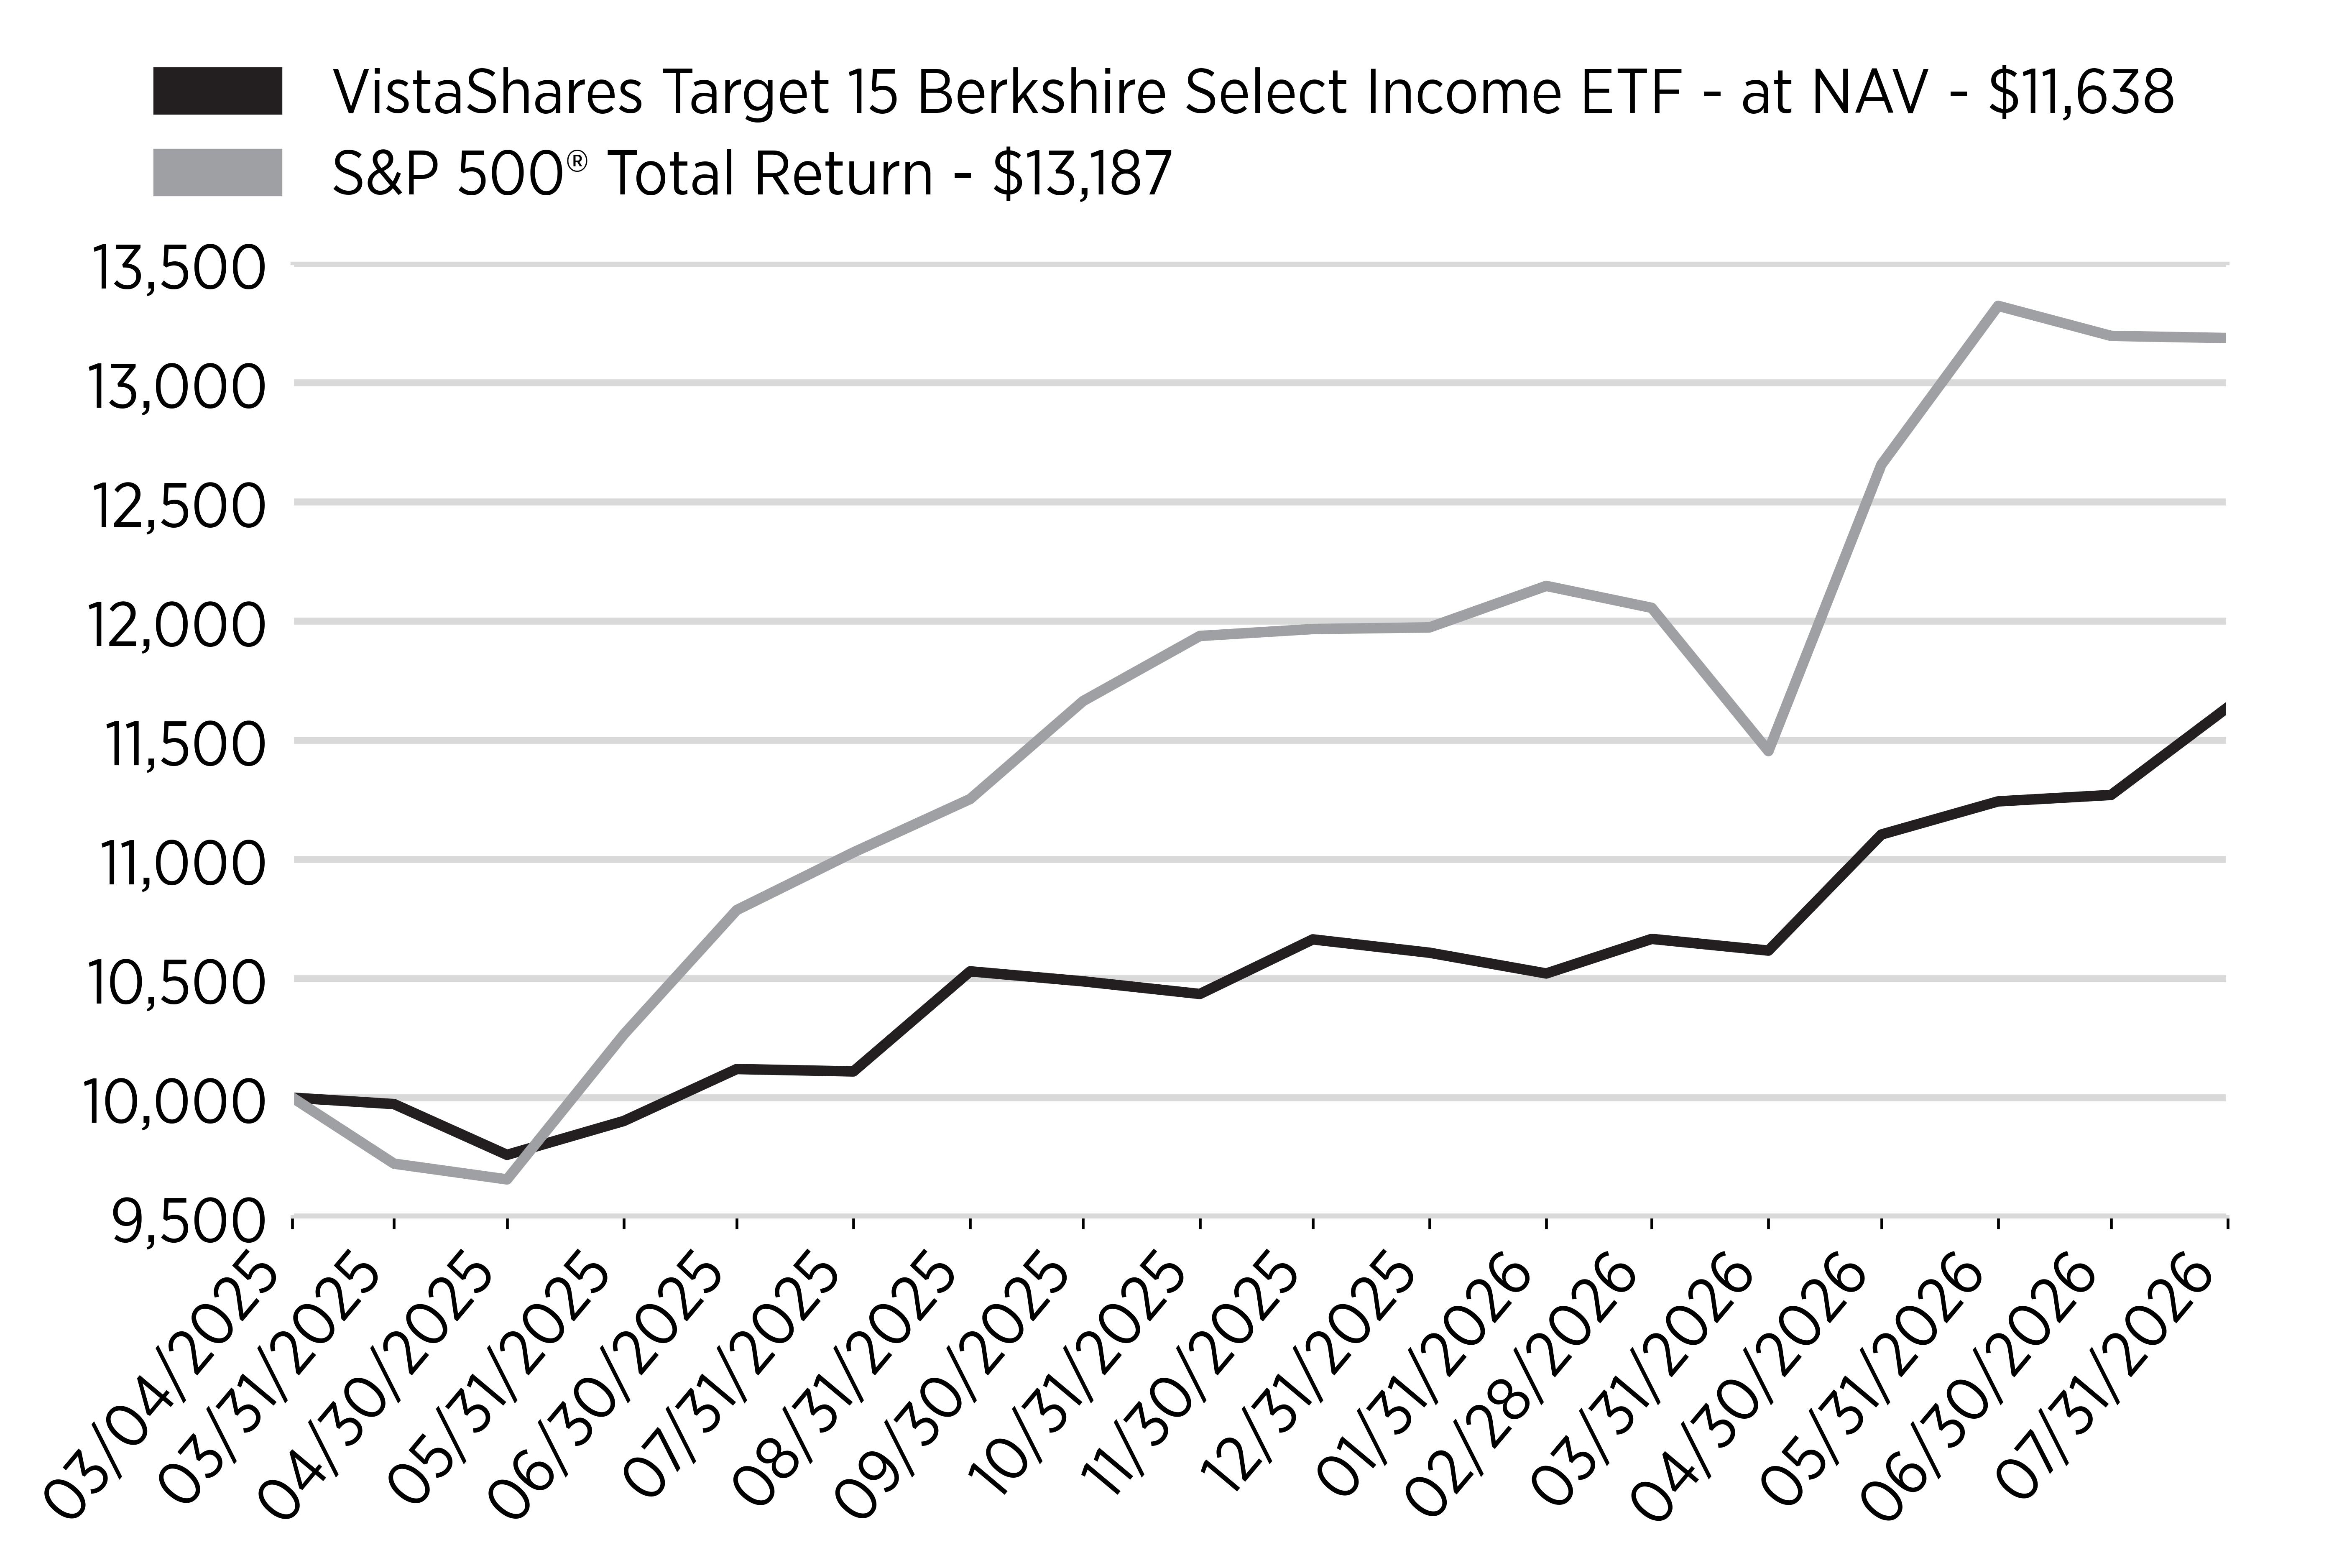
Annual Performance
|
|
1
Year |
Since
Inception
(3/4/2025) |
|---|---|---|
|
VistaShares
Target 15 Berkshire
Select
Income ETF - at NAV |
8.91% |
11.38% |
|
S&P
500® Total Return |
19.56% |
21.71% |
Key Fund Statistics
(as of July 31, 2026)
|
Fund
Size (Thousands) |
$990,104 |
|
Number
of Holdings |
76 |
|
Total
Advisory Fee |
$3,140,789 |
|
Portfolio
Turnover Rate |
22% |
What did the Fund invest in?
(as of July 31, 2026)
Sector Breakdown
(% of Total Net Assets)
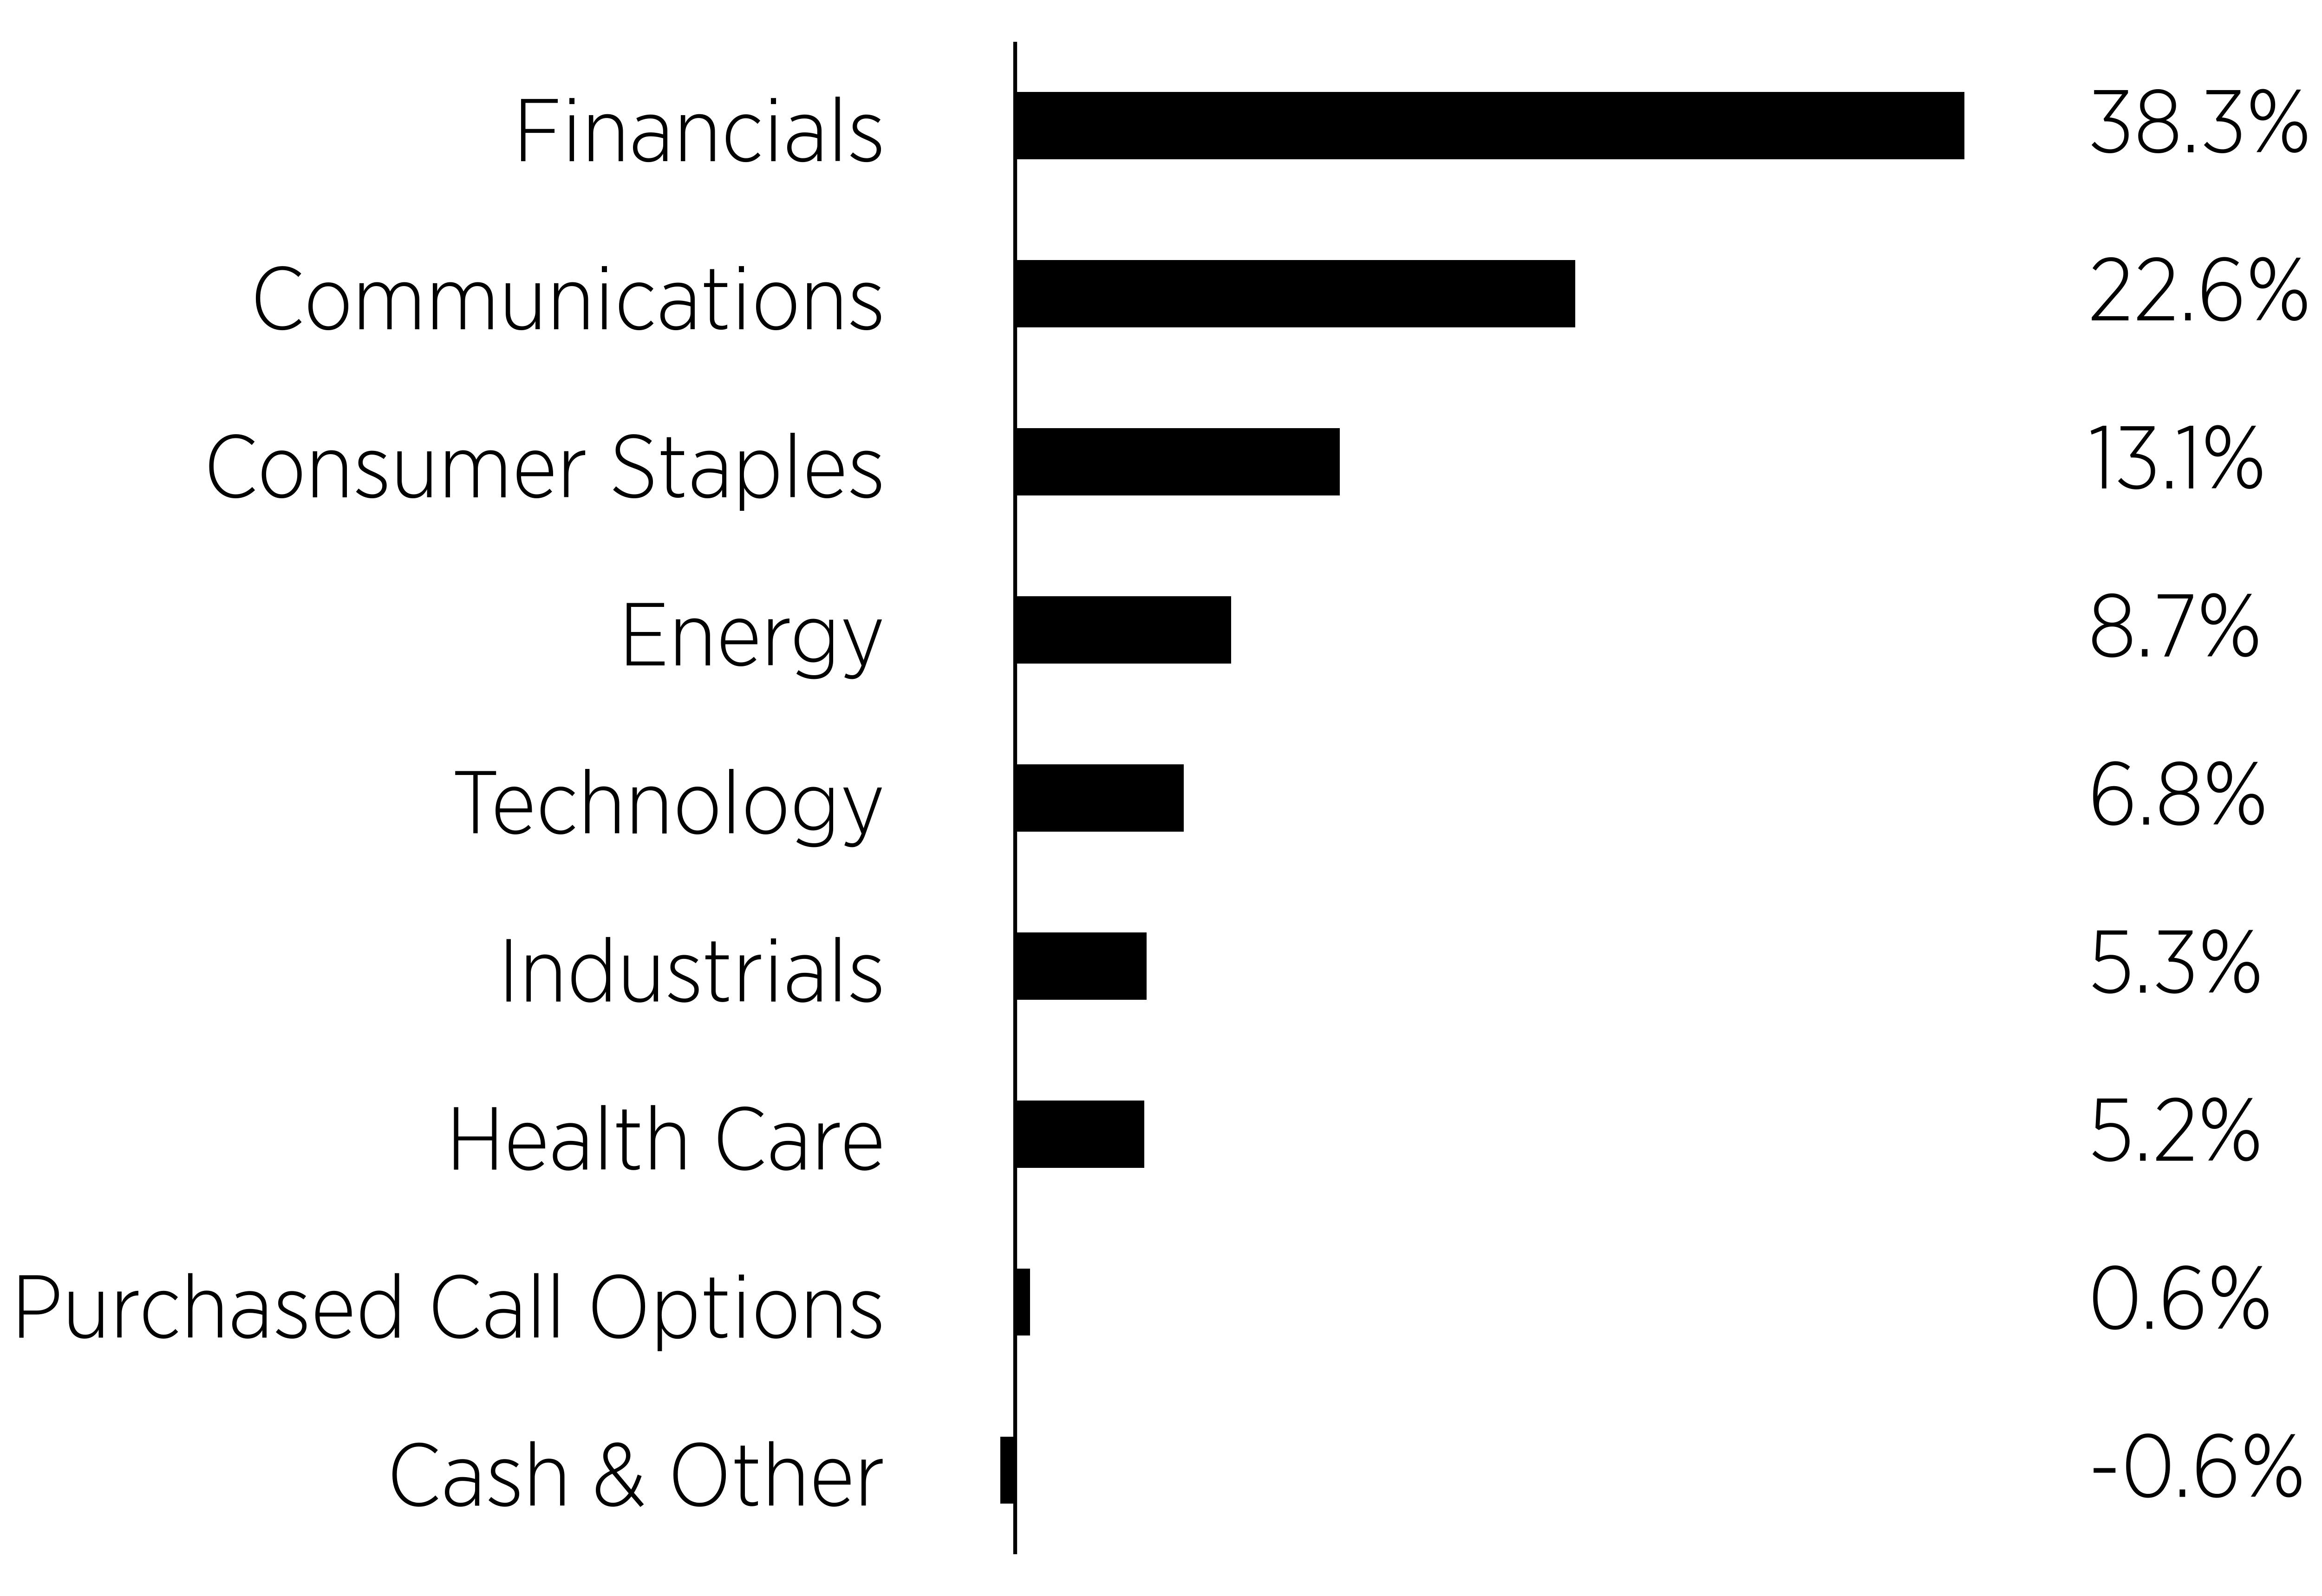
|
Top
Ten Holdings |
(%
of Total
Net
Assets) |
|---|---|
|
Berkshire
Hathaway, Inc. - Class B |
|
|
Apple,
Inc. |
|
|
American
Express Co. |
|
|
Delta
Air Lines, Inc. |
|
|
DaVita,
Inc. |
|
|
Bank
of America Corp. |
|
|
Sirius
XM Holdings, Inc. |
|
|
Chubb
Ltd. |
|
|
Coca-Cola
Co. |
|
|
Kraft
Heinz Co. |
What were the Fund costs for the period?
(based on a hypothetical $10,000 investment)
|
Fund
Name |
Costs
of a $10,000 investment |
Costs
paid as a percentage of a $10,000 investment* |
|---|---|---|
|
VistaShares
Target 15 DRUKMacro Distribution ETF |
$82 |
0.95% |
| * | Costs paid as a percentage of investment are annualized. |
How did the Fund perform during the period ended July 31, 2026?
The VistaShares Target 15™ DRUKMacro Distribution ETF (“DRKY” or the “Fund”) commenced operations on October 7, 2025. The discussion that follows covers the period from that date through July 31, 2026, which represents the Fund’s first fiscal period and is shorter than a full fiscal year. Over that period the Fund pursued its primary objective of current income while holding a portfolio of equity securities constructed to reflect the publicly disclosed positions of a macro oriented family office. The Fund paid distributions monthly from the first full month of operations in a manner consistent with its stated annual income target of 15% of net asset value. Results reflected the concentrated and thematically distinctive composition of the underlying portfolio, premium income produced by the Fund’s options strategy, and the effect of that strategy on participation in advancing markets. The portfolio’s substantial weighting in health care and semiconductors meant that Fund results were tied more closely to developments within those areas than to the direction of the broad equity market.
What factors influenced the Fund's performance?
Health care and life sciences exposure. Health care represented the largest sector weighting in the portfolio during the period, including significant positions in diagnostics and biopharmaceutical companies. Holdings in this area are driven by clinical, regulatory and adoption milestones rather than by general economic conditions, and they carry higher security level volatility than the broad market. Progress on test volumes, reimbursement, trial results and product launches was the dominant influence on this portion of the portfolio, and given the size of the weighting, movement in a small number of names had a pronounced effect on Fund results in both directions.
Semiconductor and global macro positioning. The portfolio also carried meaningful exposure to semiconductor manufacturers and to companies domiciled outside the United States, reflecting the macro orientation of the reference portfolio. Semiconductor holdings responded to capacity utilization, pricing and demand associated with artificial intelligence and industrial end markets. International positions introduced currency and country specific factors, including local policy and commodity price developments, that would not have influenced a portfolio limited to domestic large capitalization equities.
Income generation through the options strategy. Premium collected through the Fund’s options strategy was the principal source of distributions during the period. The elevated volatility characteristic of the underlying holdings, particularly within health care and semiconductors, generally supported premium levels above those available on lower volatility portfolios. That same volatility required careful management of strike selection, expiration and coverage, because sharp moves in a small number of large positions can meaningfully affect both premium capture and retained upside. In periods when holdings advanced beyond written strikes, participation in those advances was limited by the design of the strategy.
Portfolio construction, disclosure timing and distribution policy. The Adviser maintained the equity portfolio in accordance with a rules based methodology tied to publicly disclosed position data. Because such data is reported on a lagged basis, the portfolio reflects positions as of the most recent available reporting date rather than positions held in real time, and this timing difference can affect results in periods when the underlying manager changes positioning. Periodic reconstitution and rebalancing were used to refresh exposures and to manage the concentration that arises when individual positions appreciate materially. Distributions were paid monthly in accordance with the Fund’s income objective. To the extent distributions exceeded net investment income and net realized gains, they constituted a return of capital, which reduces a shareholder’s cost basis. Shareholders should refer to the Financial Highlights and the notes to the financial statements for the character of distributions paid.
Cumulative Performance
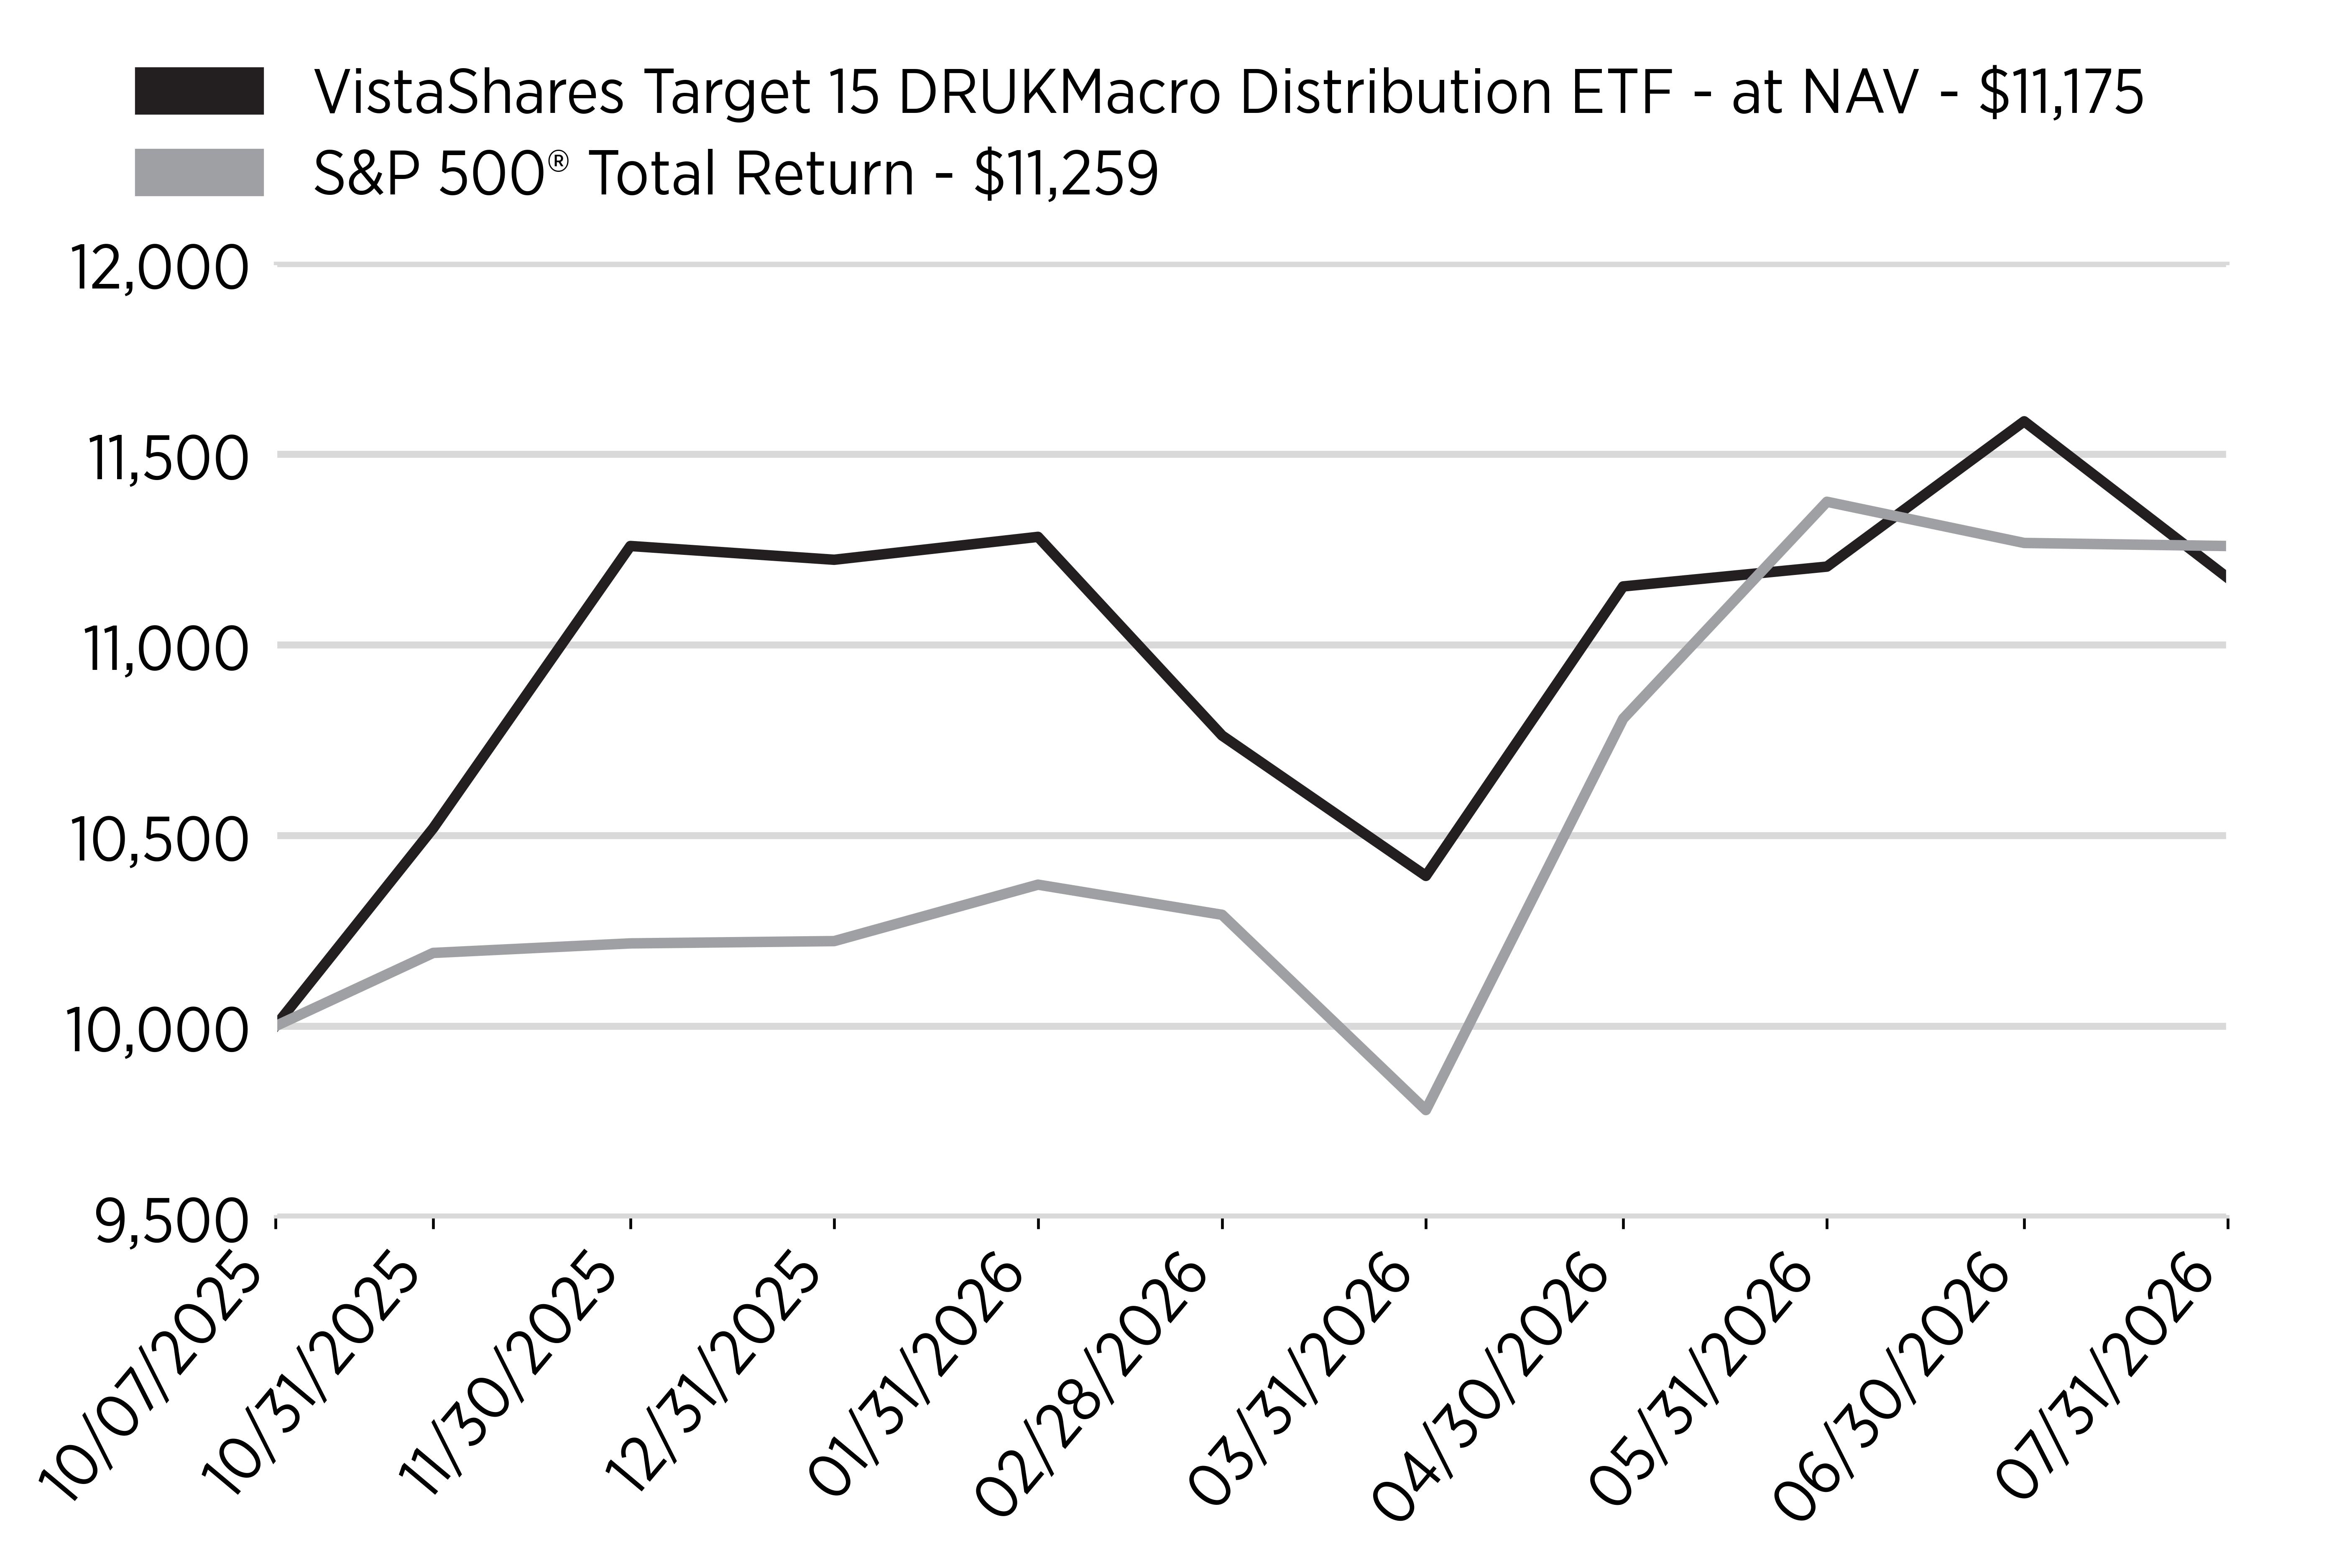
Annual Performance
|
|
Since
Inception
(10/7/2025) |
|---|---|
|
VistaShares
Target 15 DRUKMacro
Distribution
ETF - at NAV |
11.74% |
|
S&P
500® Total Return |
12.59% |
Key Fund Statistics
(as of July 31, 2026)
|
Fund
Size (Thousands) |
$16,757 |
|
Number
of Holdings |
81 |
|
Total
Advisory Fee |
$103,324 |
|
Portfolio
Turnover Rate |
239% |
What did the Fund invest in?
(as of July 31, 2026)
Sector Breakdown
(% of Total Net Assets)
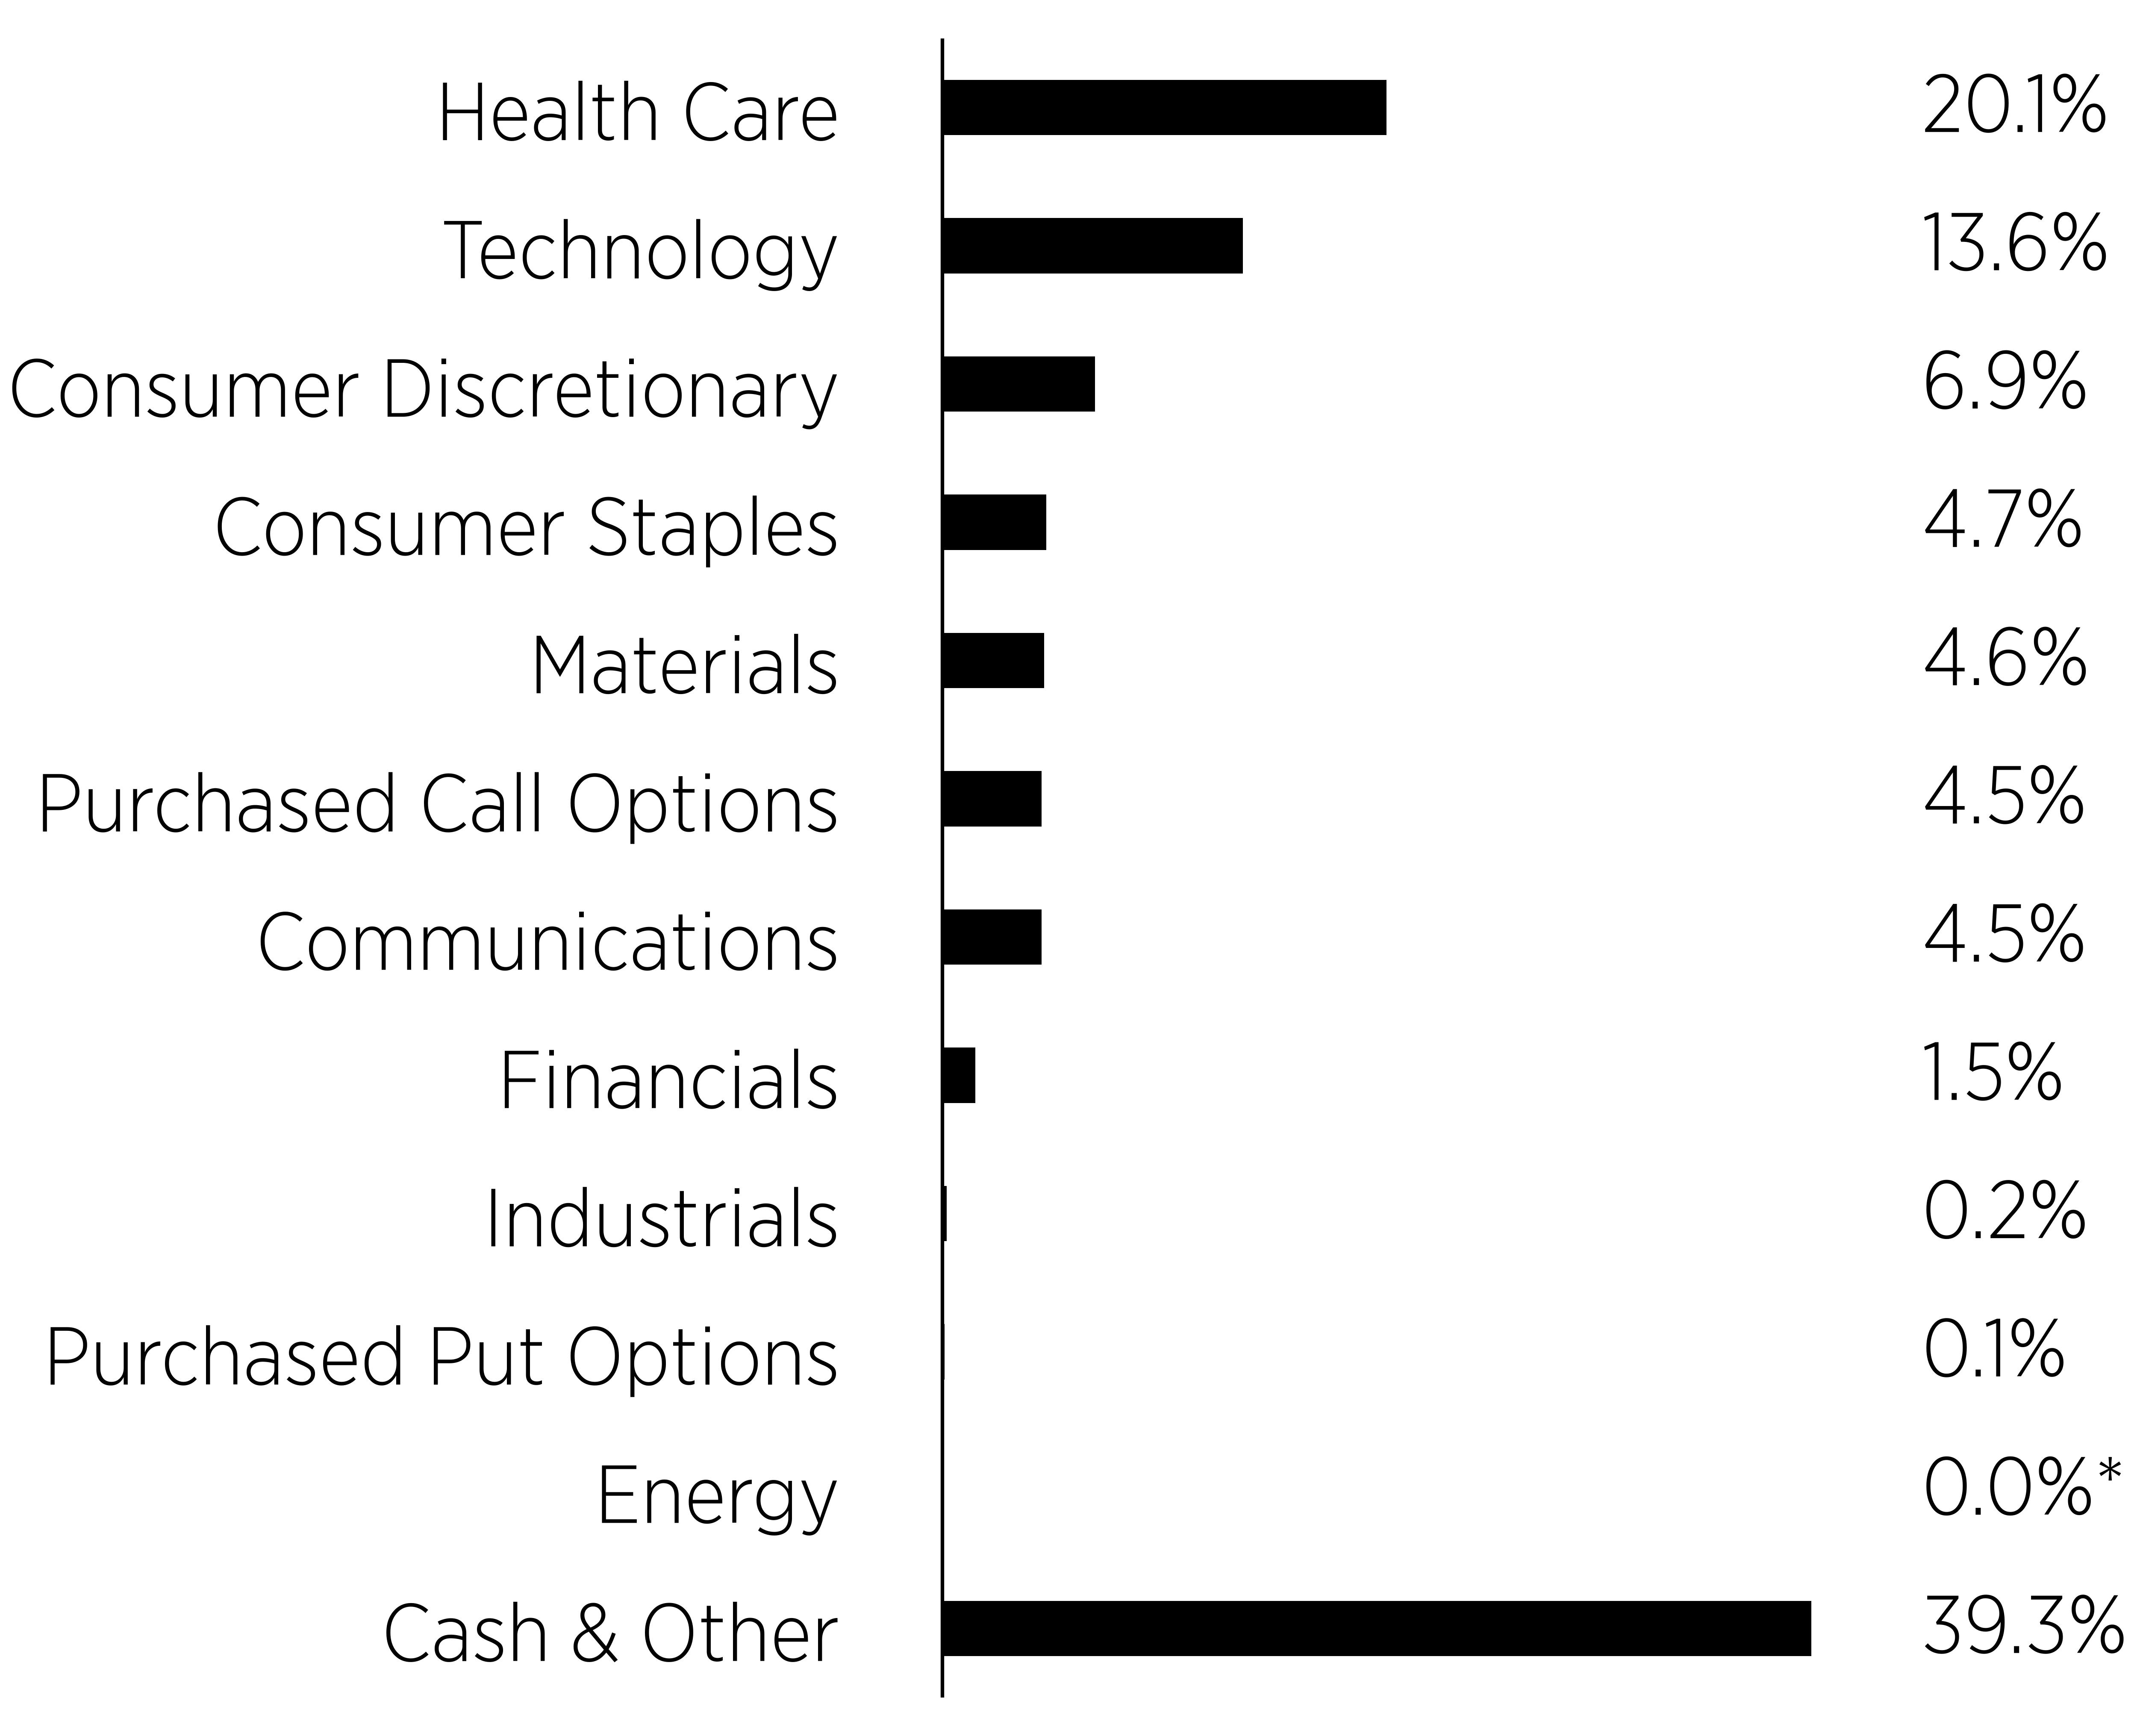
| * | Does not round to 0.1 |
|
Top
Ten Holdings |
(%
of Total
Net
Assets) |
|---|---|
|
Insmed,
Inc. |
|
|
Taiwan
Semiconductor Manufacturing
Co.
Ltd., ADR |
|
|
BBB
Foods, Inc. - Class A |
|
|
Roku,
Inc. - Class A |
|
|
Teva
Pharmaceutical Industries Ltd., ADR |
|
|
NewAmsterdam
Pharma Co. N.V. |
|
|
STMicroelectronics
NV |
|
|
Option
Care Health, Inc. |
|
|
Broadcom,
Inc. |
|
|
Coupang,
Inc. - Class A |
What were the Fund costs for the period?
(based on a hypothetical $10,000 investment)
|
Fund
Name |
Costs
of a $10,000 investment |
Costs
paid as a percentage of a $10,000 investment* |
|---|---|---|
|
VistaShares
Target 15 USA Quality Income ETF |
$41 |
0.95% |
| * | Costs paid as a percentage of investment are annualized. |
How did the Fund perform during the period ended July 31, 2026?
During the fiscal year ended July 31, 2026, the VistaShares Target 15™ USA Quality Income ETF (“QUSA” or the “Fund”) pursued its primary objective of current income while holding a diversified portfolio of U.S. companies selected for quality characteristics, defined principally by high profitability, low variability of earnings and conservative balance sheet leverage. The Fund paid distributions monthly throughout the period in a manner consistent with its stated annual income target of 15% of net asset value. Results over the fiscal year reflected the interaction of three elements: total return within the underlying equity portfolio, premium income produced by the Fund’s options strategy, and the moderating effect of that strategy on participation in rising markets. The quality orientation of the equity portfolio proved supportive of the income objective, as companies with steadier earnings profiles generally exhibited more predictable option pricing behavior across the period. The Fund’s market price generally tracked net asset value, and the monthly distribution schedule was maintained without interruption.
What factors influenced the Fund's performance?
Quality screening and its effect on portfolio behavior. The Fund’s equity portfolio is constructed around measurable quality attributes rather than around sector themes or momentum. Companies that clear those screens tend to carry higher returns on capital, less cyclical earnings and lower financial leverage than the broad market. Over the fiscal year this profile influenced returns in two ways. It reduced the Fund’s participation in the most speculative areas of the market, and it produced an underlying portfolio whose drawdowns were generally shallower than those of higher beta segments during periods of market stress.
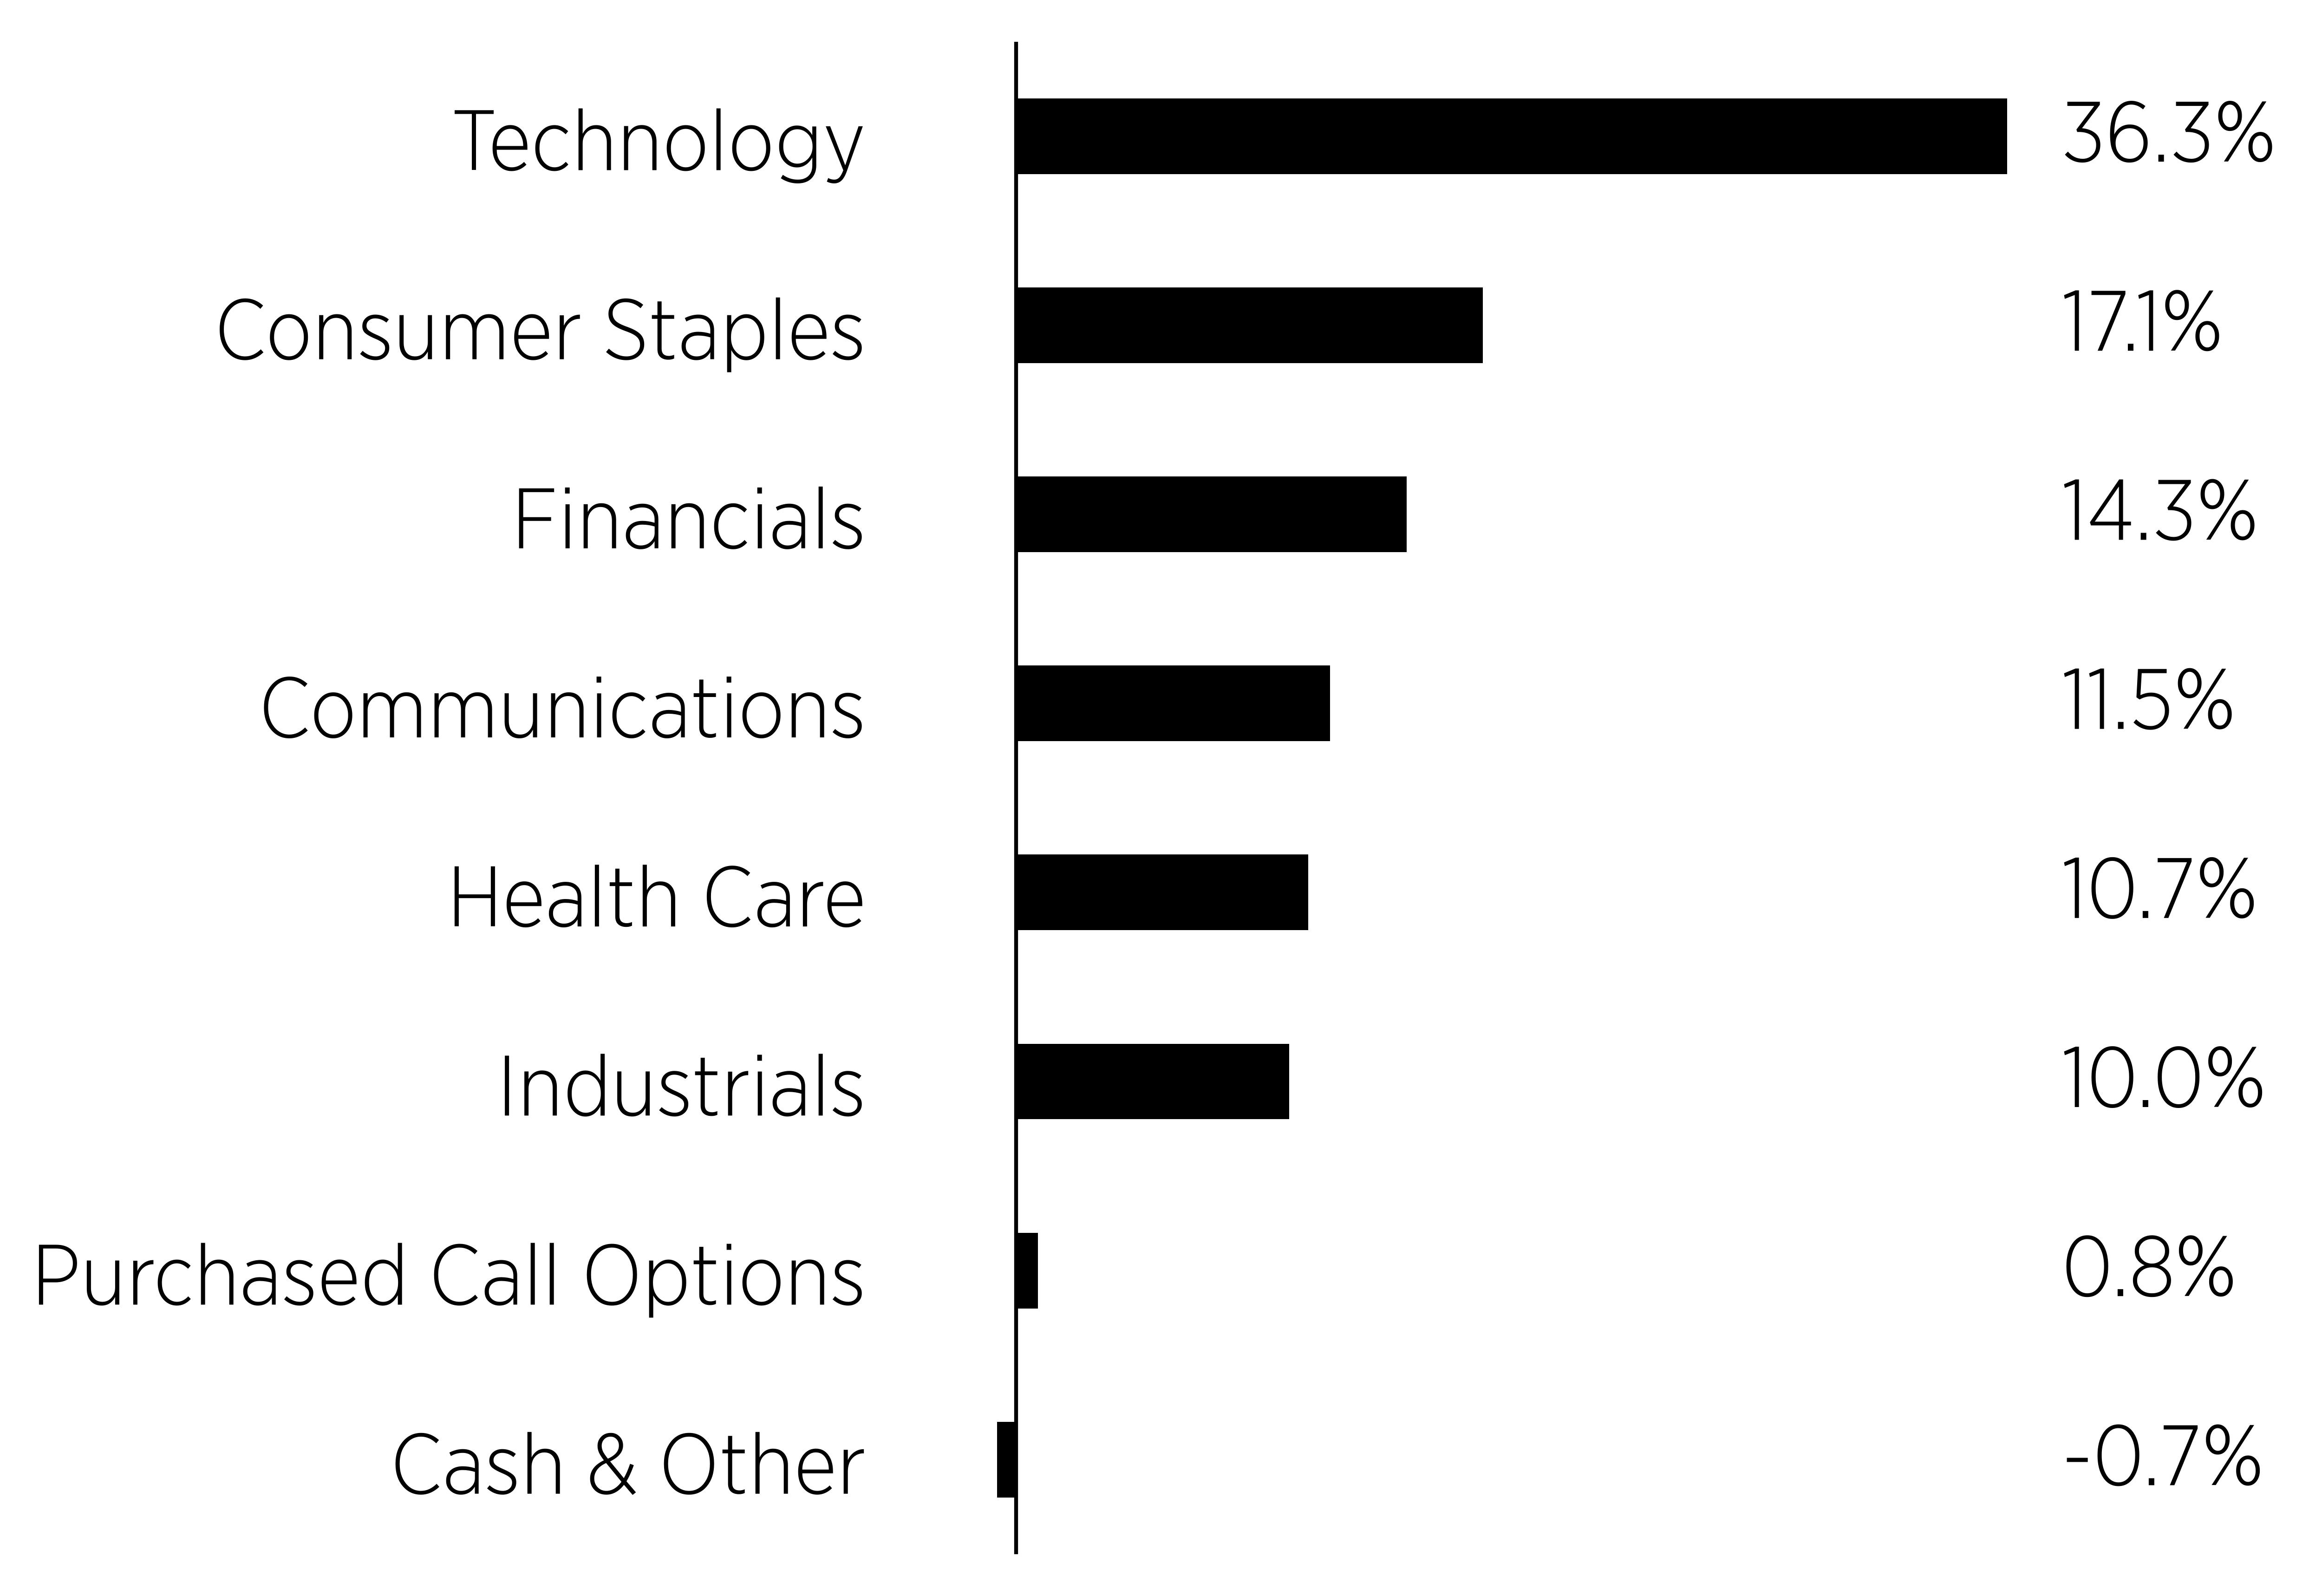
Sector composition and dispersion. Portfolio weights were concentrated in industrials, financials and consumer staples, with meaningful positions in large capitalization technology. Industrial holdings responded to capital spending trends and to order and backlog conditions across their end markets. Financial holdings were influenced by the shape of the yield curve and by credit conditions. Consumer staples positions contributed comparative stability. Dispersion among these groups, rather than broad market direction, accounted for much of the difference in contribution across the portfolio.
Income generation through the options strategy. Premium collected through the Fund’s options strategy was the principal source of distributions during the fiscal year. Because the Fund’s underlying holdings are screened for earnings stability, implied volatility across those names was generally lower than for the broad market, which required disciplined management of strike selection, expiration and position level coverage in order to meet the income objective. Elevated volatility around earnings events and macroeconomic releases improved premium capture during those windows. In months when holdings advanced beyond written strikes, upside participation was limited by the design of the strategy.
Portfolio construction, rebalancing and distribution policy. The Adviser maintained a diversified, rules based portfolio spanning approximately ninety positions, which limited single name concentration and reduced the influence of any individual holding on Fund results. Periodic rebalancing was used to restore target weights, to reflect changes in the quality screens as company fundamentals evolved, and to keep the portfolio aligned with the Fund’s investment objective. Distributions were paid monthly in accordance with the Fund’s income objective. To the extent distributions exceeded net investment income and net realized gains, they constituted a return of capital, which reduces a shareholder’s cost basis. Shareholders should refer to the Financial Highlights and the notes to the financial statements for the character of distributions paid.
Cumulative Performance
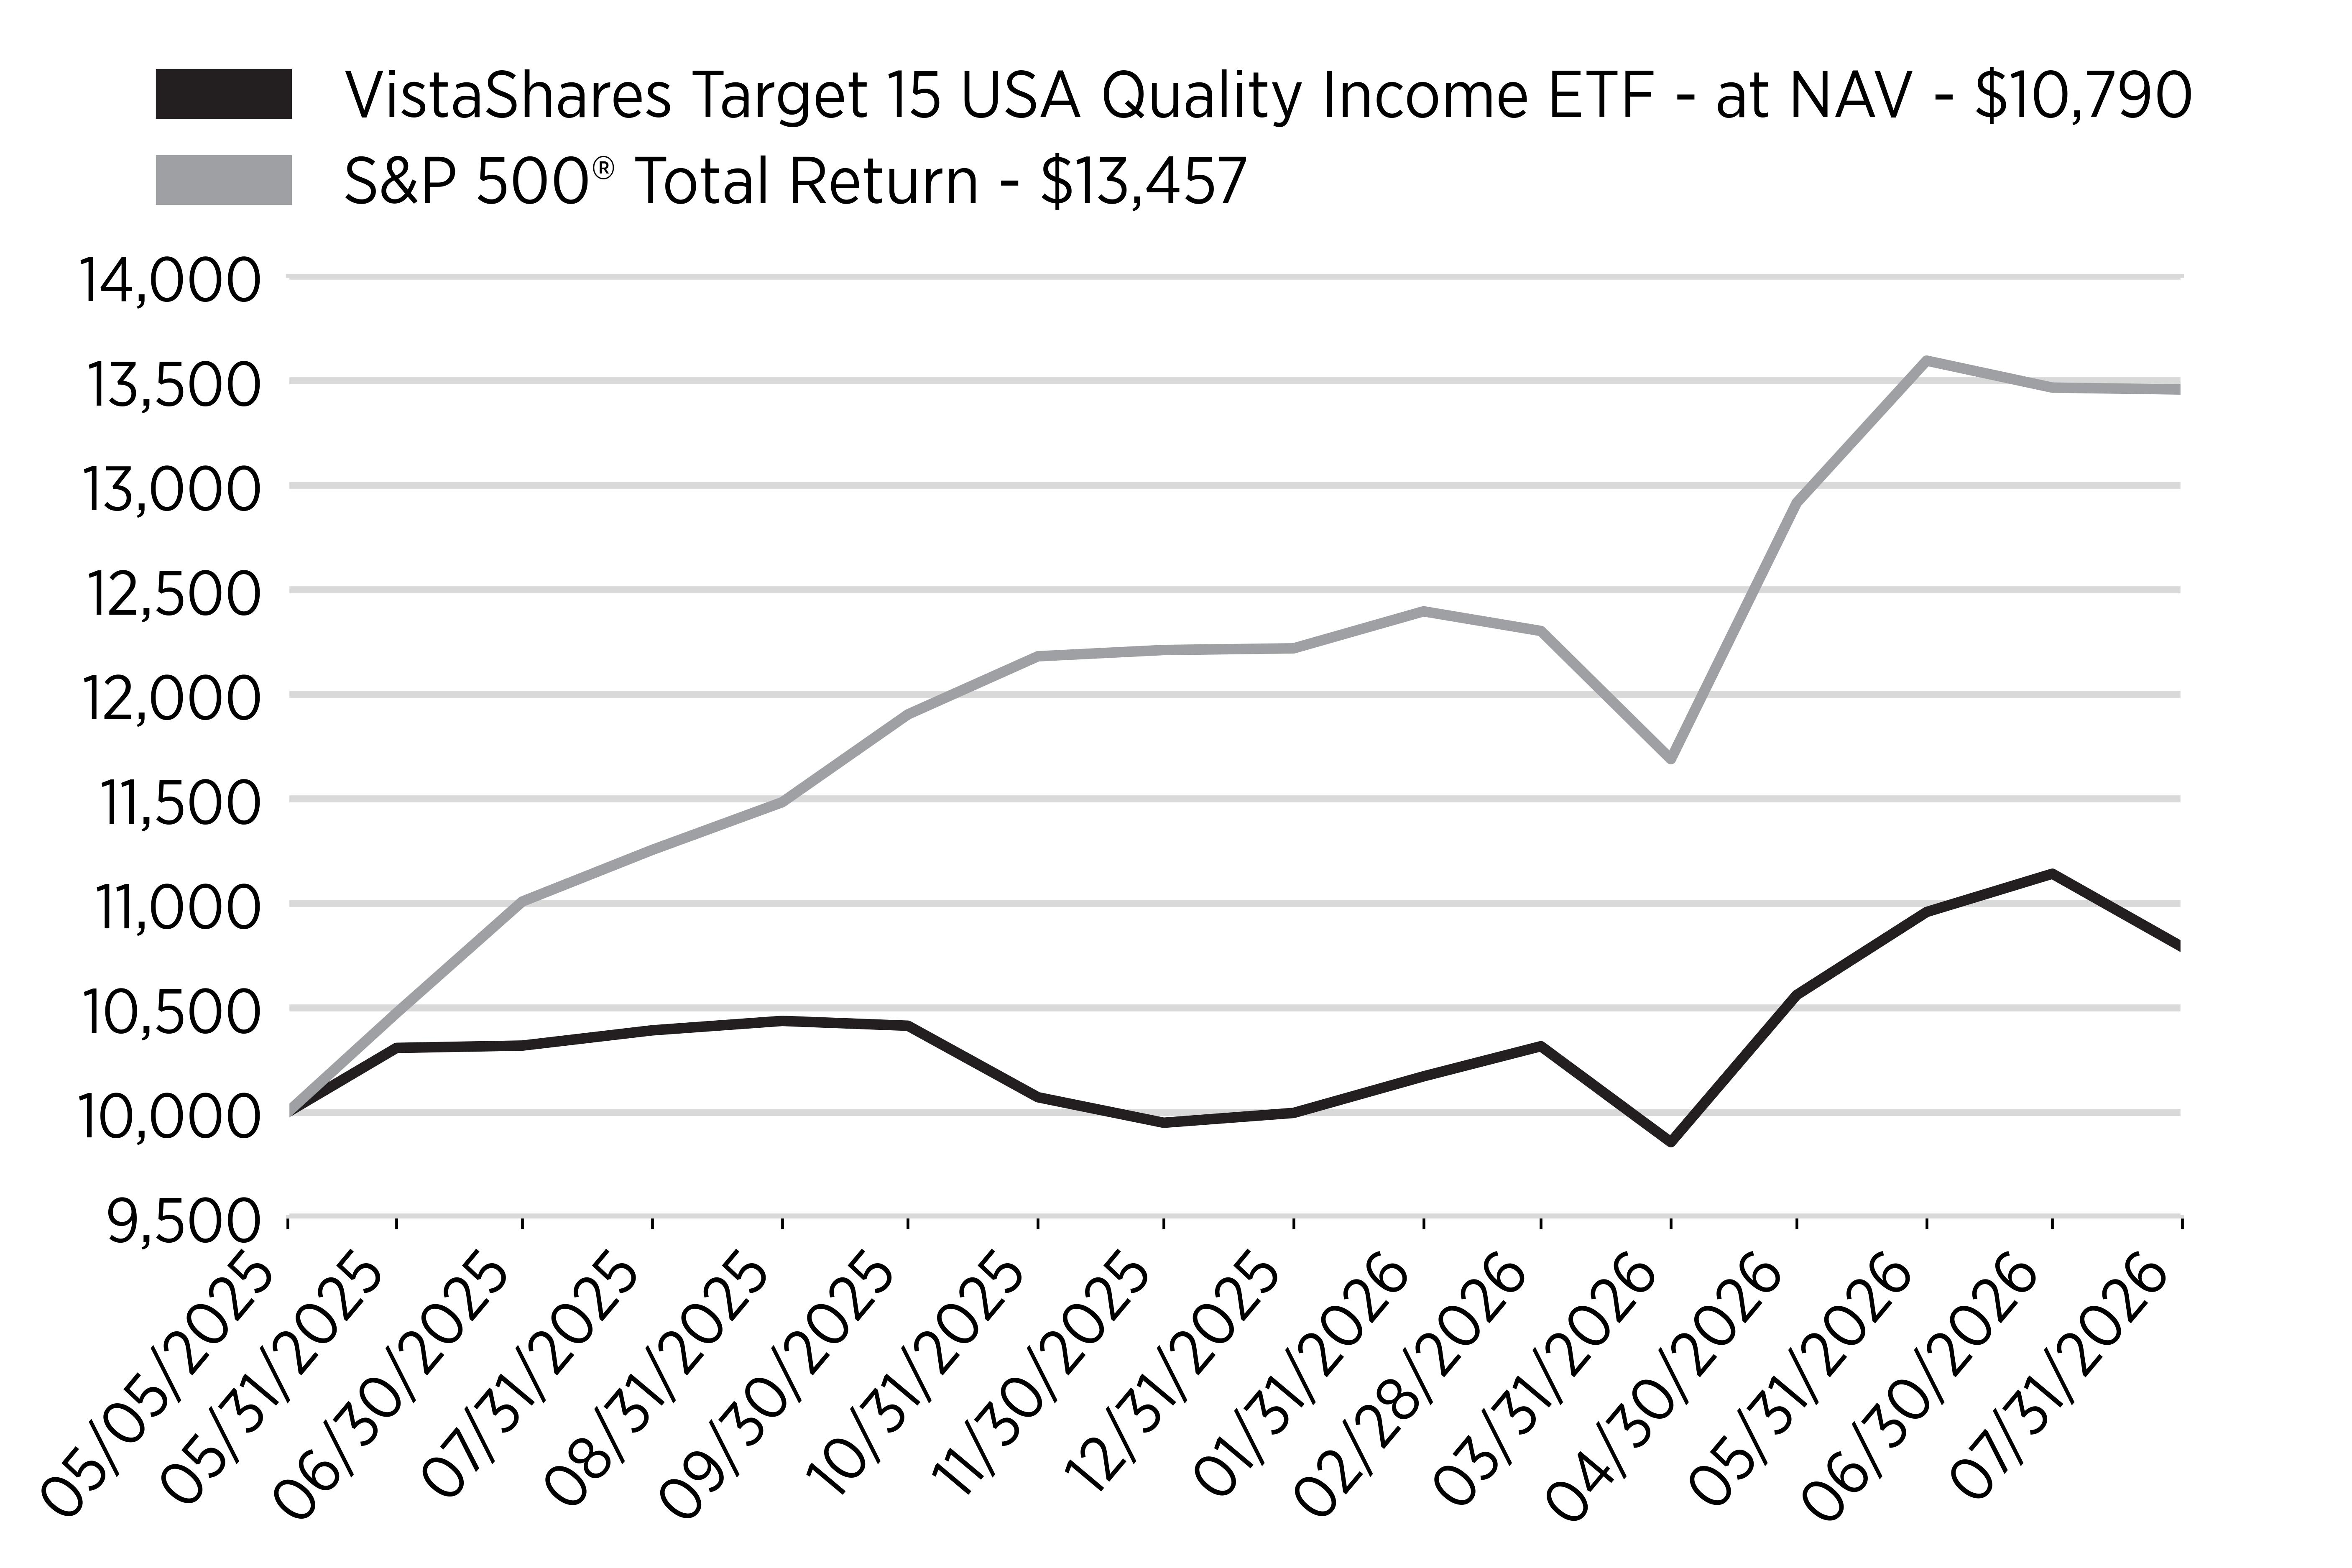
Annual Performance
|
|
1
Year |
Since
Inception
(5/5/2025) |
|---|---|---|
|
VistaShares
Target 15 USA Quality
Income
ETF - at NAV |
4.56% |
6.34% |
|
S&P
500® Total Return |
19.56% |
27.10% |
Key Fund Statistics
(as of July 31, 2026)
|
Fund
Size (Thousands) |
$21,448 |
|
Number
of Holdings |
88 |
|
Total
Advisory Fee |
$74,132 |
|
Portfolio
Turnover Rate |
4% |
What did the Fund invest in?
(as of July 31, 2026)
Sector Breakdown
(% of Total Net Assets)
|
Top
Ten Holdings |
(%
of Total
Net
Assets) |
|---|---|
|
Microsoft
Corp. |
|
|
Apple,
Inc. |
|
|
Berkshire
Hathaway, Inc. - Class B |
|
|
NVIDIA
Corp. |
|
|
Broadcom,
Inc. |
|
|
Caterpillar,
Inc. |
|
|
Costco
Wholesale Corp. |
|
|
Walmart,
Inc. |
|
|
Coca-Cola
Co. |
|
|
Eli
Lilly & Co. |
| [1] | Costs paid as a percentage of investment are annualized. |
| [2] | Costs paid as a percentage of investment are annualized. |
| [3] | Costs paid as a percentage of investment are annualized. |
| [4] | Costs paid as a percentage of investment are annualized. |