| Year(1,2) | Summary Compensation Table Total for PEO |
Compensation Actually Paid(3) to PEO |
Average Summary Compensation Table Total for Non-PEO NEOs |
Average Compensation Actually Paid(3) to Non-PEO NEOs |
Value
of Initial Fixed $100 Investment Based on: |
Net Income ($M) |
Economic Profit(6) ($M) | |
| Total Shareholder Return(4) |
Peer
Group Total Shareholder Return(5) | |||||||
| FY26 | 14,000,460 | 2,644,733 | 6,877,780 | 4,825,027 | 62.92 | 116.70 | 601 | 397 |
| FY25 | 13,333,032 | 10,448,800 | 5,213,747 | 4,256,244 | 75.71 | 122.13 | 824 | 756 |
| FY24 | 12,685,308 | 6,227,375 | 4,019,223 | 2,218,829 | 83.30 | 124.89 | 292 | 573 |
| FY23 | 11,649,650 | 19,409,637 | 4,049,242 | 5,532,135 | 93.86 | 111.99 | 161 | 397 |
| FY22 | 8,534,808 | 7,087,568 | 3,199,457 | 2,503,719 | 80.59 | 105.43 | 471 | 282 |
| (1) | Ms. Rendle was PEO for the entirety of fiscal years 2026, 2025, 2024, 2023, and 2022. |
| (2) | Non-PEO NEOs were Messrs. Bellet and Hyder and Mses. Marriner and Hilt for fiscal year 2026; Messrs. Bellet, Hyder, Eric Reynolds and Kevin Jacobsen and Ms. Nina Barton for fiscal year 2025; Messrs. Jacobsen and Reynolds and Mses. Marriner and Hilt for fiscal year 2024; Messrs. Jacobsen and Reynolds and Mses. Marriner and Stacey Grier for fiscal year 2023; Messrs. Jacobsen and Reynolds and Mses. Marriner and Rebecca Dunphey for fiscal year 2022. |
| (3) | See following table for additional details about the calculation of the CAP value. |
| (4) | Total Shareholder Return (TSR) assumes an initial $100 investment in Clorox stock beginning on June 30, 2021. TSR is cumulative, with the value determined at the end of each applicable fiscal year, calculated in accordance with Item 201(e) of Regulation S-K, as modified by the PVP rules. |
| (5) | The peer group represents a composite index composed of the Standard & Poor’s Household Products Index and the Standard & Poor’s Housewares & Specialties Index, which is used by Clorox for purposes of compliance with Item 201(e) of Regulation S-K. Peer group TSR is calculated in accordance with Item 201(e) of Regulation S-K, as modified by the PVP rules. |
| (6) | The SEC requires disclosure of a company-selected measure, representing the most important financial measure linking CAP for the current fiscal year to company performance. The company-selected measure for fiscal year 2026 is Economic Profit, a non-GAAP financial measure. Refer to Appendix B for a reconciliation to the most directly comparable GAAP financial measure. |
The following table provides additional information on how CAP for the current reporting year was determined, starting with Summary Compensation Table (SCT) total compensation and applying each of the required adjustments in accordance with PVP rules.
| PEO | Average of Non-PEO NEOs | |
| SCT Total Compensation | 14,000,460 | 6,877,780 |
| Subtract change in pension value and NQDC earnings reported in SCT | -2,620 | |
| Add value of pension benefits per CAP definition(1) | ||
| Subtract value of stock and option awards granted during the fiscal year reported in SCT | -10,699,895 | -5,537,314 |
| Add value of stock and option awards granted during the fiscal year per CAP definition(2) | 7,148,799 | 4,794,269 |
| Add/subtract change in fair value of unvested stock and option awards(3,4) | -3,834,957 | -713,806 |
| Add/subtract change in fair value of stock and option awards vested during the fiscal year(4,5) | -4,683,357 | -741,024 |
| Subtract fair value of stock and option awards forfeited during the fiscal year(6) | ||
| Add value of dividends accrued on stock awards during the fiscal year(7) | 713,683 | 147,742 |
| CAP | 2,644,733 | 4,825,027 |
| (1) | CAP definition of pension benefits is equal to service cost during the fiscal year. During fiscal year 2026, service cost was zero. |
| (2) | Fair value on the last day of the current fiscal year, for stock awards granted during the current fiscal year and remaining unvested as of the last day of the fiscal year. |
| (3) | Change in fair value between the last day of the immediately prior fiscal year and the last day of the current fiscal year, for unvested stock and option awards granted in prior fiscal years. |
| (4) | The change in fair values for unvested stock and option awards were calculated on each of the required measurement dates using assumptions based on criteria consistent with those used for grant date fair value calculations and in accordance with the methodology used for financial reporting purposes. The fair values of RSUs were determined based on the closing price of Clorox common stock on the measurement dates. Prior to the final measurement date, the fair values of unvested PSUs were determined based on the probable outcome of performance-based vesting conditions and the closing price of Clorox common stock on each measurement date. On the final measurement date, the fair value of PSUs was determined based on the approved payout factor and the closing price of Clorox common stock on that date. The fair values of stock options were determined using a Black-Scholes option pricing model with corresponding assumptions (risk-free interest rate, dividend yield, expected volatility factor, and expected option life) as of each measurement date. |
| (5) | Change in fair value between the last day of the immediately prior fiscal year and the vesting date, for stock and option awards granted in prior fiscal years and vested during the current fiscal year. |
| (6) | Fair value on the last day of the prior fiscal year, for stock and option awards failing to meet vesting conditions in the current fiscal year. |
| (7) | These amounts represent the dollar value of any dividends or other earnings accrued or paid on stock awards during the current fiscal year (prior to the vesting date for awards vested during the fiscal year), not otherwise reflected in the fair value of such awards or included in any other component of total compensation for the fiscal year. |
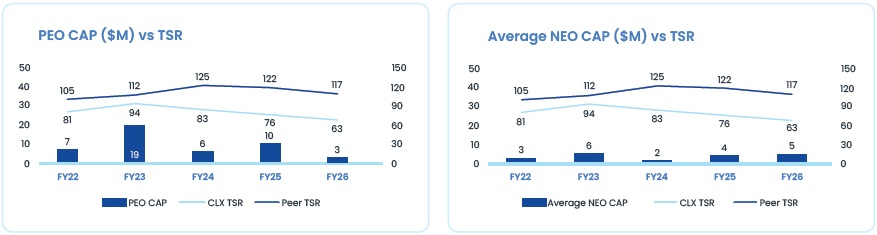
The charts below reflect the relationship between the PEO and Average NEO CAP, Clorox TSR, and TSR for our peer group. We do not use TSR as a metric in our incentive plans. However, our PSU metric—growth in EP during a three-year performance period—is a key driver of changes in shareholder value and a principal determinant of TSR.
Relationship Between CAP and Net Income (GAAP)
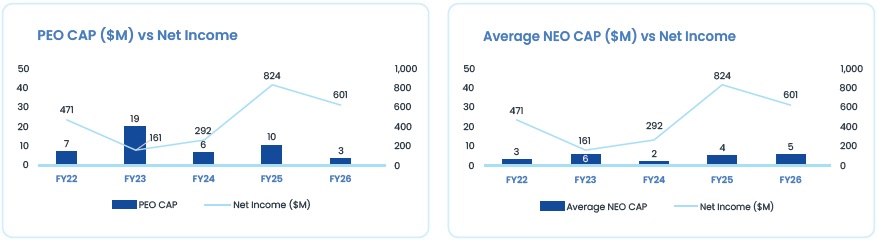
The charts below reflect the relationship between the PEO and Average NEO CAP and Clorox’s GAAP net income. We do not use net income as a metric in our incentive plans.
Relationship Between CAP and Economic Profit (our Company-Selected Measure)
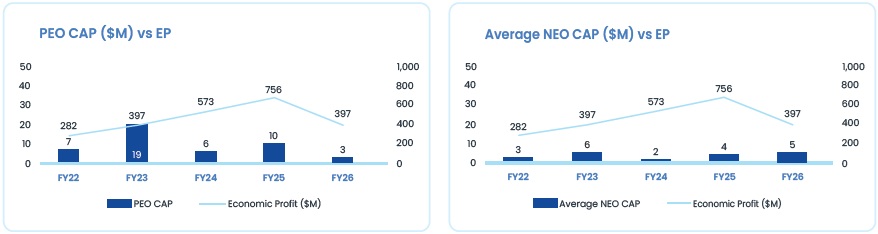
The charts below reflect the relationship between the PEO and Average NEO CAP and EP. We consider EP to be the most important financial measure linking pay to performance because awards under our long-term incentive plan are the largest component of NEO compensation, PSUs make up 60% of long-term incentive plan awards, and EP is the underlying basis of our PSU measure (growth in EP). EP is a measure we commonly evaluate and communicate as a key indication of our business performance and is substantially correlated with our stock price performance, and therefore to CAP. Unlike our multi-year PSU measure, EP is a single-year measure, meeting the SEC’s rules for the PVP table.
| Measure | Where Used |
| Economic Profit measures our ability to generate value through business operations. | Long-Term Incentive Plan (indirect) |
| Growth in Economic Profit measures our ability to generate value over time. | Long-Term Incentive Plan (direct) |
| Net Customer Sales measures our ability to generate revenue from core operations. | Annual Incentive Plan |
| Net Earnings Attributable to Clorox measures our ability to generate sustainable profits from our operations, distribute dividends, reinvest in the business, and pursue growth opportunities. | Annual Incentive Plan |
| Gross Margin measures our operational efficiency and our ability to manage production cost. | Annual Incentive Plan |
| [1] | Ms. Rendle was PEO for the entirety of fiscal years 2026, 2025, 2024, 2023, and 2022. |
| [2] | Non-PEO NEOs were Messrs. Bellet and Hyder and Mses. Marriner and Hilt for fiscal year 2026; Messrs. Bellet, Hyder, Eric Reynolds and Kevin Jacobsen and Ms. Nina Barton for fiscal year 2025; Messrs. Jacobsen and Reynolds and Mses. Marriner and Hilt for fiscal year 2024; Messrs. Jacobsen and Reynolds and Mses. Marriner and Stacey Grier for fiscal year 2023; Messrs. Jacobsen and Reynolds and Mses. Marriner and Rebecca Dunphey for fiscal year 2022. |
| [3] | See following table for additional details about the calculation of the CAP value. |
| [4] | Total Shareholder Return (TSR) assumes an initial $100 investment in Clorox stock beginning on June 30, 2021. TSR is cumulative, with the value determined at the end of each applicable fiscal year, calculated in accordance with Item 201(e) of Regulation S-K, as modified by the PVP rules. |
| [5] | The peer group represents a composite index composed of the Standard & Poor’s Household Products Index and the Standard & Poor’s Housewares & Specialties Index, which is used by Clorox for purposes of compliance with Item 201(e) of Regulation S-K. Peer group TSR is calculated in accordance with Item 201(e) of Regulation S-K, as modified by the PVP rules. |
| [6] | The SEC requires disclosure of a company-selected measure, representing the most important financial measure linking CAP for the current fiscal year to company performance. The company-selected measure for fiscal year 2026 is Economic Profit, a non-GAAP financial measure. Refer to Appendix B for a reconciliation to the most directly comparable GAAP financial measure. |
| [7] | CAP definition of pension benefits is equal to service cost during the fiscal year. During fiscal year 2026, service cost was zero. |
| [8] | Fair value on the last day of the current fiscal year, for stock awards granted during the current fiscal year and remaining unvested as of the last day of the fiscal year. |
| [9] | Change in fair value between the last day of the immediately prior fiscal year and the last day of the current fiscal year, for unvested stock and option awards granted in prior fiscal years. |
| [10] | The change in fair values for unvested stock and option awards were calculated on each of the required measurement dates using assumptions based on criteria consistent with those used for grant date fair value calculations and in accordance with the methodology used for financial reporting purposes. The fair values of RSUs were determined based on the closing price of Clorox common stock on the measurement dates. Prior to the final measurement date, the fair values of unvested PSUs were determined based on the probable outcome of performance-based vesting conditions and the closing price of Clorox common stock on each measurement date. On the final measurement date, the fair value of PSUs was determined based on the approved payout factor and the closing price of Clorox common stock on that date. The fair values of stock options were determined using a Black-Scholes option pricing model with corresponding assumptions (risk-free interest rate, dividend yield, expected volatility factor, and expected option life) as of each measurement date. |
| [11] | Change in fair value between the last day of the immediately prior fiscal year and the vesting date, for stock and option awards granted in prior fiscal years and vested during the current fiscal year. |
| [12] | Fair value on the last day of the prior fiscal year, for stock and option awards failing to meet vesting conditions in the current fiscal year. |
| [13] | These amounts represent the dollar value of any dividends or other earnings accrued or paid on stock awards during the current fiscal year (prior to the vesting date for awards vested during the fiscal year), not otherwise reflected in the fair value of such awards or included in any other component of total compensation for the fiscal year. |