What were the Fund costs for the past year?
(based on a hypothetical $10,000 investment)
|
Fund
Name |
Costs
of a $10,000 investment |
Costs
paid as a percentage of a $10,000 investment |
|---|---|---|
|
DGA
Core Plus Absolute Return ETF |
$141 |
1.35% |
How did the Fund perform last year and what affected its performance?
The Fund performed in line with our expectations for absolute return mandated funds. In this section, we briefly summarize the key factors that affected the performance of the DGA Core Plus Absolute Return ETF. These factors included relevant market conditions, investment strategies, and techniques employed by the fund's investment adviser.
What factors influenced performance?
Market Conditions
The global market environment over the period was a challenging geopolitical macro landscape. The Fund maintained risk and capital-preservation discipline amid heightened volatility and rising inflation pressures.
Investment Strategies and Techniques
The Fund’s core investment approach remained consistent, guided by a disciplined absolute return framework:
- When tracked momentum conditions deteriorate, the portfolio repositions toward exposures with higher market correlation and applies hedges to preserve capital.
- When momentum conditions improve, the portfolio shifts toward exposures with lower market correlation, employs selective leverage, and captures alpha opportunities.
Throughout the reporting period, the Fund applied these principles through model-driven decision support, advanced signal analysis, and the discretion of experienced managers. The portfolio actively cycled through hedged and moderate portfolio stances, dynamically scaling the use of inverse ETFs, correlation tilts, and leverage to align with evolving global conditions. This adaptability allowed the Fund to maintain its record of market resilience.
Cumulative Performance
(Initial Investment of $10,000)
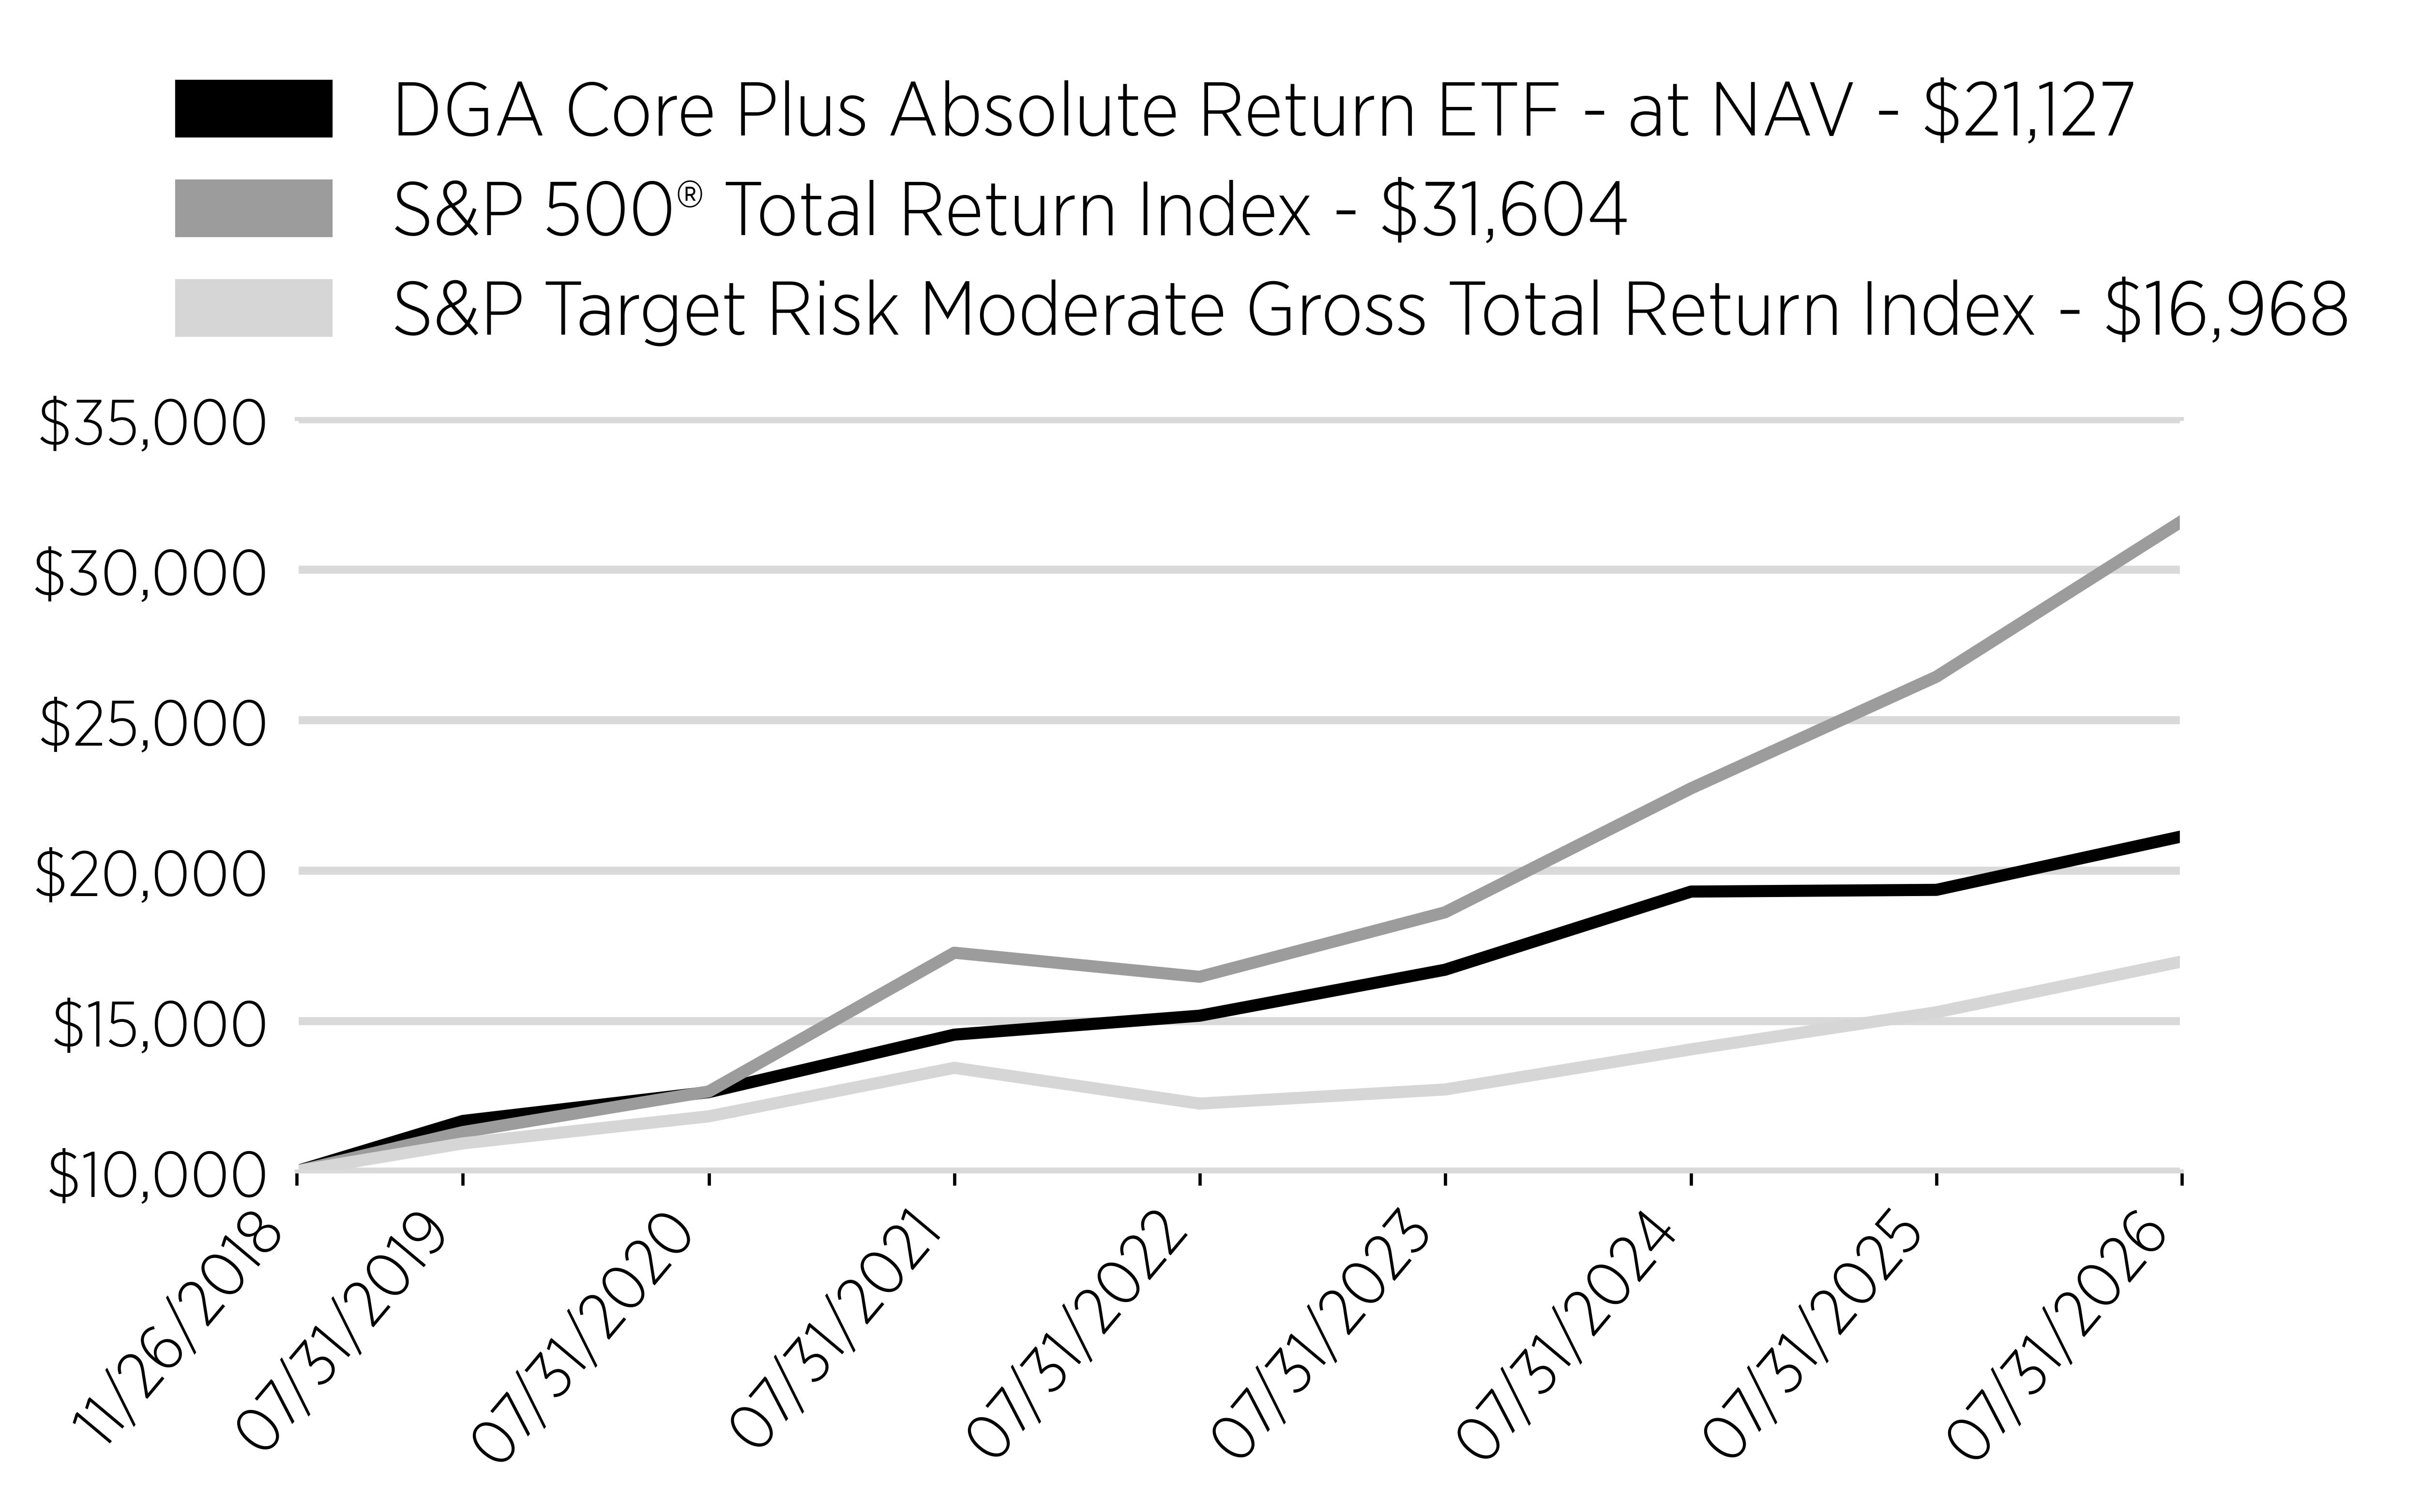
Annual Performance
|
Average
Annual Returns
for
the Periods Ended
July
31, 2026 |
1
Year |
3
Year |
5
Year |
Since
Inception (11/26/2018) |
|---|---|---|---|---|
|
DGA
Core Plus Absolute Return ETF - at NAV |
9.19% |
8.17% |
7.76% |
10.23% |
|
S&P
500 Total Return Index |
19.56% |
19.32% |
12.86% |
16.17% |
|
S&P
Target Risk Moderate Gross Total Return Index |
11.04% |
10.10% |
4.78% |
7.13% |
Key Fund Statistics
(as of July 31, 2026)
|
Fund
Size (Thousands) |
$20,463 |
|
Number
of Holdings |
16 |
|
Total
Advisory Fee Paid |
$266,096 |
|
Portfolio
Turnover Rate |
345% |
What did the Fund invest in?
(as of July 31, 2026)
Security Type Breakdown
(% of Net Assets)
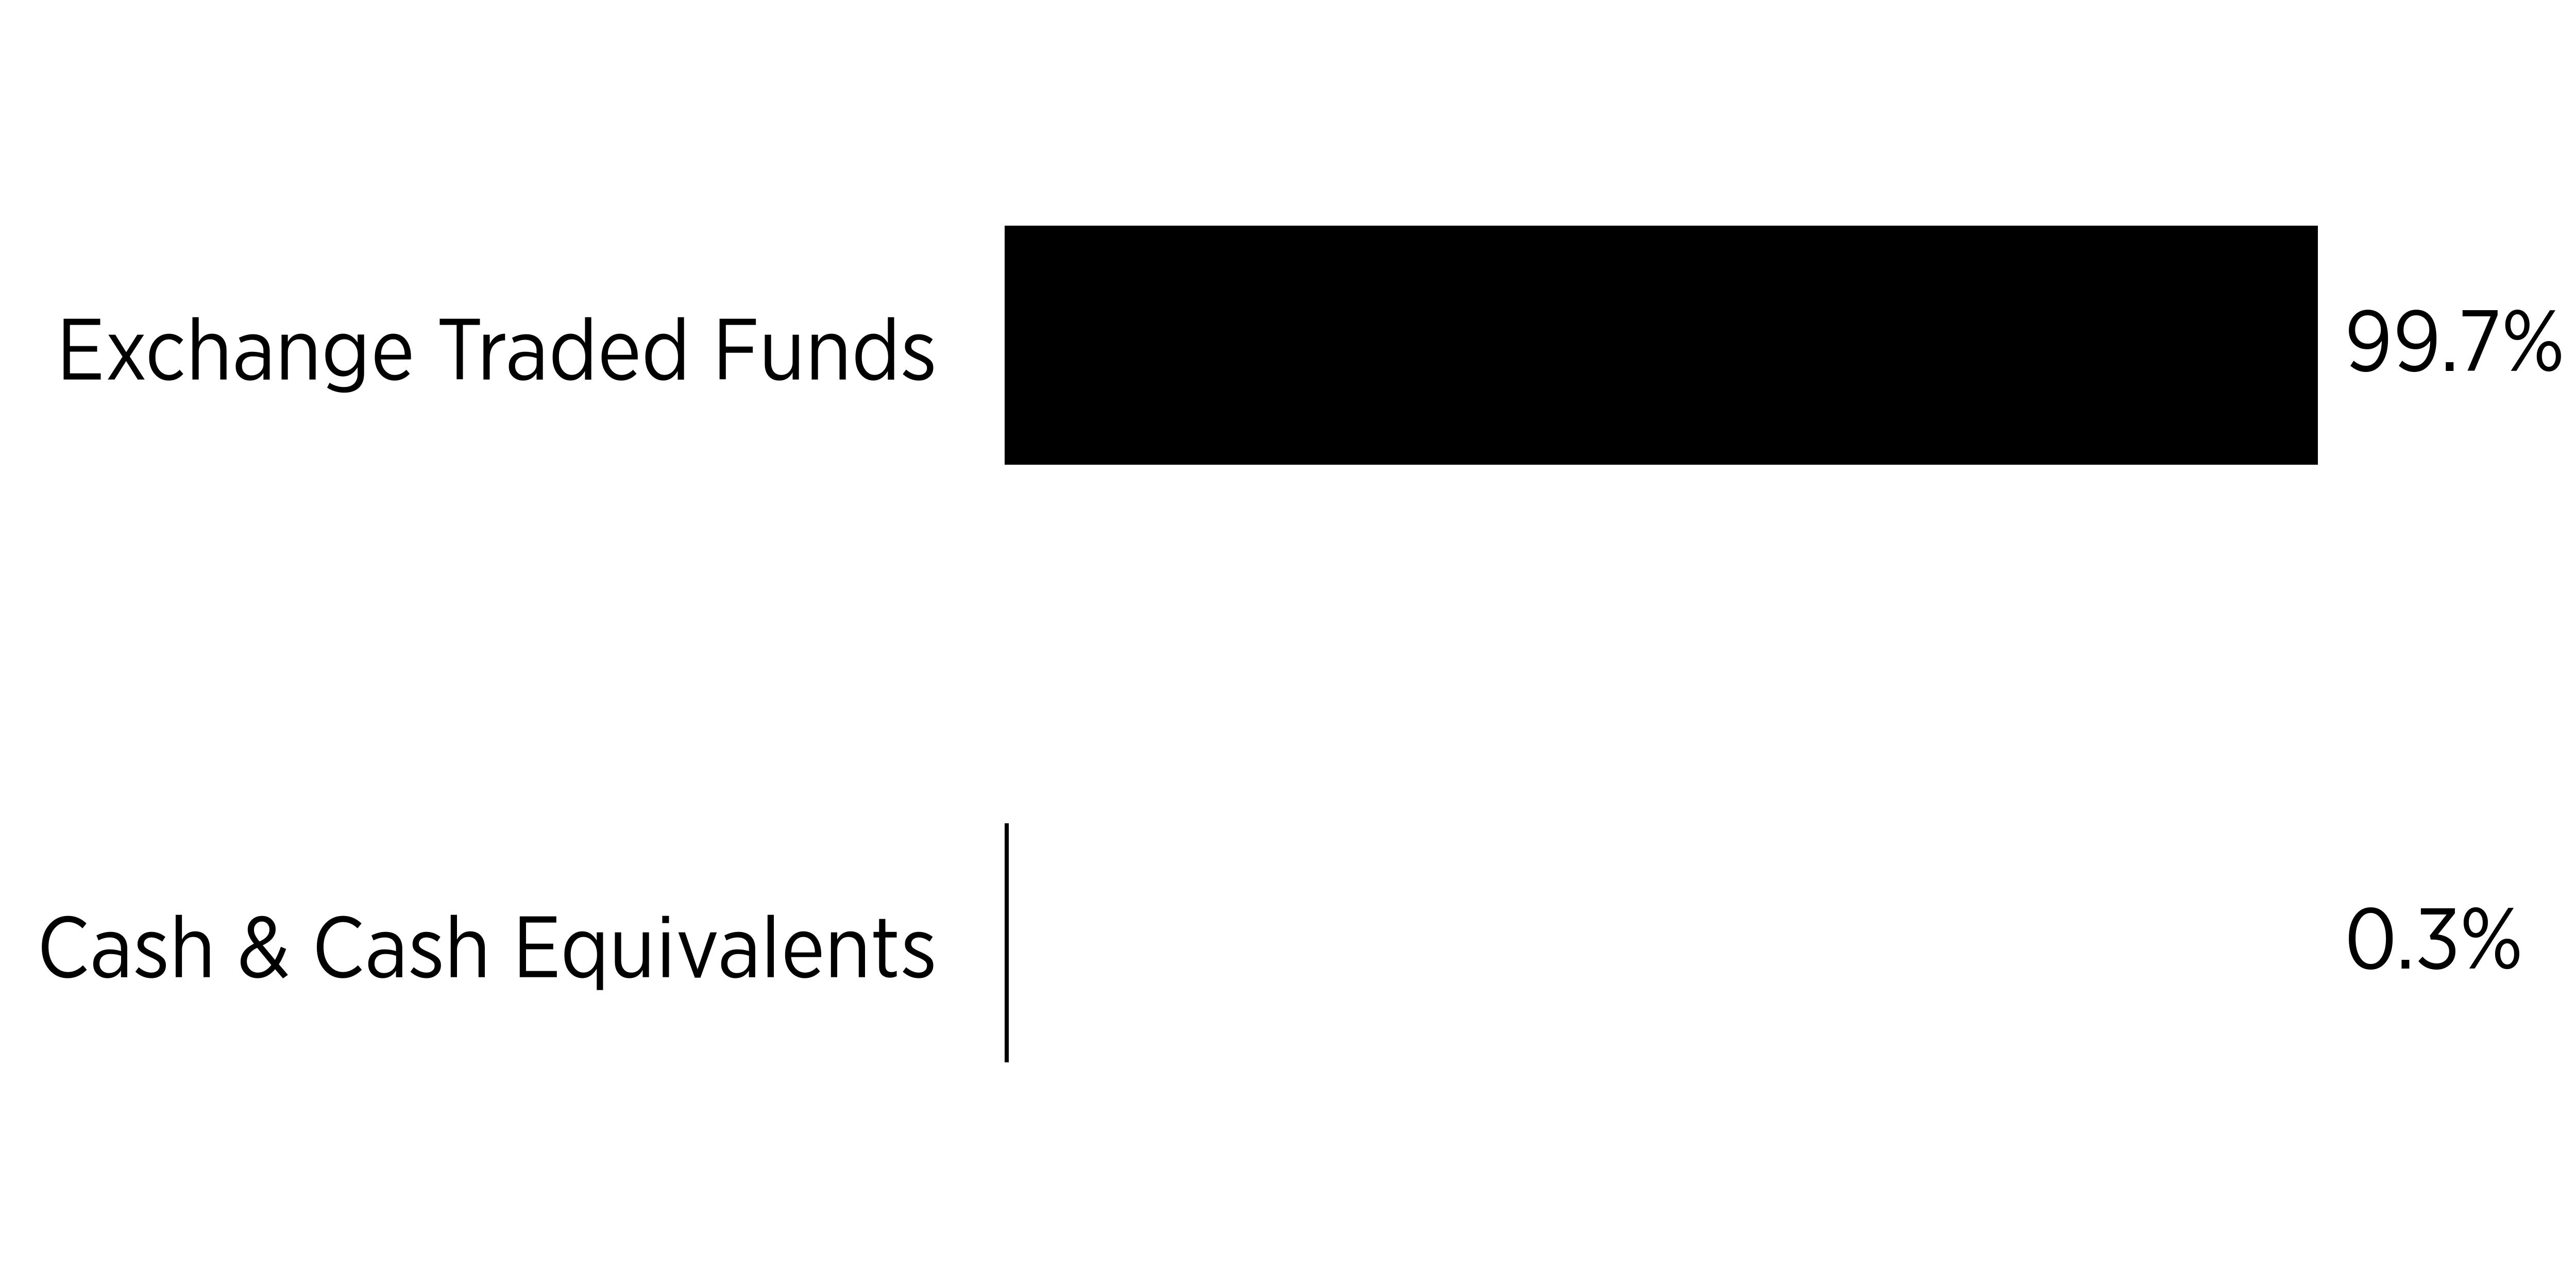
Percentages are based on net assets. Cash & Cash Equivalents represents cash, short-term investments and liabilities in excess of other assets.
|
Top
Holdings |
(%
of Net Assets) |
|---|---|
|
ProShares
Short S&P 500 |
|
|
Vanguard
Morningstar Value ETF |
|
|
State
Street SPDR Portfolio S&P 500
Value
ETF |
|
|
State
Street SPDR Portfolio S&P 500
Growth
ETF |
|
|
Vanguard
Morningstar Growth ETF |
|
|
iShares
MSCI ACWI ETF |
|
|
Vanguard
Total World Stock ETF |
|
|
Schwab
US Dividend Equity ETF |
|
|
State
Street SPDR Portfolio S&P 500
High
Dividend ETF |
|
|
Schwab
US Broad Market ETF |
Fund Changes
There have been no changes.