v3.26.3
Shareholder Report
12 Months Ended
Jul. 31, 2026
USD ($)
Holdings
Shareholder Report [Line Items]  
Document Type N-CSR
Amendment Flag false
Registrant Name Tidal Trust II
Entity Central Index Key 0001924868
Entity Investment Company Type N-1A
Document Period End Date Jul. 31, 2026
Shareholder Report Annual or Semi-Annual annual shareholder report
YieldMax(R) AI & Tech Portfolio Option Income ETF  
Shareholder Report [Line Items]  
Fund Name YieldMax™ AI & Tech Portfolio Option Income ETF
Class Name YieldMax™ AI & Tech Portfolio Option Income ETF
Trading Symbol GPTY
Security Exchange Name NYSEArca
Annual or Semi-Annual Statement [Text Block] This annual shareholder report contains important information about the YieldMax™ AI & Tech Portfolio Option Income ETF (the "Fund") for the period August 1, 2025 to July 31, 2026.
Shareholder Report Annual or Semi-Annual annual shareholder report
Additional Information [Text Block] You can find additional information about the Fund at www.yieldmaxetfs.com/our-etfs/gpty/. You can also request this information by contacting us at (844) 737-3001 or by writing to YieldMax™ AI & Tech Portfolio Option Income ETF, c/o U.S. Bank Global Fund Services, P.O. Box 701, Milwaukee, Wisconsin 53201‑0701.
Additional Information Phone Number (844) 737-3001
Additional Information Website www.yieldmaxetfs.com/our-etfs/gpty/
Expenses [Text Block]

What were the Fund costs for the past year?

(based on a hypothetical $10,000 investment)

Class Name
Costs of a $10,000 investment
Costs paid as a percentage of a $10,000 investment
YieldMax™ AI & Tech Portfolio Option Income ETF
$115
1.02%*
*Costs paid as a percentage of a $10,000 investment is an annualized figure.


Expenses Paid, Amount $ 115
Expense Ratio, Percent 1.02% [1]
Factors Affecting Performance [Text Block]

How Did the Fund Perform During the Reporting Period?

During the reporting period, GPTY generated positive total returns while providing shareholders with regular income distributions. The Fund generated income through option premium received from its call spread strategy while maintaining exposure to a portfolio of AI and technology-related equity securities.

What Factors Influenced Performance?

Performance was influenced by the returns of the Fund's underlying portfolio, which included companies operating in areas such as semiconductors, software, cloud computing, and digital infrastructure. In addition, the Fund generated option premium income through the sale of call spreads on its holdings.

The level of implied volatility across the portfolio affected the amount of option premium available for sale.

Positioning of the Fund

The Fund remains invested in a portfolio of AI and technology-related companies and continues to employ its option strategy to generate income. The Fund seeks to provide current income while maintaining exposure to the long-term performance of its underlying equity holdings.

Performance Past Does Not Indicate Future [Text] The Fund's past performance is not a good indicator of how the Fund will perform in the future.
Line Graph [Table Text Block]

Cumulative Performance

(Initial Investment of $10,000)
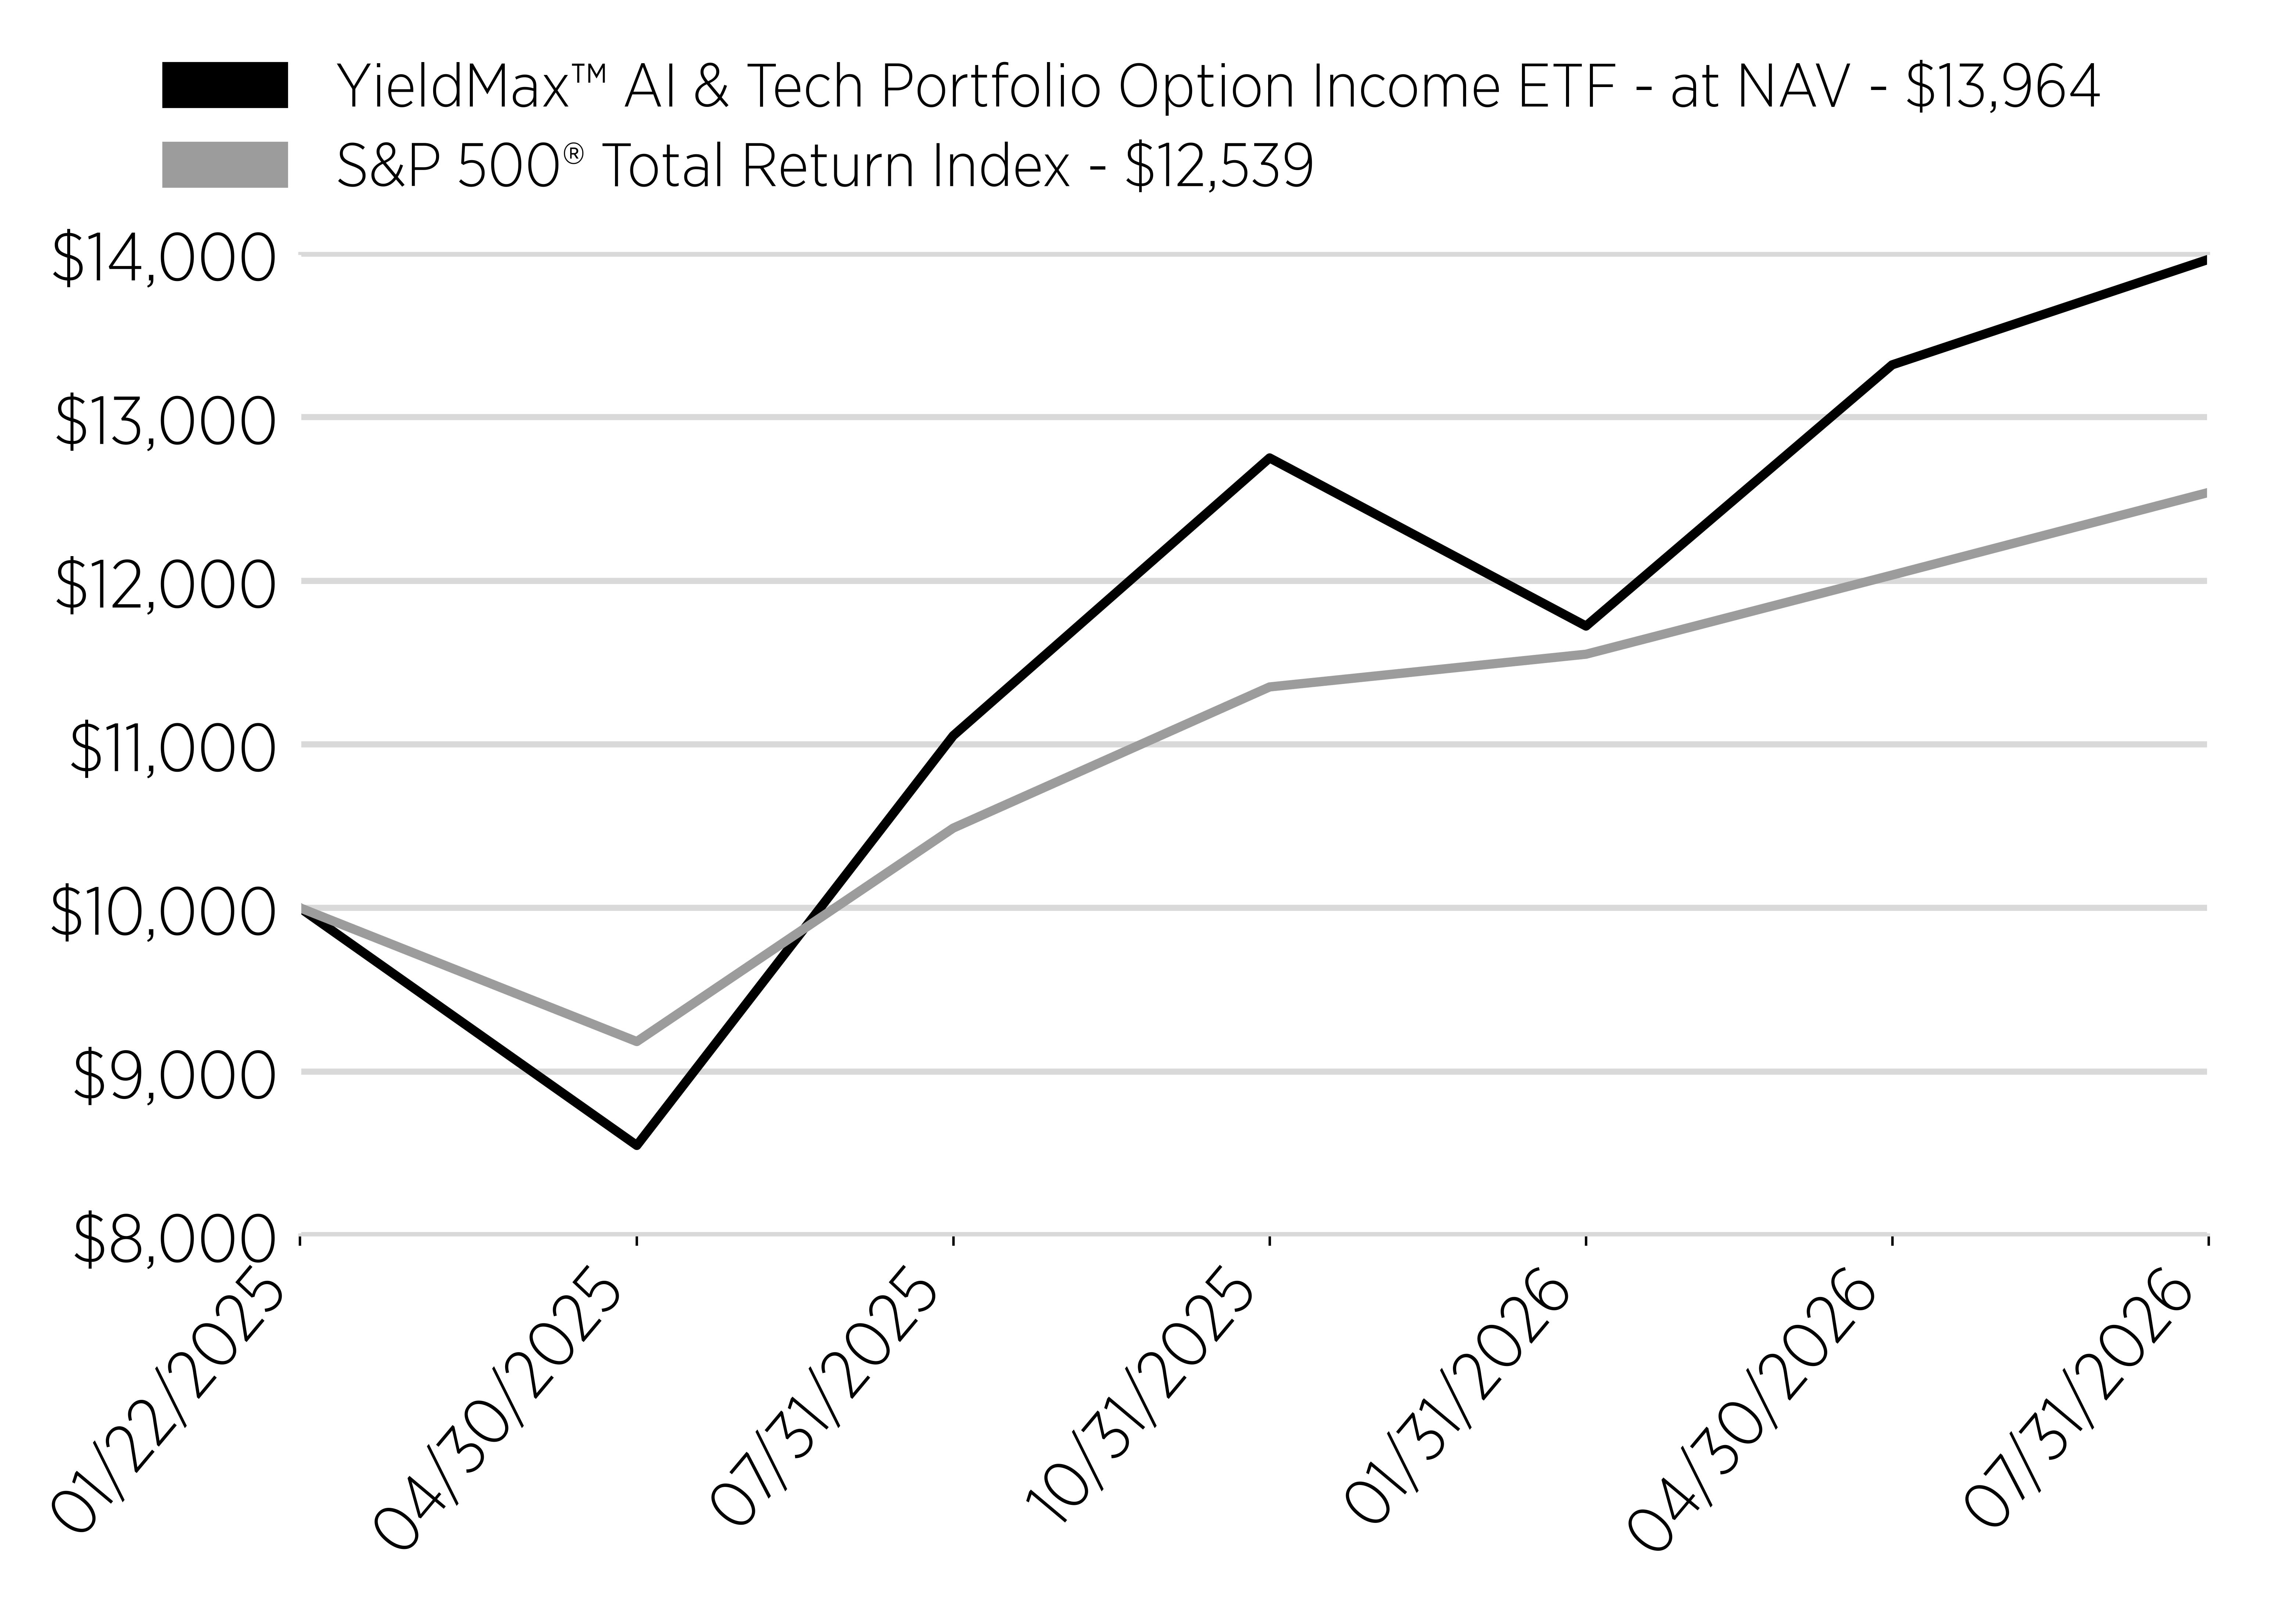
Date
YieldMax™ AI & Tech Portfolio Option Income ETF - at NAV - $13,964
S&P 500® Total Return Index - $12,539
1/22/2025
10000
10000
4/30/2025
8547
9182
7/31/2025
11052
10487
10/31/2025
12750
11350
1/31/2026
11722
11550
4/30/2026
13319
12034
7/31/2026
13964
12539
line
Average Annual Return [Table Text Block]

Annual Performance

1 Year
Since Inception (1/22/25)
Yieldmax™ AI & Tech Portfolio Option Income ETF - at NAV
26.39%
24.55%
S&P 500® Total Return Index
19.56%
16.04%
Performance Inception Date Jan. 22, 2025
No Deduction of Taxes [Text Block] The graph and table do not reflect the deduction of taxes that a shareholder would pay on fund distributions or redemption of fund shares.
Material Change Date Oct. 14, 2025
Updated Performance Information Location [Text Block] Visit www.yieldmaxetfs.com/our-etfs/gpty/ for more recent performance information.
Net Assets $ 101,782,000
Holdings Count | Holdings 81
Advisory Fees Paid, Amount $ 801,717
Investment Company, Portfolio Turnover 29.00%
Additional Fund Statistics [Text Block]

Key Fund Statistics

(as of July 31, 2026)

Fund Size (Thousands)
$101,782
Number of Holdings
81
Total Advisory Fee Paid
$801,717
Portfolio Turnover
29%
Holdings [Text Block]

What did the Fund invest in?

(as of July 31, 2026)

Security Type - Investments

(% of Net Assets)
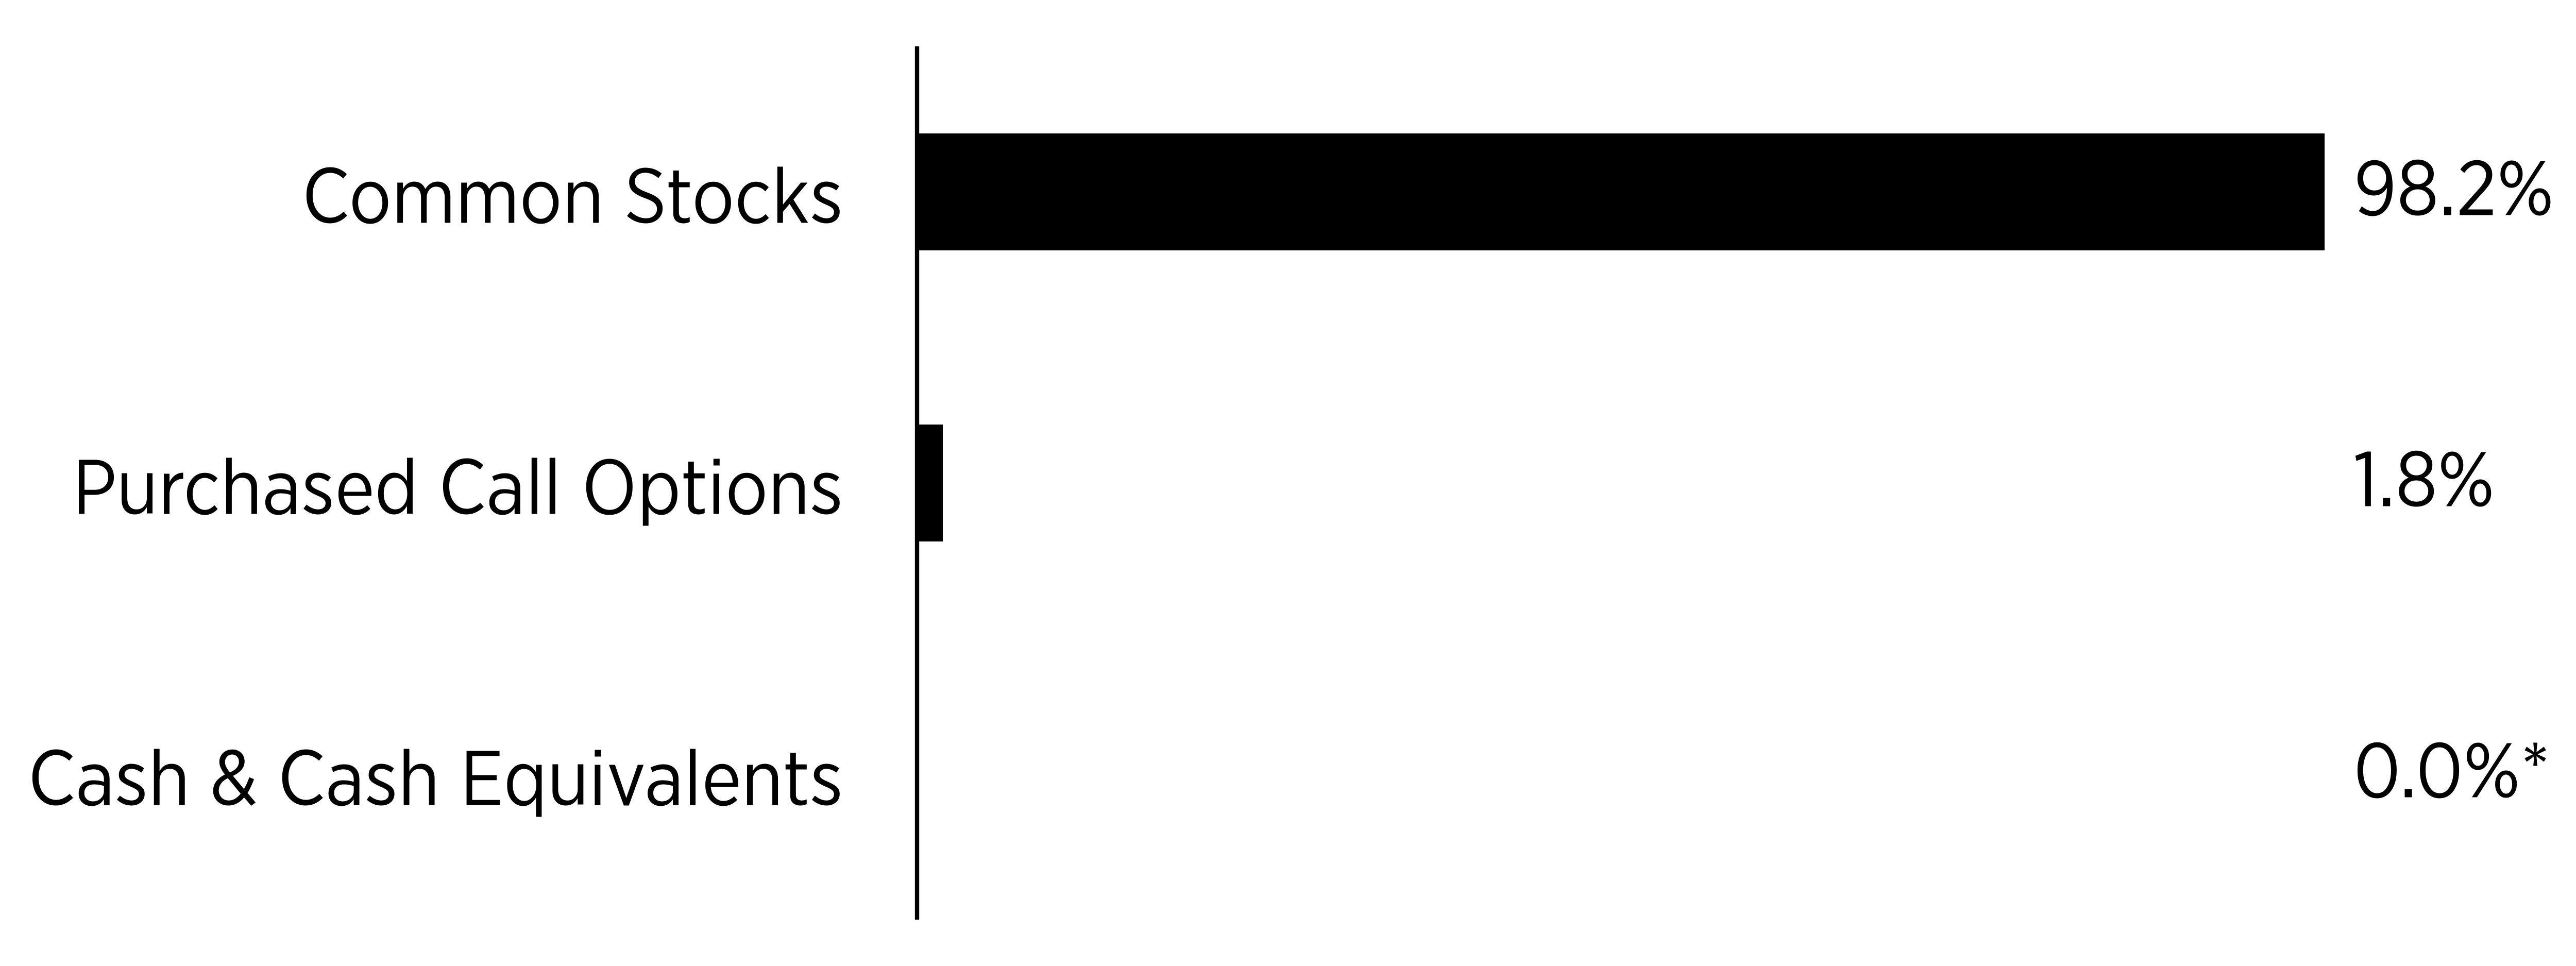
Sector
%
Common Stocks
98.2%
Purchased Call Options
1.8%
Cash & Cash Equivalents
0.0%*
bar


Security Type - Other Financial Instruments

(% of Net Assets)
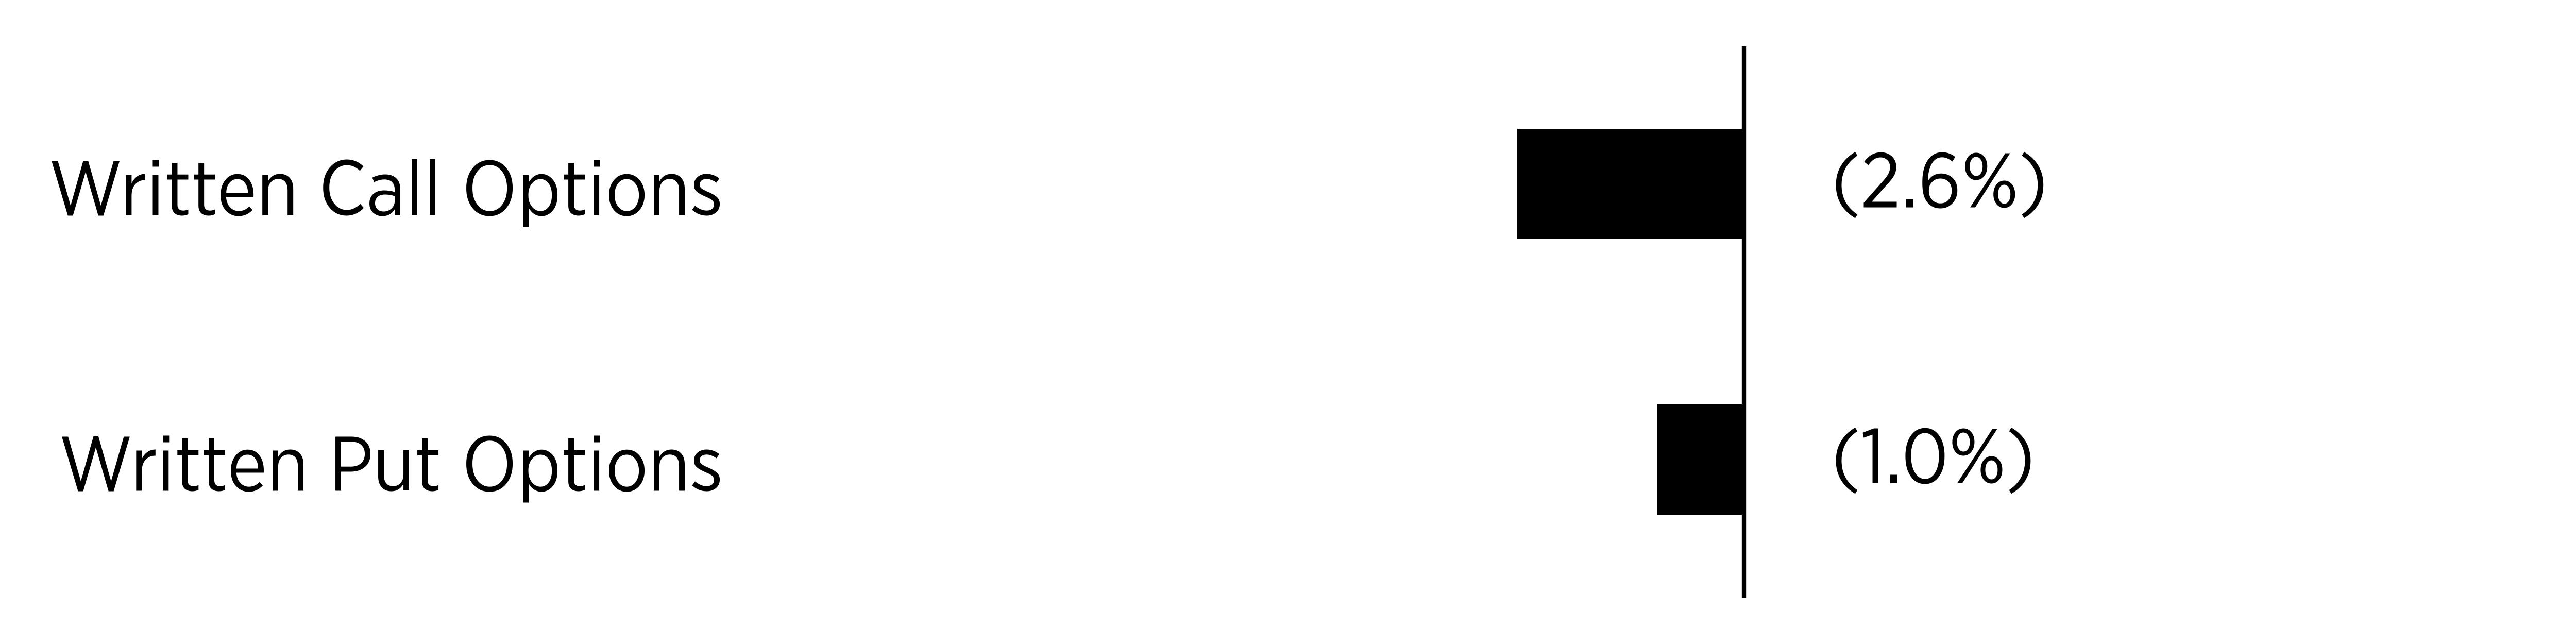
Sector
%
Written Call Options
-2.6%
Written Put Options
-1.0%
bar


*Amount does not round to 0.1% or -0.1%.

Percentages are based on net assets. Cash & Cash Equivalents represents cash, short-term investments, and liabilities in excess of other assets.


Largest Holdings [Text Block]
Top Holdings
(% of Net Assets)
NVIDIA Corp.
6.7
Snowflake, Inc. - Class A
6.5
Alphabet, Inc. - Class A
6.2
Amazon.com, Inc.
4.9
Microsoft Corp.
4.9
Apple, Inc.
4.8
International Business Machines Corp.
4.7
Advanced Micro Devices, Inc.
4.6
Broadcom, Inc.
4.4
Hut 8 Corp.
4.3
Material Fund Change [Text Block]

Fund Changes

Effective October 14, 2025 the Fund's payment of income distributions was changed to seek to make such distributions on a weekly basis.

YieldMax(R) CRCL Option Income Strategy ETF  
Shareholder Report [Line Items]  
Fund Name YieldMax™ CRCL Option Income Strategy ETF
Class Name YieldMax™ CRCL Option Income Strategy ETF
Trading Symbol CRCO
Security Exchange Name NYSEArca
Annual or Semi-Annual Statement [Text Block] This annual shareholder report contains important information about the YieldMax™ CRCL Option Income Strategy ETF (the "Fund") for the period August 1, 2025 to July 31, 2026.
Shareholder Report Annual or Semi-Annual annual shareholder report
Additional Information [Text Block] You can find additional information about the Fund at www.yieldmaxetfs.com/our-etfs/crco/. You can also request this information by contacting us at (844) 737-3001 or by writing to YieldMax™ CRCL Option Income Strategy ETF, c/o U.S. Bank Global Fund Services, P.O. Box 701, Milwaukee, Wisconsin 53201‑0701.
Additional Information Phone Number (844) 737-3001
Additional Information Website www.yieldmaxetfs.com/our-etfs/crco/
Expenses [Text Block]

What were the Fund costs for the past year?

(based on a hypothetical $10,000 investment)

Class Name
Costs of a $10,000 investment
Costs paid as a percentage of a $10,000 investment
YieldMax™ CRCL Option Income Strategy ETF
$83*
1.30%**
*The Fund commenced operations on September 29, 2025. Expenses for a full reporting period would be higher than the figures shown.
**Costs paid as a percentage of a $10,000 investment is an annualized figure.


Expenses Paid, Amount $ 83 [2]
Expense Ratio, Percent 1.30% [3]
Expenses Short Period Footnote [Text Block] The Fund commenced operations on September 29, 2025. Expenses for a full reporting period would be higher than the figures shown.
Factors Affecting Performance [Text Block]

How Did the Fund Perform During the Reporting Period?

During the reporting period, CRCO provided shareholders with regular income distributions while maintaining exposure to the performance of Circle Internet Group, Inc. ("CRCL"). The Fund generated income through a call spread strategy designed to capture option premium from CRCL.

What Factors Influenced Performance?

Performance was influenced by the market performance and implied volatility of CRCL. The Fund's option strategy generated premium income, with higher levels of implied volatility generally supporting higher option premiums.

Positioning of the Fund

The Fund continues to employ its option income strategy while maintaining exposure to CRCL. CRCO seeks to generate current income through the systematic sale of call spreads while retaining exposure to a portion of the underlying security's performance.
Performance Past Does Not Indicate Future [Text] The Fund's past performance is not a good indicator of how the Fund will perform in the future.
Line Graph [Table Text Block]

Cumulative Performance

(Initial Investment of $10,000)
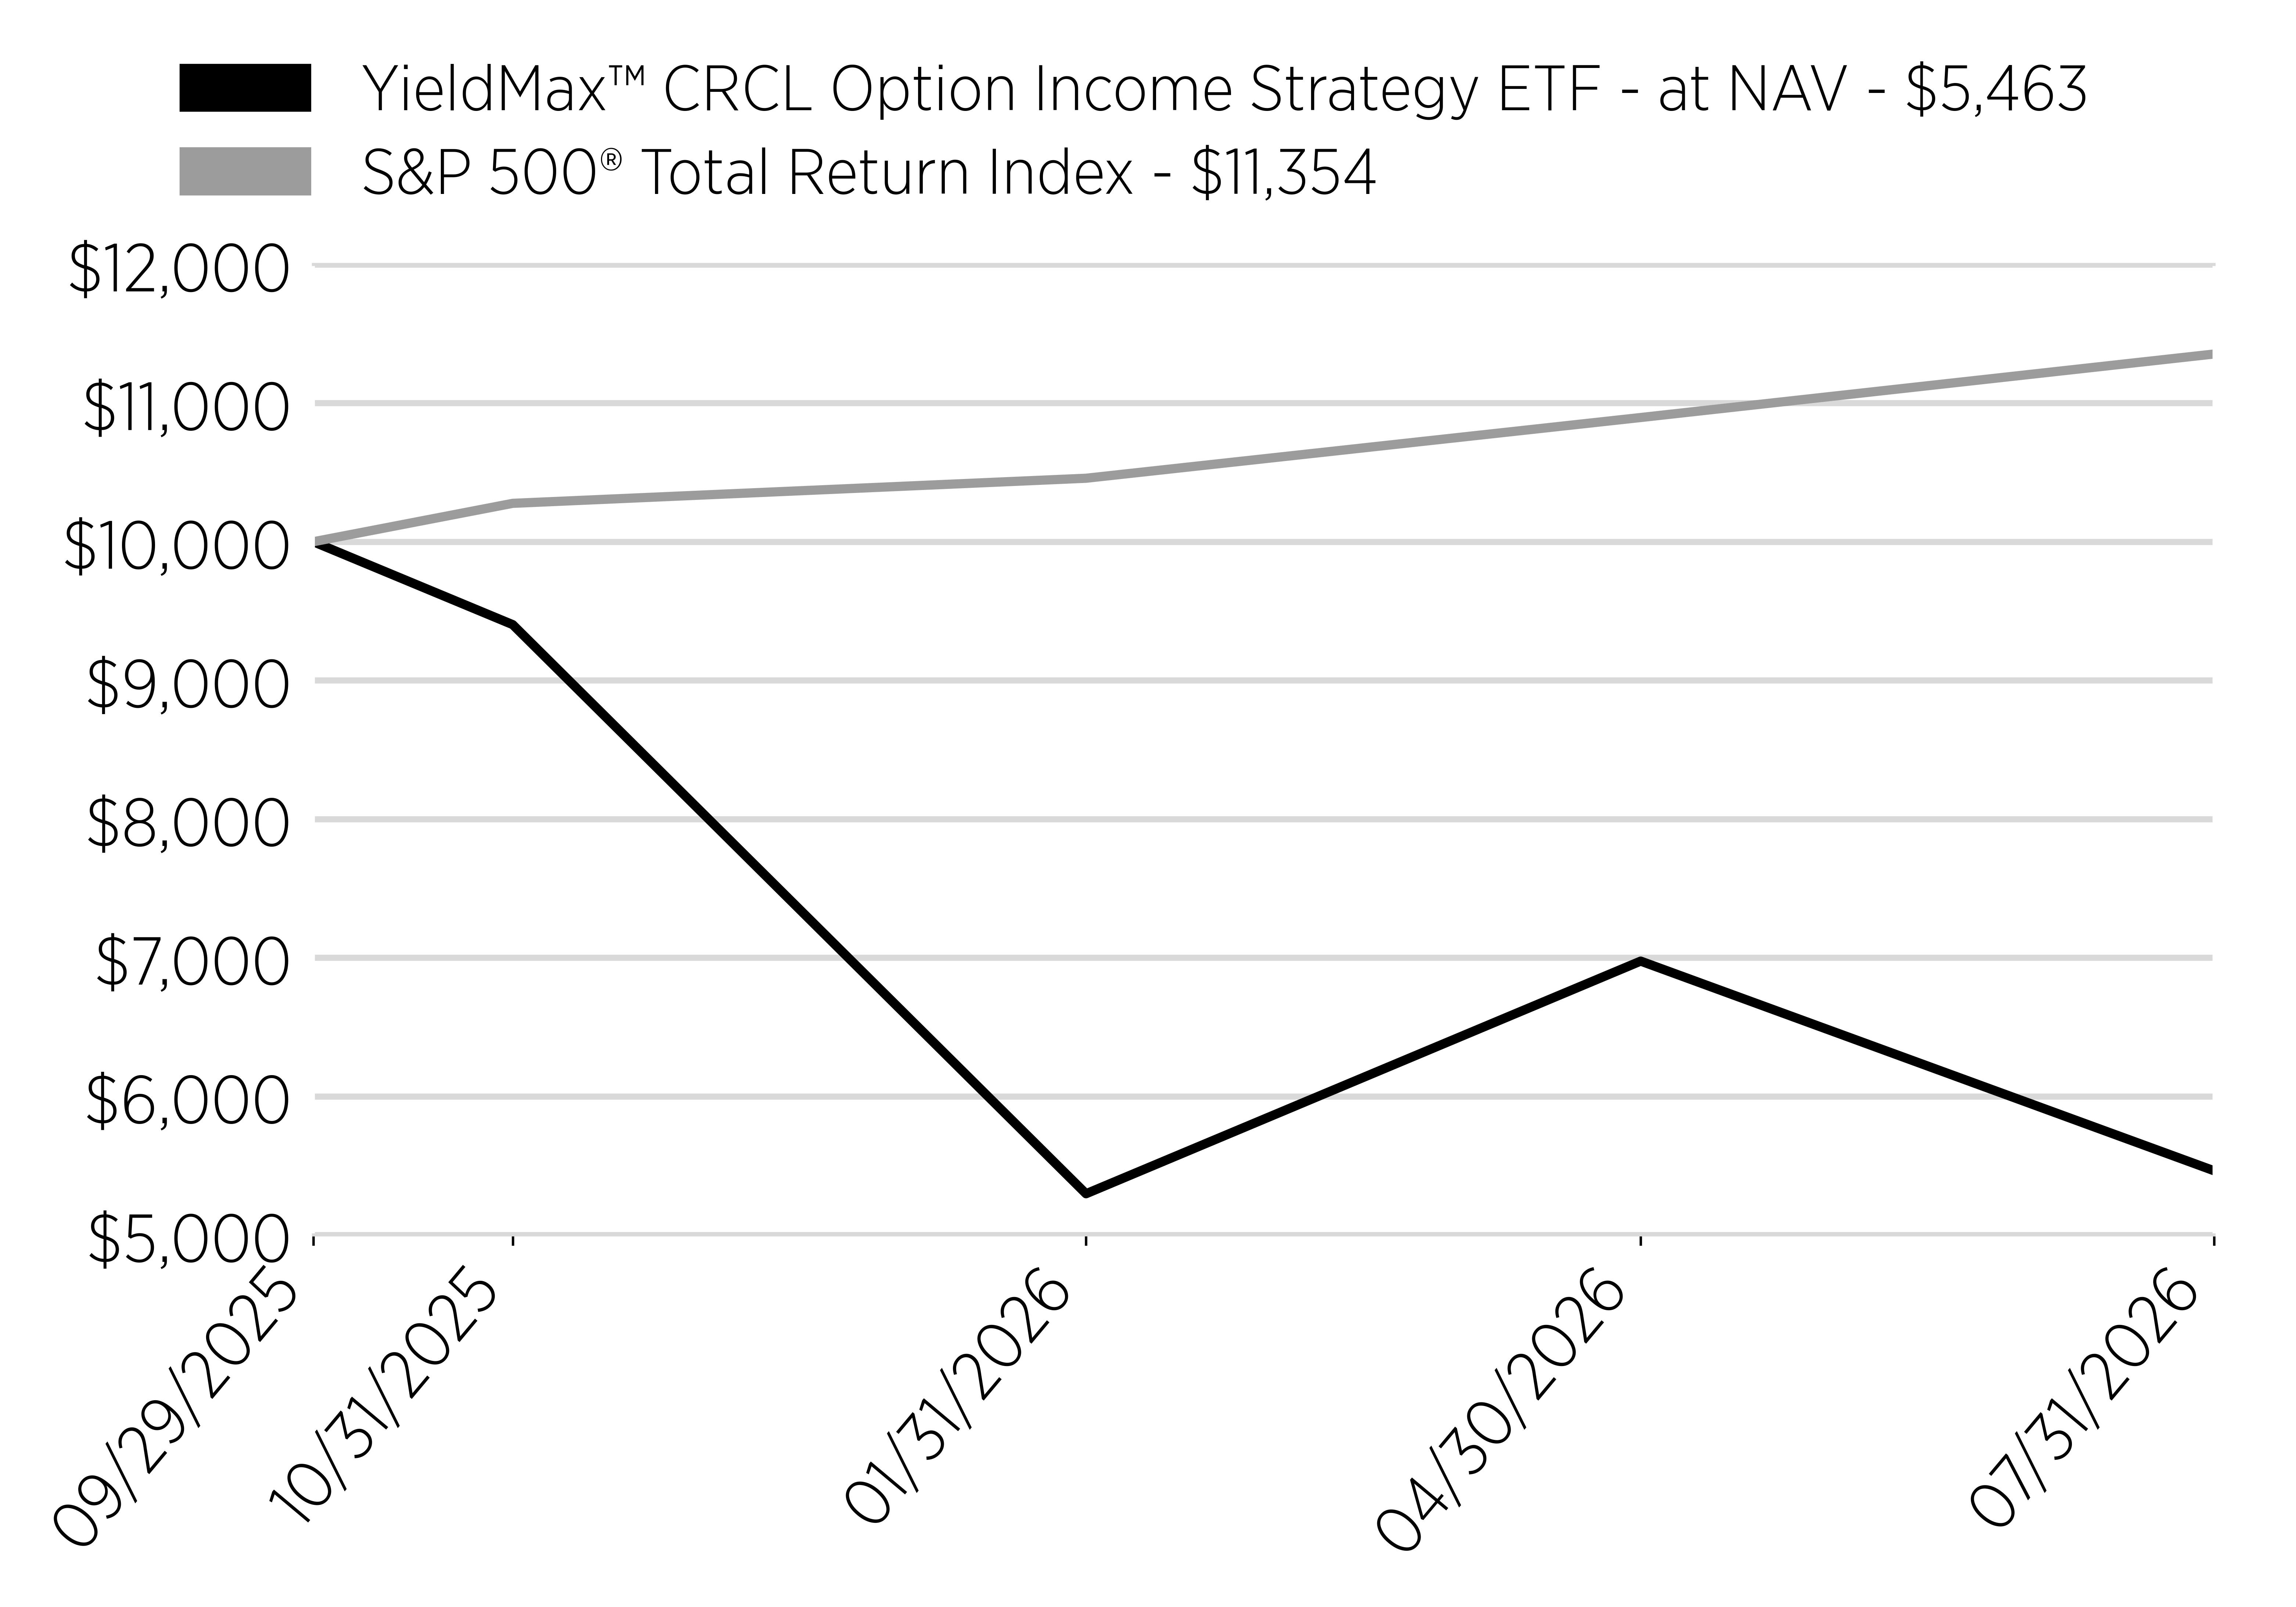
Date
YieldMax™ CRCL Option Income Strategy ETF - at NAV - $5,463
S&P 500® Total Return Index - $11,354
9/29/2025
10000
10000
10/31/2025
9402
10277
1/31/2026
5297
10458
4/30/2026
6975
10896
7/31/2026
5463
11354
line
Average Annual Return [Table Text Block]

Annual Performance

Since Inception (9/29/25)
Yieldmax™ CRCL Option Income Strategy ETF - at NAV
-45.65%*
S&P 500® Total Return Index
13.54%
*Not Annualized for periods less than one year.
Performance Inception Date Sep. 29, 2025
No Deduction of Taxes [Text Block] The graph and table do not reflect the deduction of taxes that a shareholder would pay on fund distributions or redemption of fund shares.
Material Change Date Sep. 29, 2025
Updated Performance Information Location [Text Block] Visit www.yieldmaxetfs.com/our-etfs/crco/ for more recent performance information.
Net Assets $ 18,016,000
Holdings Count | Holdings 10
Advisory Fees Paid, Amount $ 221,142
Investment Company, Portfolio Turnover 0.00%
Additional Fund Statistics [Text Block]

Key Fund Statistics

(as of July 31, 2026)

Fund Size (Thousands)
$18,016
Number of Holdings
10
Total Advisory Fee Paid
$221,142
Portfolio Turnover
0%
Holdings [Text Block]

What did the Fund invest in?

(as of July 31, 2026)

Security Type - Investments

(% of Net Assets)
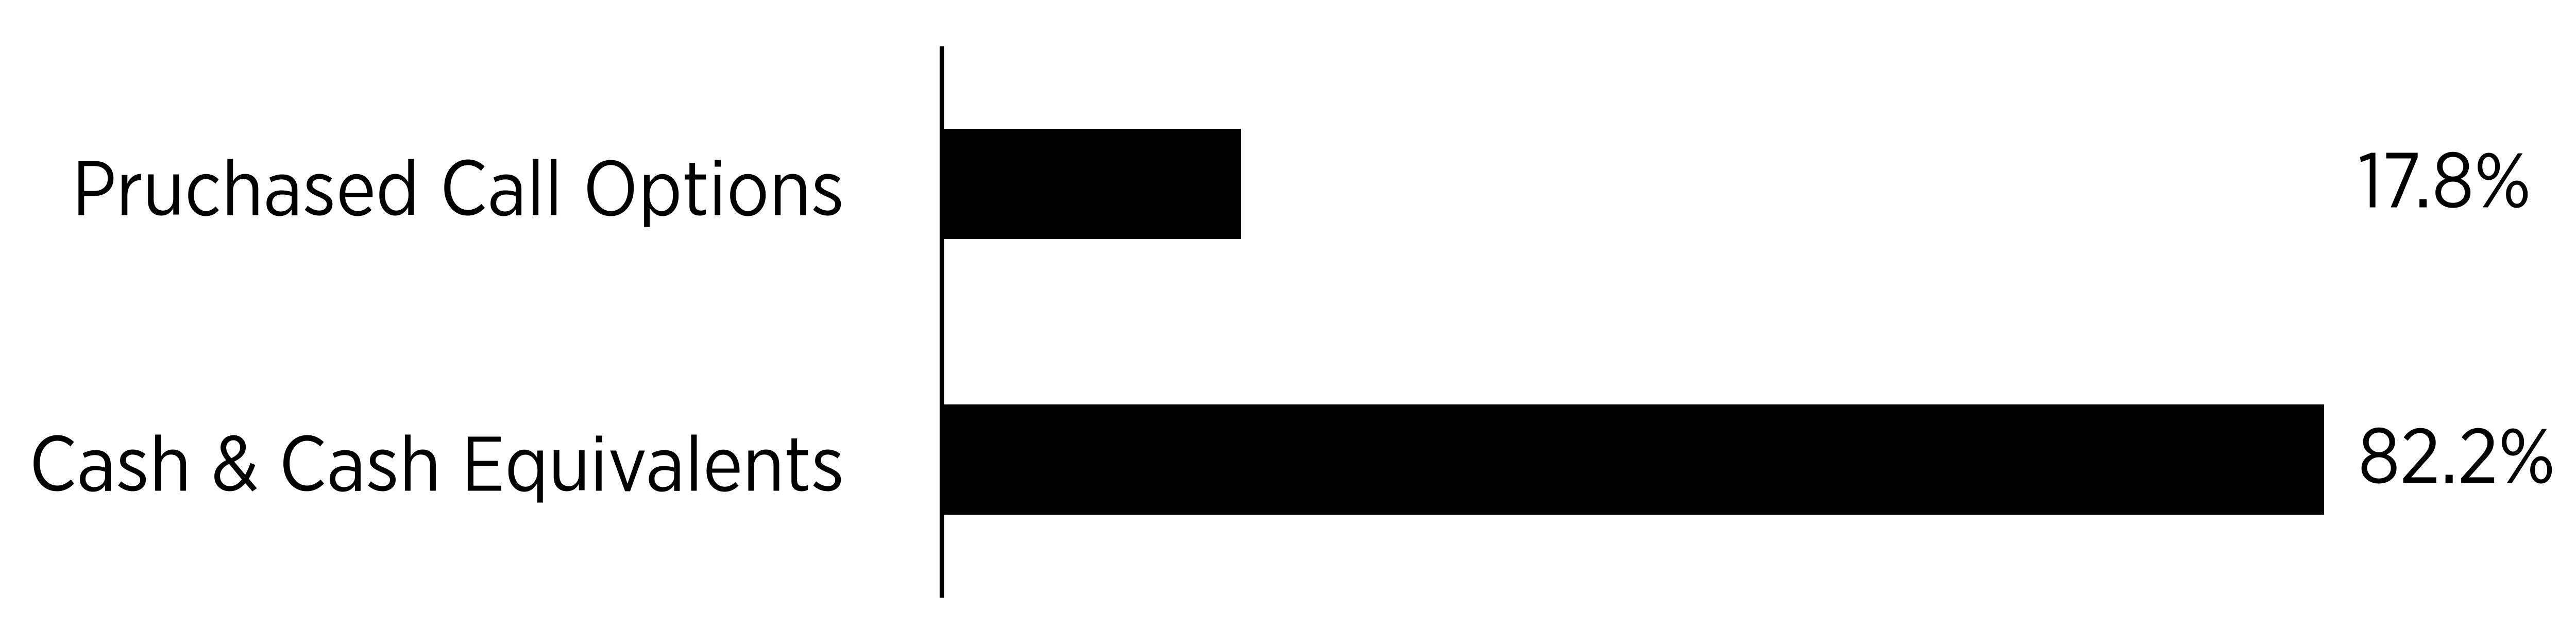
Sector
%
Pruchased Call Options
17.8%
Cash & Cash Equivalents
82.2%
bar


Security Type - Other Financial Instruments

(% of Net Assets)
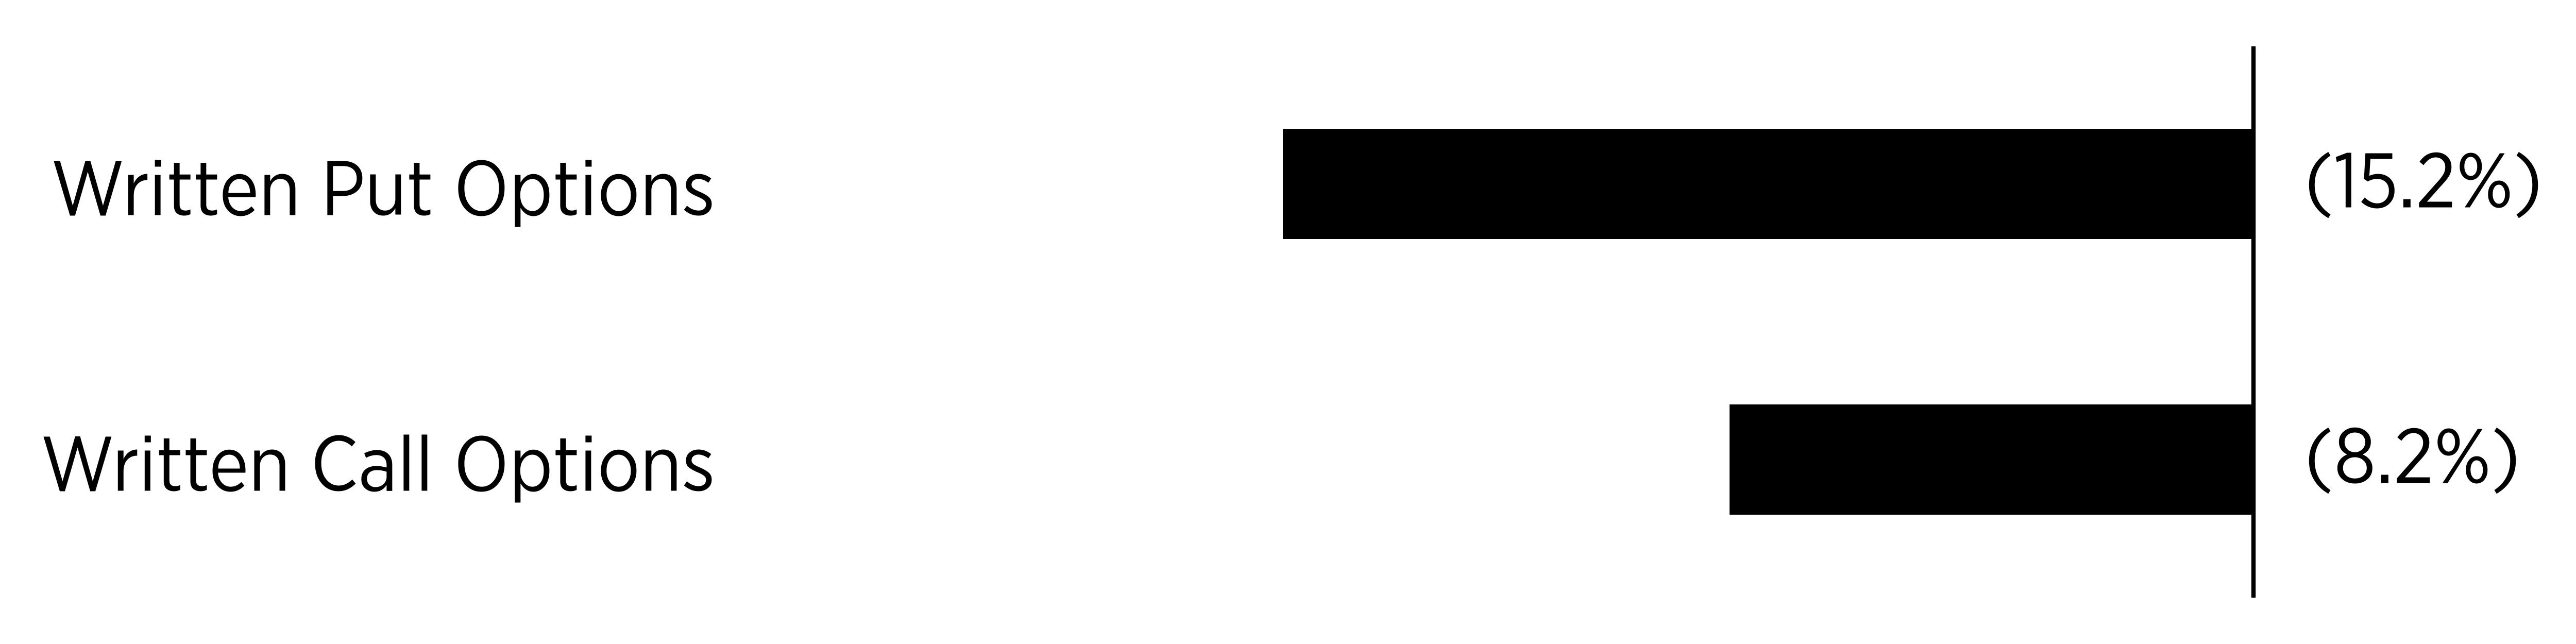
Sector
%
Written Put Options
-15.2%
Written Call Options
-8.2%
bar


Percentages are based on net assets. Cash & Cash Equivalents represents cash, short-term investments, and liabilities in excess of other assets.


Largest Holdings [Text Block]
Top Holdings
(% of Net Assets)
U.S. Treasury Bills
97.3
Circle Internet Group, Inc.,
Expiration: 9/18/2026; Exercise Price: $65.01
-15.2
Circle Internet Group, Inc.,
Expiration: 9/18/2026; Exercise Price: $65.01
11.9
Circle Internet Group, Inc.,
Expiration: 8/7/2026; Exercise Price: $61.00
-4.6
Circle Internet Group, Inc.,
Expiration: 8/7/2026; Exercise Price: $60.00
-3.6
Circle Internet Group, Inc.,
Expiration: 8/7/2026; Exercise Price: $64.00
3.3
First American Government Obligations Fund - Class X, 3.58%
3.1
Circle Internet Group, Inc.,
Expiration: 8/7/2026; Exercise Price: $63.00
2.6
Material Fund Change [Text Block]

Fund Changes

Effective September 29, 2025 the Fund's payment of income distributions was changed to seek to make such distributions on a weekly basis.

YieldMax(R) Crypto Industry & Tech Portfolio Option Income ETF  
Shareholder Report [Line Items]  
Fund Name YieldMax™ Crypto Industry & Tech Portfolio Option Income ETF
Class Name YieldMax™ Crypto Industry & Tech Portfolio Option Income ETF
Trading Symbol LFGY
Security Exchange Name NYSEArca
Annual or Semi-Annual Statement [Text Block] This annual shareholder report contains important information about the YieldMax™ Crypto Industry & Tech Portfolio Option Income ETF (the "Fund") for the period August 1, 2025 to July 31, 2026.
Shareholder Report Annual or Semi-Annual annual shareholder report
Additional Information [Text Block] You can find additional information about the Fund at www.yieldmaxetfs.com/our-etfs/lfgy/. You can also request this information by contacting us at (844) 737-3001 or by writing to YieldMax™ Crypto Industry & Tech Portfolio Option Income ETF, c/o U.S. Bank Global Fund Services, P.O. Box 701, Milwaukee, Wisconsin 53201‑0701.
Additional Information Phone Number (844) 737-3001
Additional Information Website www.yieldmaxetfs.com/our-etfs/lfgy/
Expenses [Text Block]

What were the Fund costs for the past year?

(based on a hypothetical $10,000 investment)

Class Name
Costs of a $10,000 investment
Costs paid as a percentage of a $10,000 investment
YieldMax™ Crypto Industry & Tech Portfolio Option Income ETF
$142
1.47%*
*Costs paid as a percentage of a $10,000 investment is an annualized figure.


Expenses Paid, Amount $ 142
Expense Ratio, Percent 1.47% [4]
Factors Affecting Performance [Text Block]

How Did the Fund Perform During the Reporting Period?

During the reporting period, LFGY generated a slightly negative total return, as income generated through its call spread strategy wasn’t enough to offset periods of sharp weakness across crypto-related equities. The Fund provided shareholders with regular income distributions throughout the period.

What Factors Influenced Performance?

Performance was influenced by the returns of the Fund's underlying portfolio, which included crypto infrastructure and technology companies such as digital asset miners, exchanges, and payments-related businesses. The portfolio experienced significant volatility, including a pronounced drawdown in the first half of 2026 as digital asset prices declined sharply. The Fund generated option premium income through its call spread strategy, with elevated implied volatility across many of its holdings supporting higher premiums, particularly during periods of market stress.

Positioning of the Fund

The Fund remains invested in a portfolio of crypto industry and technology-related companies and continues to employ its call spread strategy to generate income. LFGY seeks to provide current income and capital appreciation through direct investments in a select portfolio of approximately 15 to 30 crypto industry and technology companies.
Performance Past Does Not Indicate Future [Text] The Fund's past performance is not a good indicator of how the Fund will perform in the future.
Line Graph [Table Text Block]

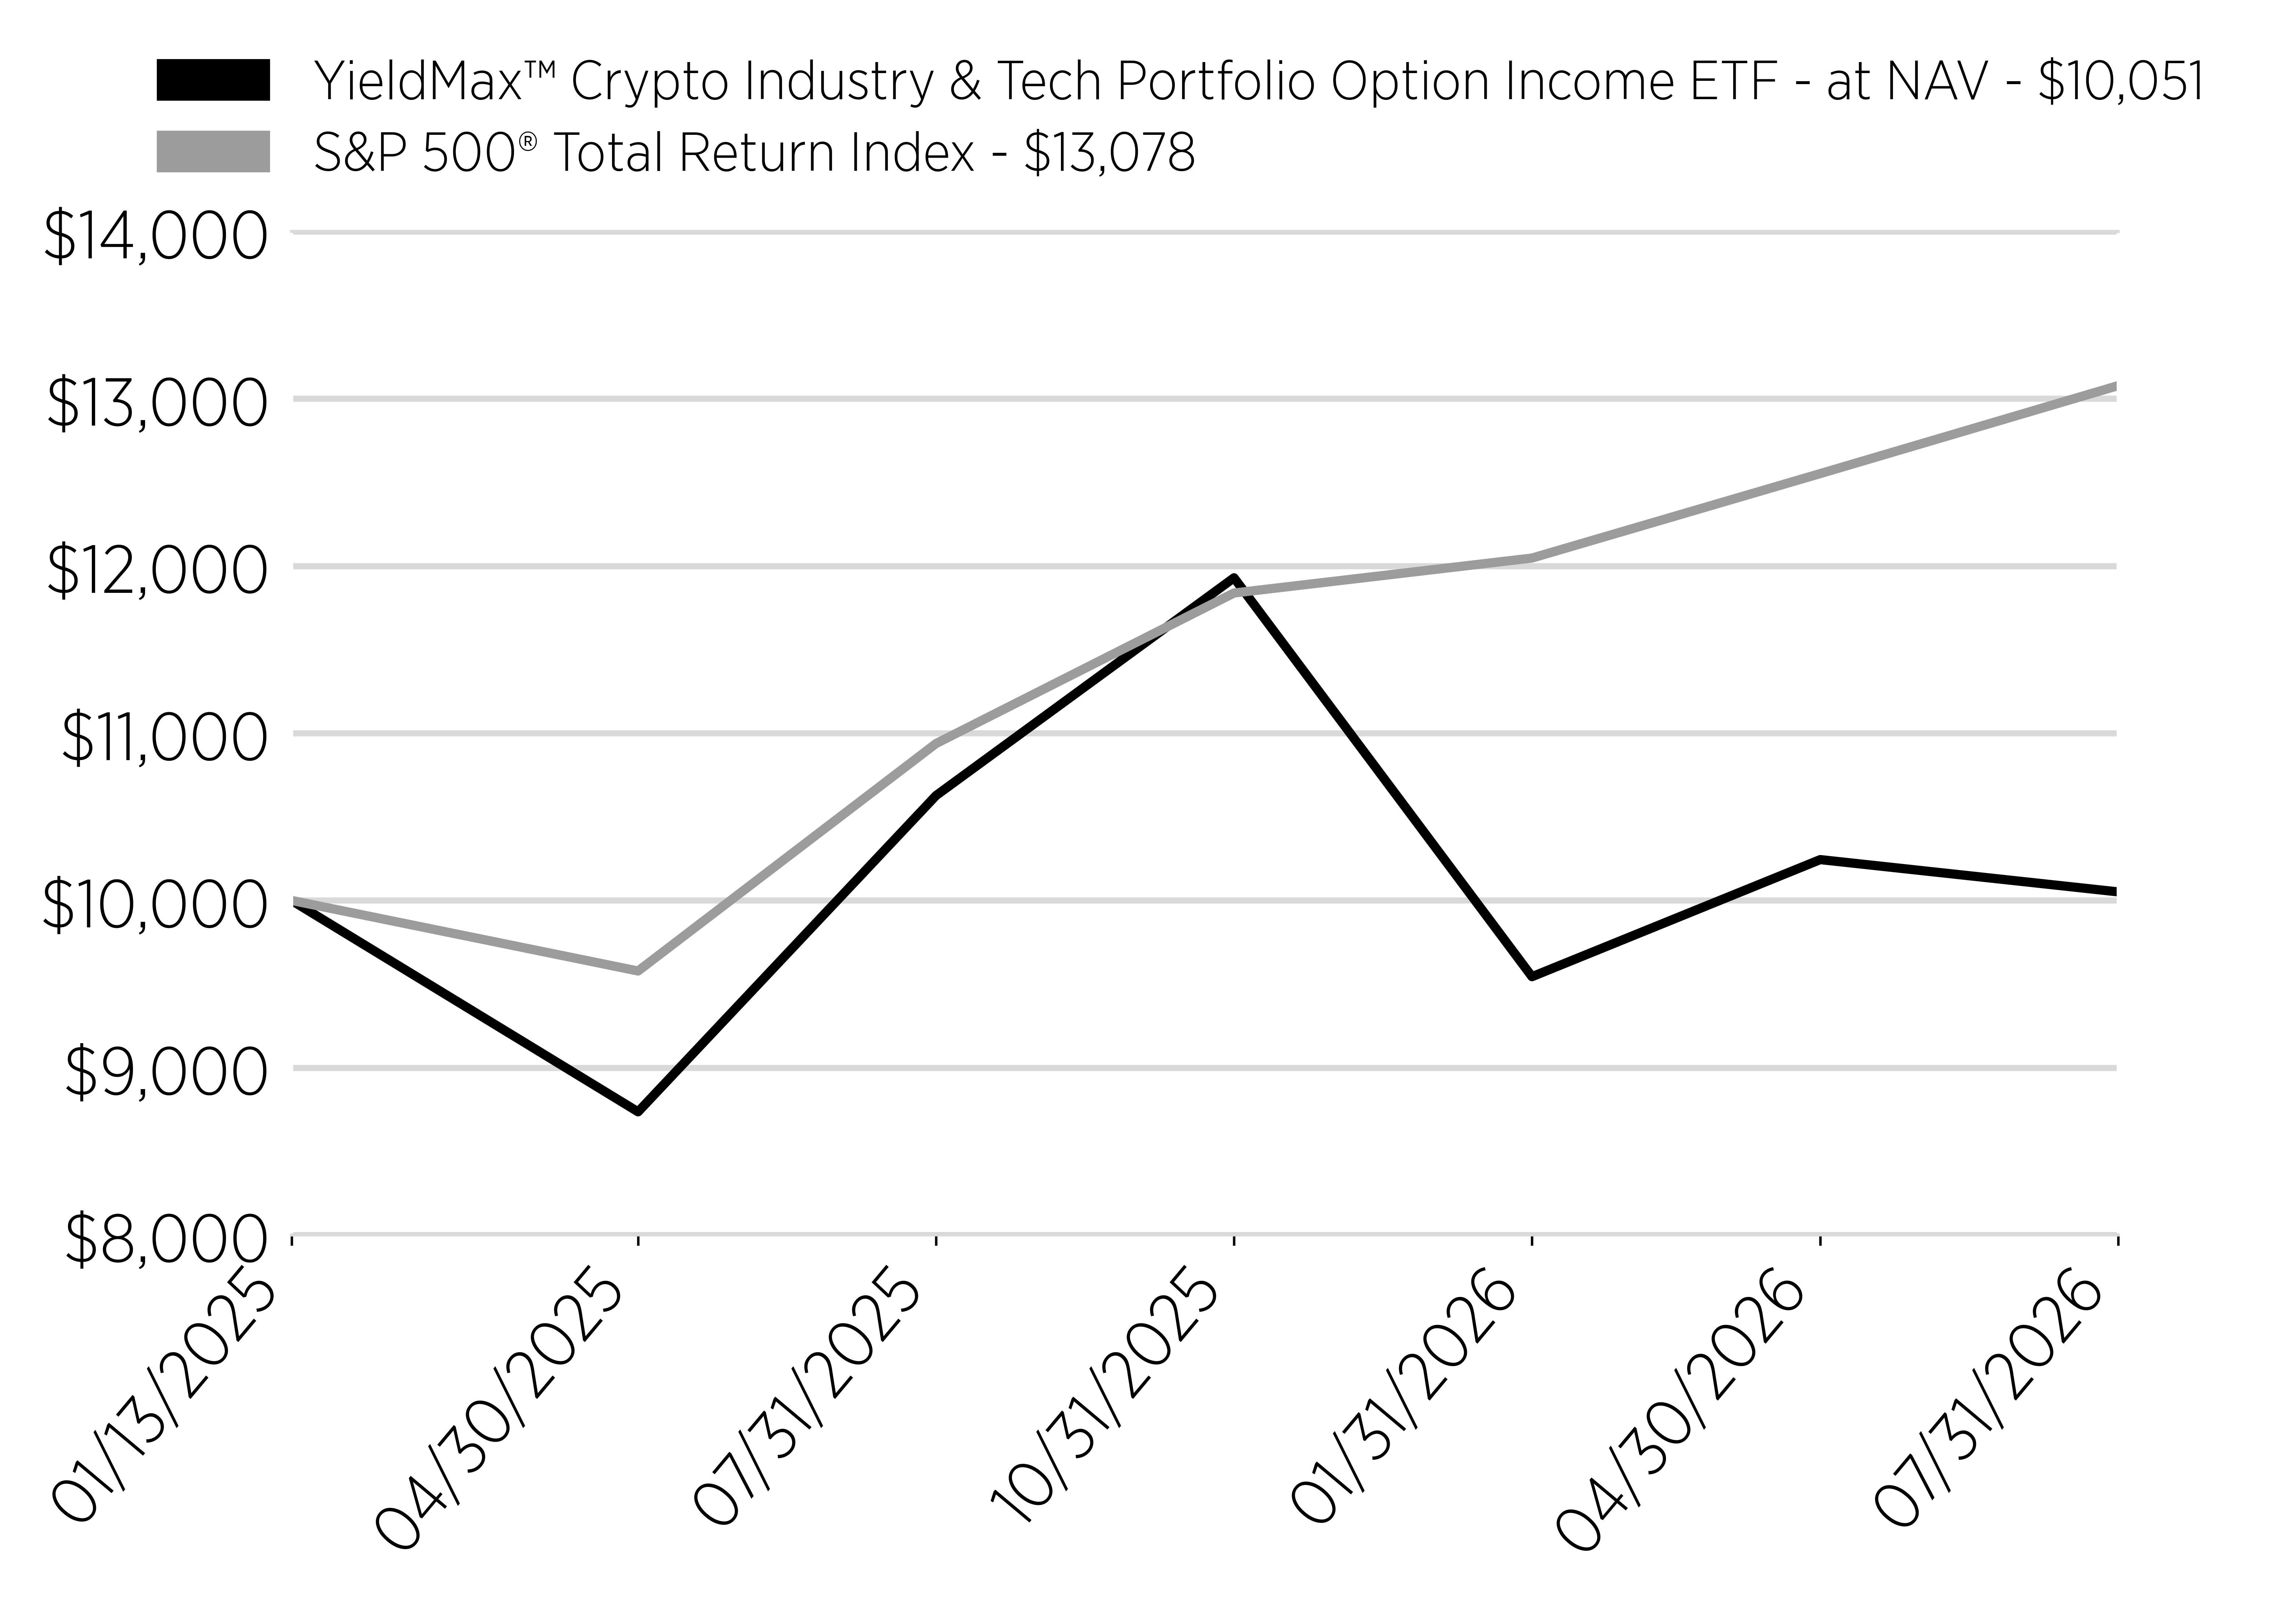
Cumulative Performance

(Initial Investment of $10,000)
Date
YieldMax™ Crypto Industry & Tech Portfolio Option Income ETF - at NAV - $10,051
S&P 500® Total Return Index - $13,078
1/13/2025
10000
10000
4/30/2025
8736
9578
7/31/2025
10627
10938
10/31/2025
11929
11838
1/31/2026
9544
12047
4/30/2026
10244
12552
7/31/2026
10051
13078
line
Average Annual Return [Table Text Block]

Annual Performance

1 Year
Since Inception (1/13/25)
Yieldmax™ Crypto Industry & Tech Portfolio Option Income ETF - at NAV
-5.45%
0.33%
S&P 500® Total Return Index
19.56%
18.97%
Performance Inception Date Jan. 13, 2025
No Deduction of Taxes [Text Block] The graph and table do not reflect the deduction of taxes that a shareholder would pay on fund distributions or redemption of fund shares.
Material Change Date Oct. 14, 2025
Updated Performance Information Location [Text Block] Visit www.yieldmaxetfs.com/our-etfs/lfgy/ for more recent performance information.
Net Assets $ 91,274,000
Holdings Count | Holdings 86
Advisory Fees Paid, Amount $ 1,456,353
Investment Company, Portfolio Turnover 56.00%
Additional Fund Statistics [Text Block]

Key Fund Statistics

(as of July 31, 2026)

Fund Size (Thousands)
$91,274
Number of Holdings
86
Total Advisory Fee Paid
$1,456,353
Portfolio Turnover
56%
Holdings [Text Block]

What did the Fund invest in?

(as of July 31, 2026)

Security Type - Investments

(% of Net Assets)
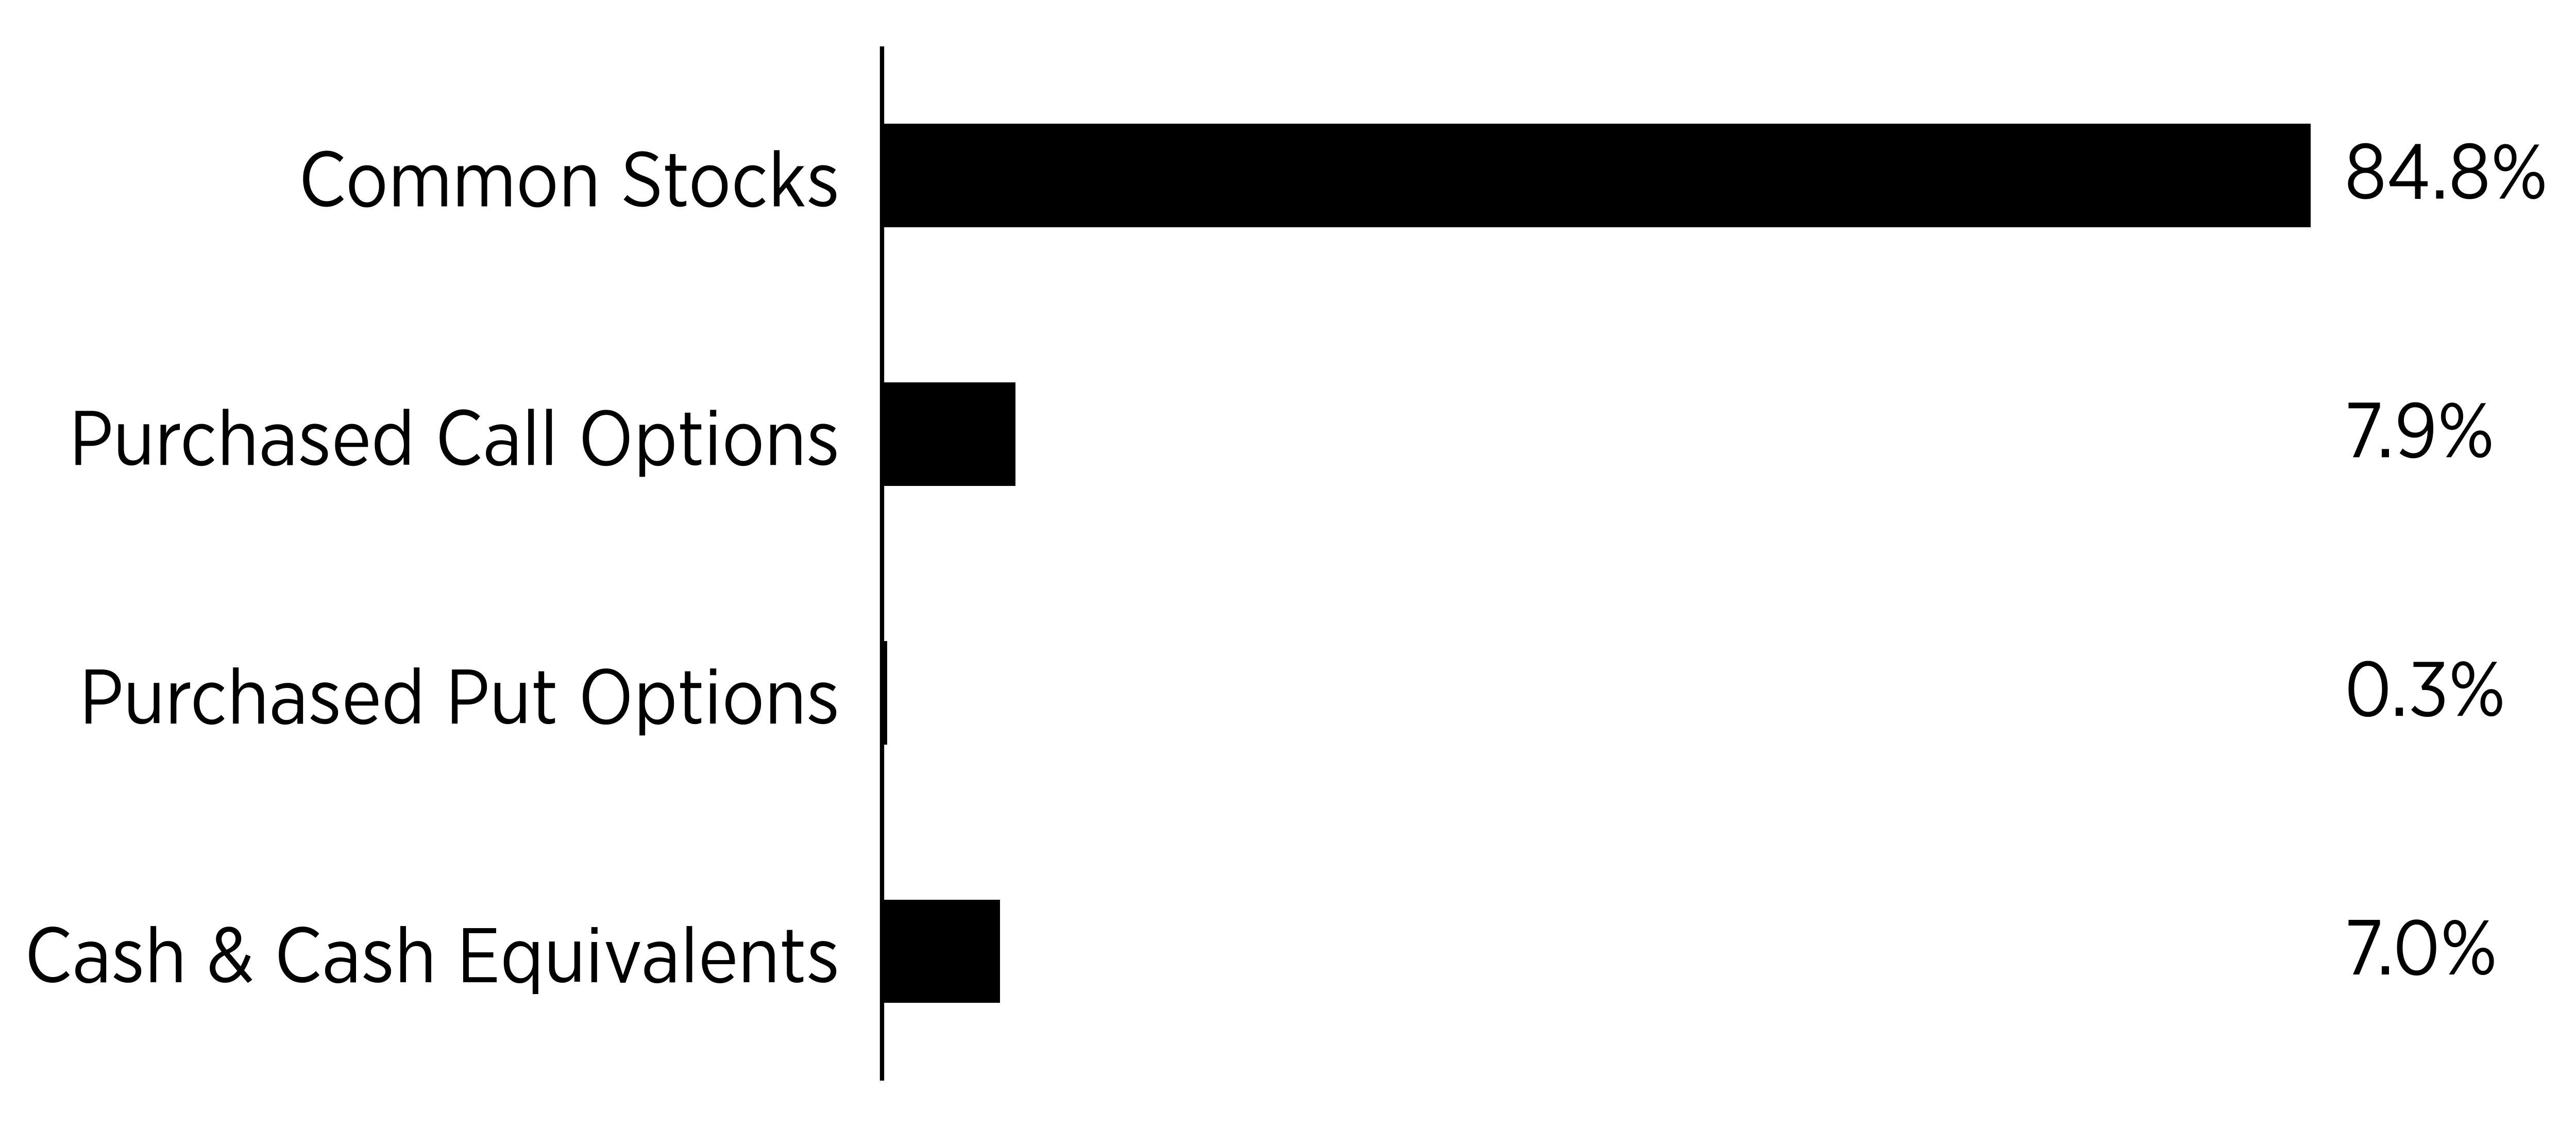
Sector
%
Common Stocks
84.8%
Purchased Call Options
7.9%
Purchased Put Options
0.3%
Cash & Cash Equivalents
7.0%
bar


Security Type - Other Financial Instruments

(% of Net Assets)
Sector
%
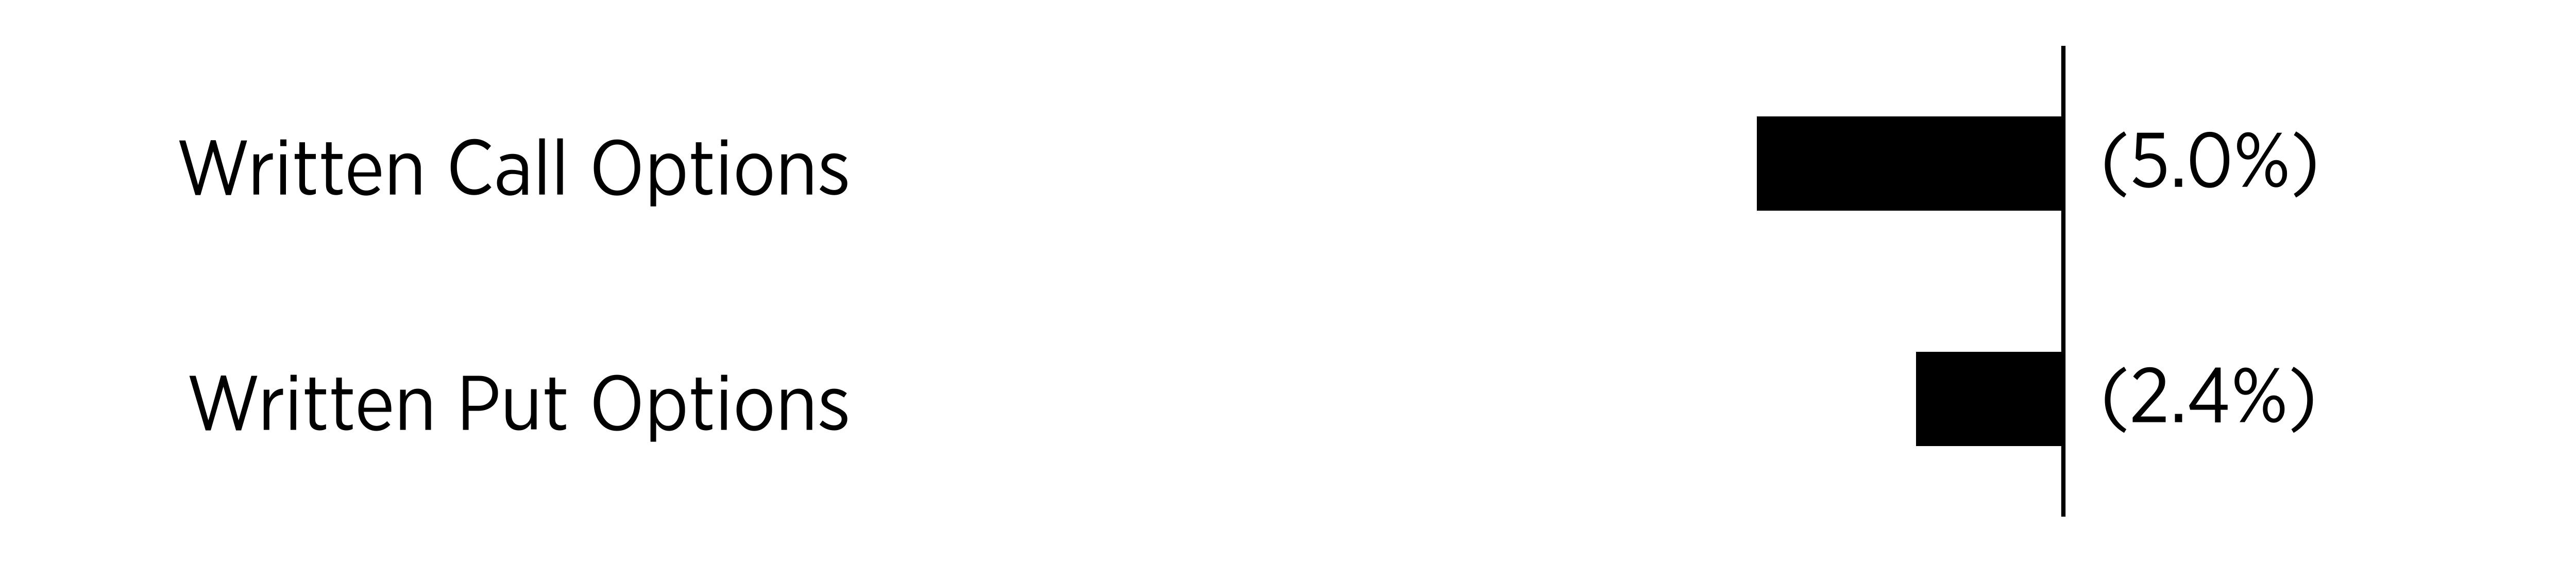
Written Call Options
-5.0%
Written Put Options
-2.4%
bar


Percentages are based on net assets. Cash & Cash Equivalents represents cash, short-term investments, and liabilities in excess of other assets.


Largest Holdings [Text Block]
Top Holdings
(% of Net Assets)
First American Government Obligations Fund - Class X, 3.58%
10.2
Block, Inc. - Class A
6.4
PayPal Holdings, Inc.
6.2
Opera Ltd., ADR
5.9
Cipher Digital, Inc.
5.8
NVIDIA Corp.
5.7
Hut 8 Corp.
5.7
Riot Platforms, Inc.
5.1
Core Scientific, Inc.
4.6
MercadoLibre, Inc.
4.0
Material Fund Change [Text Block]

Fund Changes

Effective October 14, 2025 the Fund's payment of income distributions was changed to seek to make such distributions on a weekly basis.

YieldMax(R) GME Option Income Strategy ETF  
Shareholder Report [Line Items]  
Fund Name YieldMax™ GME Option Income Strategy ETF
Class Name YieldMax™ GME Option Income Strategy ETF
Trading Symbol GMEY
Security Exchange Name NYSEArca
Annual or Semi-Annual Statement [Text Block] This annual shareholder report contains important information about the YieldMax™ GME Option Income Strategy ETF (the "Fund") for the period August 1, 2025 to July 31, 2026.
Shareholder Report Annual or Semi-Annual annual shareholder report
Additional Information [Text Block] You can find additional information about the Fund at www.yieldmaxetfs.com/our-etfs/gmey/. You can also request this information by contacting us at (844) 737-3001 or by writing to YieldMax™ GME Option Income Strategy ETF, c/o U.S. Bank Global Fund Services, P.O. Box 701, Milwaukee, Wisconsin 53201‑0701.
Additional Information Phone Number (844) 737-3001
Additional Information Website www.yieldmaxetfs.com/our-etfs/gmey/
Expenses [Text Block]

What were the Fund costs for the past year?

(based on a hypothetical $10,000 investment)

Class Name
Costs of a $10,000 investment
Costs paid as a percentage of a $10,000 investment
YieldMax™ GME Option Income Strategy ETF
$86*
1.03%**
*The Fund commenced operations on September 8, 2025. Expenses for a full reporting period would be higher than the figures shown.
**Costs paid as a percentage of a $10,000 investment is an annualized figure.


Expenses Paid, Amount $ 86 [5]
Expense Ratio, Percent 1.03% [6]
Expenses Short Period Footnote [Text Block] The Fund commenced operations on September 8, 2025. Expenses for a full reporting period would be higher than the figures shown.
Factors Affecting Performance [Text Block]

How Did the Fund Perform During the Reporting Period?

The Fund had a negative total return as declines in GameStop Corp. (“GME”) outweighed income generated by its call spread strategy. The Fund also provided shareholders with regular income distributions.

What Factors Influenced Performance?

Performance was primarily influenced by GME’s share price and implied volatility. Declines in GME detracted from results, while option premiums partially offset those losses.

Positioning of the Fund

The Fund continued to sell call spreads to generate current income while maintaining exposure to a portion of GME’s performance.
Performance Past Does Not Indicate Future [Text] The Fund's past performance is not a good indicator of how the Fund will perform in the future.
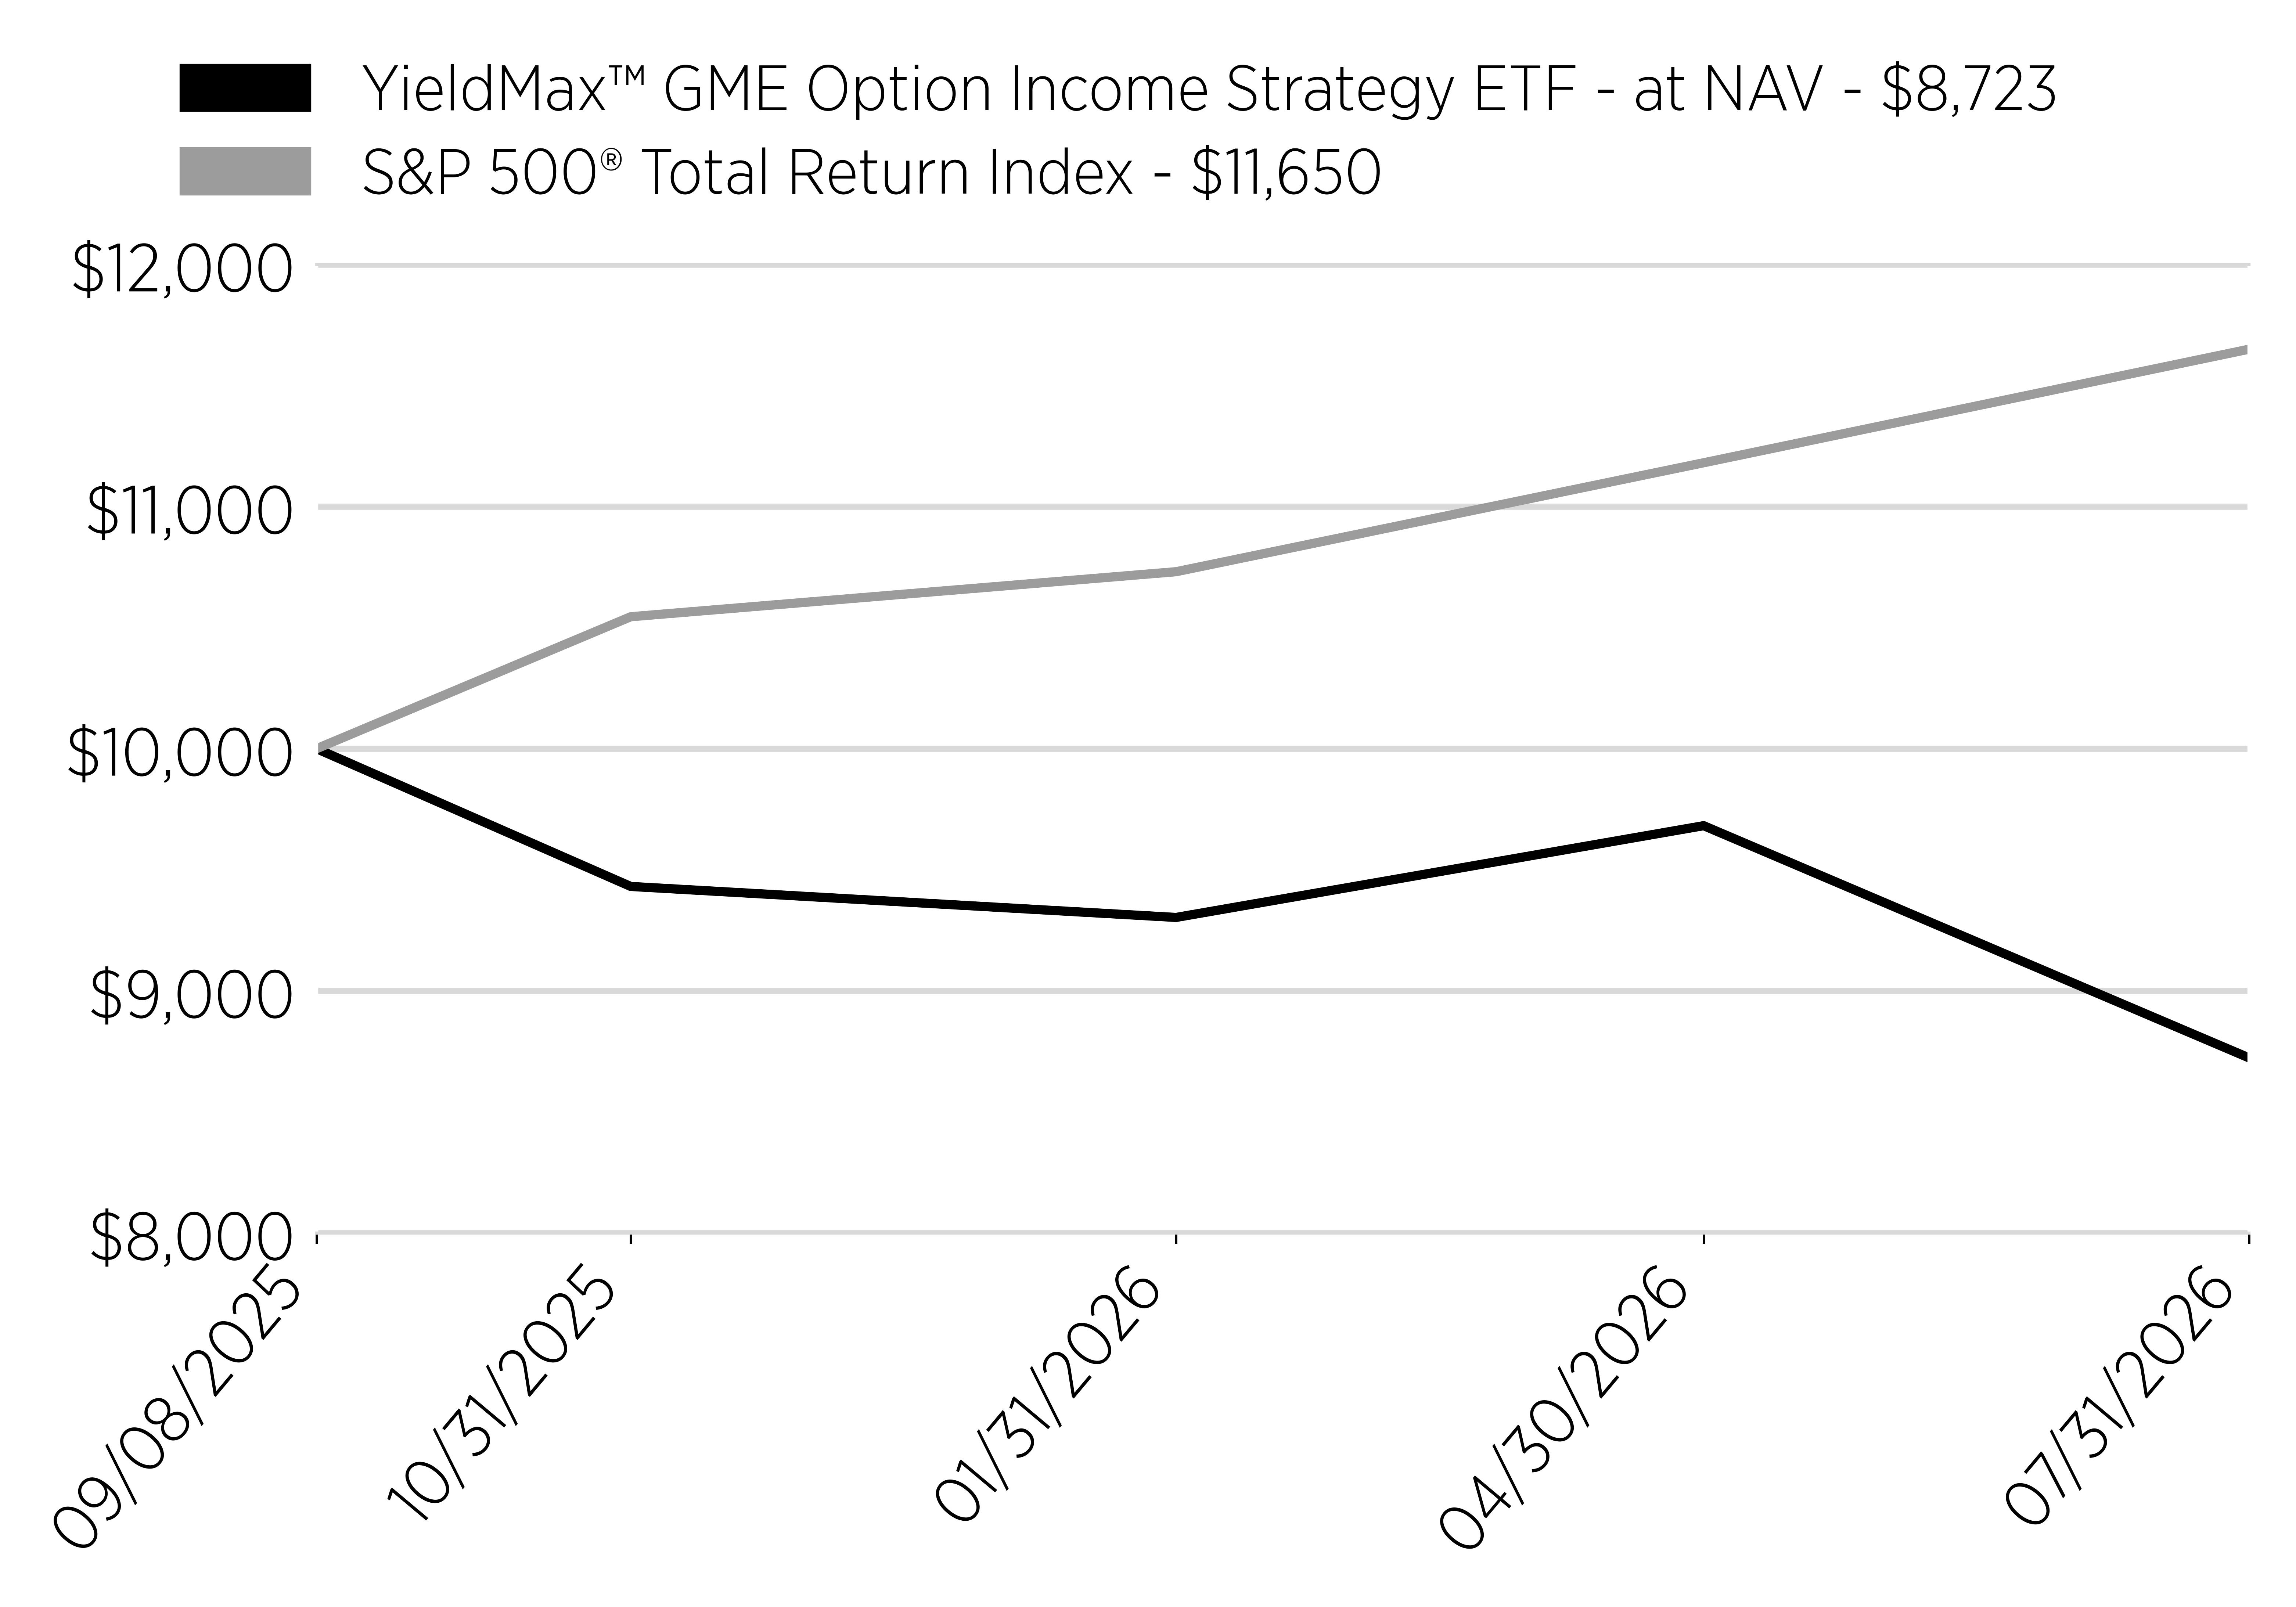
Line Graph [Table Text Block]

Cumulative Performance

(Initial Investment of $10,000)
Date
YieldMax™ GME Option Income Strategy ETF - at NAV - $8,723
S&P 500® Total Return Index - $11,650
9/8/2025
10000
10000
10/31/2025
9431
10545
1/31/2026
9303
10731
4/30/2026
9682
11181
7/31/2026
8723
11650
line
Average Annual Return [Table Text Block]

Annual Performance

Since Inception (9/8/25)
Yieldmax™ GME Option Income Strategy ETF - at NAV
-12.94%*
S&P 500® Total Return Index
16.50%
*Not Annualized for periods less than one year.
Performance Inception Date Sep. 08, 2025
No Deduction of Taxes [Text Block] The graph and table do not reflect the deduction of taxes that a shareholder would pay on fund distributions or redemption of fund shares.
Material Change Date Sep. 18, 2025
Updated Performance Information Location [Text Block] Visit www.yieldmaxetfs.com/our-etfs/gmey/ for more recent performance information.
Net Assets $ 2,738,000
Holdings Count | Holdings 9
Advisory Fees Paid, Amount $ 86,135
Investment Company, Portfolio Turnover 0.00%
Additional Fund Statistics [Text Block]

Key Fund Statistics

(as of July 31, 2026)

Fund Size (Thousands)
$2,738
Number of Holdings
9
Total Advisory Fee Paid
$86,135
Portfolio Turnover
0%
Holdings [Text Block]

What did the Fund invest in?

(as of July 31, 2026)

Security Type - Investments

(% of Net Assets)
Sector
%
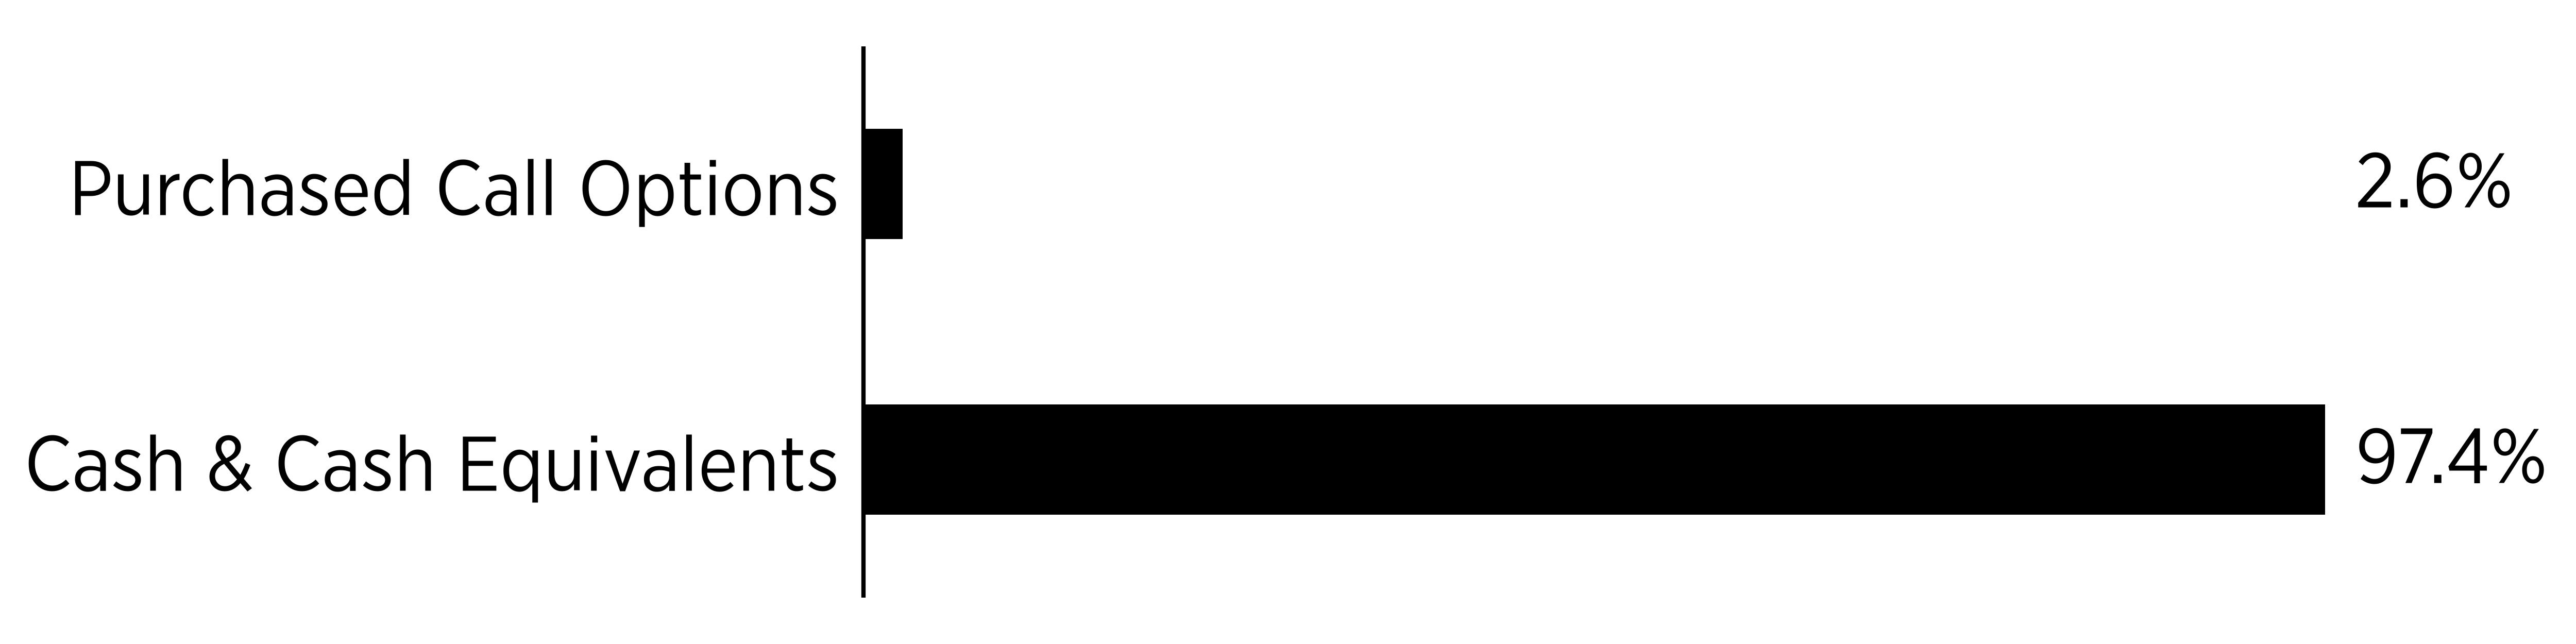
Purchased Call Options
2.6%
Cash & Cash Equivalents
97.4%
bar


Security Type - Other Financial Instruments

(% of Net Assets)
Sector
%
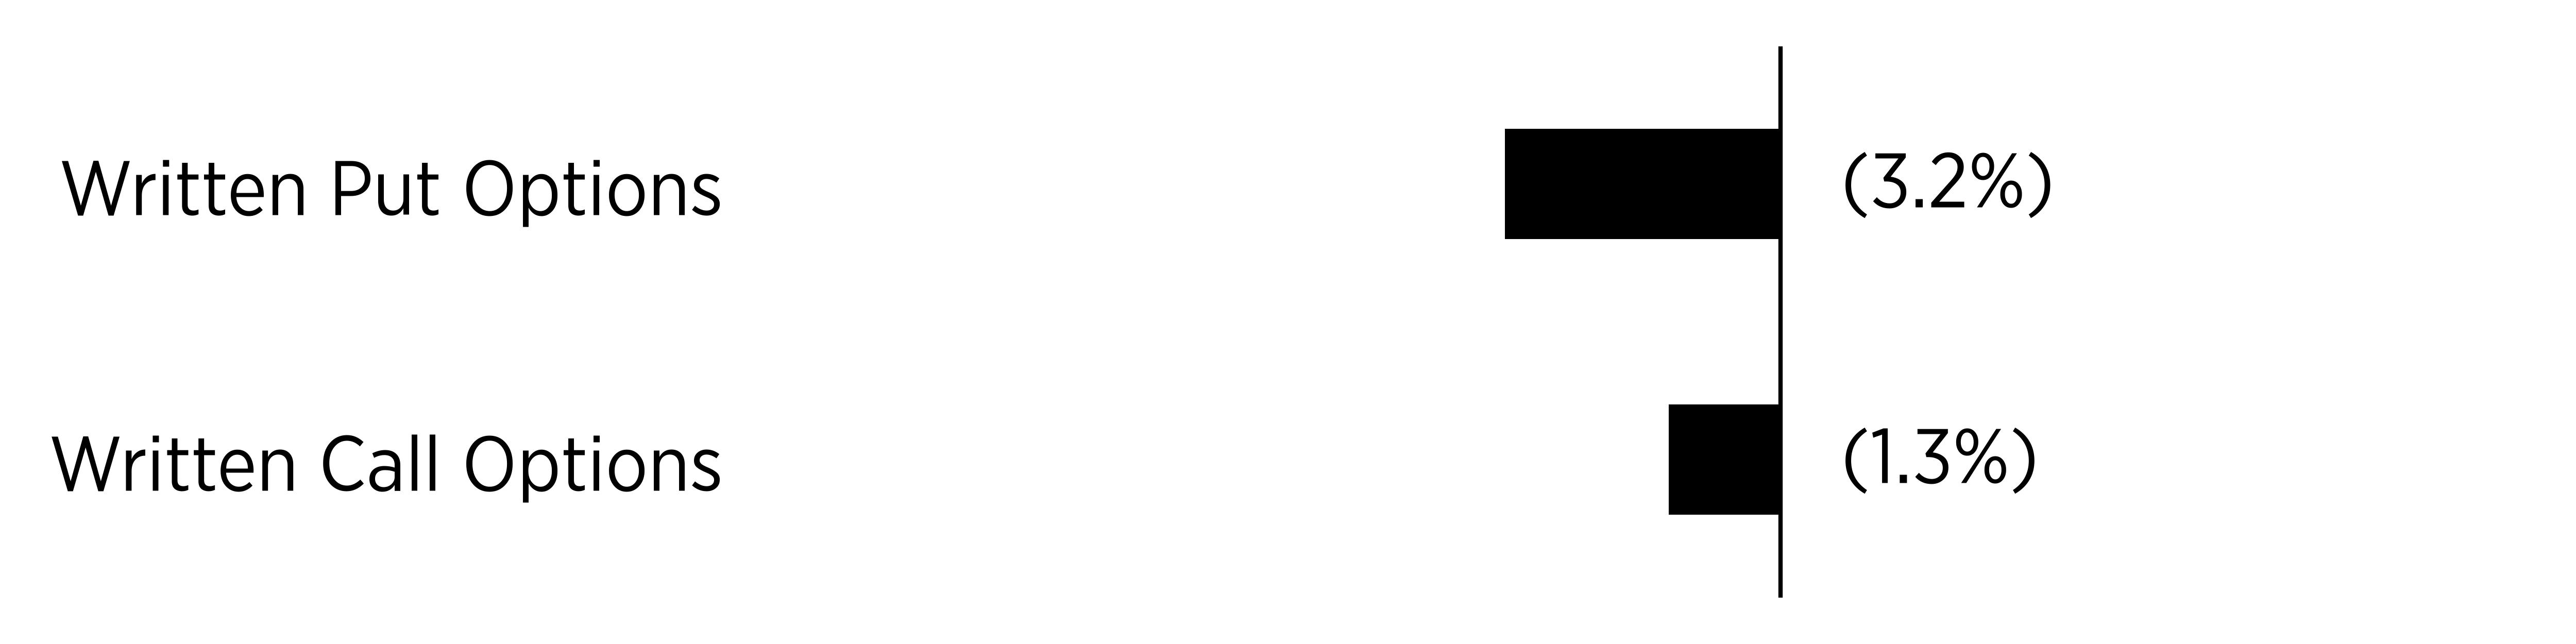
Written Put Options
-3.2%
Written Call Options
-1.3%
bar


Percentages are based on net assets. Cash & Cash Equivalents represents cash, short-term investments and other assets in excess of liabilities.


Largest Holdings [Text Block]
Top Holdings
(% of Net Assets)
First American Government Obligations Fund - Class X, 3.58%
58.7
U.S. Treasury Bills
36.5
GameStop Corp., Expiration: 8/21/2026; Exercise Price: $22.01
-3.2
GameStop Corp., Expiration: 8/21/2026; Exercise Price: $22.01
2.2
GameStop Corp., Expiration: 8/7/2026; Exercise Price: $21.50
-0.7
GameStop Corp., Expiration: 8/7/2026; Exercise Price: $22.00
-0.6
GameStop Corp., Expiration: 8/7/2026; Exercise Price: $23.00
0.2
GameStop Corp., Expiration: 8/7/2026; Exercise Price: $22.50
0.2
Material Fund Change [Text Block]

Fund Changes

Effective September 18, 2025 the Fund's payment of income distributions was changed to seek to make such distributions on a monthly or more frequent basis.

Effective October 14, 2025 the Fund's payment of income distributions was changed to seek to make such distributions on a weekly basis.

YieldMax(R) HIMS Option Income Strategy ETF  
Shareholder Report [Line Items]  
Fund Name YieldMax™ HIMS Option Income Strategy ETF
Class Name YieldMax™ HIMS Option Income Strategy ETF
Trading Symbol HIYY
Security Exchange Name NYSEArca
Annual or Semi-Annual Statement [Text Block] This annual shareholder report contains important information about the YieldMax™ HIMS Option Income Strategy ETF (the "Fund") for the period August 1, 2025 to July 31, 2026.
Shareholder Report Annual or Semi-Annual annual shareholder report
Additional Information [Text Block] You can find additional information about the Fund at www.yieldmaxetfs.com/our-etfs/hiyy/. You can also request this information by contacting us at (844) 737-3001 or by writing to YieldMax™ HIMS Option Income Strategy ETF, c/o U.S. Bank Global Fund Services, P.O. Box 701, Milwaukee, Wisconsin 53201‑0701.
Additional Information Phone Number (844) 737-3001
Additional Information Website www.yieldmaxetfs.com/our-etfs/hiyy/
Expenses [Text Block]

What were the Fund costs for the past year?

(based on a hypothetical $10,000 investment)

Class Name
Costs of a $10,000 investment
Costs paid as a percentage of a $10,000 investment
YieldMax™ HIMS Option Income Strategy ETF
$121*
1.89%**
*The Fund commenced operations on September 22, 2025. Expenses for a full reporting period would be higher than the figures shown.
**Costs paid as a percentage of a $10,000 investment is an annualized figure.


Expenses Paid, Amount $ 121 [7]
Expense Ratio, Percent 1.89% [8]
Expenses Short Period Footnote [Text Block] The Fund commenced operations on September 22, 2025. Expenses for a full reporting period would be higher than the figures shown.
Factors Affecting Performance [Text Block]

How Did the Fund Perform During the Reporting Period?

The Fund had a negative total return as declines in Hims & Hers Health, Inc. (“HIMS”) outweighed income generated by its call spread strategy. The Fund also provided shareholders with regular income distributions.

What Factors Influenced Performance?

Performance was primarily influenced by HIMS’s share price and implied volatility. Declines in HIMS detracted from results, while option premiums partially offset those losses.

Positioning of the Fund

The Fund continued to sell call spreads to generate current income while maintaining exposure to a portion of HIMS’s performance.
Performance Past Does Not Indicate Future [Text] The Fund's past performance is not a good indicator of how the Fund will perform in the future.
Line Graph [Table Text Block]

Cumulative Performance

(Initial Investment of $10,000)
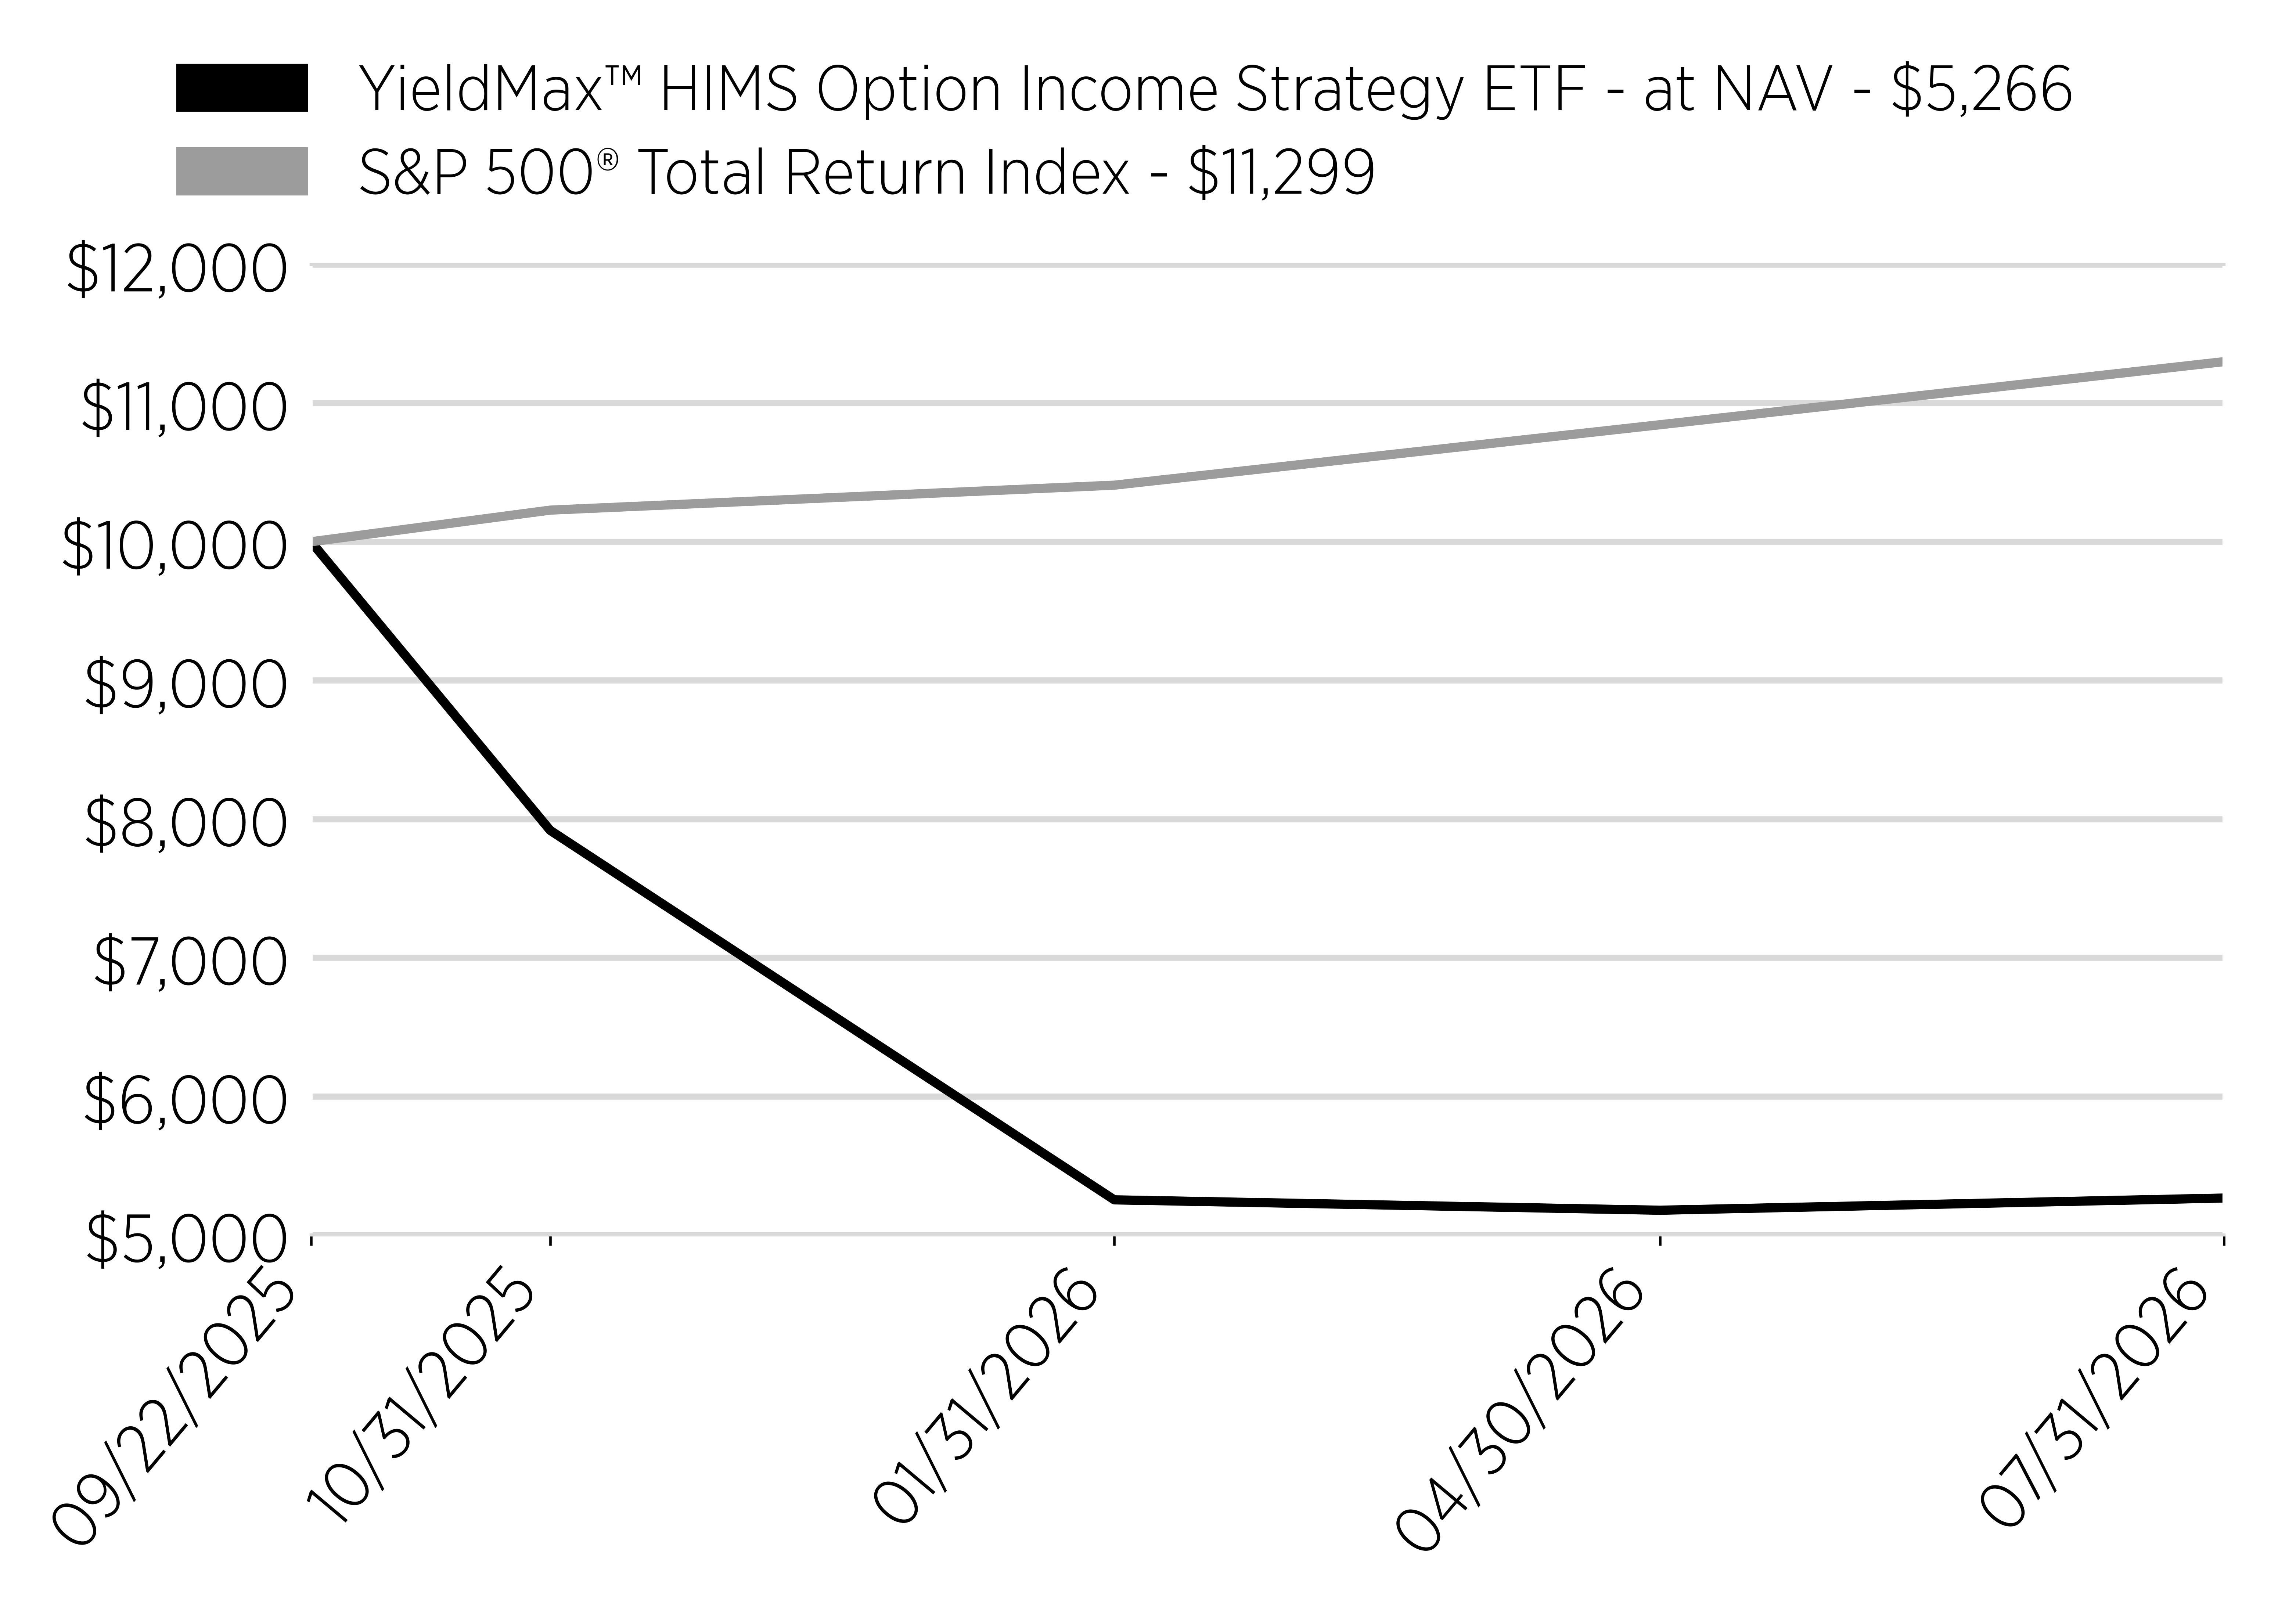
Date
YieldMax™ HIMS Option Income Strategy ETF - at NAV - $5,266
S&P 500® Total Return Index - $11,299
9/22/2025
10000
10000
10/31/2025
7918
10228
1/31/2026
5253
10408
4/30/2026
5178
10844
7/31/2026
5266
11299
line
Average Annual Return [Table Text Block]

Annual Performance

Since Inception (9/22/25)
Yieldmax™ HIMS Option Income Strategy ETF - at NAV
-48.42%*
S&P 500® Total Return Index
12.99%
*Not Annualized for periods less than one year.
Performance Inception Date Sep. 22, 2025
No Deduction of Taxes [Text Block] The graph and table do not reflect the deduction of taxes that a shareholder would pay on fund distributions or redemption of fund shares.
Material Change Date Sep. 18, 2025
Updated Performance Information Location [Text Block] Visit www.yieldmaxetfs.com/our-etfs/hiyy/ for more recent performance information.
Net Assets $ 13,387,000
Holdings Count | Holdings 12
Advisory Fees Paid, Amount $ 139,333
Investment Company, Portfolio Turnover 0.00%
Additional Fund Statistics [Text Block]

Key Fund Statistics

(as of July 31, 2026)

Fund Size (Thousands)
$13,387
Number of Holdings
12
Total Advisory Fee Paid
$139,333
Portfolio Turnover
0%
Holdings [Text Block]

What did the Fund invest in?

(as of July 31, 2026)

Security Type - Investments

(% of Net Assets)
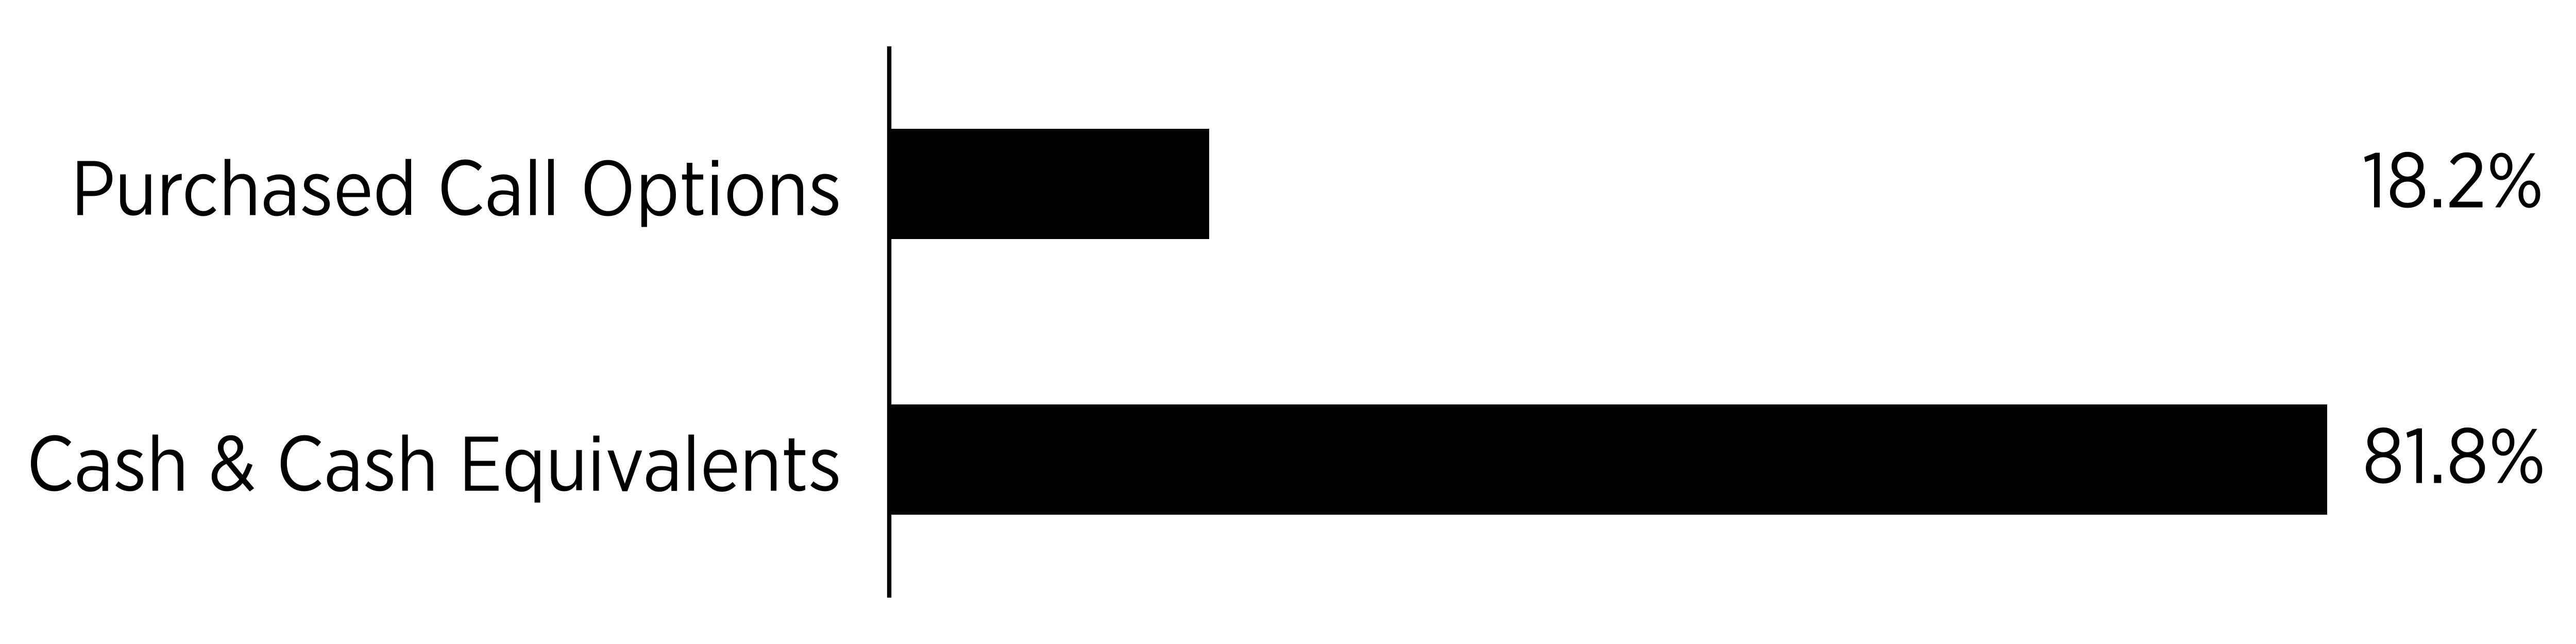
Sector
%
Purchased Call Options
18.2%
Cash & Cash Equivalents
81.8%
bar


Security Type - Other Financial Instruments

(% of Net Assets)
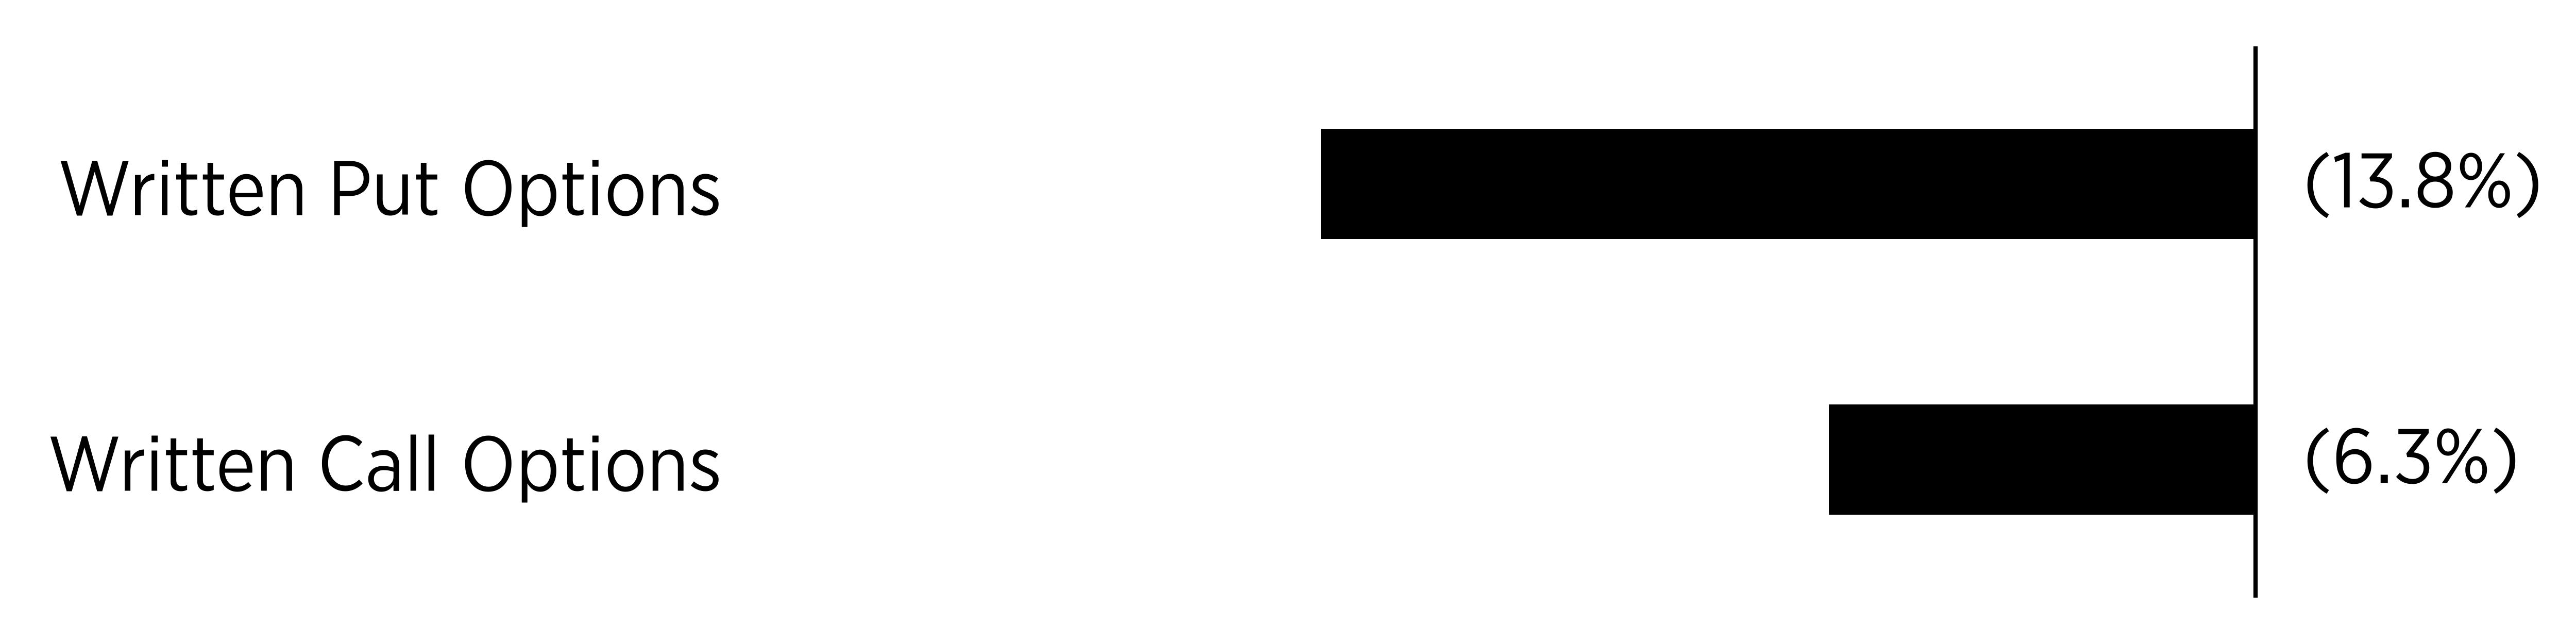
Sector
%
Written Put Options
-13.8%
Written Call Options
-6.3%
bar


Percentages are based on net assets. Cash & Cash Equivalents represents cash, short-term investments, and liabilities in excess of other assets.


Largest Holdings [Text Block]
Top Holdings
(% of Net Assets)
U.S. Treasury Bills
77.0
Hims & Hers Health, Inc., Expiration: 9/18/2026; Exercise Price: $27.01
15.5
Hims & Hers Health, Inc., Expiration: 9/18/2026; Exercise Price: $27.01
-13.8
First American Government Obligations Fund - Class X, 3.58%
12.1
Hims & Hers Health, Inc., Expiration: 8/7/2026; Exercise Price: $26.50
-2.6
Hims & Hers Health, Inc., Expiration: 8/7/2026; Exercise Price: $27.50
-2.1
Hims & Hers Health, Inc., Expiration: 8/7/2026; Exercise Price: $27.00
-1.6
Hims & Hers Health, Inc., Expiration: 8/7/2026; Exercise Price: $29.50
1.5
Hims & Hers Health, Inc., Expiration: 8/7/2026; Exercise Price: $28.50
1.2
Material Fund Change [Text Block]

Fund Changes

Effective September 18, 2025 the Fund's payment of income distributions was changed to seek to make such distributions on a monthly or more frequent basis.

Effective October 14, 2025 the Fund's payment of income distributions was changed to seek to make such distributions on a weekly basis.

YieldMax(R) MSTR Performance & Distribution Target 25(TM) ETF  
Shareholder Report [Line Items]  
Fund Name YieldMax™ MSTR Performance & Distribution Target 25 ETF
Class Name YieldMax™ MSTR Performance & Distribution Target 25 ETF
Trading Symbol MSST
Security Exchange Name CboeBZX
Annual or Semi-Annual Statement [Text Block] This annual shareholder report contains important information about the YieldMax™ MSTR Performance & Distribution Target 25 ETF (the "Fund") for the period August 1, 2025 to July 31, 2026.
Shareholder Report Annual or Semi-Annual annual shareholder report
Additional Information [Text Block] You can find additional information about the Fund at www.yieldmaxetfs.com/our-etfs/msst/. You can also request this information by contacting us at (844) 737-3001 or by writing to YieldMax™ MSTR Performance & Distribution Target 25 ETF, c/o U.S. Bank Global Fund Services, P.O. Box 701, Milwaukee, Wisconsin 53201‑0701.
Additional Information Phone Number (844) 737-3001
Additional Information Website www.yieldmaxetfs.com/our-etfs/msst/
Expenses [Text Block]

What were the Fund costs for the past year?

(based on a hypothetical $10,000 investment)

Class Name
Costs of a $10,000 investment
Costs paid as a percentage of a $10,000 investment
YieldMax™ MSTR Performance & Distribution Target 25 ETF
$54*
1.02%**
*The Fund commenced operations on November 17, 2025. Expenses for a full reporting period would be higher than the figures shown.
**Costs paid as a percentage of a $10,000 investment is an annualized figure.


Expenses Paid, Amount $ 54 [9]
Expense Ratio, Percent 1.02% [10]
Expenses Short Period Footnote [Text Block] The Fund commenced operations on November 17, 2025. Expenses for a full reporting period would be higher than the figures shown.
Factors Affecting Performance [Text Block]

How Did the Fund Perform During the Reporting Period?

The Fund had a negative total return as declines in Strategy Inc. (“MSTR”) outweighed income generated by its options strategies. The Fund also made regular distributions.

What Factors Influenced Performance?

Performance was primarily influenced by MSTR’s share price and implied volatility. Declines in MSTR detracted from results, while option premiums partially offset those losses.

Positioning of the Fund

The Fund maintained synthetic exposure to MSTR and employed options strategies to generate premiums. MSST targets annual cash distributions of approximately 25% of net asset value while seeking capital appreciation.
Performance Past Does Not Indicate Future [Text] The Fund's past performance is not a good indicator of how the Fund will perform in the future.
Line Graph [Table Text Block]

Cumulative Performance

(Initial Investment of $10,000)
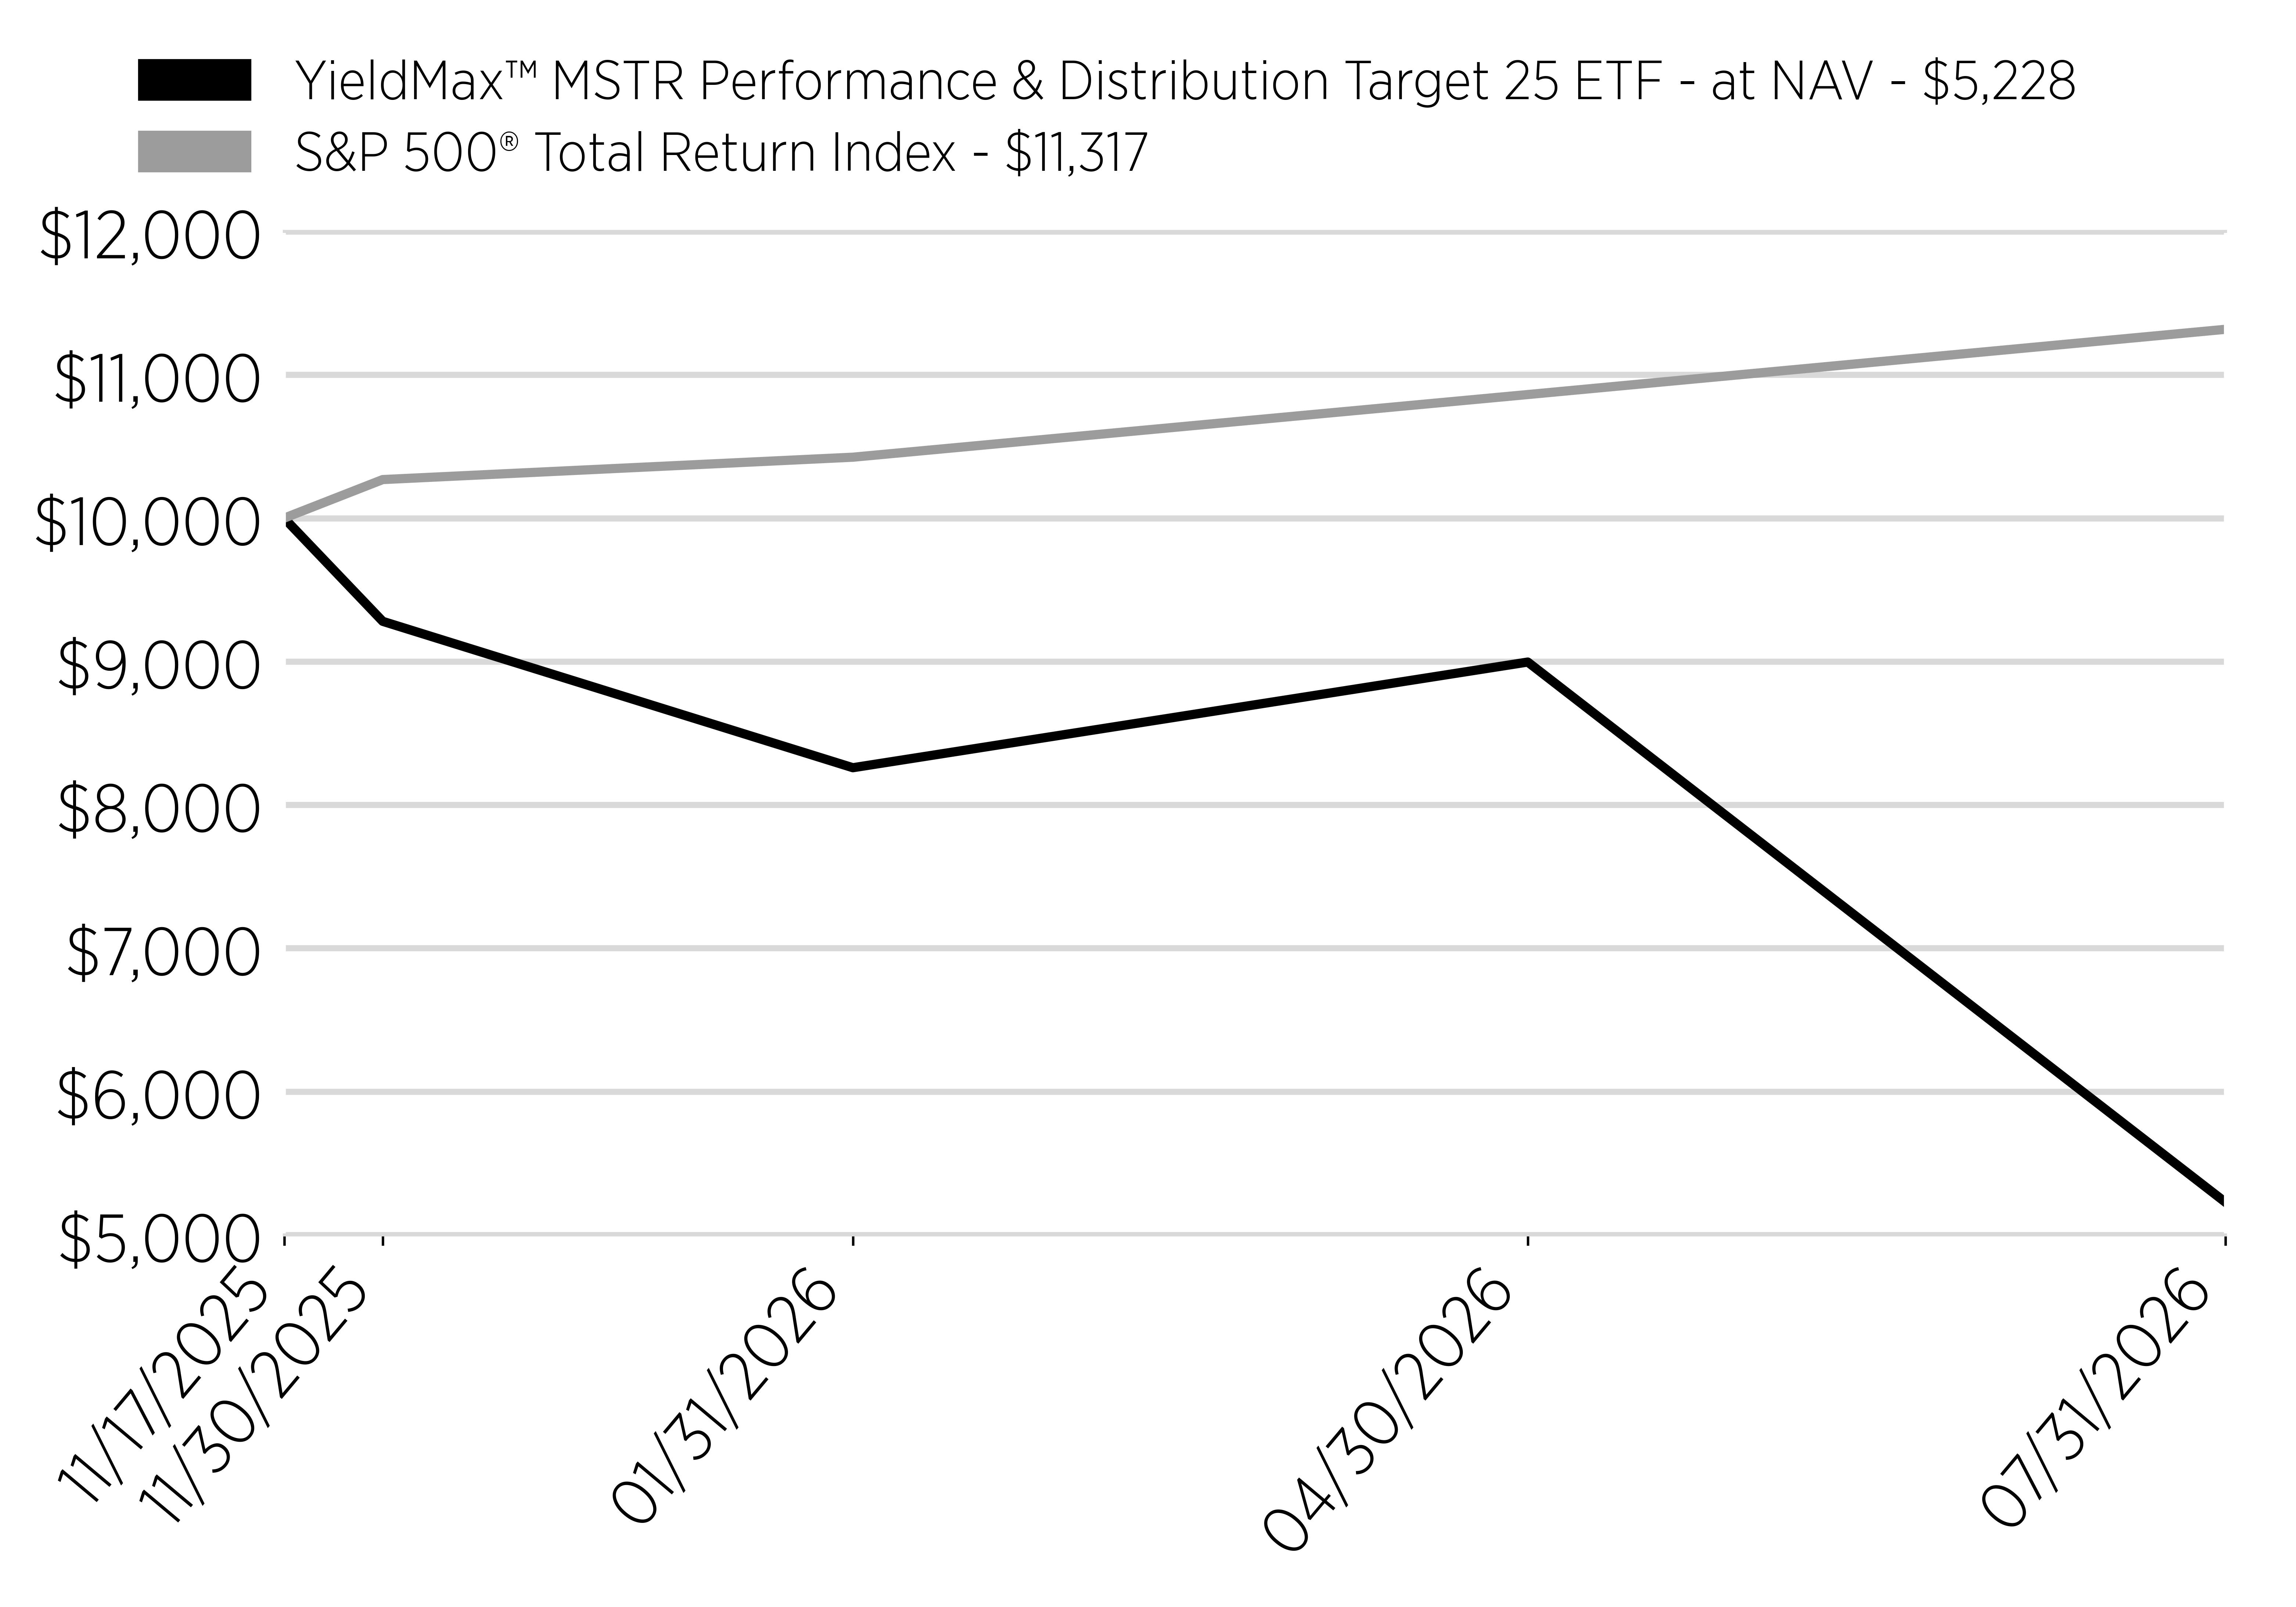
Date
YieldMax™ MSTR Performance & Distribution Target 25 ETF - at NAV - $5,228
S&P 500® Total Return Index - $11,317
11/17/2025
10000
10000
11/30/2025
9280
10269
1/31/2026
8259
10425
4/30/2026
8996
10862
7/31/2026
5228
11317
line
Average Annual Return [Table Text Block]

Annual Performance

Since Inception (11/17/2025)
Yieldmax™ MSTR Performance & Distribution Target 25 ETF - at NAV
-47.72%*
S&P 500® Total Return Index
13.17%
*Not Annualized for periods less than one year.
Performance Inception Date Nov. 17, 2025
No Deduction of Taxes [Text Block] The graph and table do not reflect the deduction of taxes that a shareholder would pay on fund distributions or redemption of fund shares.
Material Change Date Nov. 12, 2025
Updated Performance Information Location [Text Block] Visit www.yieldmaxetfs.com/our-etfs/msst/ for more recent performance information.
Net Assets $ 1,103,000
Holdings Count | Holdings 7
Advisory Fees Paid, Amount $ 20,885
Investment Company, Portfolio Turnover 0.00%
Additional Fund Statistics [Text Block]

Key Fund Statistics

(as of July 31, 2026)

Fund Size (Thousands)
$1,103
Number of Holdings
7
Total Advisory Fee Paid
$20,885
Portfolio Turnover
0%
Holdings [Text Block]

What did the Fund invest in?

(as of July 31, 2026)

Security Type - Investments

(% of Net Assets)
Sector
%
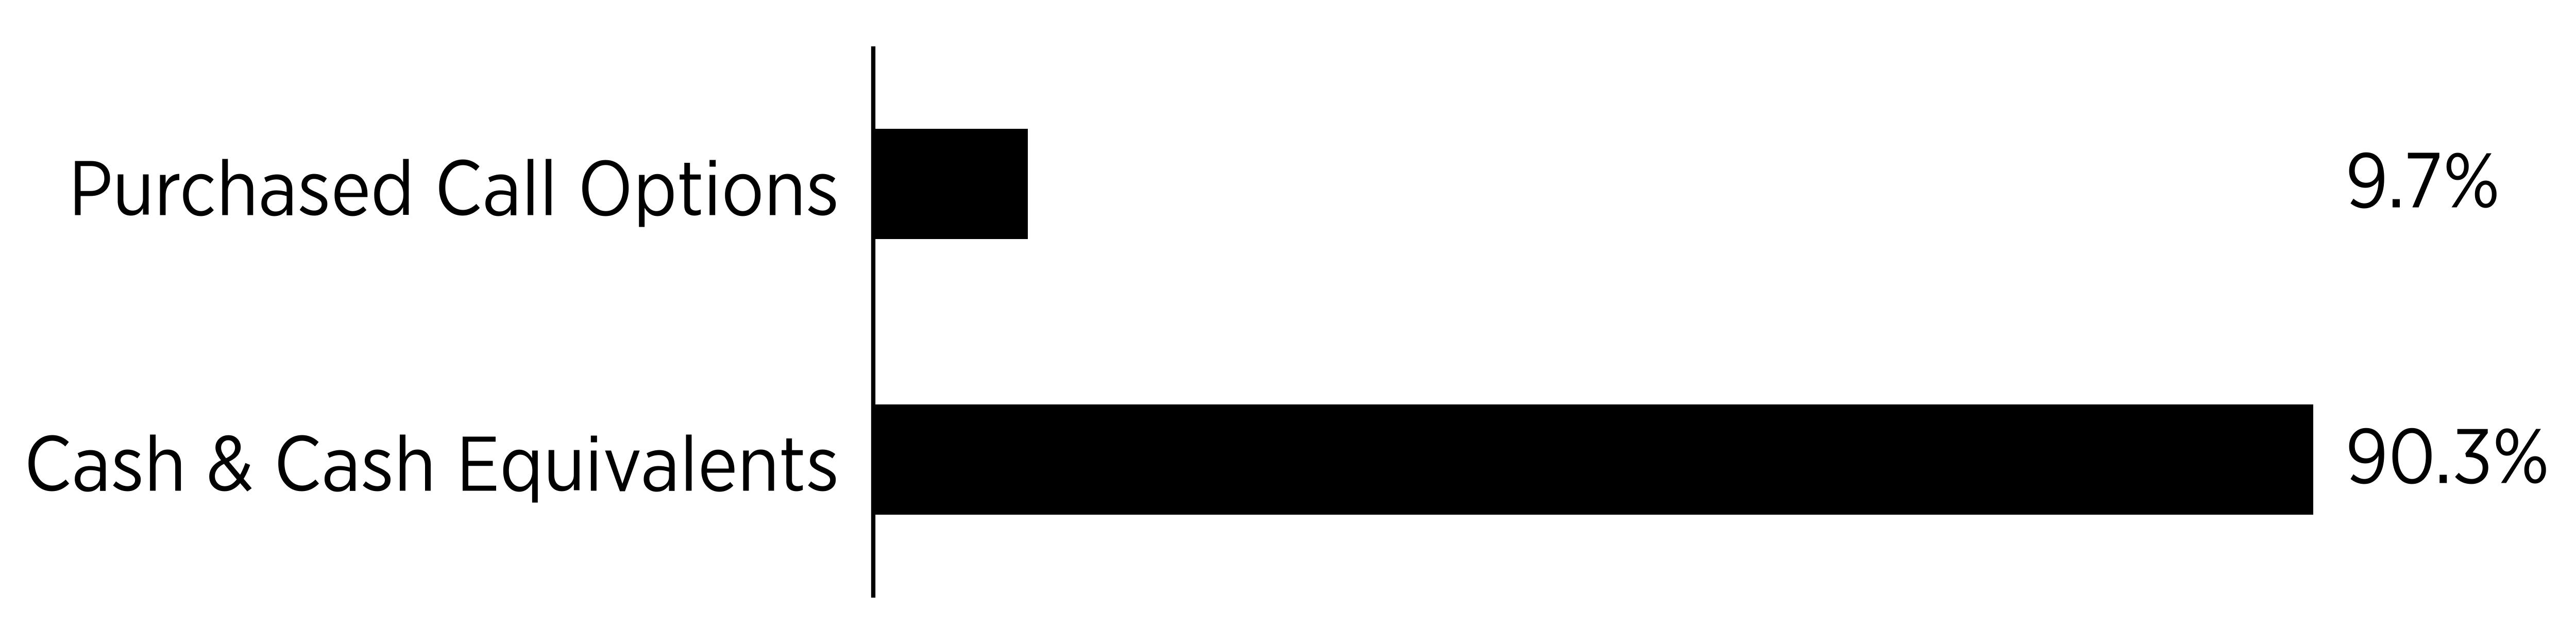
Purchased Call Options
9.7%
Cash & Cash Equivalents
90.3%
bar


Security Type - Other Financial Instruments

(% of Net Assets)
Sector
%
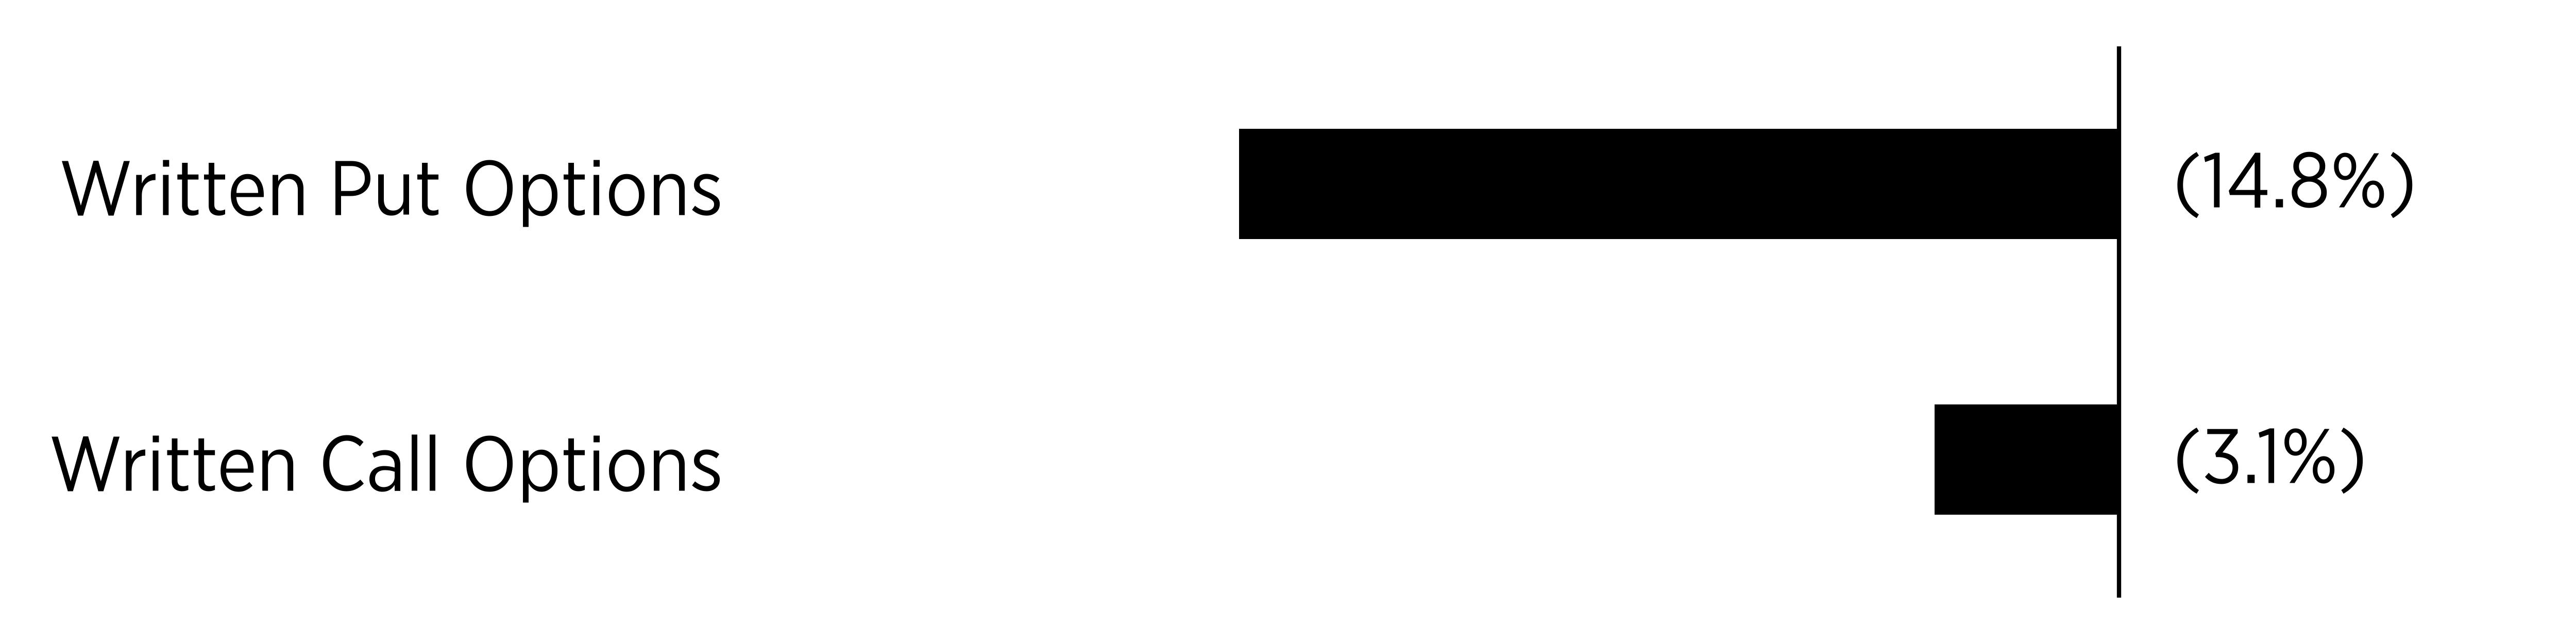
Written Put Options
-14.8%
Written Call Options
-3.1%
bar


Percentages are based on net assets. Cash & Cash Equivalents represents cash, short-term investments, and liabilities in excess of other assets.


Largest Holdings [Text Block]
Top Holdings
(% of Net Assets)
U.S. Treasury Bills
101.7
Strategy, Inc., Expiration: 9/18/2026;
Exercise Price: $100.01
-14.8
Strategy, Inc., Expiration: 9/18/2026;
Exercise Price: $100.01
8.4
Strategy, Inc., Expiration: 8/21/2026;
Exercise Price: $105.00
-3.0
First American Government Obligations Fund - Class X, 3.58%
2.1
Strategy, Inc., Expiration: 8/21/2026;
Exercise Price: $115.00
1.3
Material Fund Change [Text Block]

Fund Changes

Effective November 12, 2025 the Fund's listing exchange was changed to Cboe BZX Exchange, Inc.

Effective November 14, 2025 the Fund's ticker symbol was changed to MSST.

YieldMax(R) MSTR Short Option Income Strategy ETF  
Shareholder Report [Line Items]  
Fund Name YieldMax™ MSTR Short Option Income ETF
Class Name YieldMax™ MSTR Short Option Income Strategy ETF
Trading Symbol WNTR
Security Exchange Name NYSEArca
Annual or Semi-Annual Statement [Text Block] This annual shareholder report contains important information about the YieldMax™ MSTR Short Option Income ETF (the "Fund") for the period August 1, 2025 to July 31, 2026.
Shareholder Report Annual or Semi-Annual annual shareholder report
Additional Information [Text Block] You can find additional information about the Fund at www.yieldmaxetfs.com/our-etfs/wntr/. You can also request this information by contacting us at (844) 737-3001 or by writing to YieldMax™ MSTR Short Option Income ETF, c/o U.S. Bank Global Fund Services, P.O. Box 701, Milwaukee, Wisconsin 53201‑0701.
Additional Information Phone Number (844) 737-3001
Additional Information Website www.yieldmaxetfs.com/our-etfs/wntr/
Expenses [Text Block]

What were the Fund costs for the past year?

(based on a hypothetical $10,000 investment)

Class Name
Costs of a $10,000 investment
Costs paid as a percentage of a $10,000 investment
YieldMax™ MSTR Short Option Income Strategy ETF
$156
1.00%*
*Costs paid as a percentage of a $10,000 investment is an annualized figure.


Expenses Paid, Amount $ 156
Expense Ratio, Percent 1.00% [11]
Factors Affecting Performance [Text Block]

How Did the Fund Perform During the Reporting Period?

During the reporting period, the Fund generated positive total returns while making regular distributions to shareholders. The Fund's performance was driven primarily by its inverse ex-posure to Strategy, Inc. ("MSTR") and income generated through its options strategy

What Factors Influenced Performance?

The Fund's performance was affected principally by changes in the market price of MSTR and the premiums generated through the Fund's options strategy. As a result of its inverse expo-sure, the Fund generally benefited from declines in MSTR's share price. The level of implied volatility also influenced the amount of option premium available during the reporting peri-od.

Positioning of the Fund

The Fund seeks to provide current income while maintaining inverse exposure to MSTR through a systematic options strategy. WNTR seeks to generate current income through the systematic sale of puts and put spreads while retaining inverse exposure to a portion of the underlying security's performance.
Performance Past Does Not Indicate Future [Text] The Fund's past performance is not a good indicator of how the Fund will perform in the future.
Line Graph [Table Text Block]

Cumulative Performance

(Initial Investment of $10,000)
Date
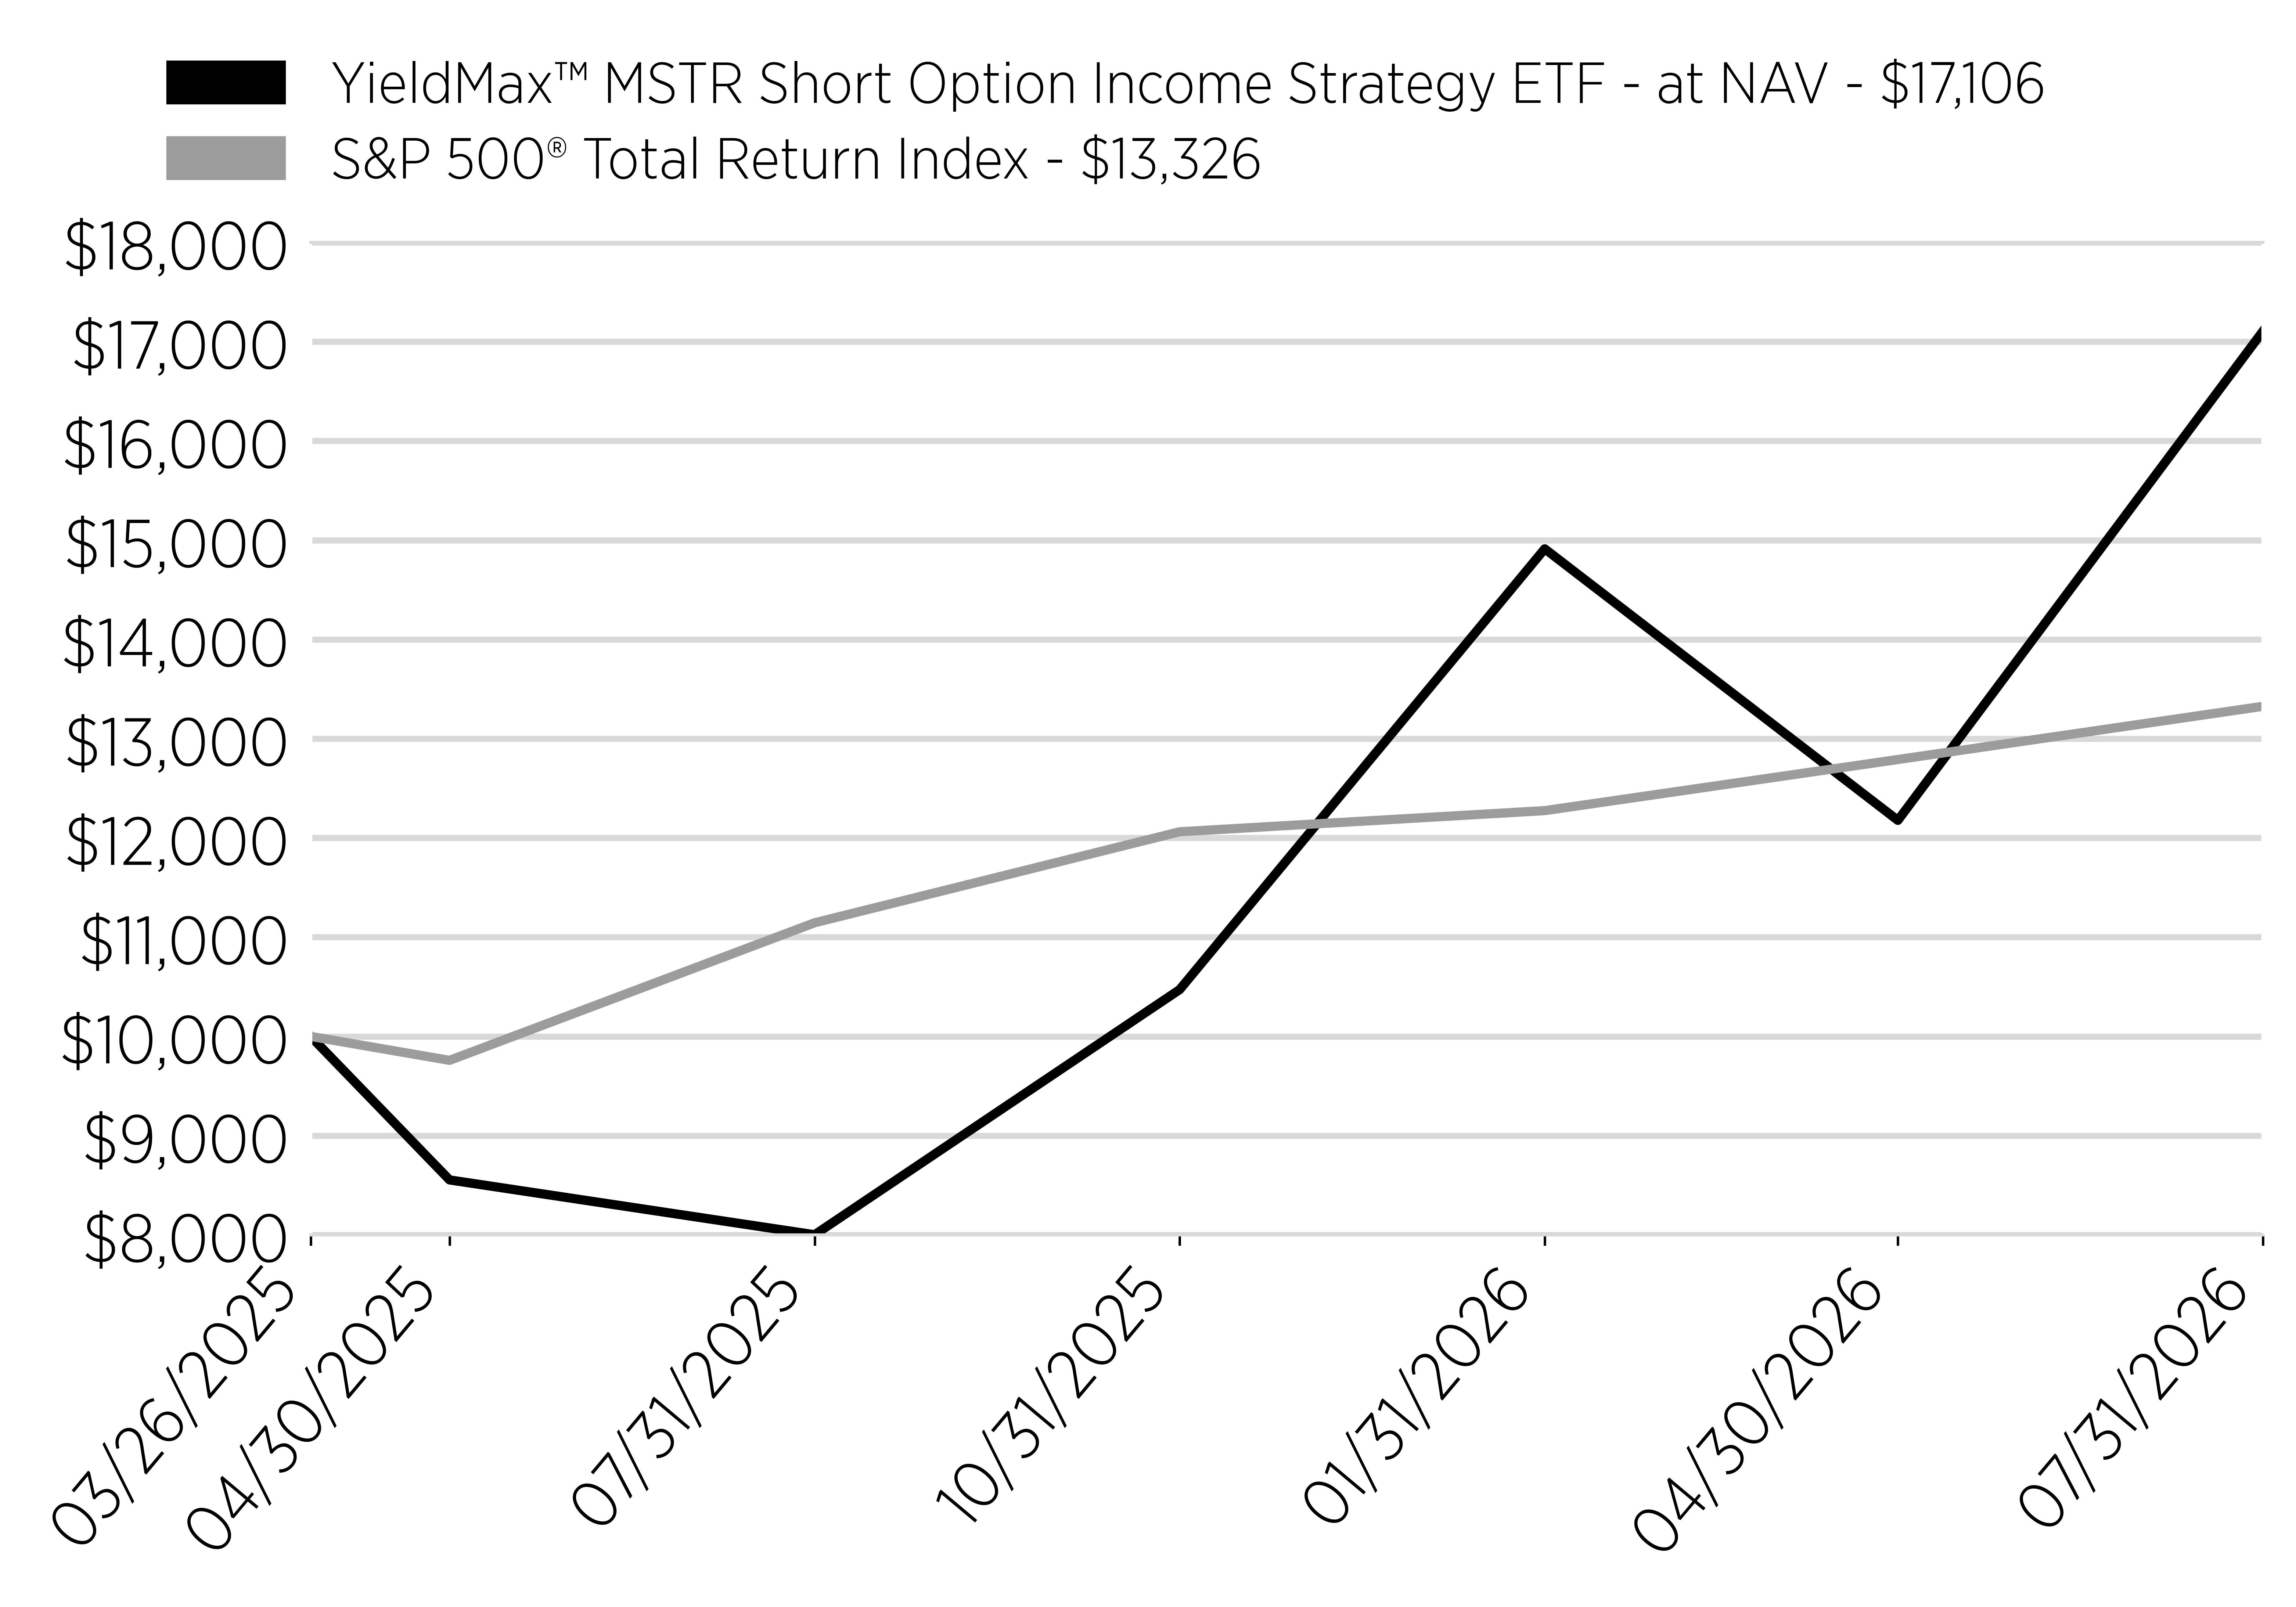
YieldMax™ MSTR Short Option Income Strategy ETF - at NAV - $17,106
S&P 500® Total Return Index - $13,326
3/26/2025
10000
10000
4/30/2025
8554
9759
7/31/2025
8002
11145
10/31/2025
10472
12062
1/31/2026
14913
12275
4/30/2026
12177
12790
7/31/2026
17106
13326
line
Average Annual Return [Table Text Block]

Annual Performance

1 Year
Since Inception (3/26/25)
Yieldmax™ MSTR Short Option Income ETF - at NAV
113.92%
48.93%
S&P 500® Total Return Index
19.56%
23.74%
Performance Inception Date Mar. 26, 2025
No Deduction of Taxes [Text Block] The graph and table do not reflect the deduction of taxes that a shareholder would pay on fund distributions or redemption of fund shares.
Material Change Date Sep. 18, 2025
Updated Performance Information Location [Text Block] Visit www.yieldmaxetfs.com/our-etfs/wntr/ for more recent performance information.
Net Assets $ 83,918,000
Holdings Count | Holdings 21
Advisory Fees Paid, Amount $ 644,158
Investment Company, Portfolio Turnover 123.00%
Additional Fund Statistics [Text Block]

Key Fund Statistics

(as of July 31, 2026)

Fund Size (Thousands)
$83,918
Number of Holdings
21
Total Advisory Fee Paid
$644,158
Portfolio Turnover
123%
Holdings [Text Block]

What did the Fund invest in?

(as of July 31, 2026)

Security Type - Investments

(% of Net Assets)
Sector
%
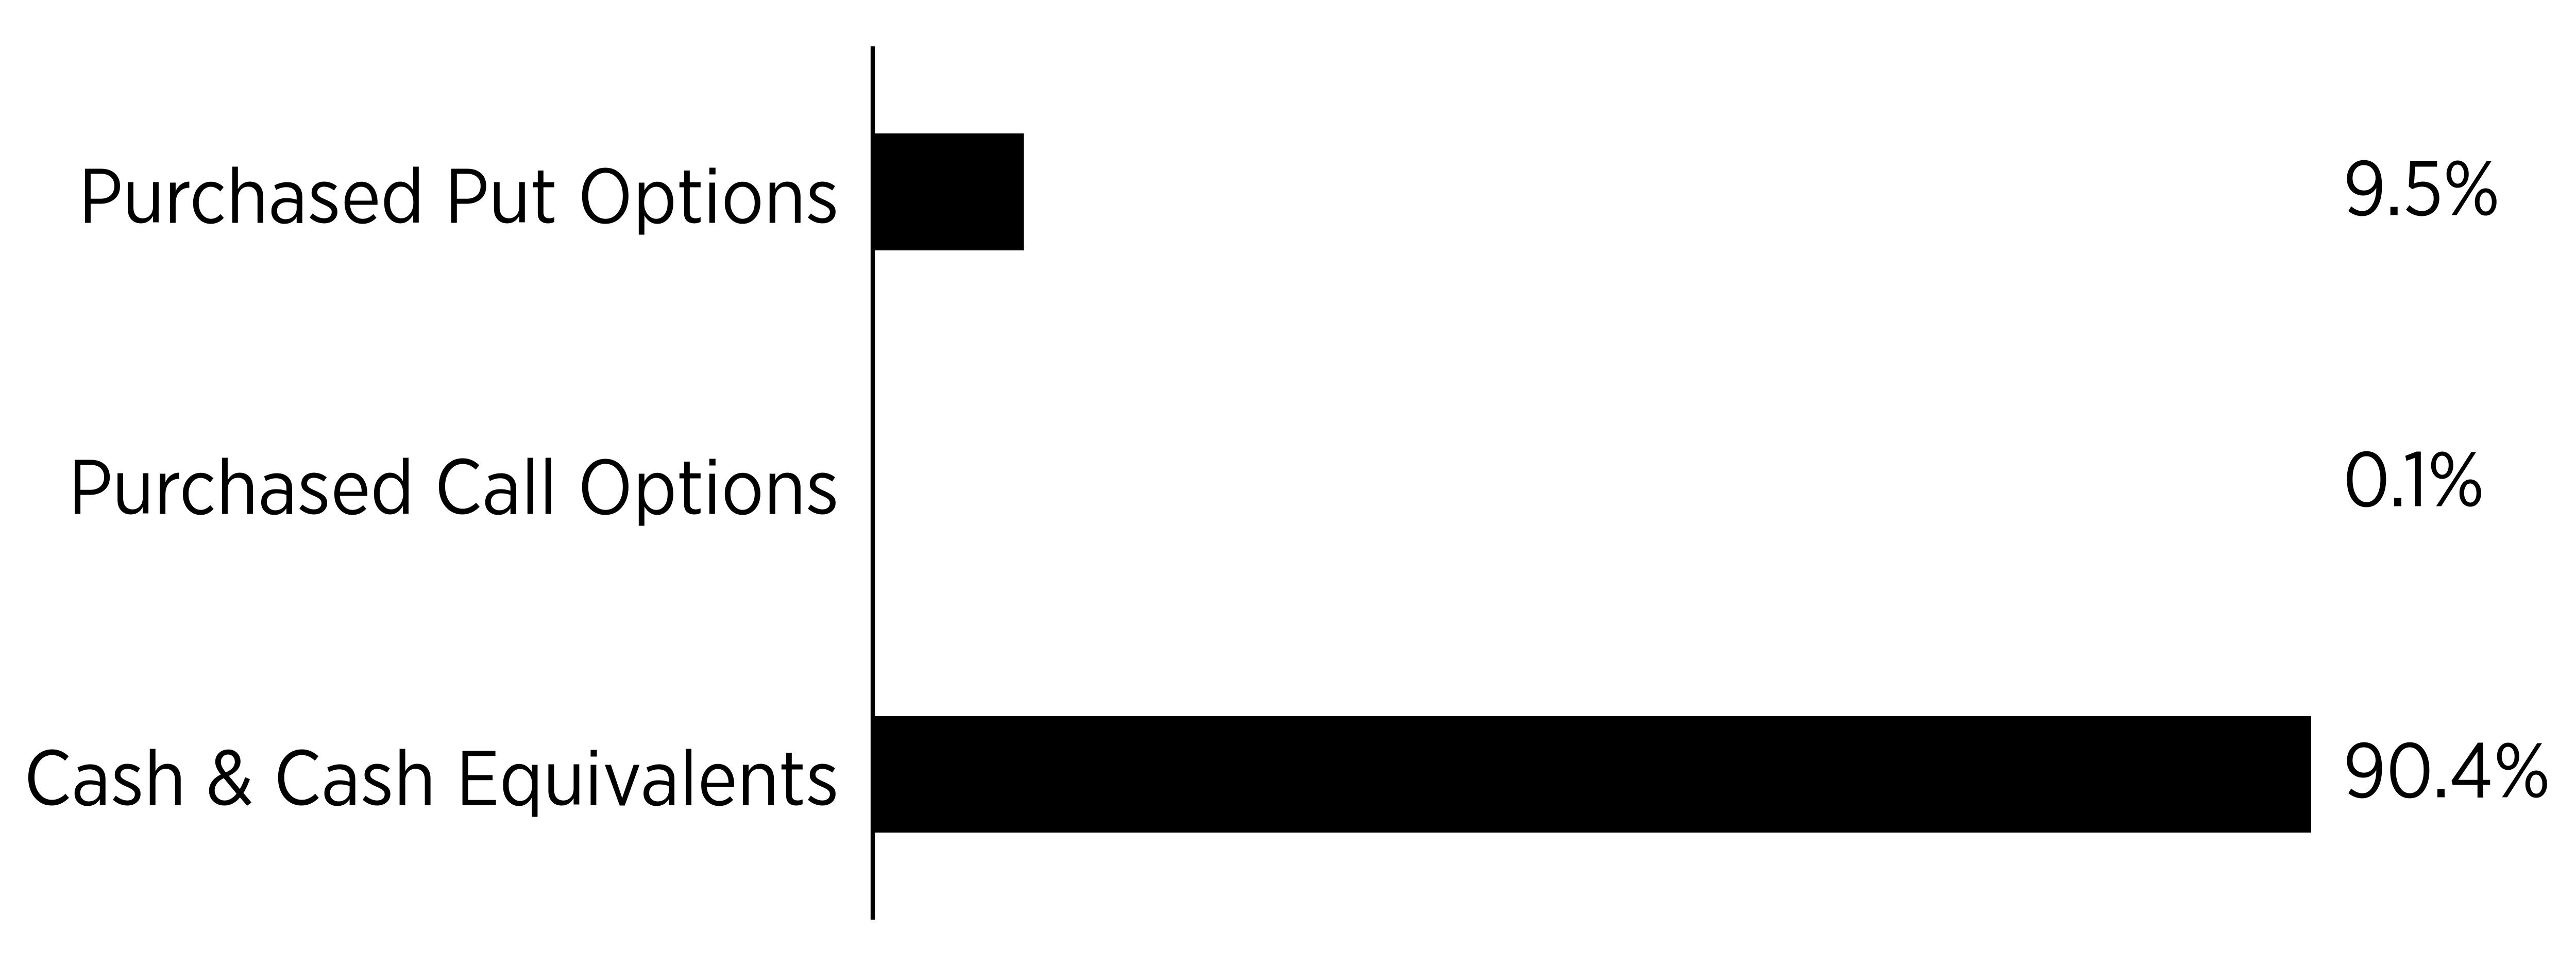
Purchased Put Options
9.5%
Purchased Call Options
0.1%
Cash & Cash Equivalents
90.4%
bar


Security Type - Other Financial Instruments

(% of Net Assets)
Sector
%
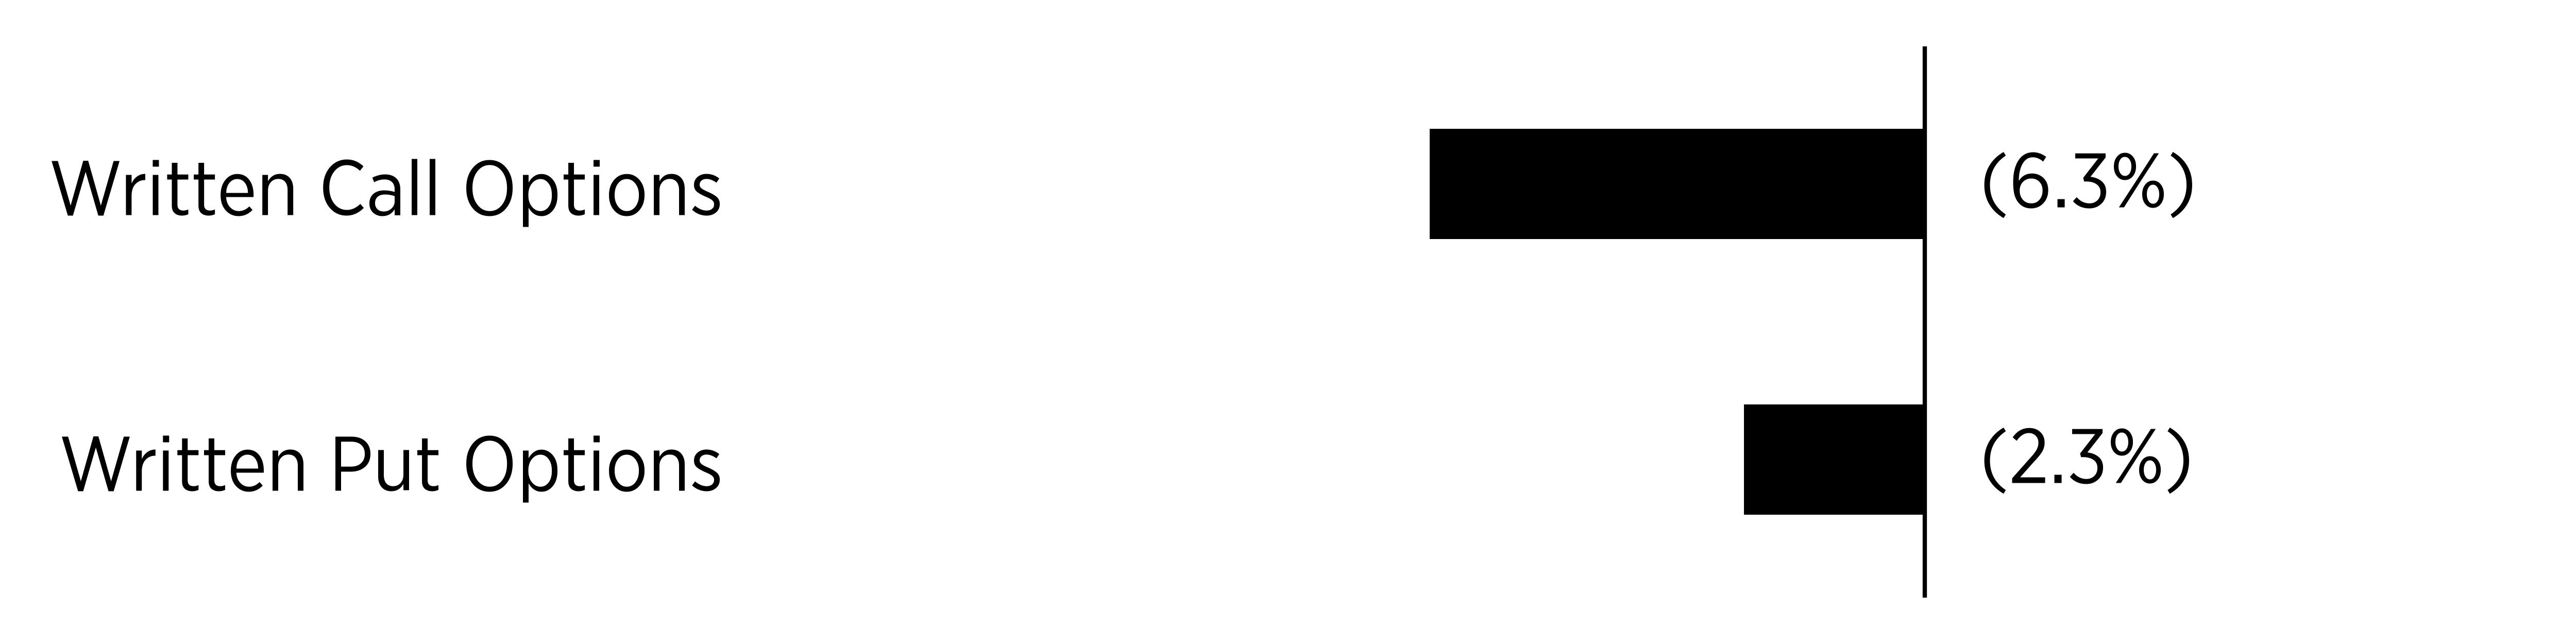
Written Call Options
-6.3%
Written Put Options
-2.3%
bar


Percentages are based on net assets. Cash & Cash Equivalents represents cash, short-term investments and other assets in excess of liabilities.


Largest Holdings [Text Block]
Top Holdings
(% of Net Assets)
U.S. Treasury Bills
60.8
First American Government Obligations Fund - Class X, 3.58%
7.4
Strategy, Inc., Expiration: 8/21/2026;
Exercise Price: $95.02
5.9
Strategy, Inc., Expiration: 8/21/2026;
Exercise Price: $95.02
-4.8
Strategy, Inc., Expiration: 9/18/2026;
Exercise Price: $100.02
2.7
Strategy, Inc., Expiration: 9/18/2026;
Exercise Price: $100.02
-1.5
Strategy, Inc., Expiration 8/7/2026;
Exercise Price: $88.00
-0.7
Strategy, Inc., Expiration 8/7/2026;
Exercise Price: $90.00
-0.6
Strategy, Inc., Expiration 8/7/2026;
Exercise Price: $94.00
-0.5
Strategy, Inc., Expiration 8/7/2026;
Exercise Price: $91.00
-0.5
Material Fund Change [Text Block]

Fund Changes

Effective September 18, 2025 the Fund intends to pay out dividends and interest income, if any, at least monthly, and distribute any net realized capital gains to its shareholders at least annually.

Effective October 14, 2025 the Fund's payment of income distributions were changed to seek to make such distributions on a weekly basis.

YieldMax(R) Nasdaq 100 0DTE Covered Call Strategy ETF  
Shareholder Report [Line Items]  
Fund Name YieldMax™ Nasdaq 100 0DTE Covered Call Strategy ETF
Class Name YieldMax™ Nasdaq 100 0DTE Covered Call Strategy ETF
Trading Symbol QDTY
Security Exchange Name NASDAQ
Annual or Semi-Annual Statement [Text Block] This annual shareholder report contains important information about the YieldMax™ Nasdaq 100 0DTE Covered Call Strategy ETF (the "Fund") for the period August 1, 2025 to July 31, 2026.
Shareholder Report Annual or Semi-Annual annual shareholder report
Additional Information [Text Block] You can find additional information about the Fund at www.yieldmaxetfs.com/our-etfs/qdty/. You can also request this information by contacting us at (844) 737-3001 or by writing to YieldMax™ Nasdaq 100 0DTE Covered Call Strategy ETF, c/o U.S. Bank Global Fund Services, P.O. Box 701, Milwaukee, Wisconsin 53201‑0701.
Additional Information Phone Number (844) 737-3001
Additional Information Website www.yieldmaxetfs.com/our-etfs/qdty/
Expenses [Text Block]

What were the Fund costs for the past year?

(based on a hypothetical $10,000 investment)

Class Name
Costs of a $10,000 investment
Costs paid as a percentage of a $10,000 investment
YieldMax™ Nasdaq 100 0DTE Covered Call Strategy ETF
$120
1.09%*
*Costs paid as a percentage of a $10,000 investment is an annualized figure.


Expenses Paid, Amount $ 120
Expense Ratio, Percent 1.09% [12]
Factors Affecting Performance [Text Block]

How Did the Fund Perform During the Reporting Period?

The Fund had a positive total return as gains in the Nasdaq-100 Index and income generated by its options strategy contributed to performance. The Fund also provided shareholders with regular income distributions.

What Factors Influenced Performance?

Performance was primarily influenced by movements in the Nasdaq-100 Index and index volatility. Index gains and premiums from daily zero-days-to-expiration (“0DTE”) call options contributed positively to results.

Positioning of the Fund

The Fund continued to employ a synthetic covered call strategy designed to generate current income while maintaining exposure to the Nasdaq-100 Index. The Fund sold 0DTE call options daily and starting in mid-September of 2025, began distributing income weekly.

Performance Past Does Not Indicate Future [Text] The Fund's past performance is not a good indicator of how the Fund will perform in the future.
Line Graph [Table Text Block]

Cumulative Performance

(Initial Investment of $10,000)
Date
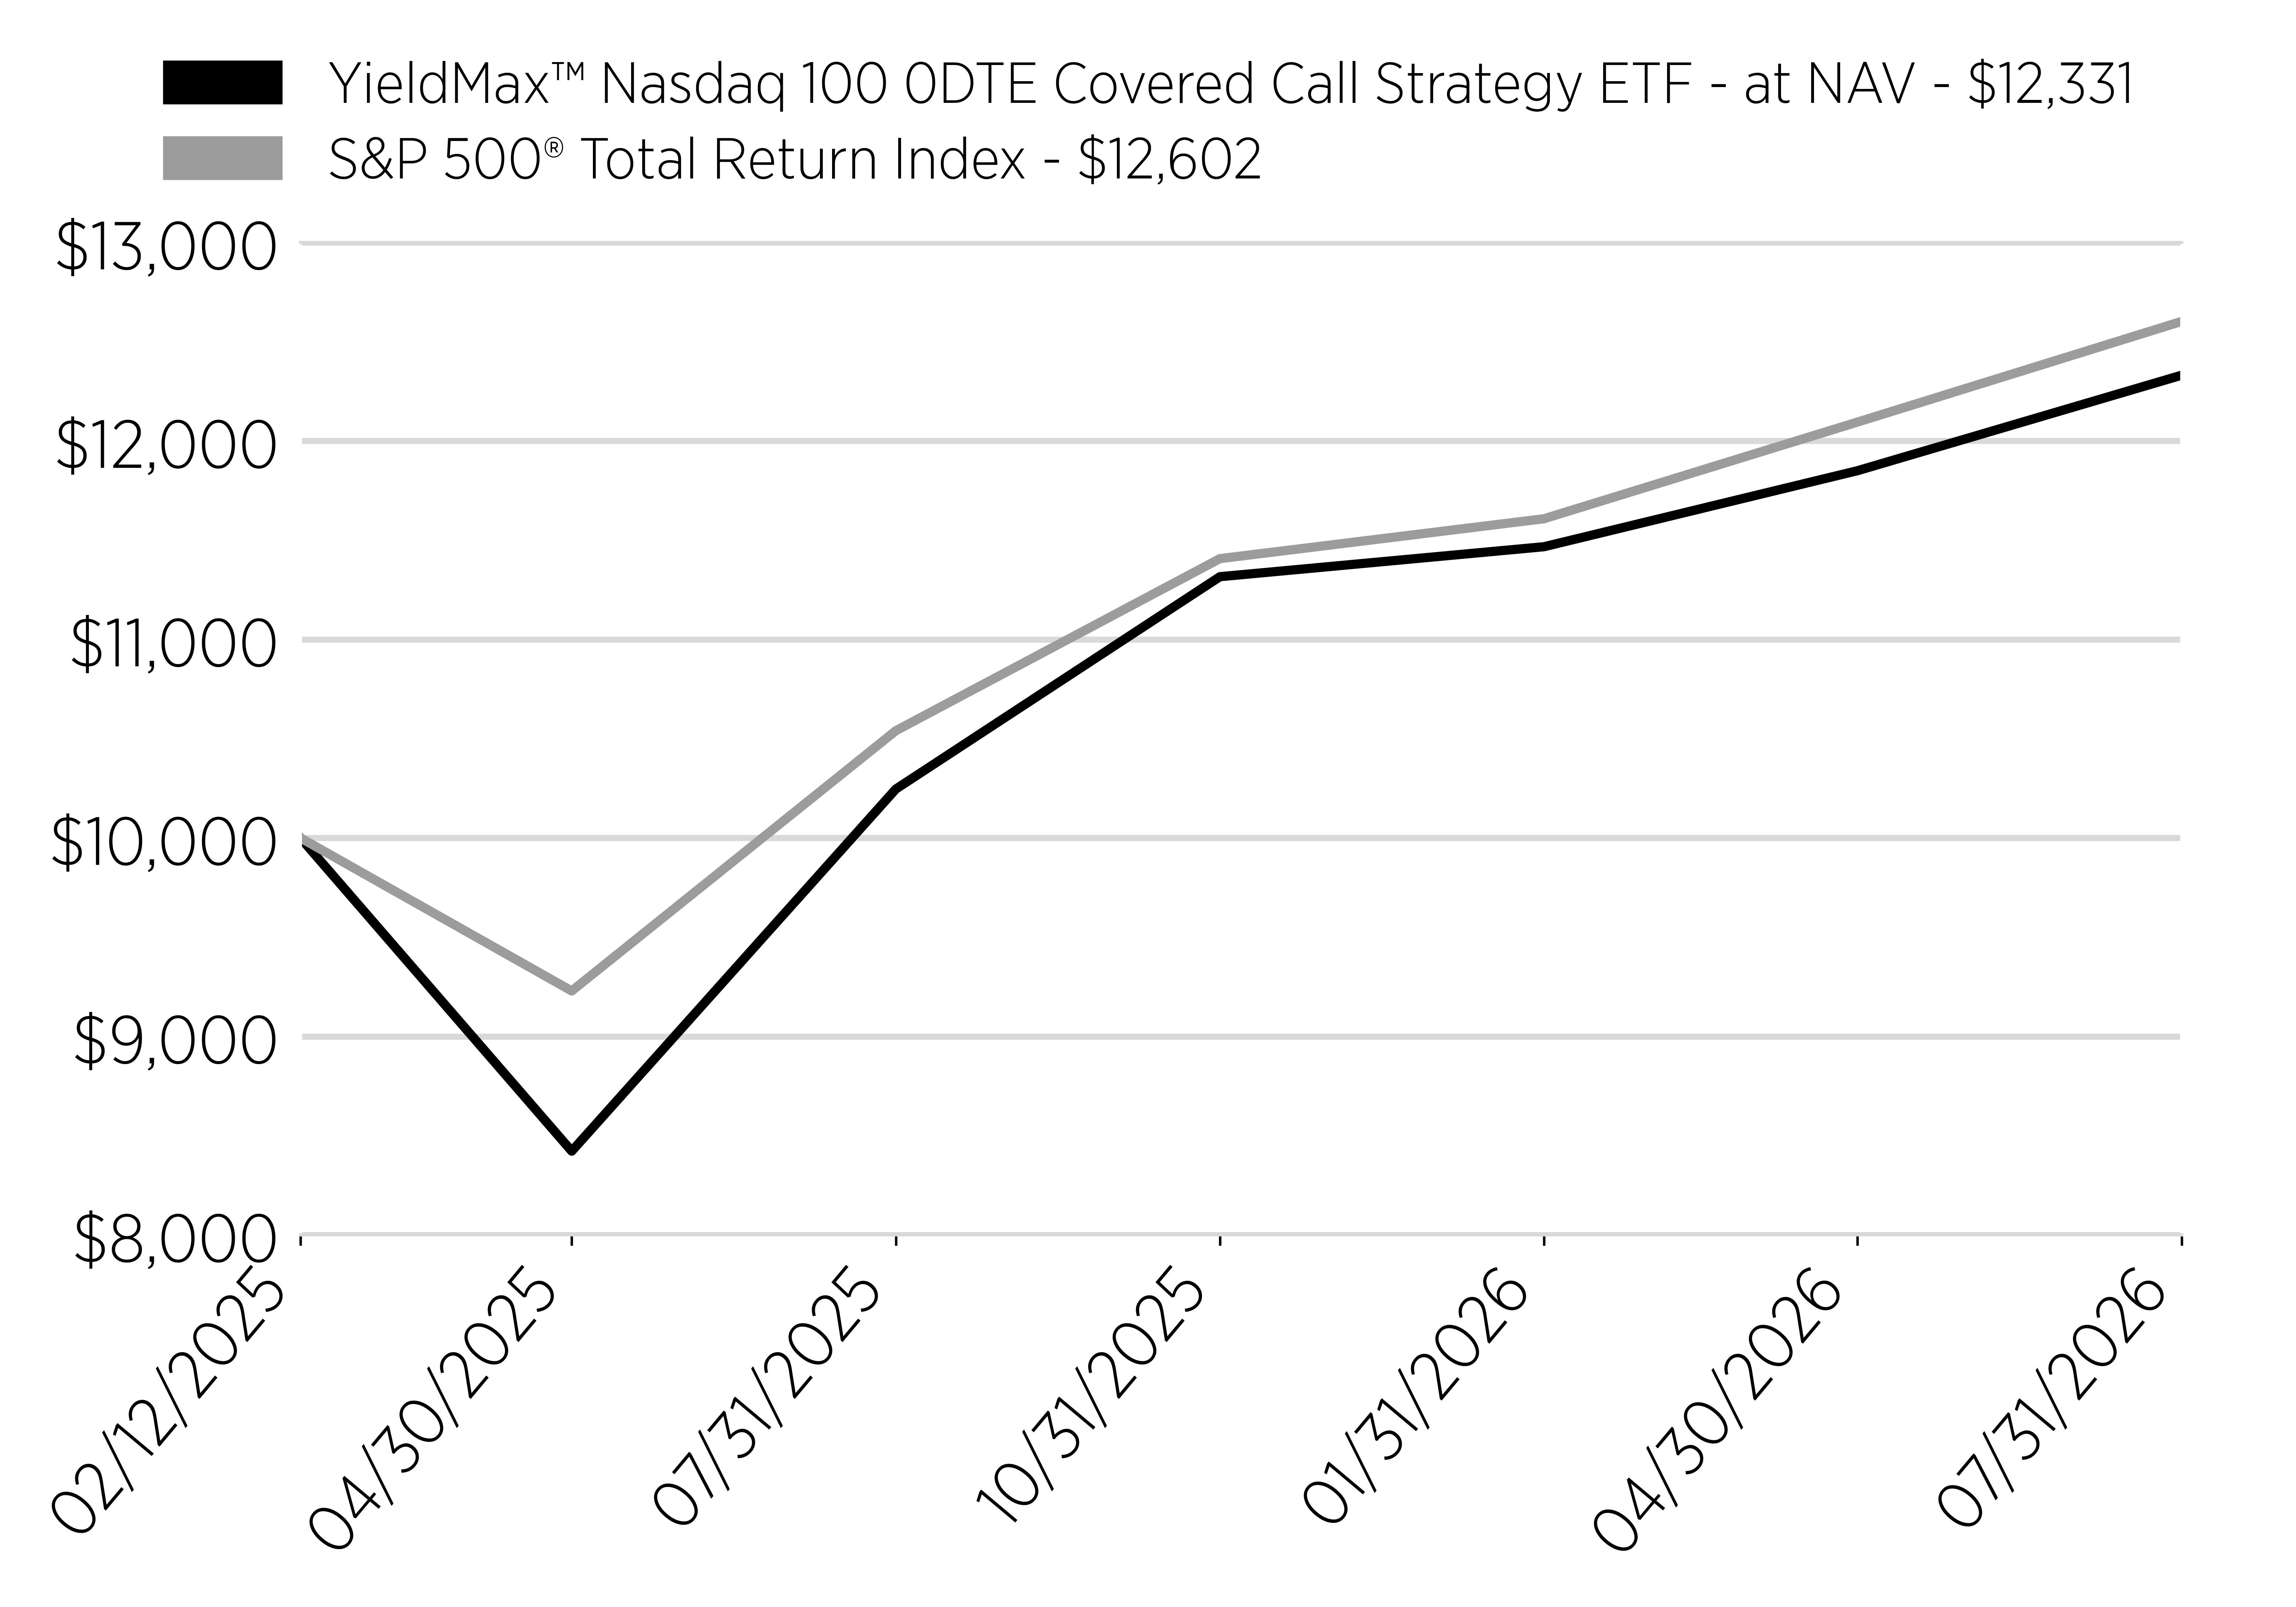
YieldMax™ Nasdaq 100 0DTE Covered Call Strategy ETF - at NAV - $12,331
S&P 500® Total Return Index - $12,602
2/12/2025
10000
10000
4/30/2025
8422
9229
7/31/2025
10246
10540
10/31/2025
11316
11407
1/31/2026
11467
11608
4/30/2026
11850
12095
7/31/2026
12331
12602
line
Average Annual Return [Table Text Block]

Annual Performance

1 Year
Since Inception (2/12/25)
Yieldmax™ Nasdaq 100 0DTE Covered Call Strategy ETF - at NAV
20.51%
15.40%
S&P 500® Total Return Index
19.56%
17.13%
Performance Inception Date Feb. 12, 2025
No Deduction of Taxes [Text Block] The graph and table do not reflect the deduction of taxes that a shareholder would pay on fund distributions or redemption of fund shares.
Material Change Date Sep. 12, 2025
Updated Performance Information Location [Text Block] Visit www.yieldmaxetfs.com/our-etfs/qdty/ for more recent performance information.
Net Assets $ 24,324,000
Holdings Count | Holdings 4
Advisory Fees Paid, Amount $ 215,443
Investment Company, Portfolio Turnover 20.00%
Additional Fund Statistics [Text Block]

Key Fund Statistics

(as of July 31, 2026)

Fund Size (Thousands)
$24,324
Number of Holdings
4
Total Advisory Fee Paid
$215,443
Portfolio Turnover
20%
Holdings [Text Block]

What did the Fund invest in?

(as of July 31, 2026)

Security Type - Investments

(% of Net Assets)
Sector
%
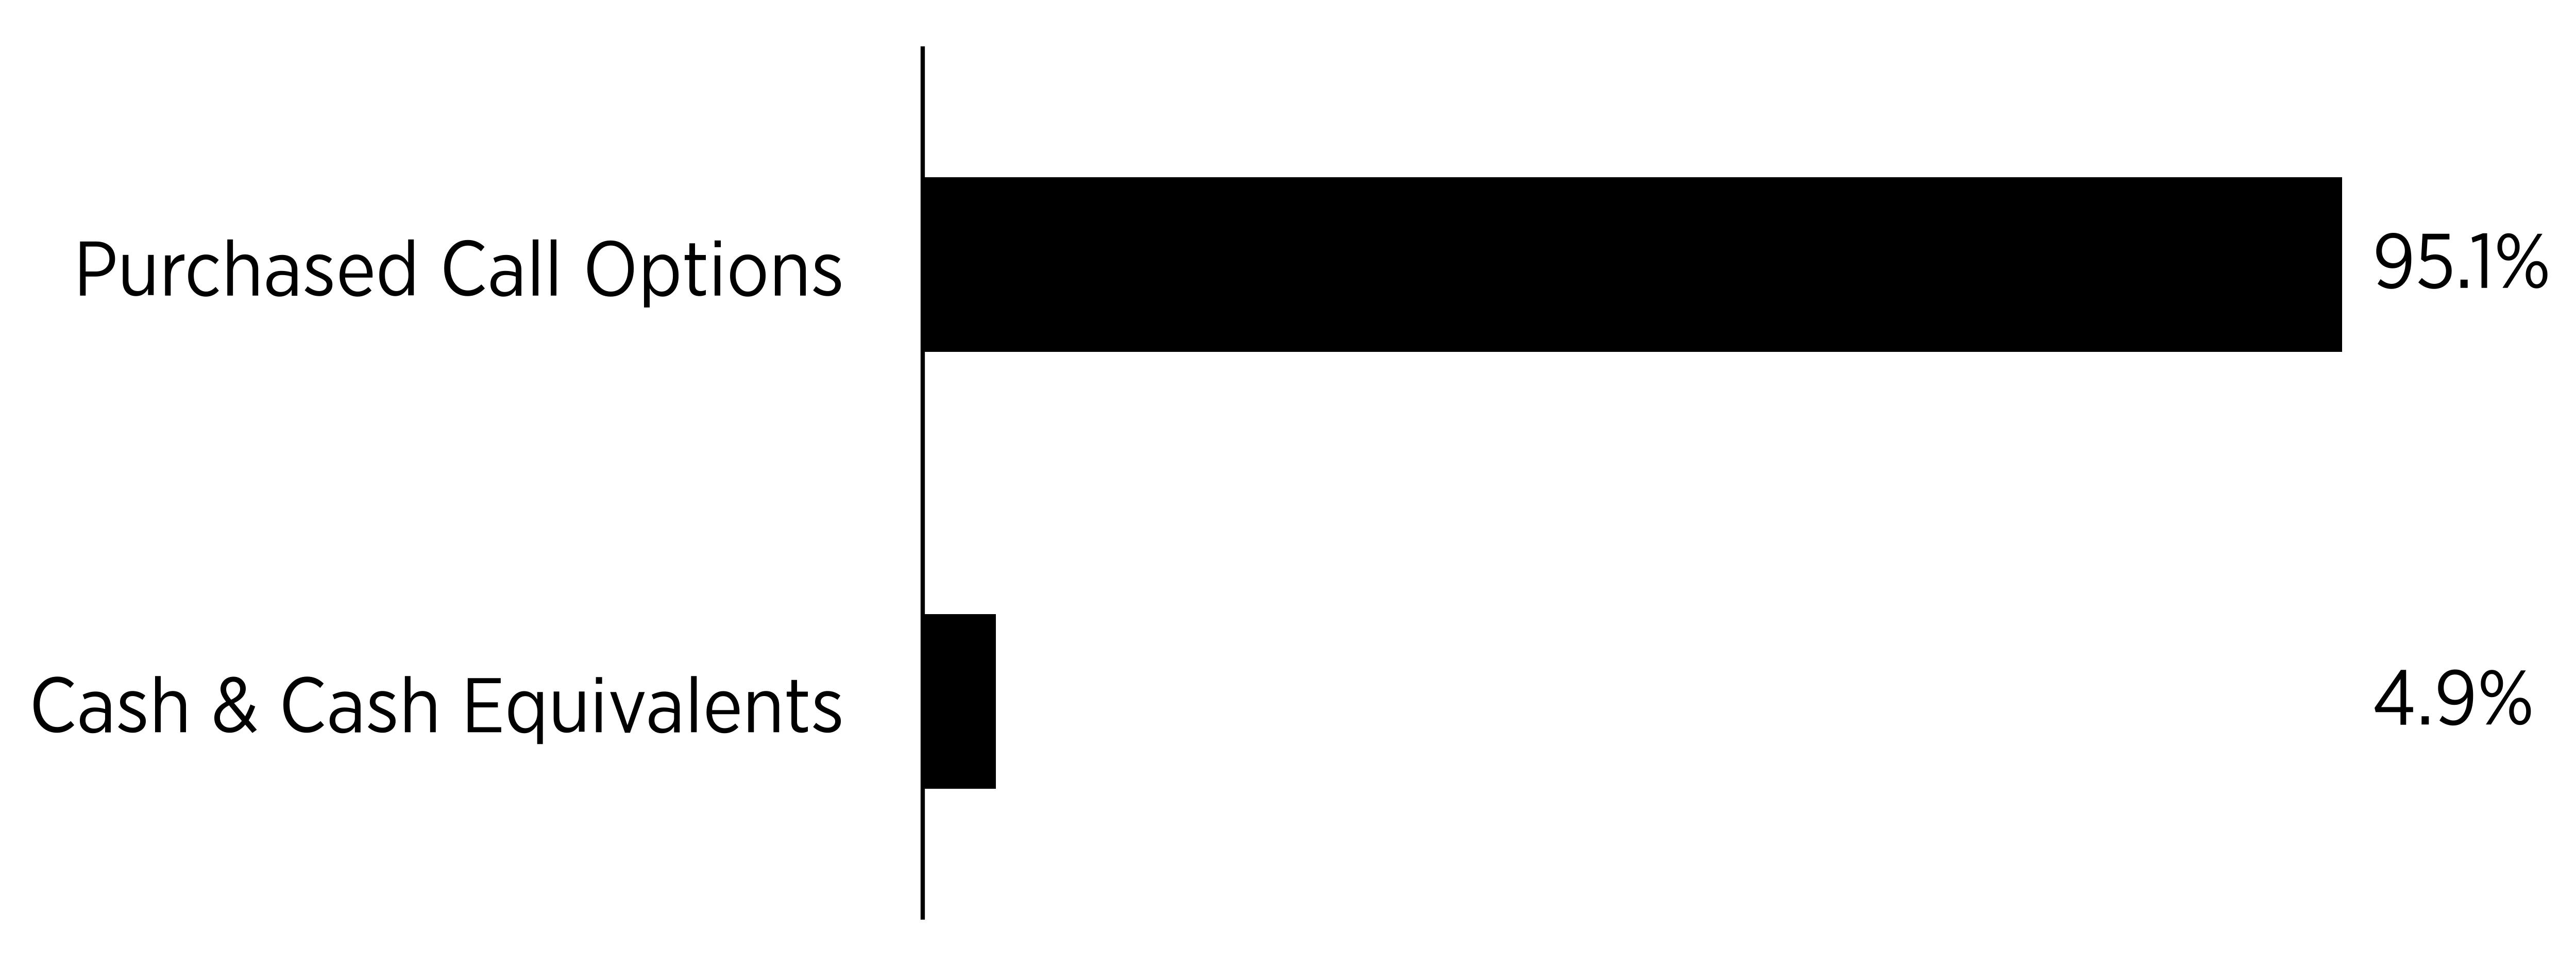
Purchased Call Options
95.1%
Cash & Cash Equivalents
4.9%
bar

Percentages are based on net assets. Cash & Cash Equivalents represents cash, short-term investments and other assets in excess of liabilities.


Largest Holdings [Text Block]
Top Holdings
(% of Net Assets)
Nasdaq-100 Index, Expiration: 12/18/2026; Exercise Price: $1,001.26
89.5
Nasdaq-100 Micro Index, Expiration: 12/18/2026; Exercise Price: $10.02
5.6
First American Government Obligations Fund - Class X, 3.58%
3.8
U.S. Treasury Bills
0.1
Material Fund Change [Text Block]

Fund Changes

Effective September 12, 2025 the Fund intends to pay out dividends and interest income, if any, weekly, and distribute any net realized capital gains to its shareholders at least annually. The Fund intends to distribute to its shareholders substantially all of its investment company taxable income (computed without regard to the deduction for dividends paid), its net tax-exempt income, if any, and any net capital gain (net long-term capital gains in excess of net short-term capital losses, taking into account any capital loss carryforwards).
YieldMax(R) NVDA Performance & Distribution Target 25(TM) ETF  
Shareholder Report [Line Items]  
Fund Name YieldMax™ NVDA Performance & Distribution Target 25 ETF
Class Name YieldMax™ NVDA Performance & Distribution Target 25 ETF
Trading Symbol NVIT
Security Exchange Name CboeBZX
Annual or Semi-Annual Statement [Text Block] This annual shareholder report contains important information about the YieldMax™ NVDA Performance & Distribution Target 25 ETF (the "Fund") for the period August 1, 2025 to July 31, 2026.
Shareholder Report Annual or Semi-Annual annual shareholder report
Additional Information [Text Block] You can find additional information about the Fund at www.yieldmaxetfs.com/our-etfs/nvit/. You can also request this information by contacting us at (844) 737-3001 or by writing to YieldMax™ NVDA Performance & Distribution Target 25 ETF, c/o U.S. Bank Global Fund Services, P.O. Box 701, Milwaukee, Wisconsin 53201‑0701.
Additional Information Phone Number (844) 737-3001
Additional Information Website www.yieldmaxetfs.com/our-etfs/nvit/
Expenses [Text Block]

What were the Fund costs for the past year?

(based on a hypothetical $10,000 investment)

Class Name
Costs of a $10,000 investment
Costs paid as a percentage of a $10,000 investment
YieldMax™ NVDA Performance & Distribution Target 25 ETF
$74*
0.99%**
*The Fund commenced operations on November 17, 2025. Expenses for a full reporting period would be higher than the figures shown.
**Costs paid as a percentage of a $10,000 investment is an annualized figure.


Expenses Paid, Amount $ 74 [13]
Expense Ratio, Percent 0.99% [14]
Expenses Short Period Footnote [Text Block] The Fund commenced operations on November 17, 2025. Expenses for a full reporting period would be higher than the figures shown.
Factors Affecting Performance [Text Block]

How Did the Fund Perform During the Reporting Period?

The Fund had a positive total return as appreciation in NVIDIA Corporation (“NVDA”) and income generated by its options strategies contributed to performance. The Fund also made regular distributions.

What Factors Influenced Performance?

Performance was primarily influenced by NVDA’s share price and implied volatility. Gains in NVDA and option premiums contributed to results

Positioning of the Fund

The Fund maintained synthetic exposure to NVDA and employed options strategies to generate premiums. NVIT targets annual cash distributions of approximately 25% of net asset value while seeking capital appreciation.
Performance Past Does Not Indicate Future [Text] The Fund's past performance is not a good indicator of how the Fund will perform in the future.
Line Graph [Table Text Block]

Cumulative Performance

(Initial Investment of $10,000)
Date
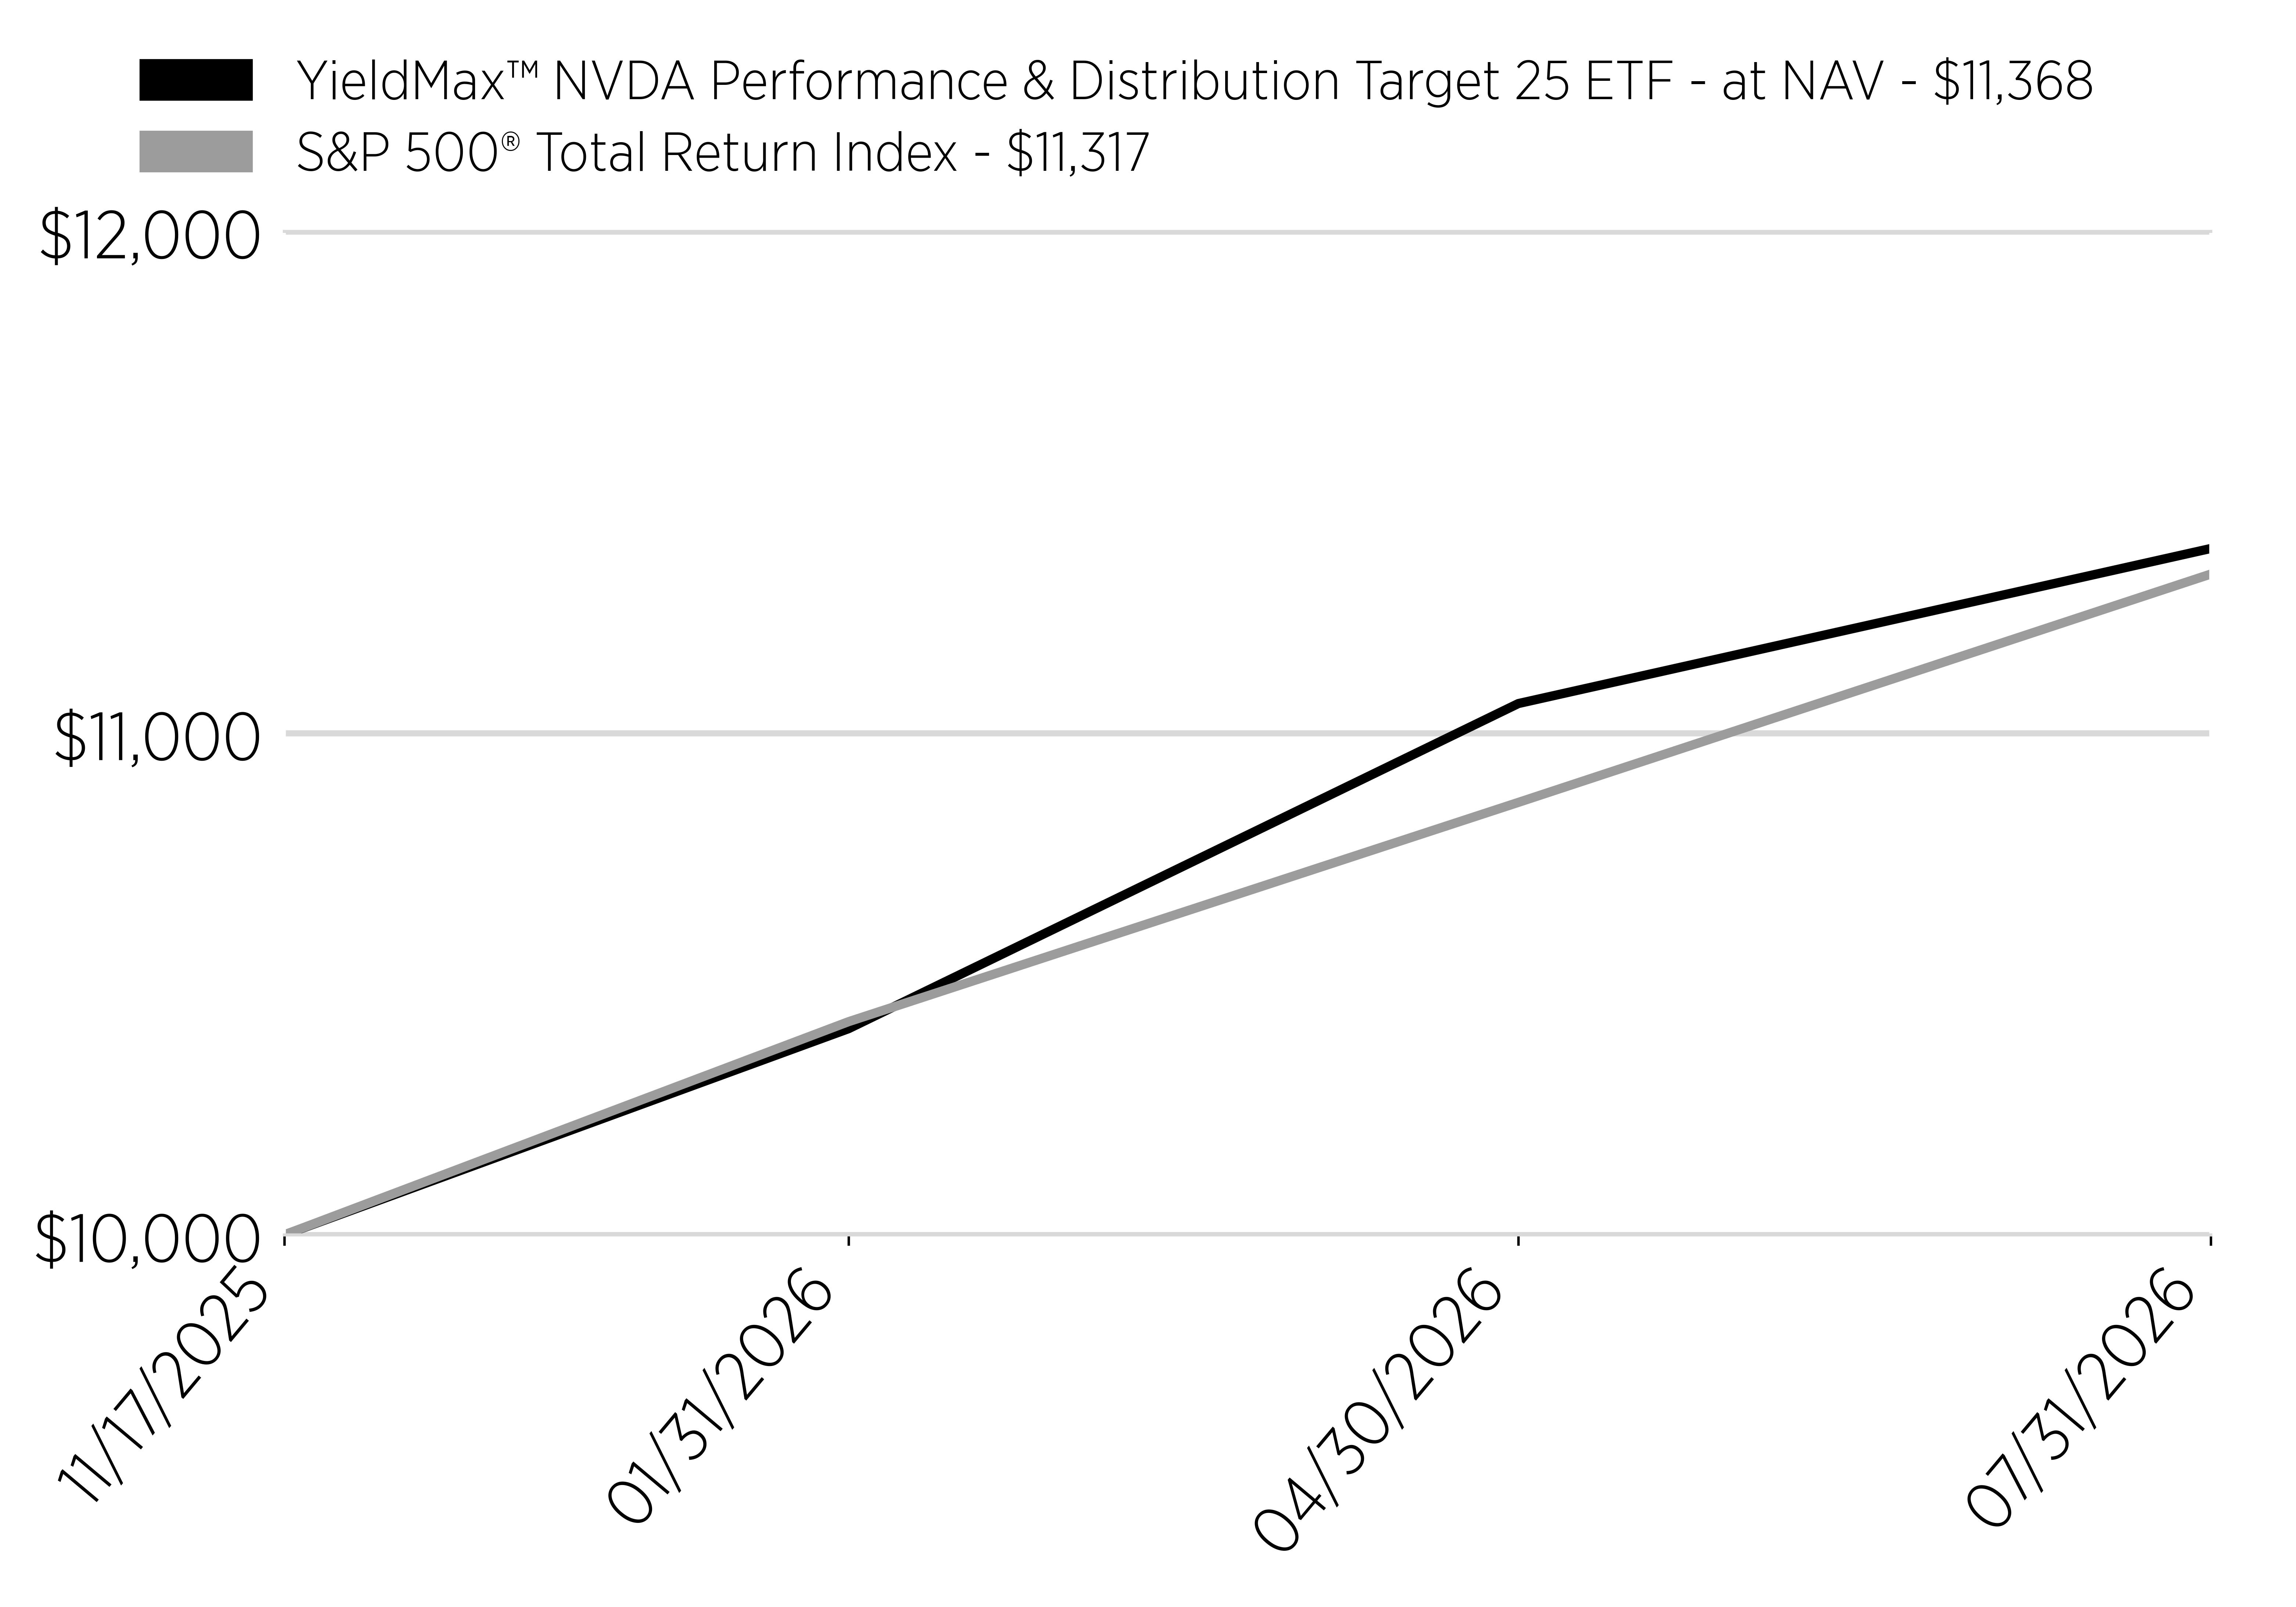
YieldMax™ NVDA Performance & Distribution Target 25 ETF - at NAV - $11,368
S&P 500® Total Return Index - $11,317
11/17/2025
10000
10000
1/31/2026
10411
10425
4/30/2026
11059
10862
7/31/2026
11368
11317
line
Average Annual Return [Table Text Block]

Annual Performance

Since Inception (11/17/25)
Yieldmax™ NVDA Performance & Distribution Target 25 ETF - at NAV
13.68%*
S&P 500® Total Return Index
13.17%
*Not Annualized for periods less than one year.
Performance Inception Date Nov. 17, 2025
No Deduction of Taxes [Text Block] The graph and table do not reflect the deduction of taxes that a shareholder would pay on fund distributions or redemption of fund shares.
Material Change Date Nov. 12, 2025
Updated Performance Information Location [Text Block] Visit www.yieldmaxetfs.com/our-etfs/nvit/ for more recent performance information.
Net Assets $ 10,817,000
Holdings Count | Holdings 10
Advisory Fees Paid, Amount $ 39,517
Investment Company, Portfolio Turnover 0.00%
Additional Fund Statistics [Text Block]

Key Fund Statistics

(as of July 31, 2026)

Fund Size (Thousands)
$10,817
Number of Holdings
10
Total Advisory Fee Paid
$39,517
Portfolio Turnover
0%
Holdings [Text Block]

What did the Fund invest in?

(as of July 31, 2026)

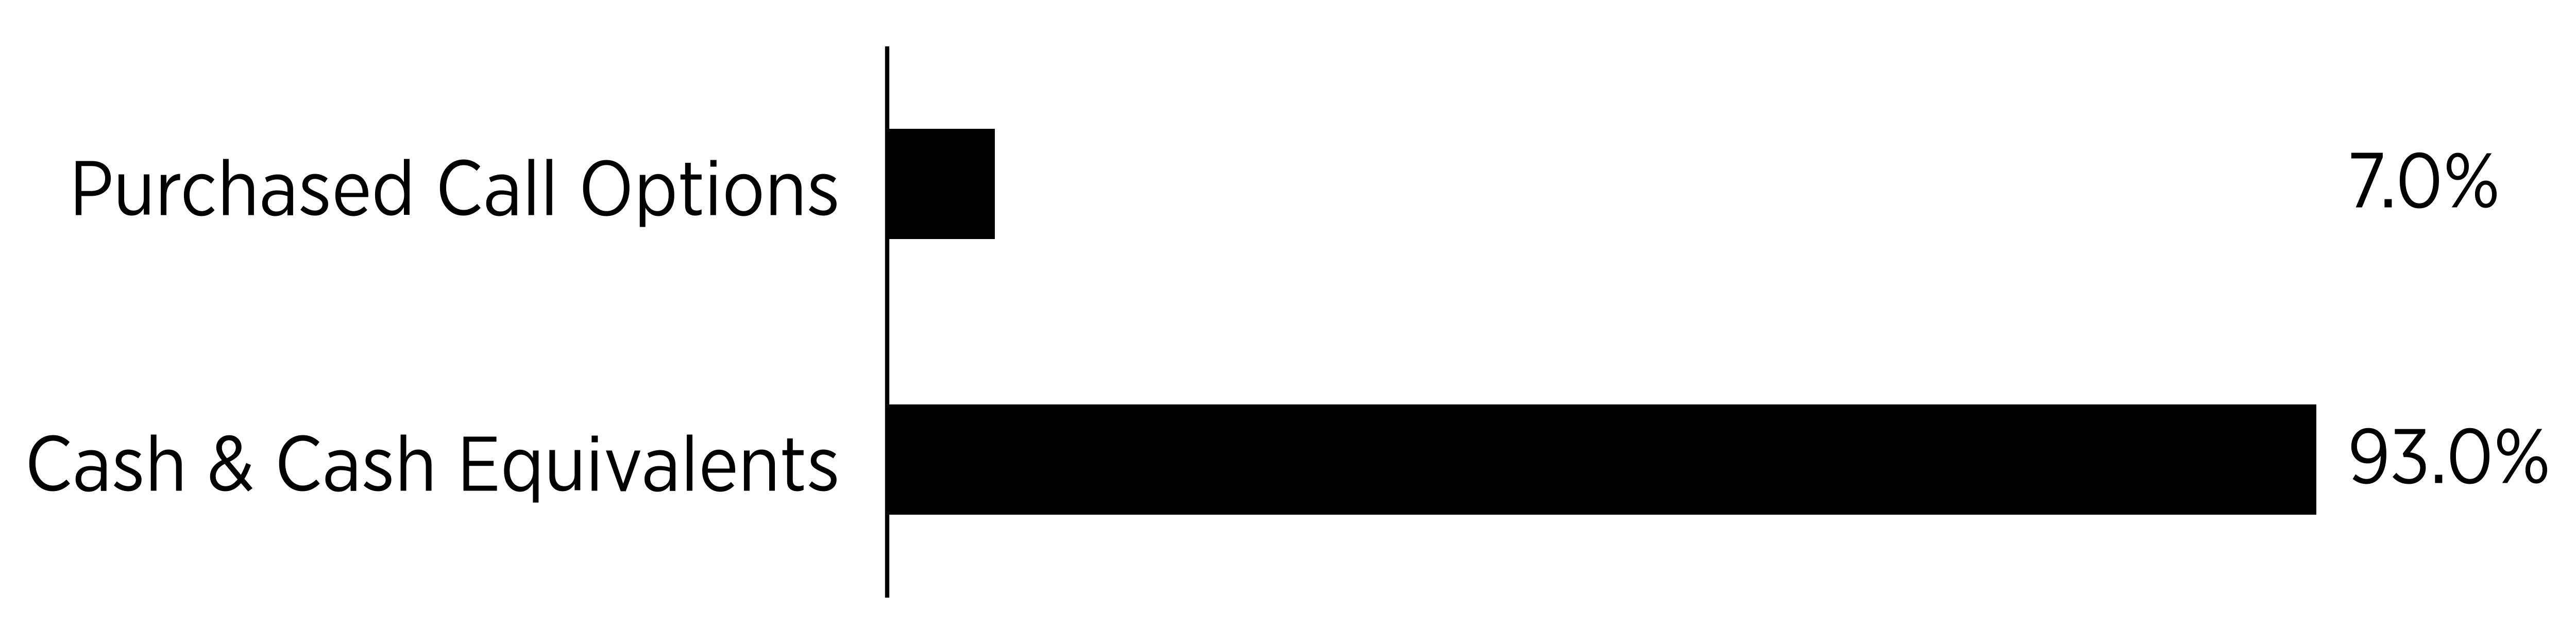
Security Type - Investments

(% of Net Assets)
Sector
%
Purchased Call Options
7.0%
Cash & Cash Equivalents
93.0%
bar


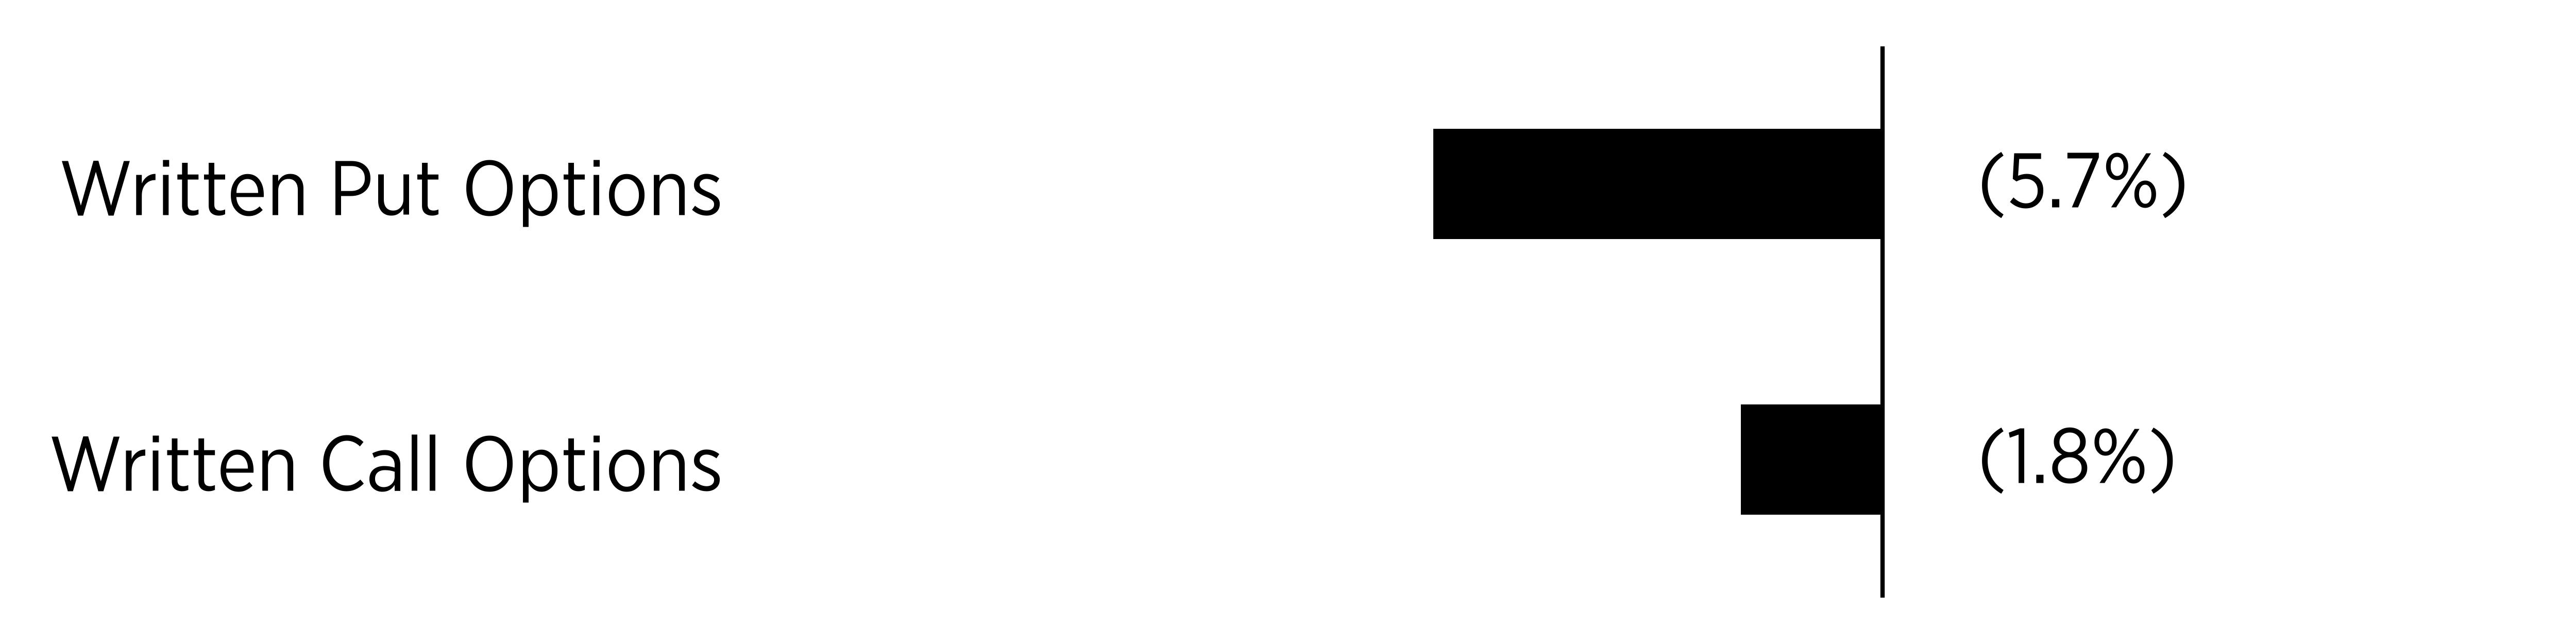
Security Type - Other Financial Instruments

(% of Net Assets)
Sector
%
Written Put Options
-5.7%
Written Call Options
-1.8%
bar


Percentages are based on net assets. Cash & Cash Equivalents represents cash, short-term investments and other assets in excess of liabilities.


Largest Holdings [Text Block]
Top Holdings
(% of Net Assets)
U.S. Treasury Bills
53.2
First American Government Obligations Fund - Class X, 3.58%
34.8
NVIDIA Corp., Expiration: 9/18/2026;
Exercise Price: $200.01
6.5
NVIDIA Corp., Expiration: 9/18/2026;
Exercise Price: $200.01
-5.7
NVIDIA Corp., Expiration: 8/21/2026;
Exercise Price: $210.00
-1.8
NVIDIA Corp., Expiration: 8/21/2026;
Exercise Price: $225.00
0.5
Material Fund Change [Text Block]

Fund Changes

Effective November 12, 2025 the Fund's listing exchange was changed to Cboe BZX Exchange, Inc.
YieldMax(R) R2000 0DTE Covered Call Strategy ETF  
Shareholder Report [Line Items]  
Fund Name YieldMax™ R2000 0DTE Covered Call Strategy ETF
Class Name YieldMax™ R2000 0DTE Covered Call Strategy ETF
Trading Symbol RDTY
Security Exchange Name NASDAQ
Annual or Semi-Annual Statement [Text Block] This annual shareholder report contains important information about the YieldMax™ R2000 0DTE Covered Call Strategy ETF (the "Fund") for the period August 1, 2025 to July 31, 2026.
Shareholder Report Annual or Semi-Annual annual shareholder report
Additional Information [Text Block] You can find additional information about the Fund at www.yieldmaxetfs.com/our-etfs/rdty/. You can also request this information by contacting us at (844) 737-3001 or by writing to YieldMax™ R2000 0DTE Covered Call Strategy ETF, c/o U.S. Bank Global Fund Services, P.O. Box 701, Milwaukee, Wisconsin 53201‑0701.
Additional Information Phone Number (844) 737-3001
Additional Information Website www.yieldmaxetfs.com/our-etfs/rdty/
Expenses [Text Block]

What were the Fund costs for the past year?

(based on a hypothetical $10,000 investment)

Class Name
Costs of a $10,000 investment
Costs paid as a percentage of a $10,000 investment
YieldMax™ R2000 0DTE Covered Call Strategy ETF
$139
1.24%*
*Costs paid as a percentage of a $10,000 investment is an annualized figure.


Expenses Paid, Amount $ 139
Expense Ratio, Percent 1.24% [15]
Factors Affecting Performance [Text Block]

How Did the Fund Perform During the Reporting Period?

The Fund had a positive total return as gains in the Russell 2000 Index and income generated by its options strategy contributed to performance. The Fund also provided shareholders with regular income distributions.

What Factors Influenced Performance?

Performance was primarily influenced by movements in the Russell 2000 Index and index volatility. Index gains and premiums from daily zero-days-to-expiration (“0DTE”) call options contributed positively to results.

Positioning of the Fund

The Fund continued to employ a synthetic covered call strategy designed to generate current income while maintaining exposure to the Russell 2000 Index. The Fund sold 0DTE call options daily and, starting in mid-September 2025, began distributing income weekly.

Performance Past Does Not Indicate Future [Text] The Fund's past performance is not a good indicator of how the Fund will perform in the future.
Line Graph [Table Text Block]

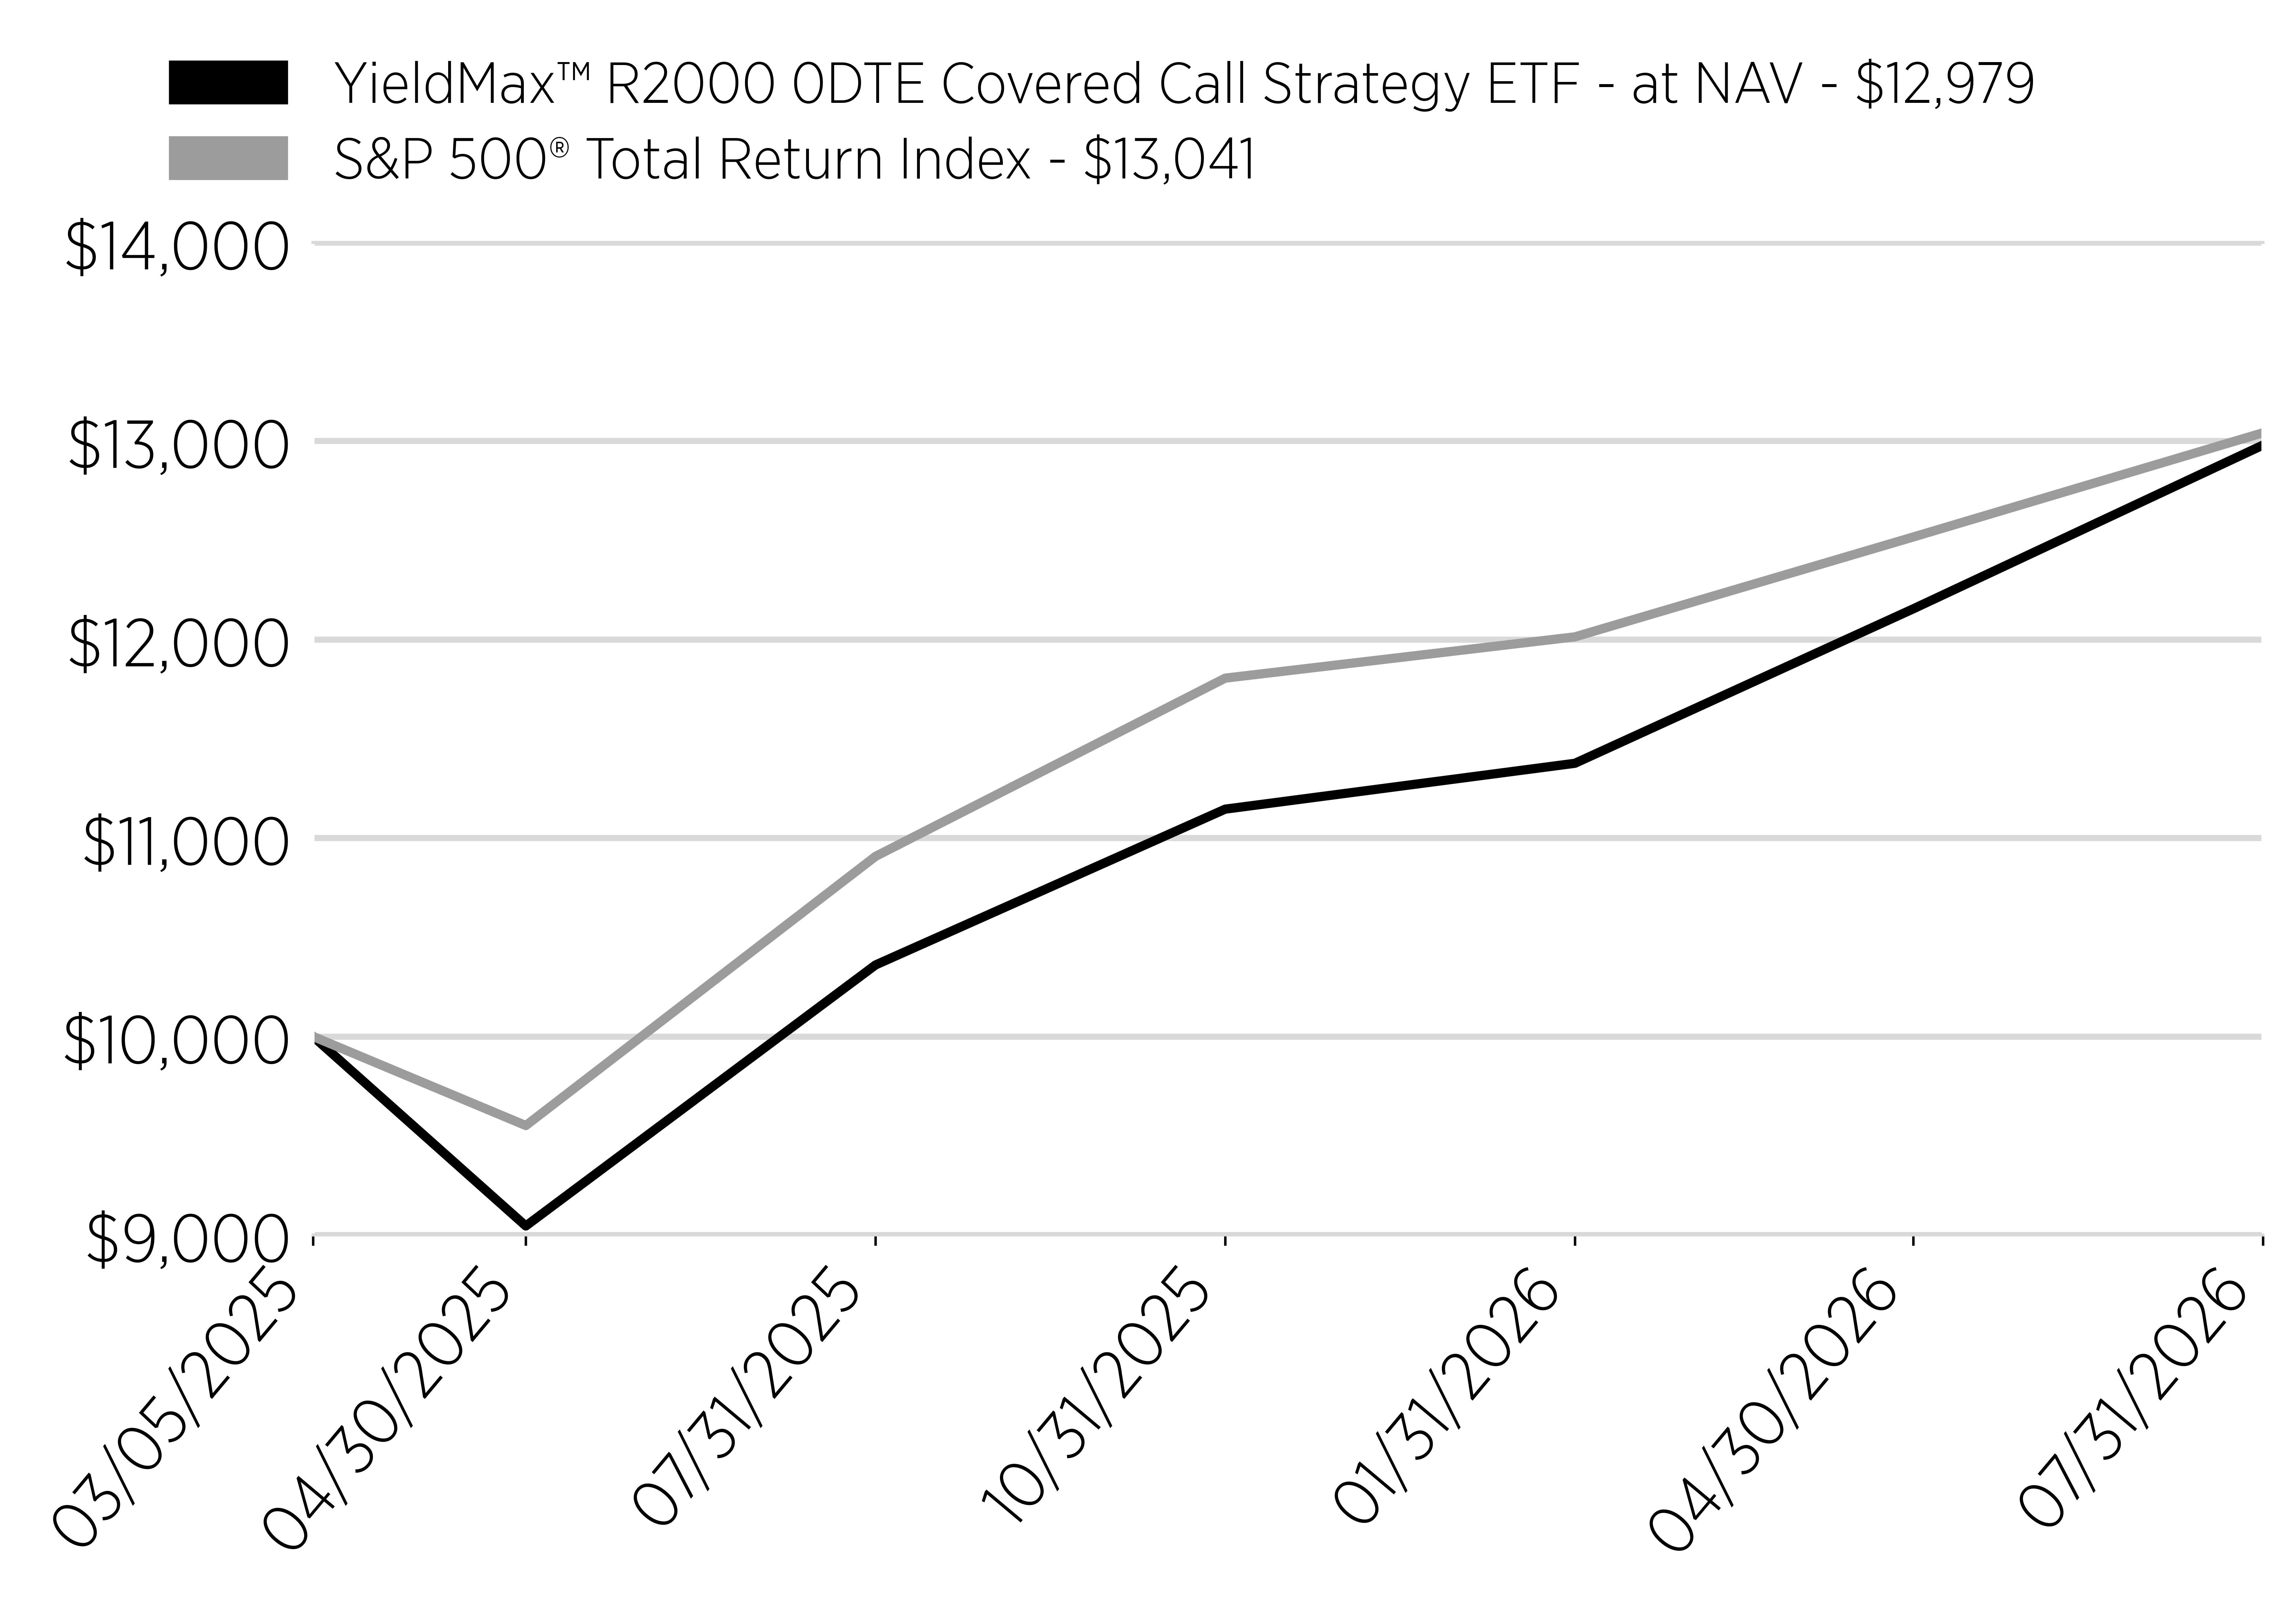
Cumulative Performance

(Initial Investment of $10,000)
Date
YieldMax™ R2000 0DTE Covered Call Strategy ETF - at NAV - $12,979
S&P 500® Total Return Index - $13,041
3/5/2025
10000
10000
4/30/2025
9045
9551
7/31/2025
10360
10907
10/31/2025
11145
11805
1/31/2026
11376
12013
4/30/2026
12154
12516
7/31/2026
12979
13041
line
Average Annual Return [Table Text Block]

Annual Performance

1 Year
Since Inception
(3/5/25)
Yieldmax™ R2000 0DTE Covered
Call Strategy ETF - at NAV
25.22%
20.38%
S&P 500® Total Return Index
19.56%
20.80%
Performance Inception Date Mar. 05, 2025
No Deduction of Taxes [Text Block] The graph and table do not reflect the deduction of taxes that a shareholder would pay on fund distributions or redemption of fund shares.
Material Change Date Sep. 12, 2025
Updated Performance Information Location [Text Block] Visit www.yieldmaxetfs.com/our-etfs/rdty/ for more recent performance information.
Net Assets $ 30,921,000
Holdings Count | Holdings 3
Advisory Fees Paid, Amount $ 138,067
Investment Company, Portfolio Turnover 3.00%
Additional Fund Statistics [Text Block]

Key Fund Statistics

(as of July 31, 2026)

Fund Size (Thousands)
$30,921
Number of Holdings
3
Total Advisory Fee Paid
$138,067
Portfolio Turnover
3%
Holdings [Text Block]

What did the Fund invest in?

(as of July 31, 2026)

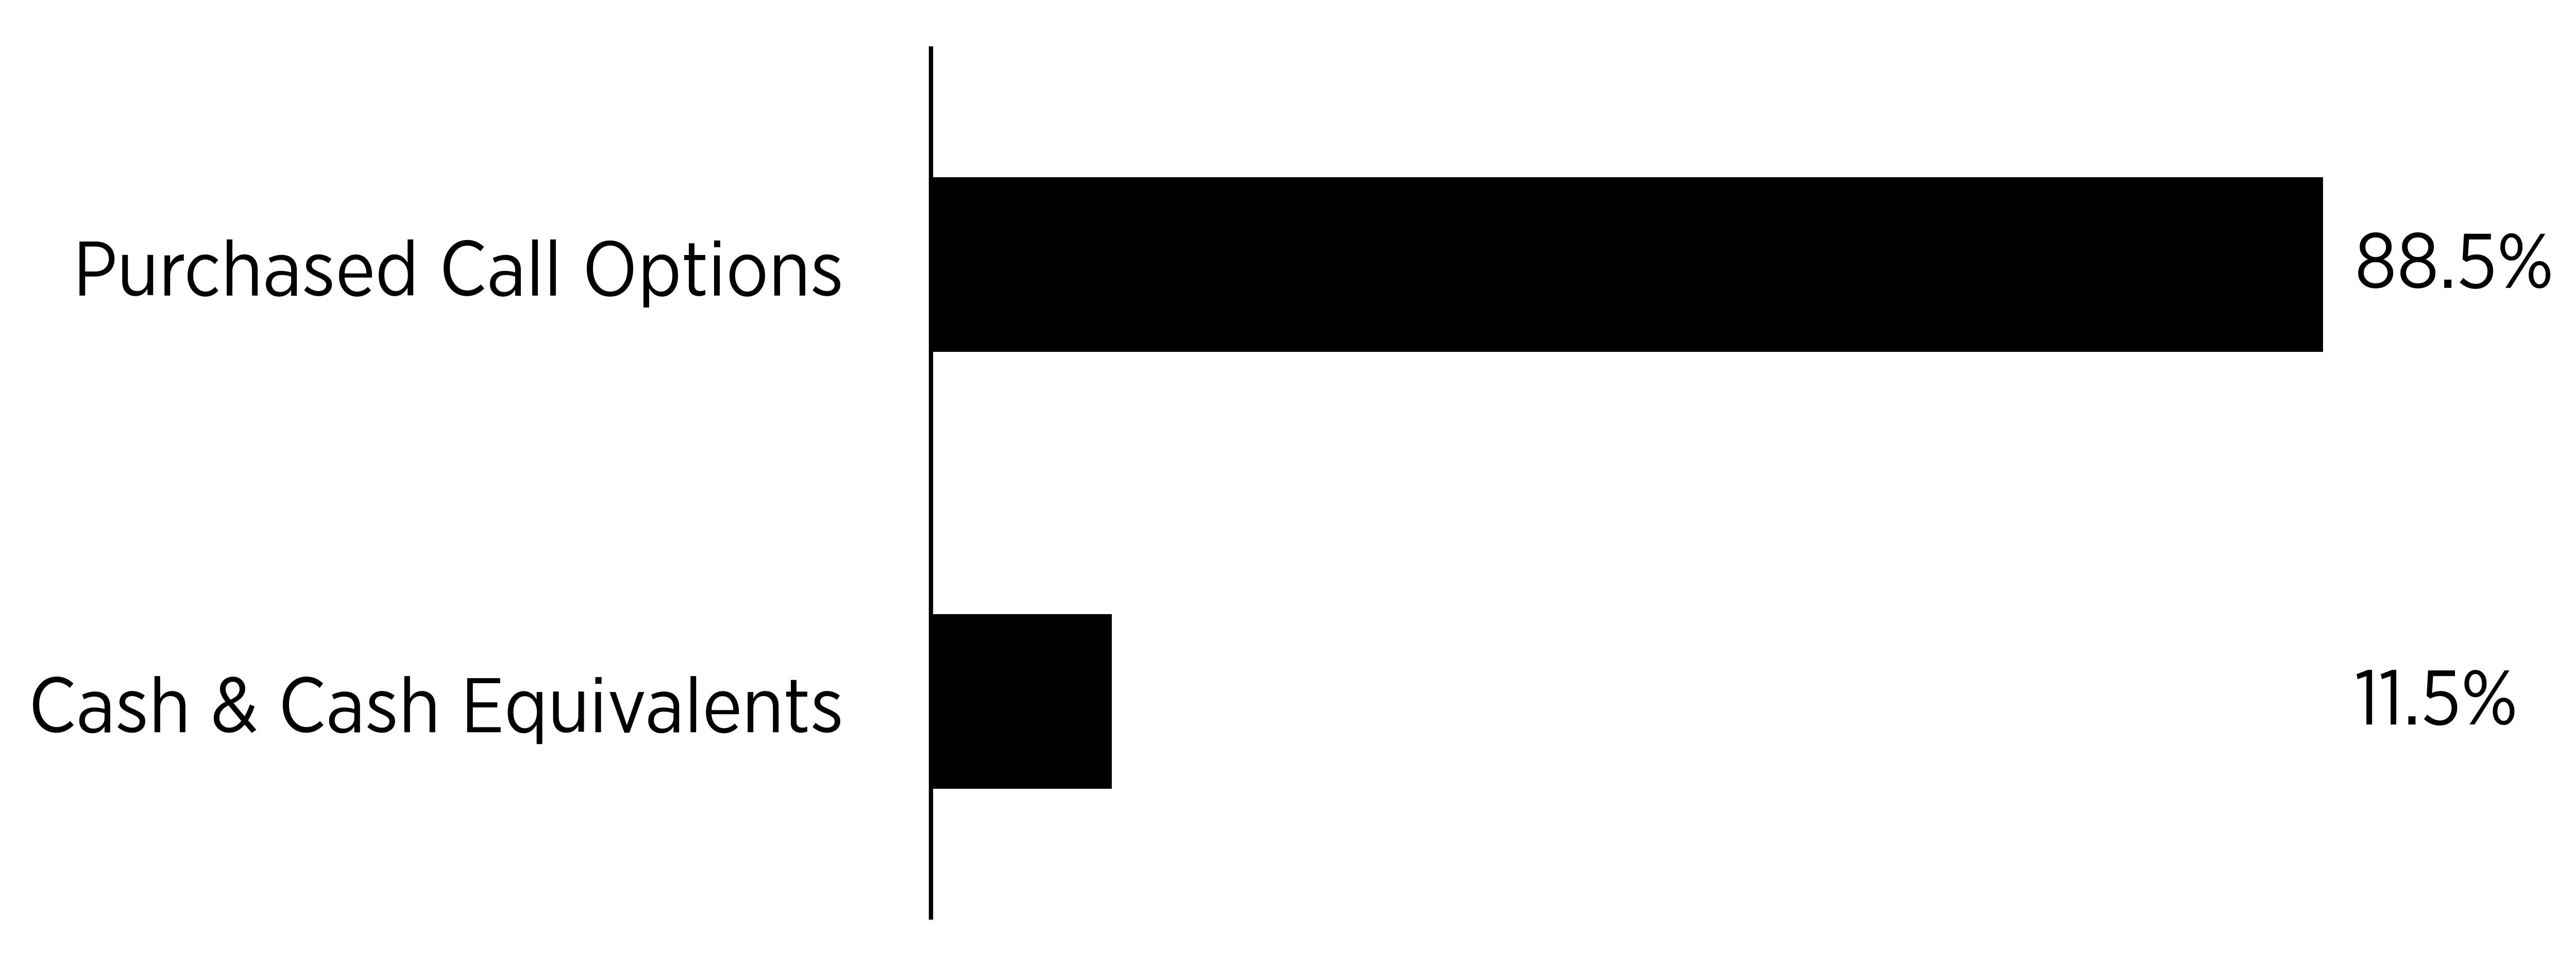
Security Type - Investments

(% of Net Assets)
Sector
%
Purchased Call Options
88.5%
Cash & Cash Equivalents
11.5%
bar

Percentages are based on net assets. Cash & Cash Equivalents represents cash, short-term investments and other assets in excess of liabilities.


Largest Holdings [Text Block]
Top Holdings
(% of Net Assets)
Russell 2000 Index, Expiration: 12/18/2026; Exercise Price: $310.26
88.5
First American Government Obligations Fund - Class X, 3.58%
9.8
U.S. Treasury Bills
0.1
Material Fund Change [Text Block]

Fund Changes

Effective September 12, 2025 the Fund intends to pay out dividends and interest income, if any, weekly, and distribute any net realized capital gains to its shareholders at least annually. The Fund intends to distribute to its shareholders substantially all of its investment company taxable income (computed without regard to the deduction for dividends paid), its net tax-exempt income, if any, and any net capital gain (net long-term capital gains in excess of net short-term capital losses, taking into account any capital loss carryforwards).
YieldMax(R) RDDT Option Income Strategy ETF  
Shareholder Report [Line Items]  
Fund Name YieldMax™ RDDT Option Income Strategy ETF
Class Name YieldMax™ RDDT Option Income Strategy ETF
Trading Symbol RDYY
Security Exchange Name NYSEArca
Annual or Semi-Annual Statement [Text Block] This annual shareholder report contains important information about the YieldMax™ RDDT Option Income Strategy ETF (the "Fund") for the period August 1, 2025 to July 31, 2026.
Shareholder Report Annual or Semi-Annual annual shareholder report
Additional Information [Text Block] You can find additional information about the Fund at www.yieldmaxetfs.com/our-etfs/rdyy/. You can also request this information by contacting us at (844) 737-3001 or by writing to YieldMax™ RDDT Option Income Strategy ETF, c/o U.S. Bank Global Fund Services, P.O. Box 701, Milwaukee, Wisconsin 53201‑0701.
Additional Information Phone Number (844) 737-3001
Additional Information Website www.yieldmaxetfs.com/our-etfs/rdyy/
Expenses [Text Block]

What were the Fund costs for the past year?

(based on a hypothetical $10,000 investment)

Class Name
Costs of a $10,000 investment
Costs paid as a percentage of a $10,000 investment
YieldMax™ RDDT Option Income Strategy ETF
$74*
1.02%**
*The Fund commenced operations on September 8, 2025. Expenses for a full reporting period would be higher than the figures shown.
**Costs paid as a percentage of a $10,000 investment is an annualized figure.


Expenses Paid, Amount $ 74 [16]
Expense Ratio, Percent 1.02% [17]
Expenses Short Period Footnote [Text Block] The Fund commenced operations on September 8, 2025. Expenses for a full reporting period would be higher than the figures shown.
Factors Affecting Performance [Text Block]

How Did the Fund Perform During the Reporting Period?

The Fund had a negative total return as declines in Reddit, Inc. (“RDDT”) outweighed income generated by its call spread strategy. The Fund also provided shareholders with regular income distributions.

What Factors Influenced Performance?

Performance was primarily influenced by RDDT’s share price and implied volatility. Declines in RDDT detracted from results, while option premiums partially offset those losses.

Positioning of the Fund

The Fund continued to sell call spreads to generate current income while maintaining exposure to a portion of RDDT’s performance.
Performance Past Does Not Indicate Future [Text] The Fund's past performance is not a good indicator of how the Fund will perform in the future.
Line Graph [Table Text Block]

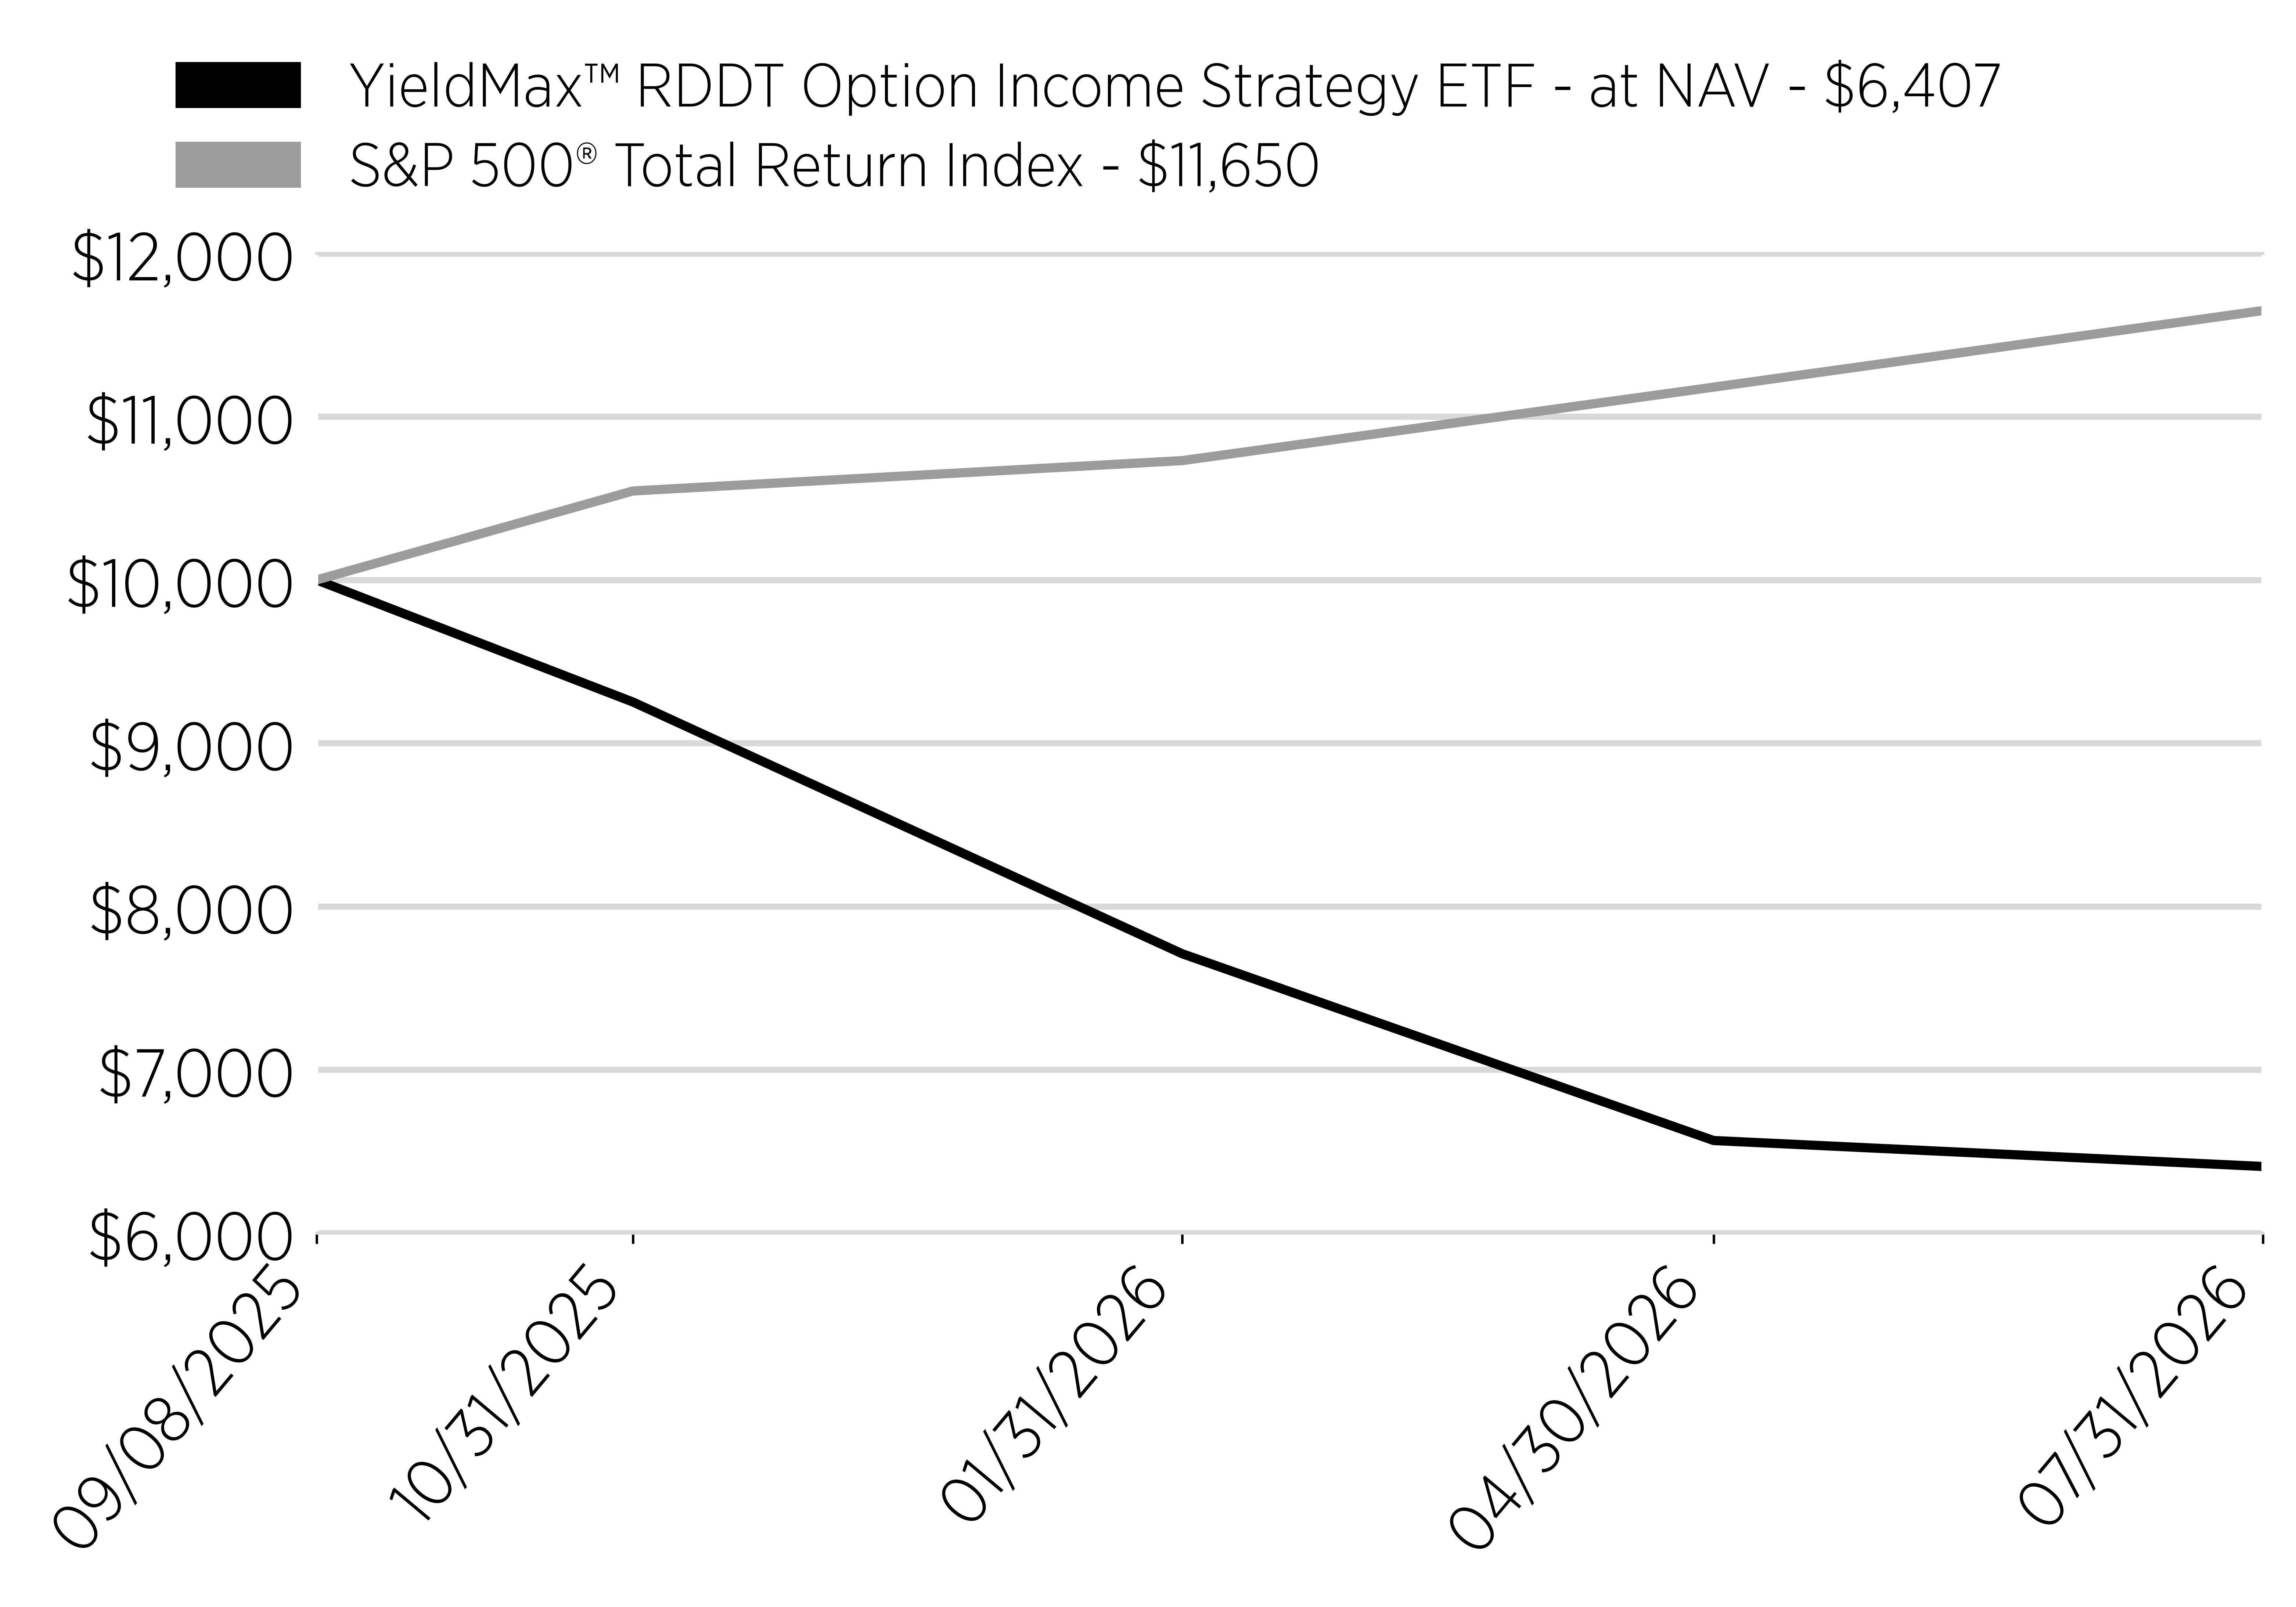
Cumulative Performance

(Initial Investment of $10,000)
Date
YieldMax™ RDDT Option Income Strategy ETF - at NAV - $6,407
S&P 500® Total Return Index - $11,650
9/8/2025
10000
10000
10/31/2025
9252
10545
1/31/2026
7710
10731
4/30/2026
6566
11181
7/31/2026
6407
11650
line
Average Annual Return [Table Text Block]

Annual Performance

Since Inception (9/8/25)
Yieldmax™ RDDT Option Income Strategy ETF - at NAV
-36.84%*
S&P 500® Total Return Index
16.50%
*Not Annualized for periods less than one year.
Performance Inception Date Sep. 08, 2025
No Deduction of Taxes [Text Block] The graph and table do not reflect the deduction of taxes that a shareholder would pay on fund distributions or redemption of fund shares.
Material Change Date Sep. 18, 2025
Updated Performance Information Location [Text Block] Visit www.yieldmaxetfs.com/our-etfs/rdyy/ for more recent performance information.
Net Assets $ 12,589,000
Holdings Count | Holdings 12
Advisory Fees Paid, Amount $ 169,267
Investment Company, Portfolio Turnover 0.00%
Additional Fund Statistics [Text Block]

Key Fund Statistics

(as of July 31, 2026)

Fund Size (Thousands)
$12,589
Number of Holdings
12
Total Advisory Fee Paid
$169,267
Portfolio Turnover
0%
Holdings [Text Block]

What did the Fund invest in?

(as of July 31, 2026)

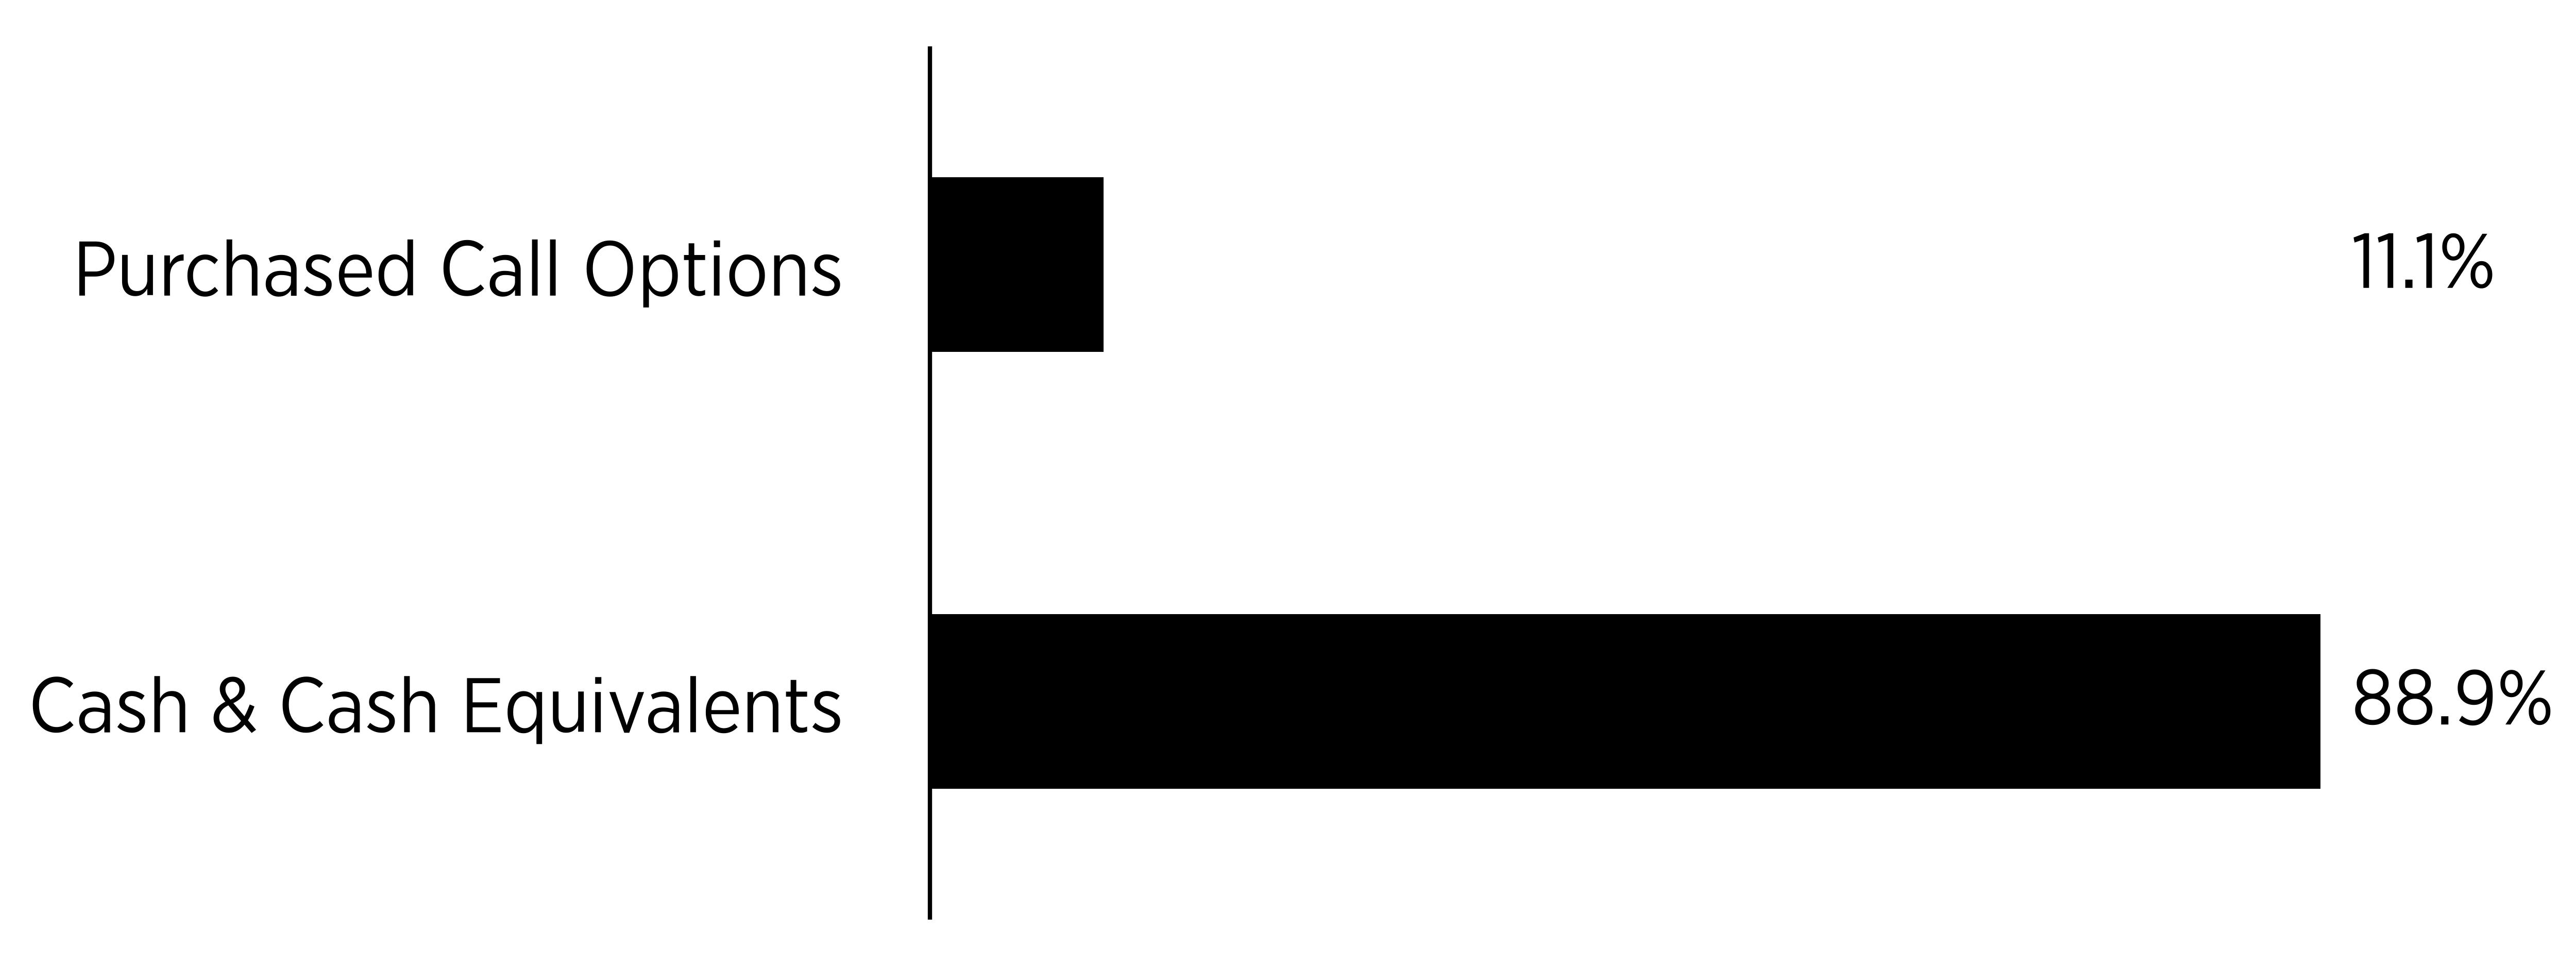
Security Type - Investments

(% of Net Assets)
Sector
%
Purchased Call Options
11.1%
Cash & Cash Equivalents
88.9%
bar


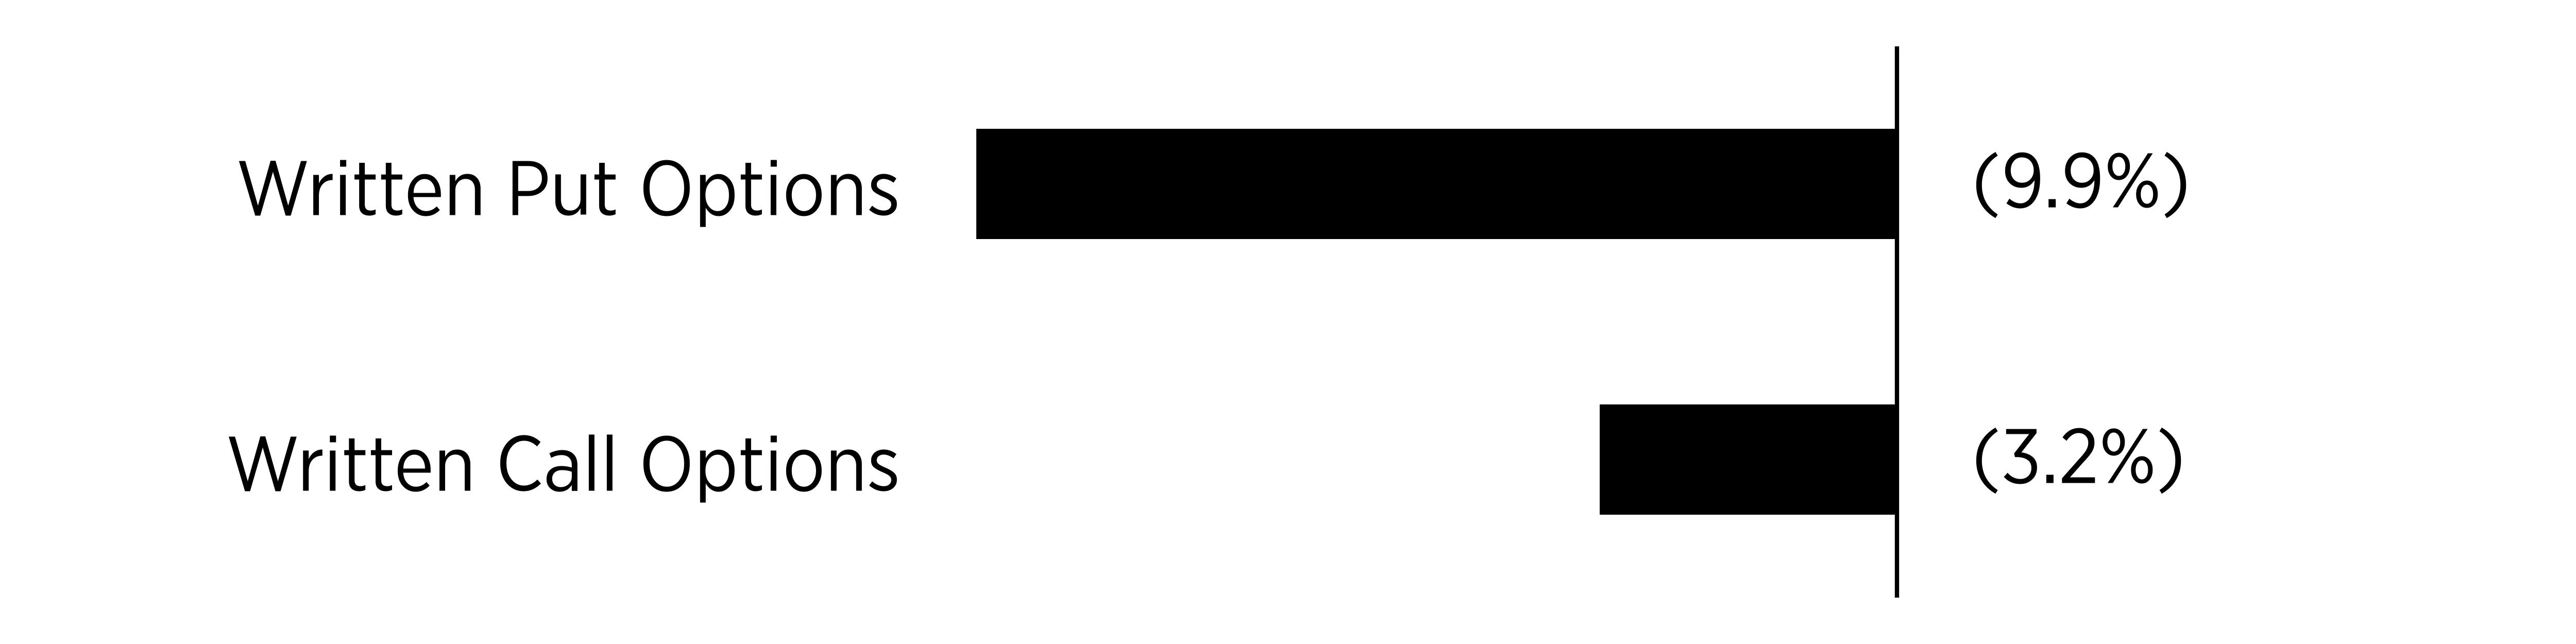
Security Type - Other Financial Instruments

(% of Net Assets)
Sector
%
Written Put Options
-9.9%
Written Call Options
-3.2%
bar


Percentages are based on net assets. Cash & Cash Equivalents represents cash, short-term investments, and liabilities in excess of other assets.


Largest Holdings [Text Block]
Top Holdings
(% of Net Assets)
U.S. Treasury Bills
96.1
Reddit, Inc., Expiration: 9/18/2026;
Exercise Price: $140.01
-9.8
Reddit, Inc., Expiration: 9/18/2026;
Exercise Price: $140.01
9.6
First American Government Obligations Fund - Class X, 3.58%
4.1
Reddit, Inc., Expiration: 8/7/2026;
Exercise Price: $144.00
-2.1
Reddit, Inc., Expiration: 8/7/2026;
Exercise Price: $140.00
-1.2
Reddit, Inc., Expiration: 8/7/2026;
Exercise Price: $152.50
0.9
Reddit, Inc., Expiration: 8/7/2026;
Exercise Price: $147.00
0.6
Material Fund Change [Text Block]

Fund Changes

Effective September 18, 2025 the Fund's payment of income distributions was changed to seek to make such distributions on a monthly or more frequent basis.

Effective October 14, 2025 the Fund's payment of income distributions was changed to seek to make such distributions on a weekly basis.

YieldMax(R) S&P 500 0DTE Covered Call Strategy ETF  
Shareholder Report [Line Items]  
Fund Name YieldMax™ S&P 500 0DTE Covered Call Strategy ETF
Class Name YieldMax™ S&P 500 0DTE Covered Call Strategy ETF
Trading Symbol SDTY
Security Exchange Name NASDAQ
Annual or Semi-Annual Statement [Text Block] This annual shareholder report contains important information about the YieldMax™ S&P 500 0DTE Covered Call Strategy ETF (the "Fund") for the period August 1, 2025 to July 31, 2026.
Shareholder Report Annual or Semi-Annual annual shareholder report
Additional Information [Text Block] You can find additional information about the Fund at www.yieldmaxetfs.com/our-etfs/sdty/. You can also request this information by contacting us at (844) 737-3001 or by writing to YieldMax™ S&P 500 0DTE Covered Call Strategy ETF, c/o U.S. Bank Global Fund Services, P.O. Box 701, Milwaukee, Wisconsin 53201‑0701.
Additional Information Phone Number (844) 737-3001
Additional Information Website www.yieldmaxetfs.com/our-etfs/sdty/
Expenses [Text Block]

What were the Fund costs for the past year?

(based on a hypothetical $10,000 investment)

Class Name
Costs of a $10,000 investment
Costs paid as a percentage of a $10,000 investment
YieldMax™ S&P 500 0DTE Covered Call Strategy ETF
$110
1.02%*
*Costs paid as a percentage of a $10,000 investment is an annualized figure.


Expenses Paid, Amount $ 110
Expense Ratio, Percent 1.02% [18]
Factors Affecting Performance [Text Block]

How Did the Fund Perform During the Reporting Period?

The Fund had a positive total return as gains in the S&P 500 Index and income generated by its options strategy contributed to performance. The Fund also provided shareholders with regular income distributions.

What Factors Influenced Performance?

Performance was primarily influenced by movements in the S&P 500 Index and index volatility. Index gains and premiums from daily zero-days-to-expiration (“0DTE”) call options contributed positively to results.

Positioning of the Fund

The Fund continued to employ a synthetic covered call strategy designed to generate current income while maintaining exposure to the S&P 500 Index. The Fund sold 0DTE call options daily and beginning in mid-September 2025, started distributing income weekly.

Performance Past Does Not Indicate Future [Text] The Fund's past performance is not a good indicator of how the Fund will perform in the future.
Line Graph [Table Text Block]

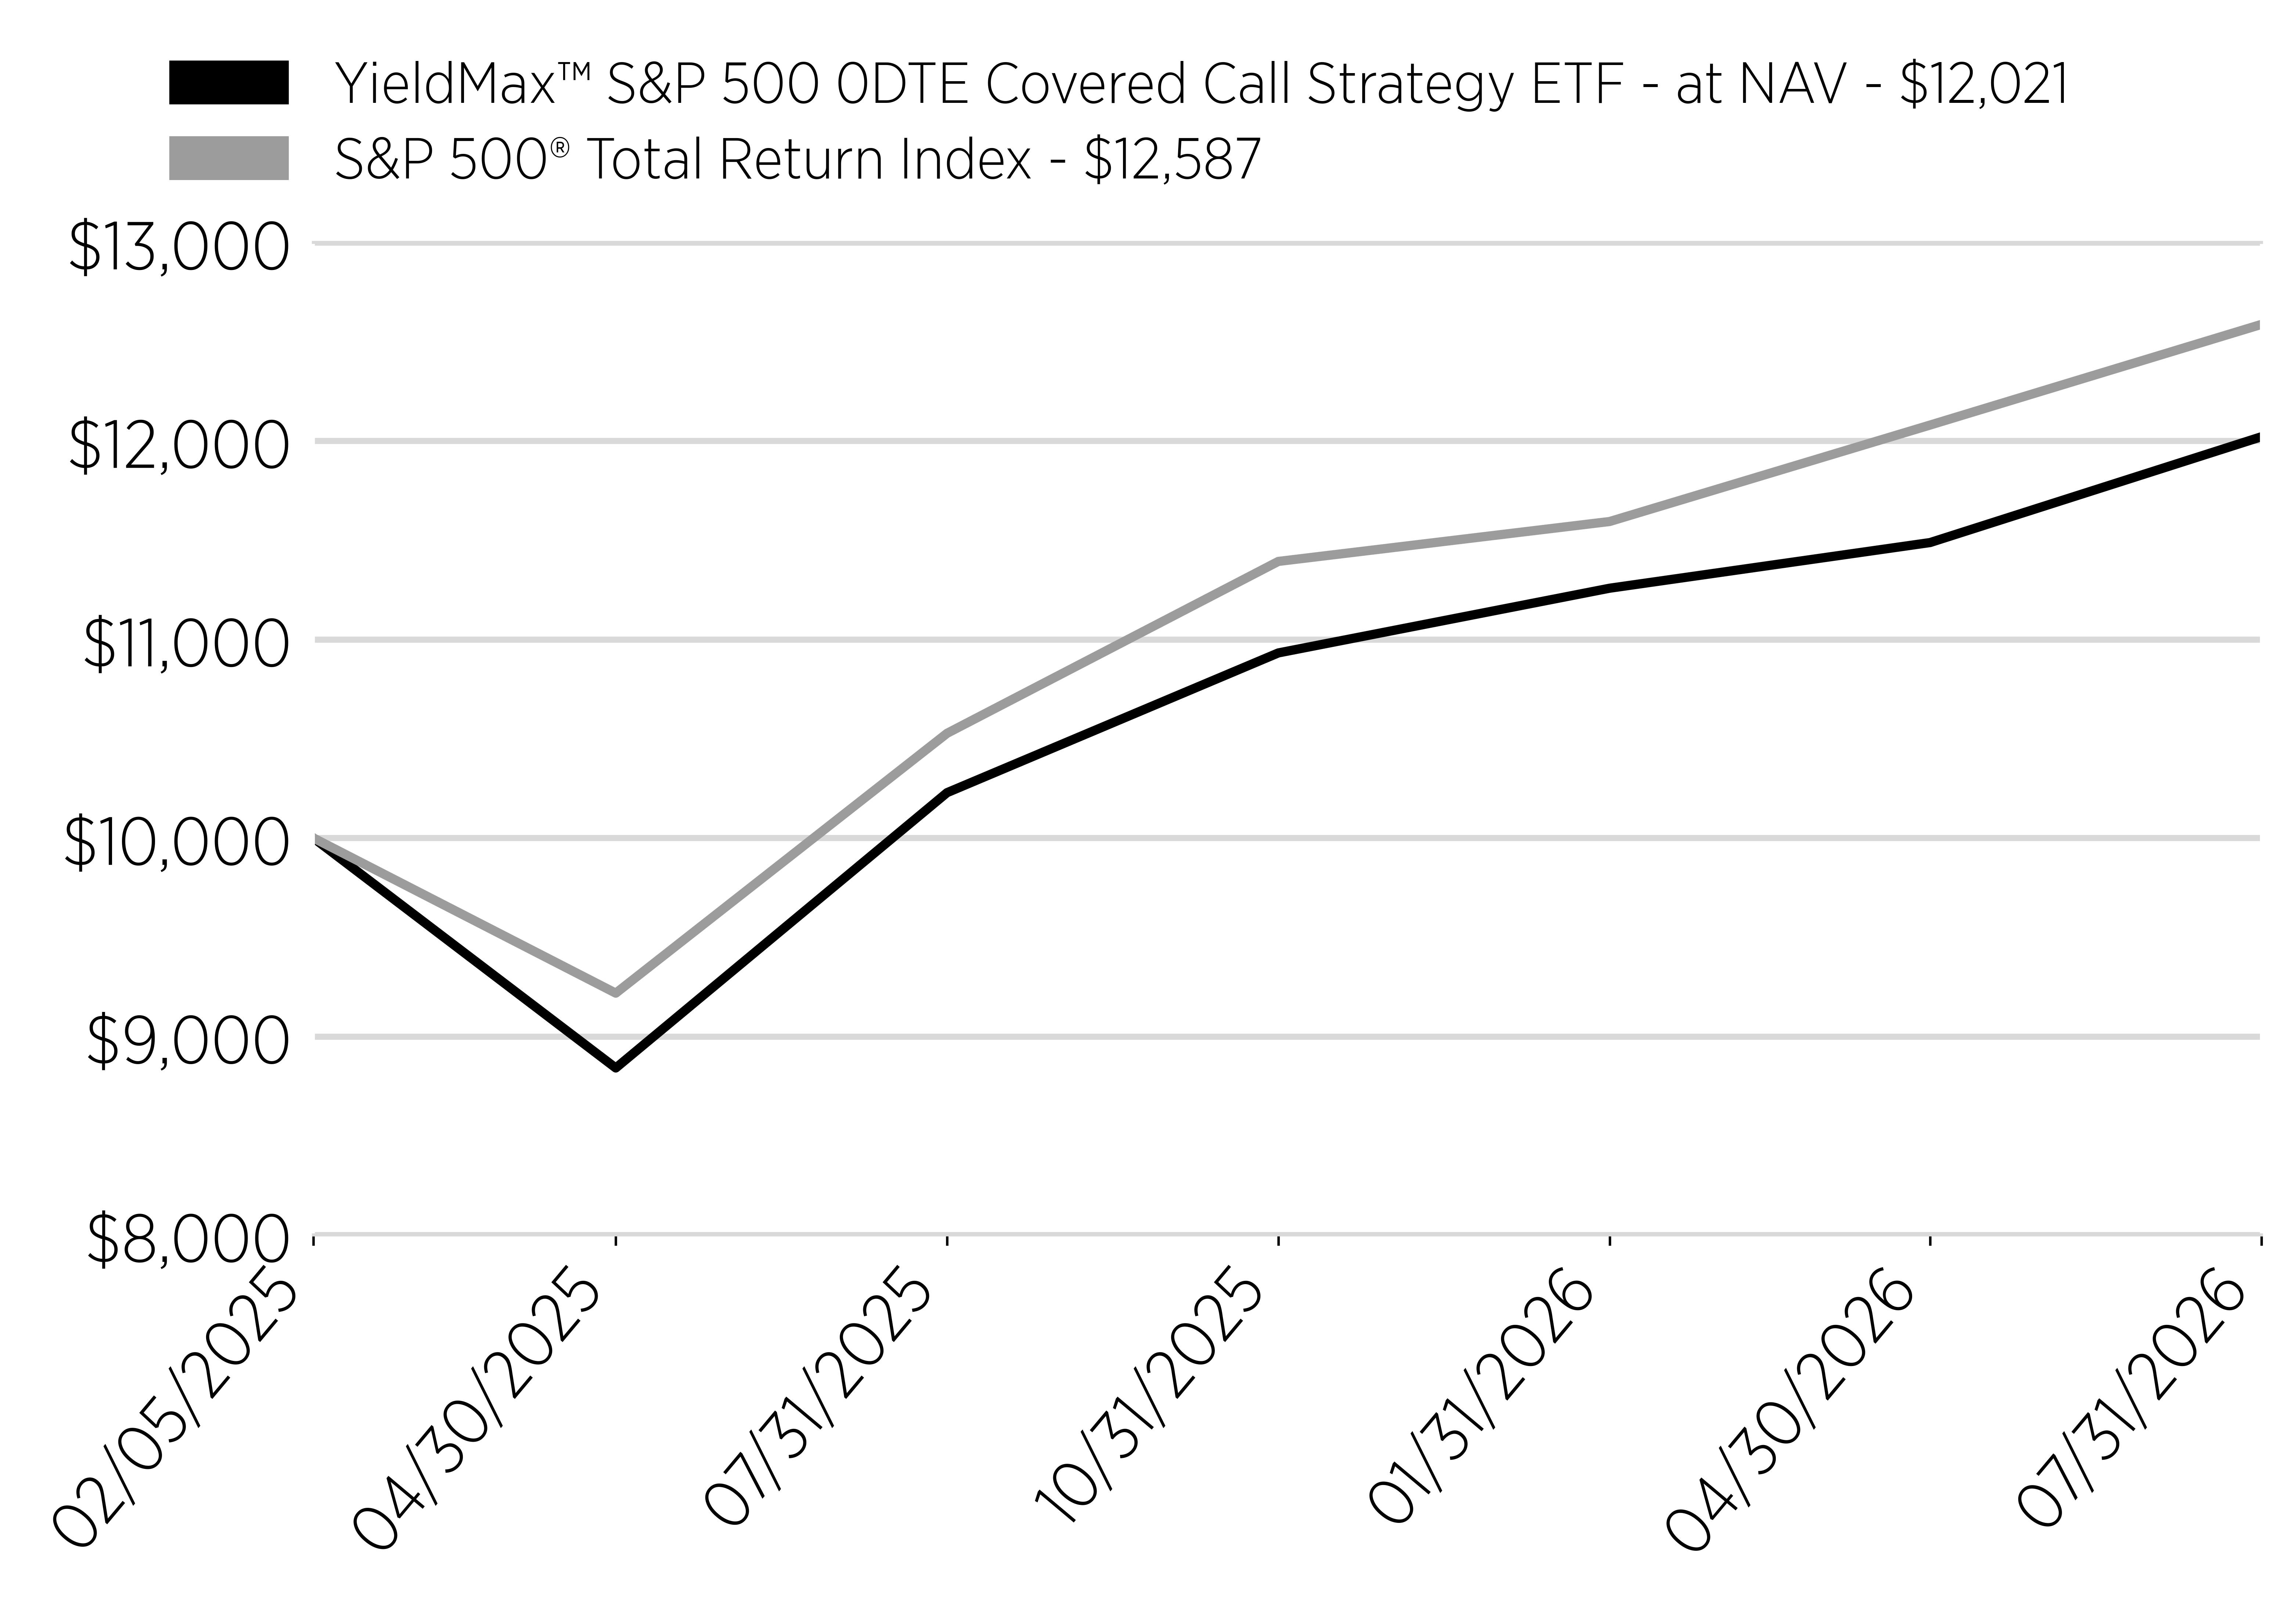
Cumulative Performance

(Initial Investment of $10,000)
Date
YieldMax™ S&P 500 0DTE Covered Call Strategy ETF - at NAV - $12,021
S&P 500® Total Return Index - $12,587
2/5/2025
10000
10000
4/30/2025
8841
9218
7/31/2025
10228
10527
10/31/2025
10932
11393
1/31/2026
11258
11594
4/30/2026
11488
12080
7/31/2026
12021
12587
line
Average Annual Return [Table Text Block]

Annual Performance

1 Year
Since Inception (2/5/25)
Yieldmax™ S&P 500 0DTE Covered Call Strategy ETF - at NAV
17.56%
13.23%
S&P 500® Total Return Index
19.56%
16.79%
Performance Inception Date Feb. 05, 2025
No Deduction of Taxes [Text Block] The graph and table do not reflect the deduction of taxes that a shareholder would pay on fund distributions or redemption of fund shares.
Material Change Date Sep. 12, 2025
Updated Performance Information Location [Text Block] Visit www.yieldmaxetfs.com/our-etfs/sdty/ for more recent performance information.
Net Assets $ 46,284,000
Holdings Count | Holdings 5
Advisory Fees Paid, Amount $ 213,011
Investment Company, Portfolio Turnover 0.00% [19]
Additional Fund Statistics [Text Block]

Key Fund Statistics

(as of July 31, 2026)

Fund Size (Thousands)
$46,284
Number of Holdings
5
Total Advisory Fee Paid
$213,011
Portfolio Turnover
0%*
*Does not round to 1%.
Holdings [Text Block]

What did the Fund invest in?

(as of July 31, 2026)

Security Type - Investments

(% of Net Assets)
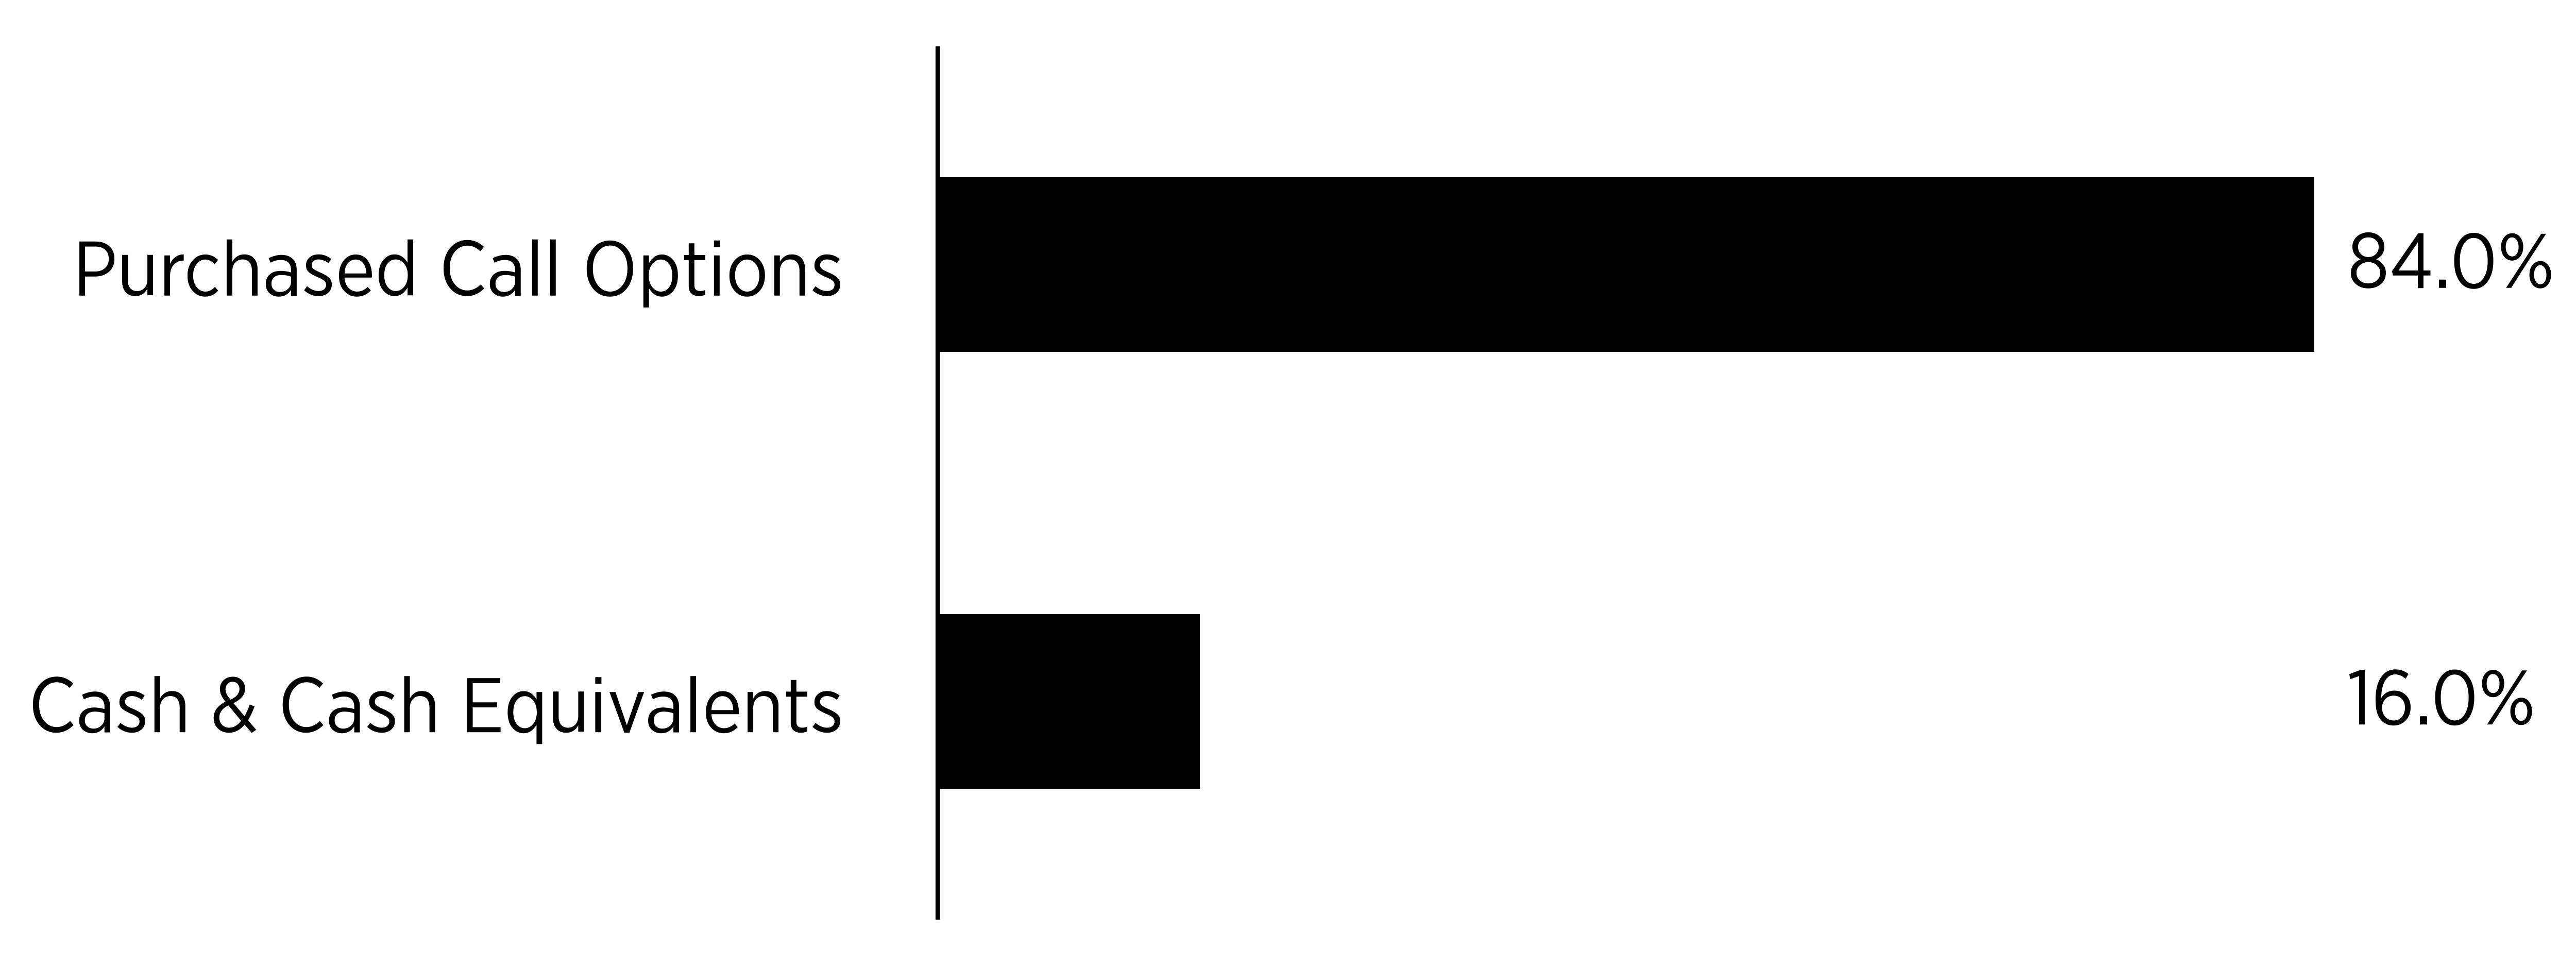
Sector
%
Purchased Call Options
84.0%
Cash & Cash Equivalents
16.0%
bar

Percentages are based on net assets. Cash & Cash Equivalents represents cash, short-term investments and other assets in excess of liabilities.


Largest Holdings [Text Block]
Top Holdings
(% of Net Assets)
S&P 500 Index, Expiration: 12/18/2026; Exercise Price: $1,200.26
84.0
First American Government Obligations Fund - Class X, 3.58%
12.2
U.S. Treasury Bills
1.6
Material Fund Change [Text Block]

Fund Changes

Effective September 12, 2025 the Fund intends to pay out dividends and interest income, if any, weekly, and distribute any net realized capital gains to its shareholders at least annually. The Fund intends to distribute to its shareholders substantially all of its investment company taxable income (computed without regard to the deduction for dividends paid), its net tax-exempt income, if any, and any net capital gain (net long-term capital gains in excess of net short-term capital losses, taking into account any capital loss carryforwards).
YieldMax(R) Semiconductor Portfolio Option Income ETF  
Shareholder Report [Line Items]  
Fund Name YieldMax™ Semiconductor Portfolio Option Income ETF
Class Name YieldMax™ Semiconductor Portfolio Option Income ETF
Trading Symbol CHPY
Security Exchange Name NYSEArca
Annual or Semi-Annual Statement [Text Block] This annual shareholder report contains important information about the YieldMax™ Semiconductor Portfolio Option Income ETF (the "Fund") for the period August 1, 2025 to July 31, 2026.
Shareholder Report Annual or Semi-Annual annual shareholder report
Additional Information [Text Block] You can find additional information about the Fund at www.yieldmaxetfs.com/our-etfs/chpy/. You can also request this information by contacting us at (844) 737-3001 or by writing to YieldMax™ Semiconductor Portfolio Option Income ETF, c/o U.S. Bank Global Fund Services, P.O. Box 701, Milwaukee, Wisconsin 53201‑0701.
Additional Information Phone Number (844) 737-3001
Additional Information Website www.yieldmaxetfs.com/our-etfs/chpy/
Expenses [Text Block]

What were the Fund costs for the past year?

(based on a hypothetical $10,000 investment)

Class Name
Costs of a $10,000 investment
Costs paid as a percentage of a $10,000 investment
YieldMax™ Semiconductor Portfolio Option Income ETF
$144
0.99%*
*Costs paid as a percentage of a $10,000 investment is an annualized figure.


Expenses Paid, Amount $ 144
Expense Ratio, Percent 0.99% [20]
Factors Affecting Performance [Text Block]

How Did the Fund Perform During the Reporting Period?

During the reporting period, CHPY generated a positive total return, driven by strong gains across its semiconductor holdings, while providing shareholders with substantial income distributions, which started being paid out weekly in mid-October 2025.

What Factors Influenced Performance?

Performance was primarily influenced by the returns of the Fund's underlying portfolio of semiconductor companies, which benefited from continued demand tied to artificial intelligence infrastructure buildout. The Fund also generated meaningful option premium income through its call spread strategy. Elevated implied volatility within the semiconductor sector supported a high level of premium income, though the Fund's use of call spreads capped a portion of its upside participation in the sector's advance.

Positioning of the Fund

The Fund continues to be invested in a portfolio of approximately 15 to 30 semiconductor companies selected based on liquidity, price level, and implied volatility, and continues to employ its call spread strategy in seeking to generate current income while capturing a portion of the sector's capital appreciation potential.
Performance Past Does Not Indicate Future [Text] The Fund's past performance is not a good indicator of how the Fund will perform in the future.
Line Graph [Table Text Block]

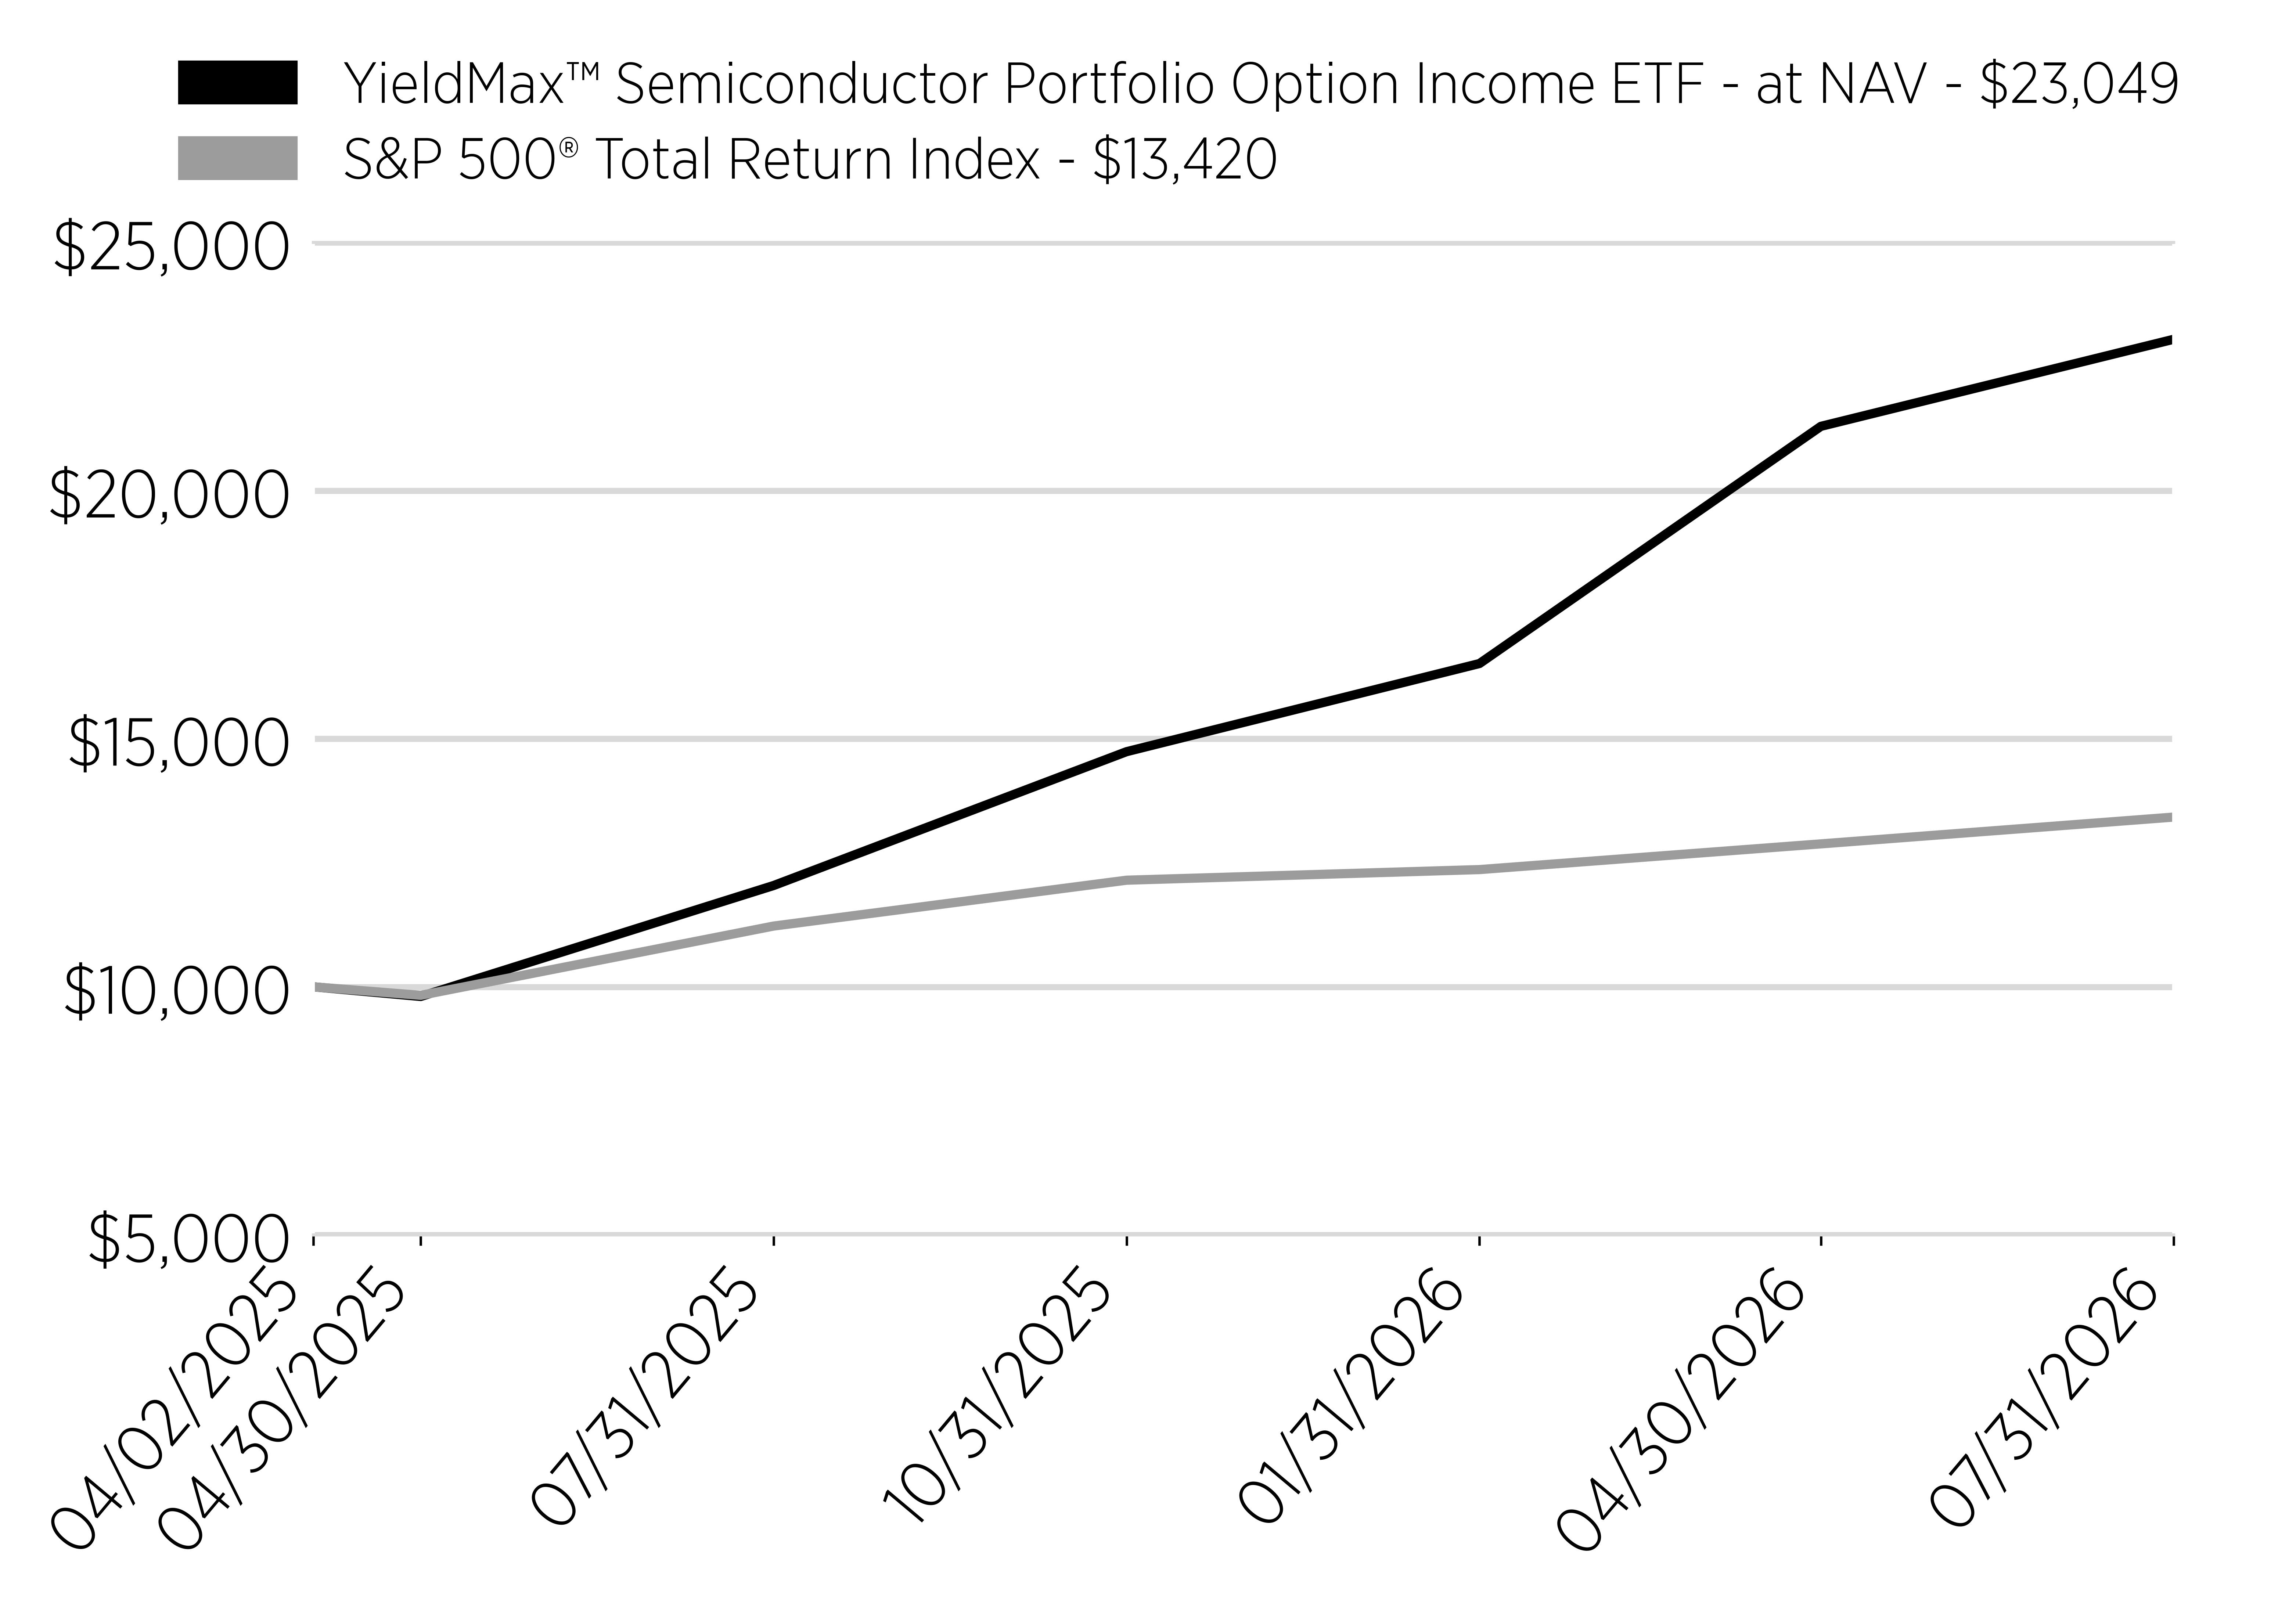
Cumulative Performance

(Initial Investment of $10,000)
Date
YieldMax™ Semiconductor Portfolio Option Income ETF - at NAV - $23,049
S&P 500® Total Return Index - $13,420
4/2/2025
10000
10000
4/30/2025
9805
9828
7/31/2025
12041
11224
10/31/2025
14738
12148
1/31/2026
16514
12362
4/30/2026
21294
12880
7/31/2026
23049
13420
line
Average Annual Return [Table Text Block]

Annual Performance

1 Year
Since Inception (4/2/25)
Yieldmax™ Semiconductor Portfolio Option Income ETF - at NAV
91.24%
87.47%
S&P 500® Total Return Index
19.56%
24.78%
Performance Inception Date Apr. 02, 2025
No Deduction of Taxes [Text Block] The graph and table do not reflect the deduction of taxes that a shareholder would pay on fund distributions or redemption of fund shares.
Material Change Date Oct. 14, 2025
Updated Performance Information Location [Text Block] Visit www.yieldmaxetfs.com/our-etfs/chpy/ for more recent performance information.
Net Assets $ 1,023,356,000
Holdings Count | Holdings 89
Advisory Fees Paid, Amount $ 4,131,039
Investment Company, Portfolio Turnover 38.00%
Additional Fund Statistics [Text Block]

Key Fund Statistics

(as of July 31, 2026)

Fund Size (Thousands)
$1,023,356
Number of Holdings
89
Total Advisory Fee Paid
$4,131,039
Portfolio Turnover
38%
Holdings [Text Block]

What did the Fund invest in?

(as of July 31, 2026)

Security Type - Investments

(% of Net Assets)
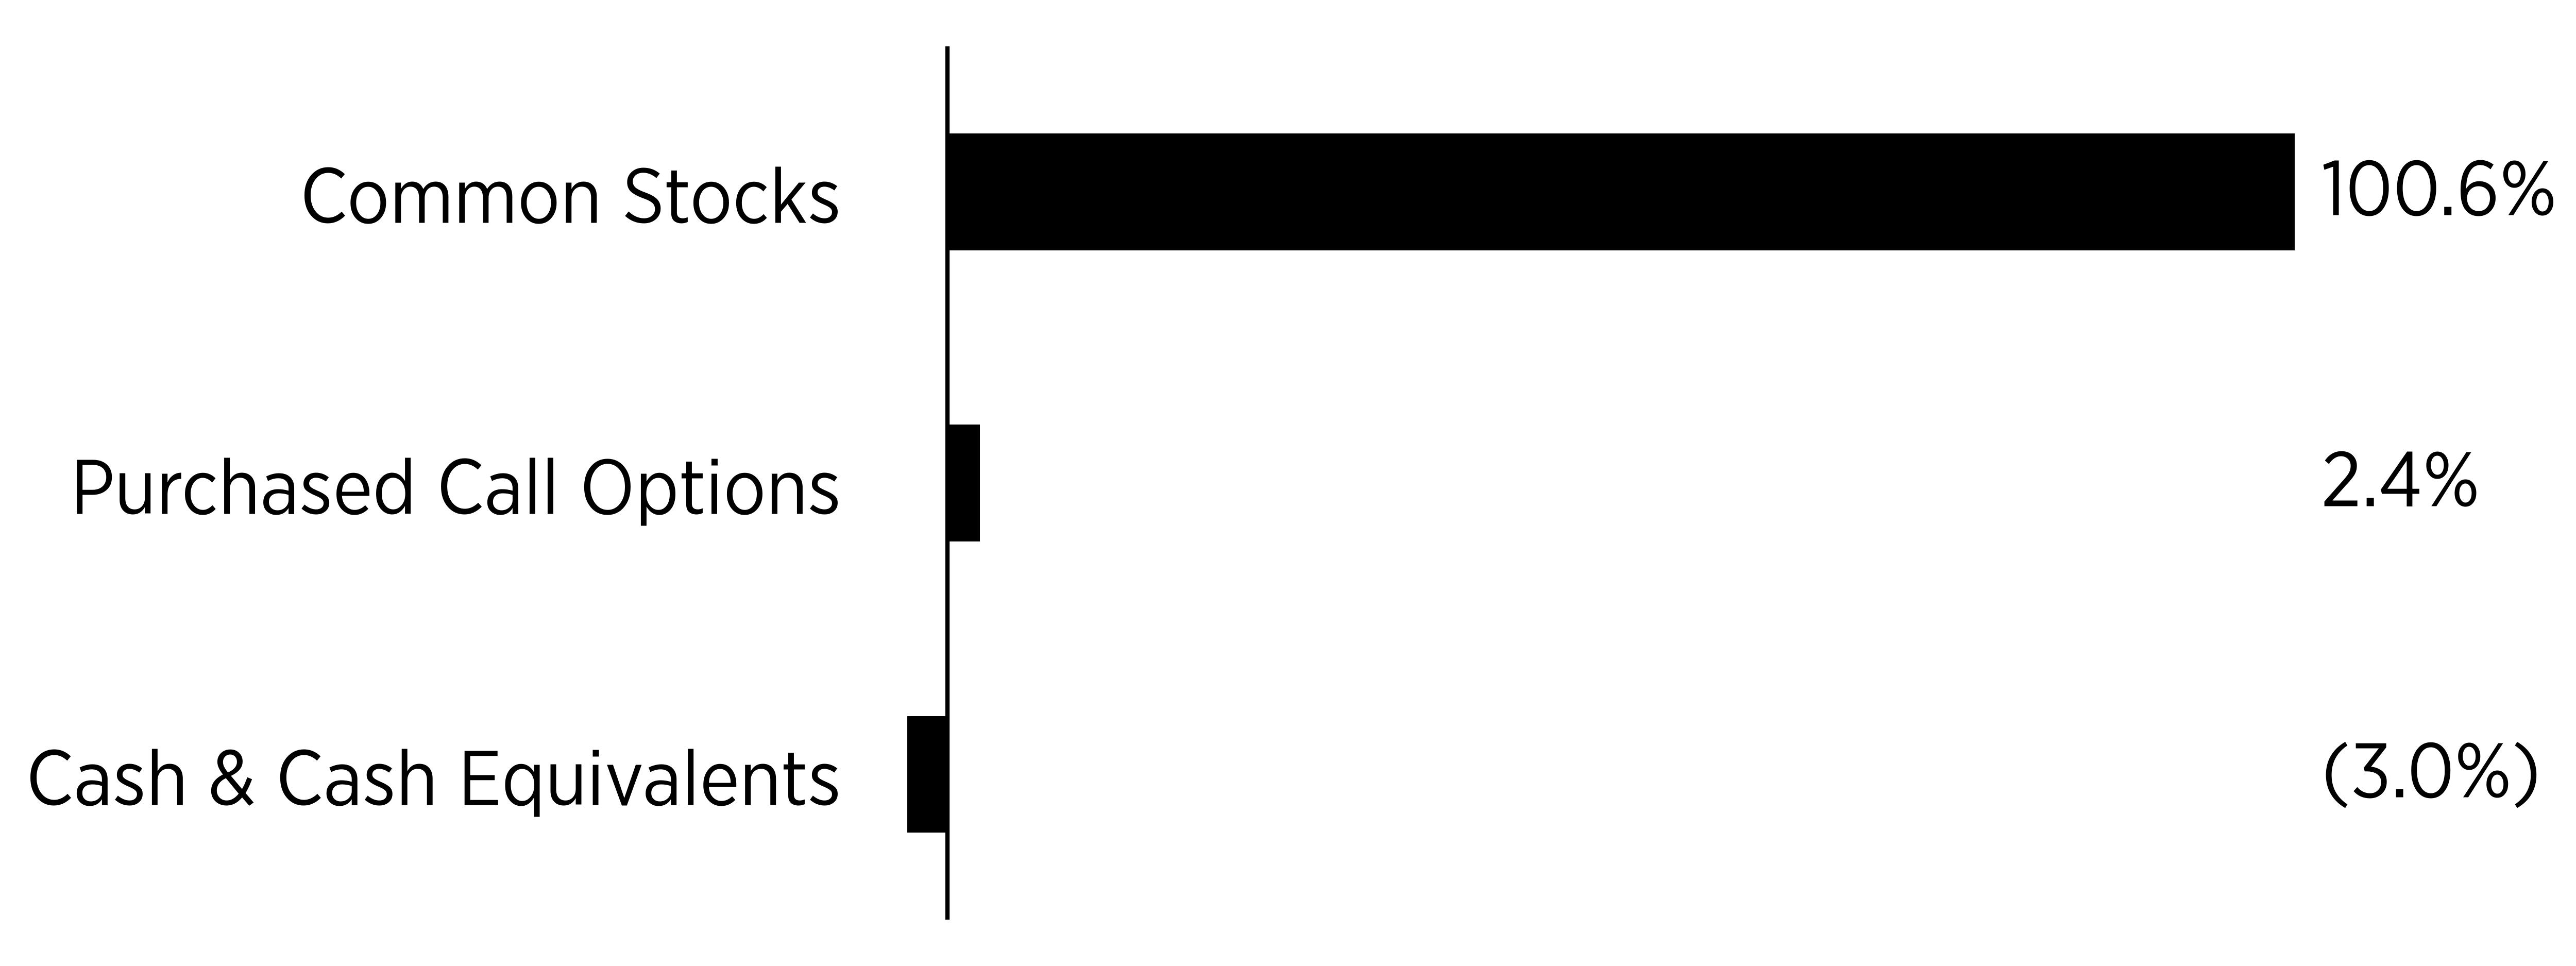
Sector
%
Common Stocks
100.6%
Purchased Call Options
2.4%
Cash & Cash Equivalents
-3.0%
bar


Security Type - Other Financial Instruments

(% of Net Assets)

Sector
%
Written Call Options
-3.5%
bar


Percentages are based on net assets. Cash & Cash Equivalents represents cash, short-term investments, and liabilities in excess of other assets.


Largest Holdings [Text Block]
Top Holdings
(% of Net
Assets)
NVIDIA Corp.
6.1
Broadcom, Inc.
5.9
Advanced Micro Devices, Inc.
5.3
Lam Research Corp.
5.2
Marvell Technology, Inc.
4.6
Intel Corp.
4.5
Astera Labs, Inc.
4.3
Micron Technology, Inc.
4.3
ASML Holding NV
4.1
United Microelectronics Corp., ADR
4.0
Material Fund Change [Text Block]

Fund Changes

Effective October 14, 2025 the Fund's payment of income distributions was changed to seek to make such distributions on a weekly basis.

YieldMax(R) SPCX Option Income Strategy ETF  
Shareholder Report [Line Items]  
Fund Name YieldMax™ SPCX Option Income Strategy ETF
Class Name YieldMax™ SPCX Option Income Strategy ETF
Trading Symbol YSPC
Security Exchange Name NYSEArca
Annual or Semi-Annual Statement [Text Block] This annual shareholder report contains important information about the YieldMax™ SPCX Option Income Strategy ETF (the "Fund") for the period August 1, 2025 to July 31, 2026.
Shareholder Report Annual or Semi-Annual annual shareholder report
Additional Information [Text Block] You can find additional information about the Fund at www.yieldmaxetfs.com/our-etfs/yspc/. You can also request this information by contacting us at (844) 737-3001 or by writing to YieldMax™ SPCX Option Income Strategy ETF, c/o U.S. Bank Global Fund Services, P.O. Box 701, Milwaukee, Wisconsin 53201‑0701.
Additional Information Phone Number (844) 737-3001
Additional Information Website www.yieldmaxetfs.com/our-etfs/yspc/
Expenses [Text Block]

What were the Fund costs for the past year?

(based on a hypothetical $10,000 investment)

Class Name
Costs of a $10,000 investment
Costs paid as a percentage of a $10,000 investment
YieldMax™ SPCX Option Income Strategy ETF
$4*
0.99%**
*The Fund commenced operations on July 14, 2026. Expenses for a full reporting period would be higher than the figures shown.
**Costs paid as a percentage of a $10,000 investment is an annualized figure.


Expenses Paid, Amount $ 4 [21]
Expense Ratio, Percent 0.99% [22]
Expenses Short Period Footnote [Text Block] The Fund commenced operations on July 14, 2026. Expenses for a full reporting period would be higher than the figures shown.
Factors Affecting Performance [Text Block]

How Did the Fund Perform During the Reporting Period?

The Fund had a negative total return as declines in Space Exploration Technologies Corp. (“SPCX”) outweighed income generated by its call spread strategy. The Fund also made an income distribution.

What Factors Influenced Performance?

Performance was primarily influenced by SPCX’s share price and implied volatility. Declines in SPCX detracted from results, while option premiums partially offset those losses.

Positioning of the Fund

The Fund continued to sell call spreads to generate current income while maintaining exposure to a portion of SPCX’s performance.
Performance Past Does Not Indicate Future [Text] The Fund's past performance is not a good indicator of how the Fund will perform in the future.
Line Graph [Table Text Block]

Cumulative Performance

(Initial Investment of $10,000)
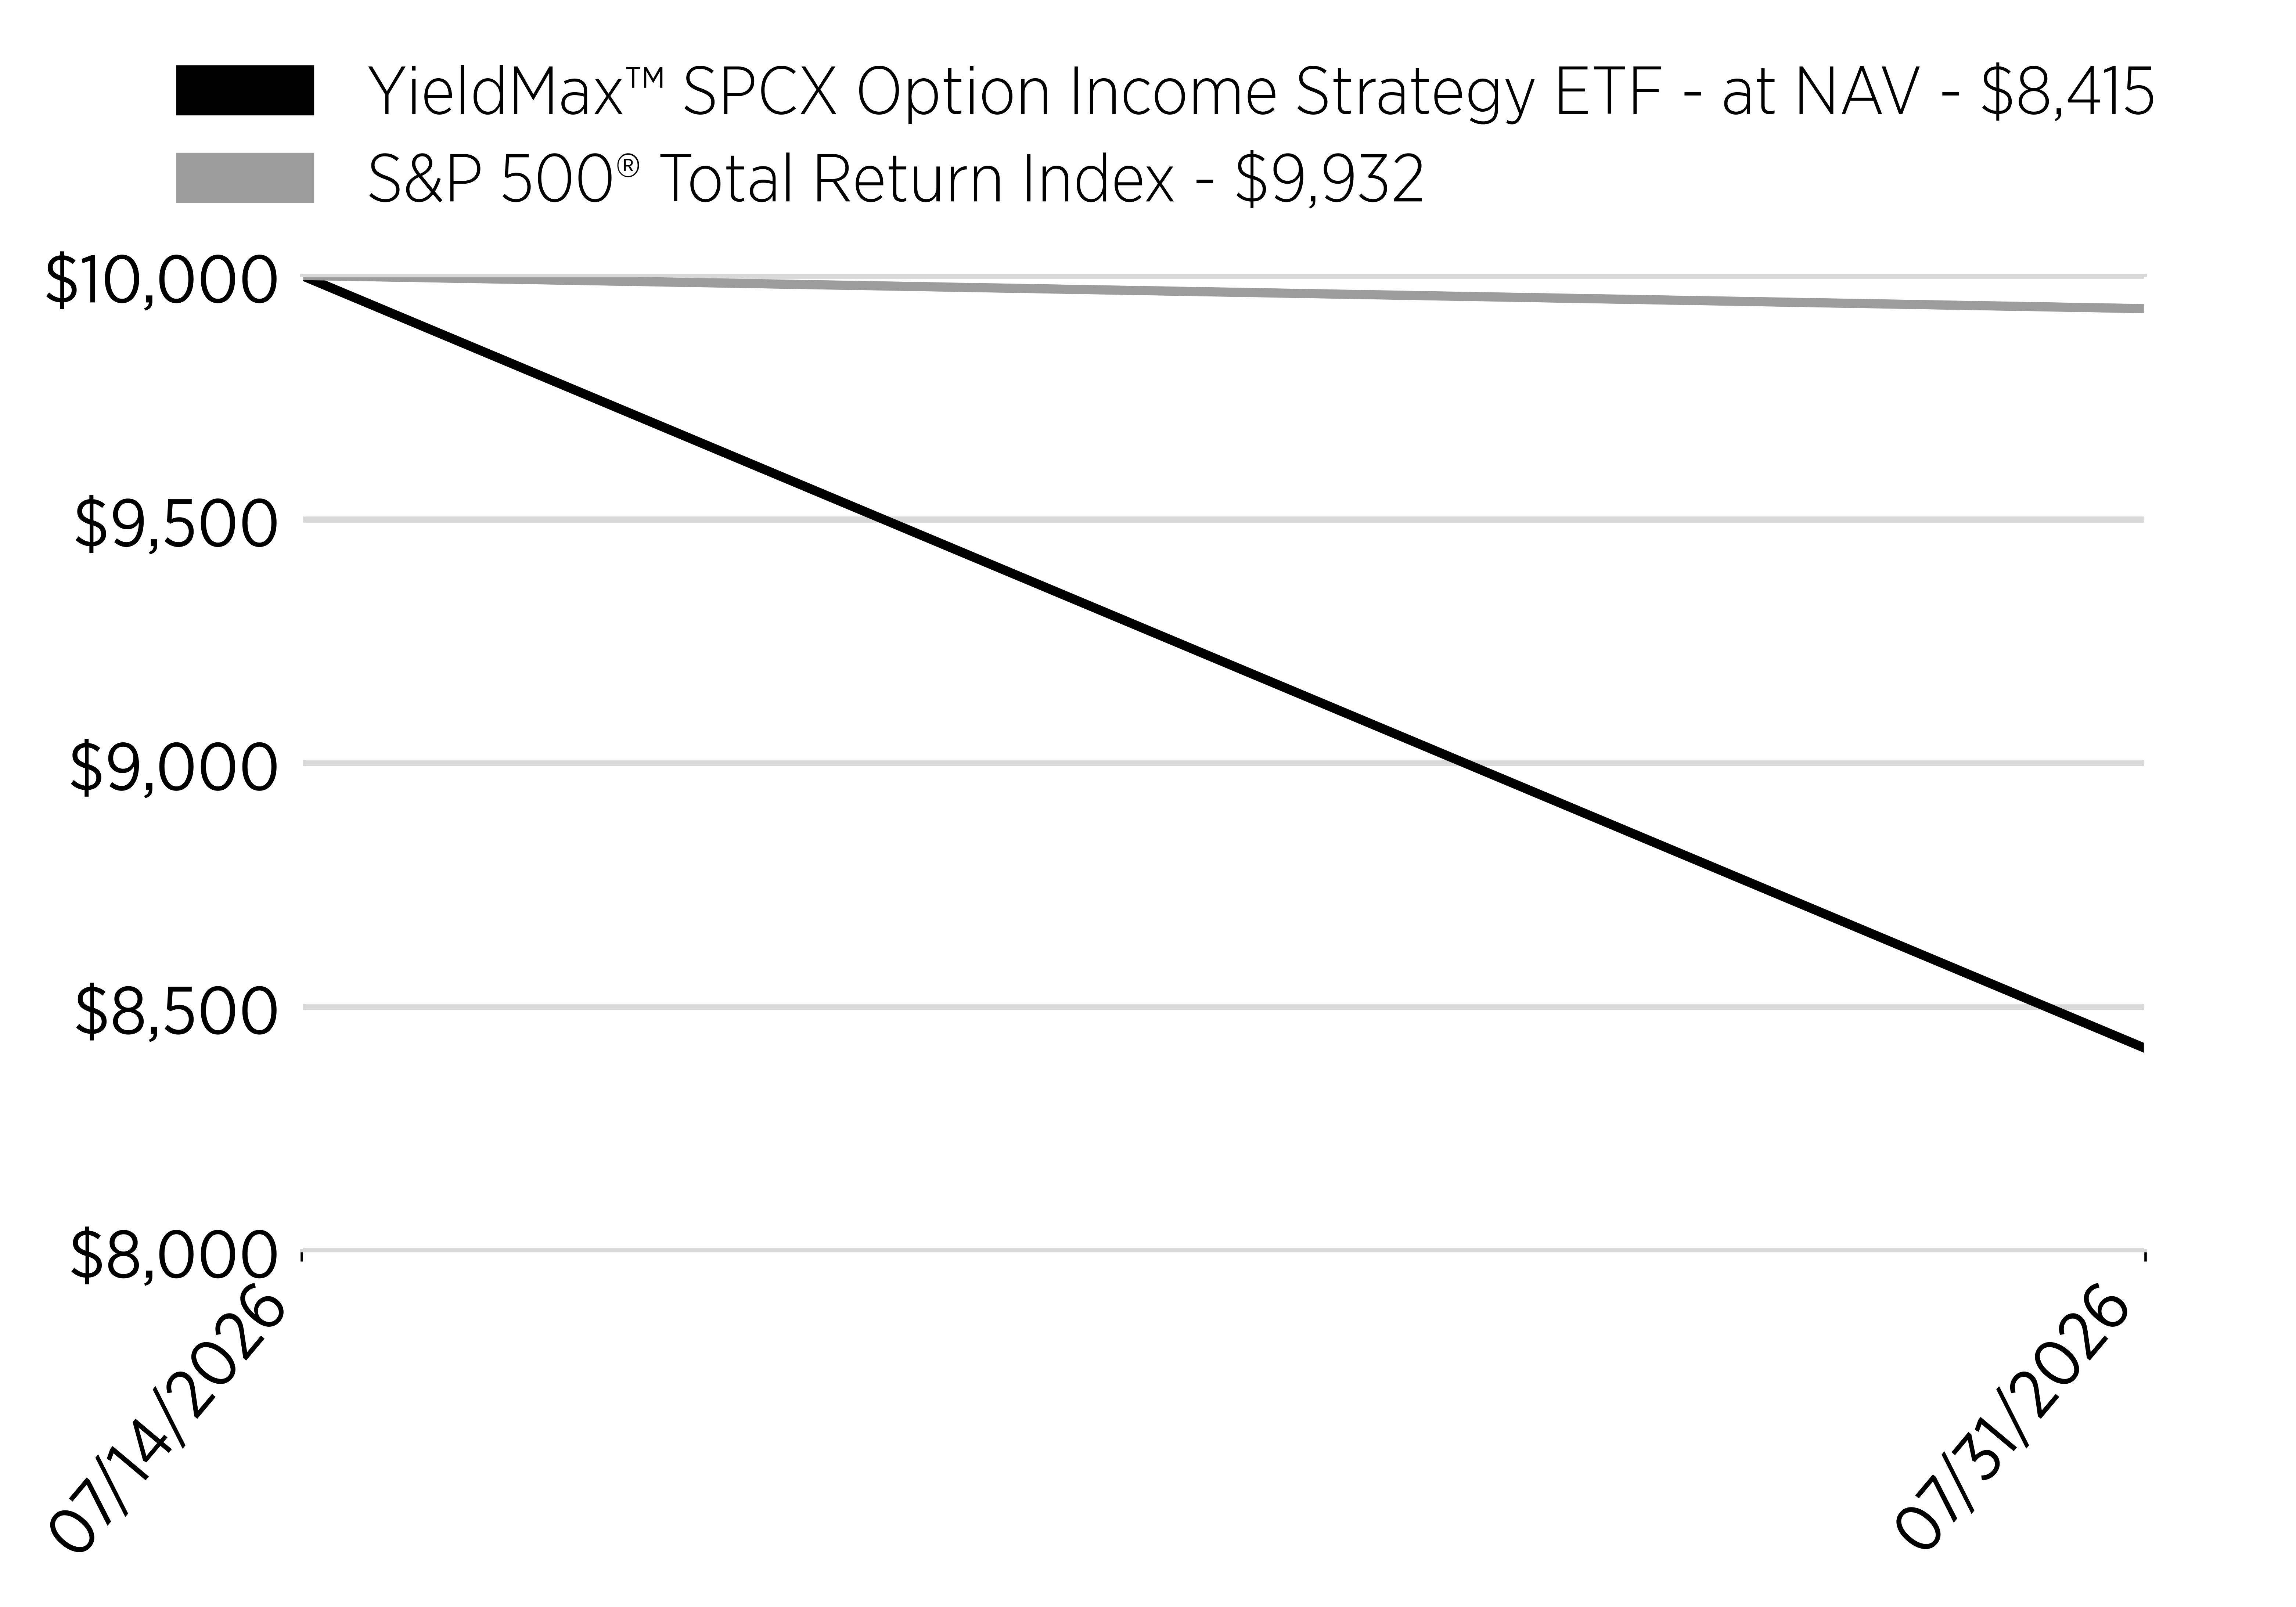
Date
YieldMax™ SPCX Option Income Strategy ETF - at NAV - $8,415
S&P 500® Total Return Index - $9,932
7/14/2026
10000
10000
7/31/2026
8415
9932
line
Average Annual Return [Table Text Block]

Annual Performance

Since Inception (7/14/26)
Yieldmax™ SPCX Option Income Strategy ETF - at NAV
-16.75%*
S&P 500® Total Return Index
-0.68%
*Not Annualized for periods less than one year.
Performance Inception Date Jul. 14, 2026
No Deduction of Taxes [Text Block] The graph and table do not reflect the deduction of taxes that a shareholder would pay on fund distributions or redemption of fund shares.
Updated Performance Information Location [Text Block] Visit www.yieldmaxetfs.com/our-etfs/yspc/ for more recent performance information.
Net Assets $ 2,060,000
Holdings Count | Holdings 8
Advisory Fees Paid, Amount $ 491
Investment Company, Portfolio Turnover 0.00%
Additional Fund Statistics [Text Block]

Key Fund Statistics

(as of July 31, 2026)

Fund Size (Thousands)
$2,060
Number of Holdings
8
Total Advisory Fee Paid
$491
Portfolio Turnover
0%
Holdings [Text Block]

What did the Fund invest in?

(as of July 31, 2026)

Security Type - Investments

(% of Net Assets)
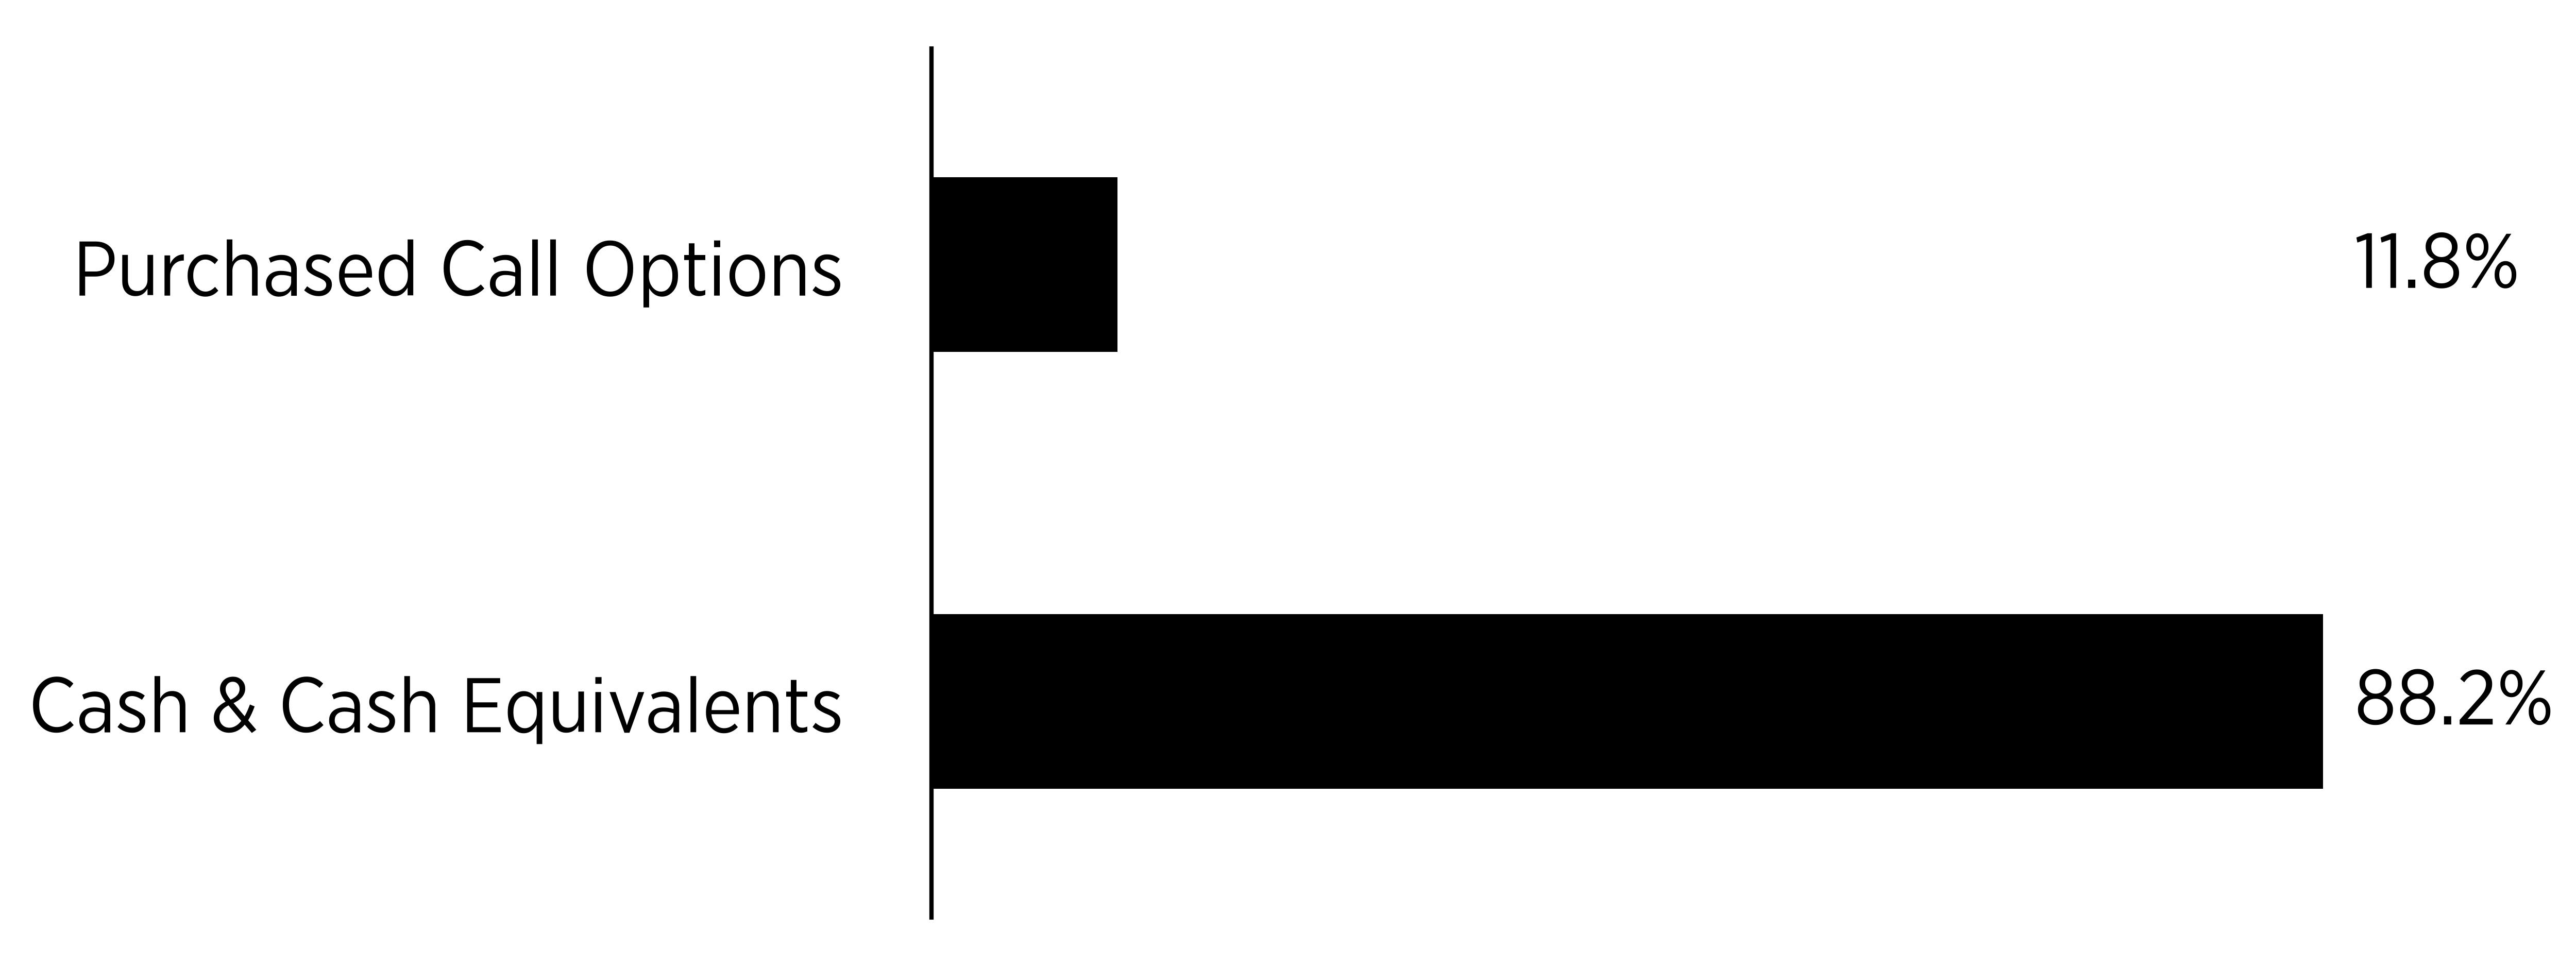
Sector
%
Purchased Call Options
11.8%
Cash & Cash Equivalents
88.2%
bar


Security Type - Other Financial Instruments

(% of Net Assets)
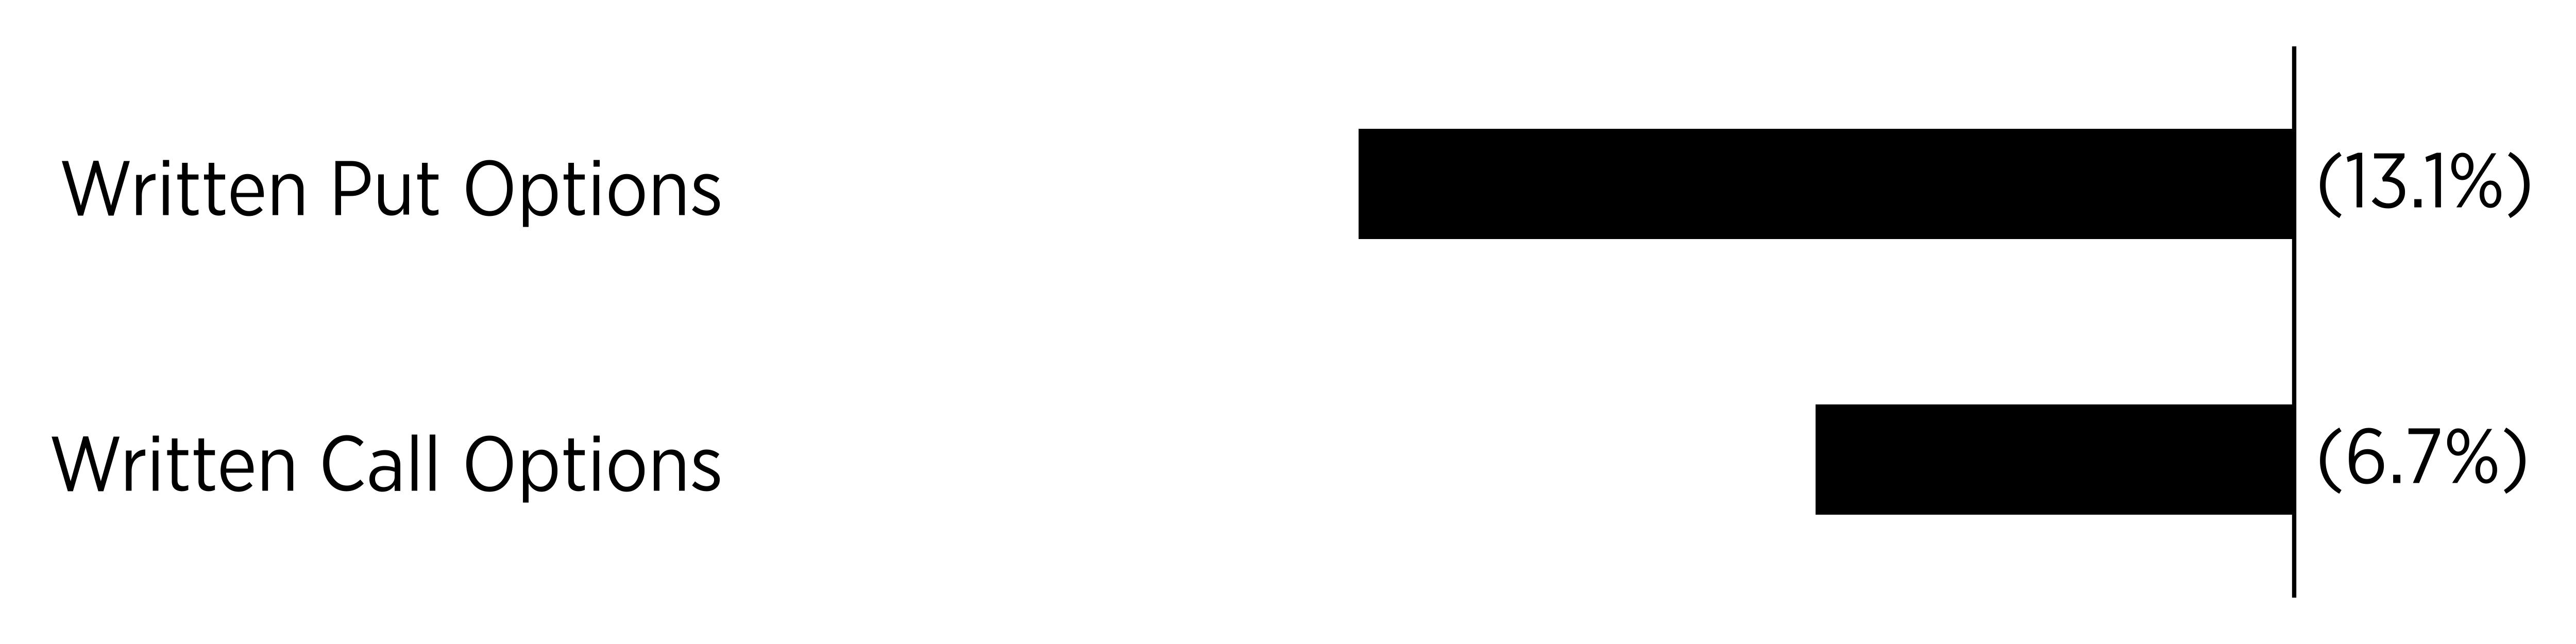
Sector
%
Written Put Options
-13.1%
Written Call Options
-6.7%
bar


Percentages are based on net assets. Cash & Cash Equivalents represents cash, short-term investments, and liabilities in excess of other assets.


Largest Holdings [Text Block]
Top Holdings
(% of Net Assets)
U.S. Treasury Bills
98.0
Space Exploration Technologies Corp.,
Expiration: 8/14/2026; Exercise Price: $114.01
-13.0
Space Exploration Technologies Corp.,
Expiration: 8/14/2026; Exercise Price: $114.01
7.9
First American Government Obligations Fund - Class X, 3.58%
3.9
Space Exploration Technologies Corp.,
Expiration: 8/7/2026; Exercise Price: $110.00
-3.7
Space Exploration Technologies Corp.,
Expiration: 8/7/2026; Exercise Price: $115.00
-3.0
Space Exploration Technologies Corp.,
Expiration: 8/7/2026; Exercise Price: $120.00
2.3
Space Exploration Technologies Corp.,
Expiration: 8/7/2026; Exercise Price: $126.00
1.7
Material Fund Change [Text Block]

Fund Changes

There were no material changes during the reporting period.
YieldMax(R) Strategic Metals & Mining Portfolio Option Income ETF  
Shareholder Report [Line Items]  
Fund Name YieldMax™ Strategic Metals & Mining Portfolio Option Income ETF
Class Name YieldMax™ Strategic Metals & Mining Portfolio Option Income ETF
Trading Symbol MINY
Security Exchange Name NYSEArca
Annual or Semi-Annual Statement [Text Block] This annual shareholder report contains important information about the YieldMax™ Strategic Metals & Mining Portfolio Option Income ETF (the "Fund") for the period August 1, 2025 to July 31, 2026.
Shareholder Report Annual or Semi-Annual annual shareholder report
Additional Information [Text Block] You can find additional information about the Fund at www.yieldmaxetfs.com/our-etfs/miny/. You can also request this information by contacting us at (844) 737-3001 or by writing to YieldMax™ Strategic Metals & Mining Portfolio Option Income ETF, c/o U.S. Bank Global Fund Services, P.O. Box 701, Milwaukee, Wisconsin 53201‑0701.
Additional Information Phone Number (844) 737-3001
Additional Information Website www.yieldmaxetfs.com/our-etfs/miny/
Expenses [Text Block]

What were the Fund costs for the past year?

(based on a hypothetical $10,000 investment)

Class Name
Costs of a $10,000 investment
Costs paid as a percentage of a $10,000 investment
YieldMax™ Strategic Metals & Mining Portfolio Option Income ETF
$38*
0.99%**
*The Fund commenced operations on February 26, 2026. Expenses for a full reporting period would be higher than the figures shown.
**Costs paid as a percentage of a $10,000 investment is an annualized figure.


Expenses Paid, Amount $ 38 [23]
Expense Ratio, Percent 0.99% [24]
Expenses Short Period Footnote [Text Block] The Fund commenced operations on February 26, 2026. Expenses for a full reporting period would be higher than the figures shown.
Factors Affecting Performance [Text Block]

How Did the Fund Perform During the Reporting Period?

Since its inception in February 2026, which is less than the full reporting period, MINY generated a negative total return, as weakness across strategic metals and mining companies drove performance. The Fund provides shareholders with regular income distributions which offset the underlying equity losses over this time frame.

What Factors Influenced Performance?

Performance was primarily influenced by the returns of the Fund's underlying portfolio of metals and mining companies, which experienced a sustained selloff in precious and strategic metals prices. The Fund generated option premium income through its options strategy, with elevated implied volatility across many holdings supporting meaningful premium income.

Positioning of the Fund

The Fund maintains a portfolio of U.S.-listed strategic metals and mining companies and employs an options strategy across its holdings. MINY seeks to provide current income and, secondarily, capital appreciation through direct investments in a focused portfolio of metals and mining companies.
Performance Past Does Not Indicate Future [Text] The Fund's past performance is not a good indicator of how the Fund will perform in the future.
Line Graph [Table Text Block]

Cumulative Performance

(Initial Investment of $10,000)
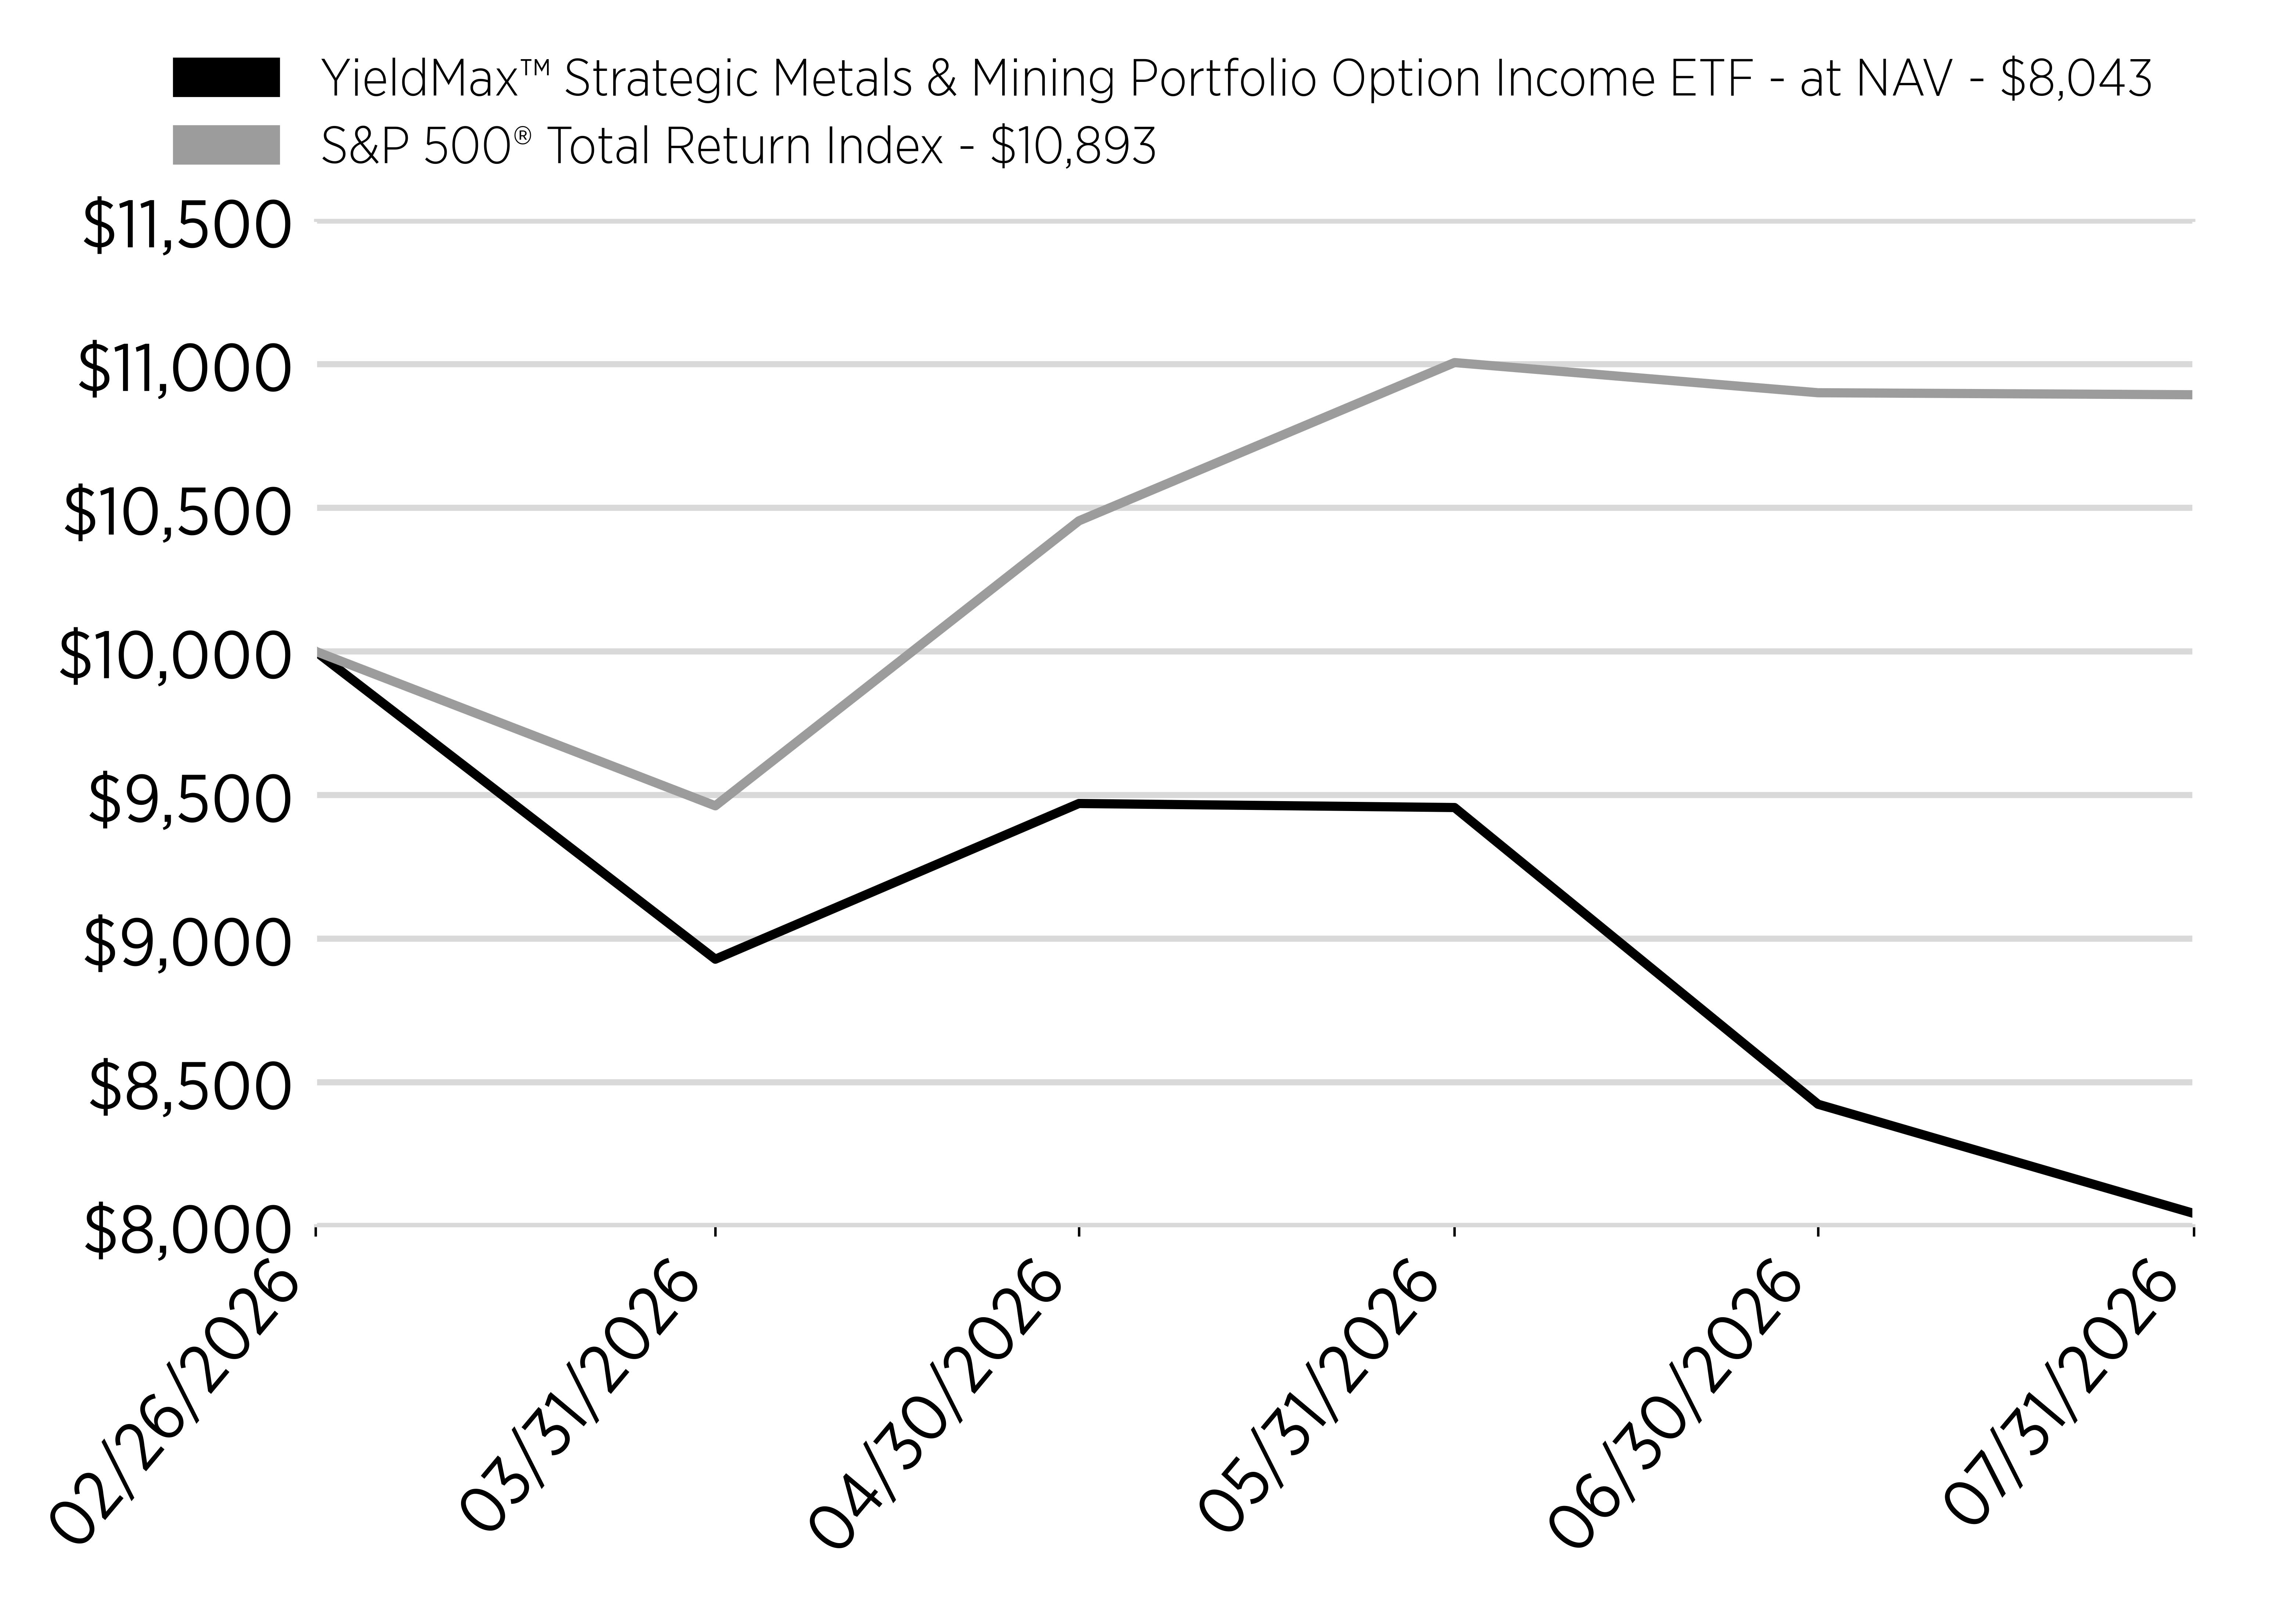
Date
YieldMax™ Strategic Metals & Mining Portfolio Option Income ETF - at NAV - $8,043
S&P 500® Total Return Index - $10,893
2/26/2026
10000
10000
3/31/2026
8928
9462
4/30/2026
9470
10454
5/31/2026
9456
11005
6/30/2026
8423
10900
7/31/2026
8043
10893
line
Average Annual Return [Table Text Block]

Annual Performance

Since Inception (2/26/26)
Yieldmax™ Strategic Metals & Mining Portfolio Option Income ETF - at NAV
-19.76%*
S&P 500® Total Return Index
8.93%
*Not Annualized for periods less than one year.
Performance Inception Date Feb. 26, 2026
No Deduction of Taxes [Text Block] The graph and table do not reflect the deduction of taxes that a shareholder would pay on fund distributions or redemption of fund shares.
Material Change Date Jul. 23, 2026
Updated Performance Information Location [Text Block] Visit www.yieldmaxetfs.com/our-etfs/miny/ for more recent performance information.
Net Assets $ 4,420,000
Holdings Count | Holdings 79
Advisory Fees Paid, Amount $ 19,275
Investment Company, Portfolio Turnover 38.00%
Additional Fund Statistics [Text Block]

Key Fund Statistics

(as of July 31, 2026)

Fund Size (Thousands)
$4,420
Number of Holdings
79
Total Advisory Fee Paid
$19,275
Portfolio Turnover
38%
Holdings [Text Block]

What did the Fund invest in?

(as of July 31, 2026)

Security Type - Investments

(% of Net Assets)
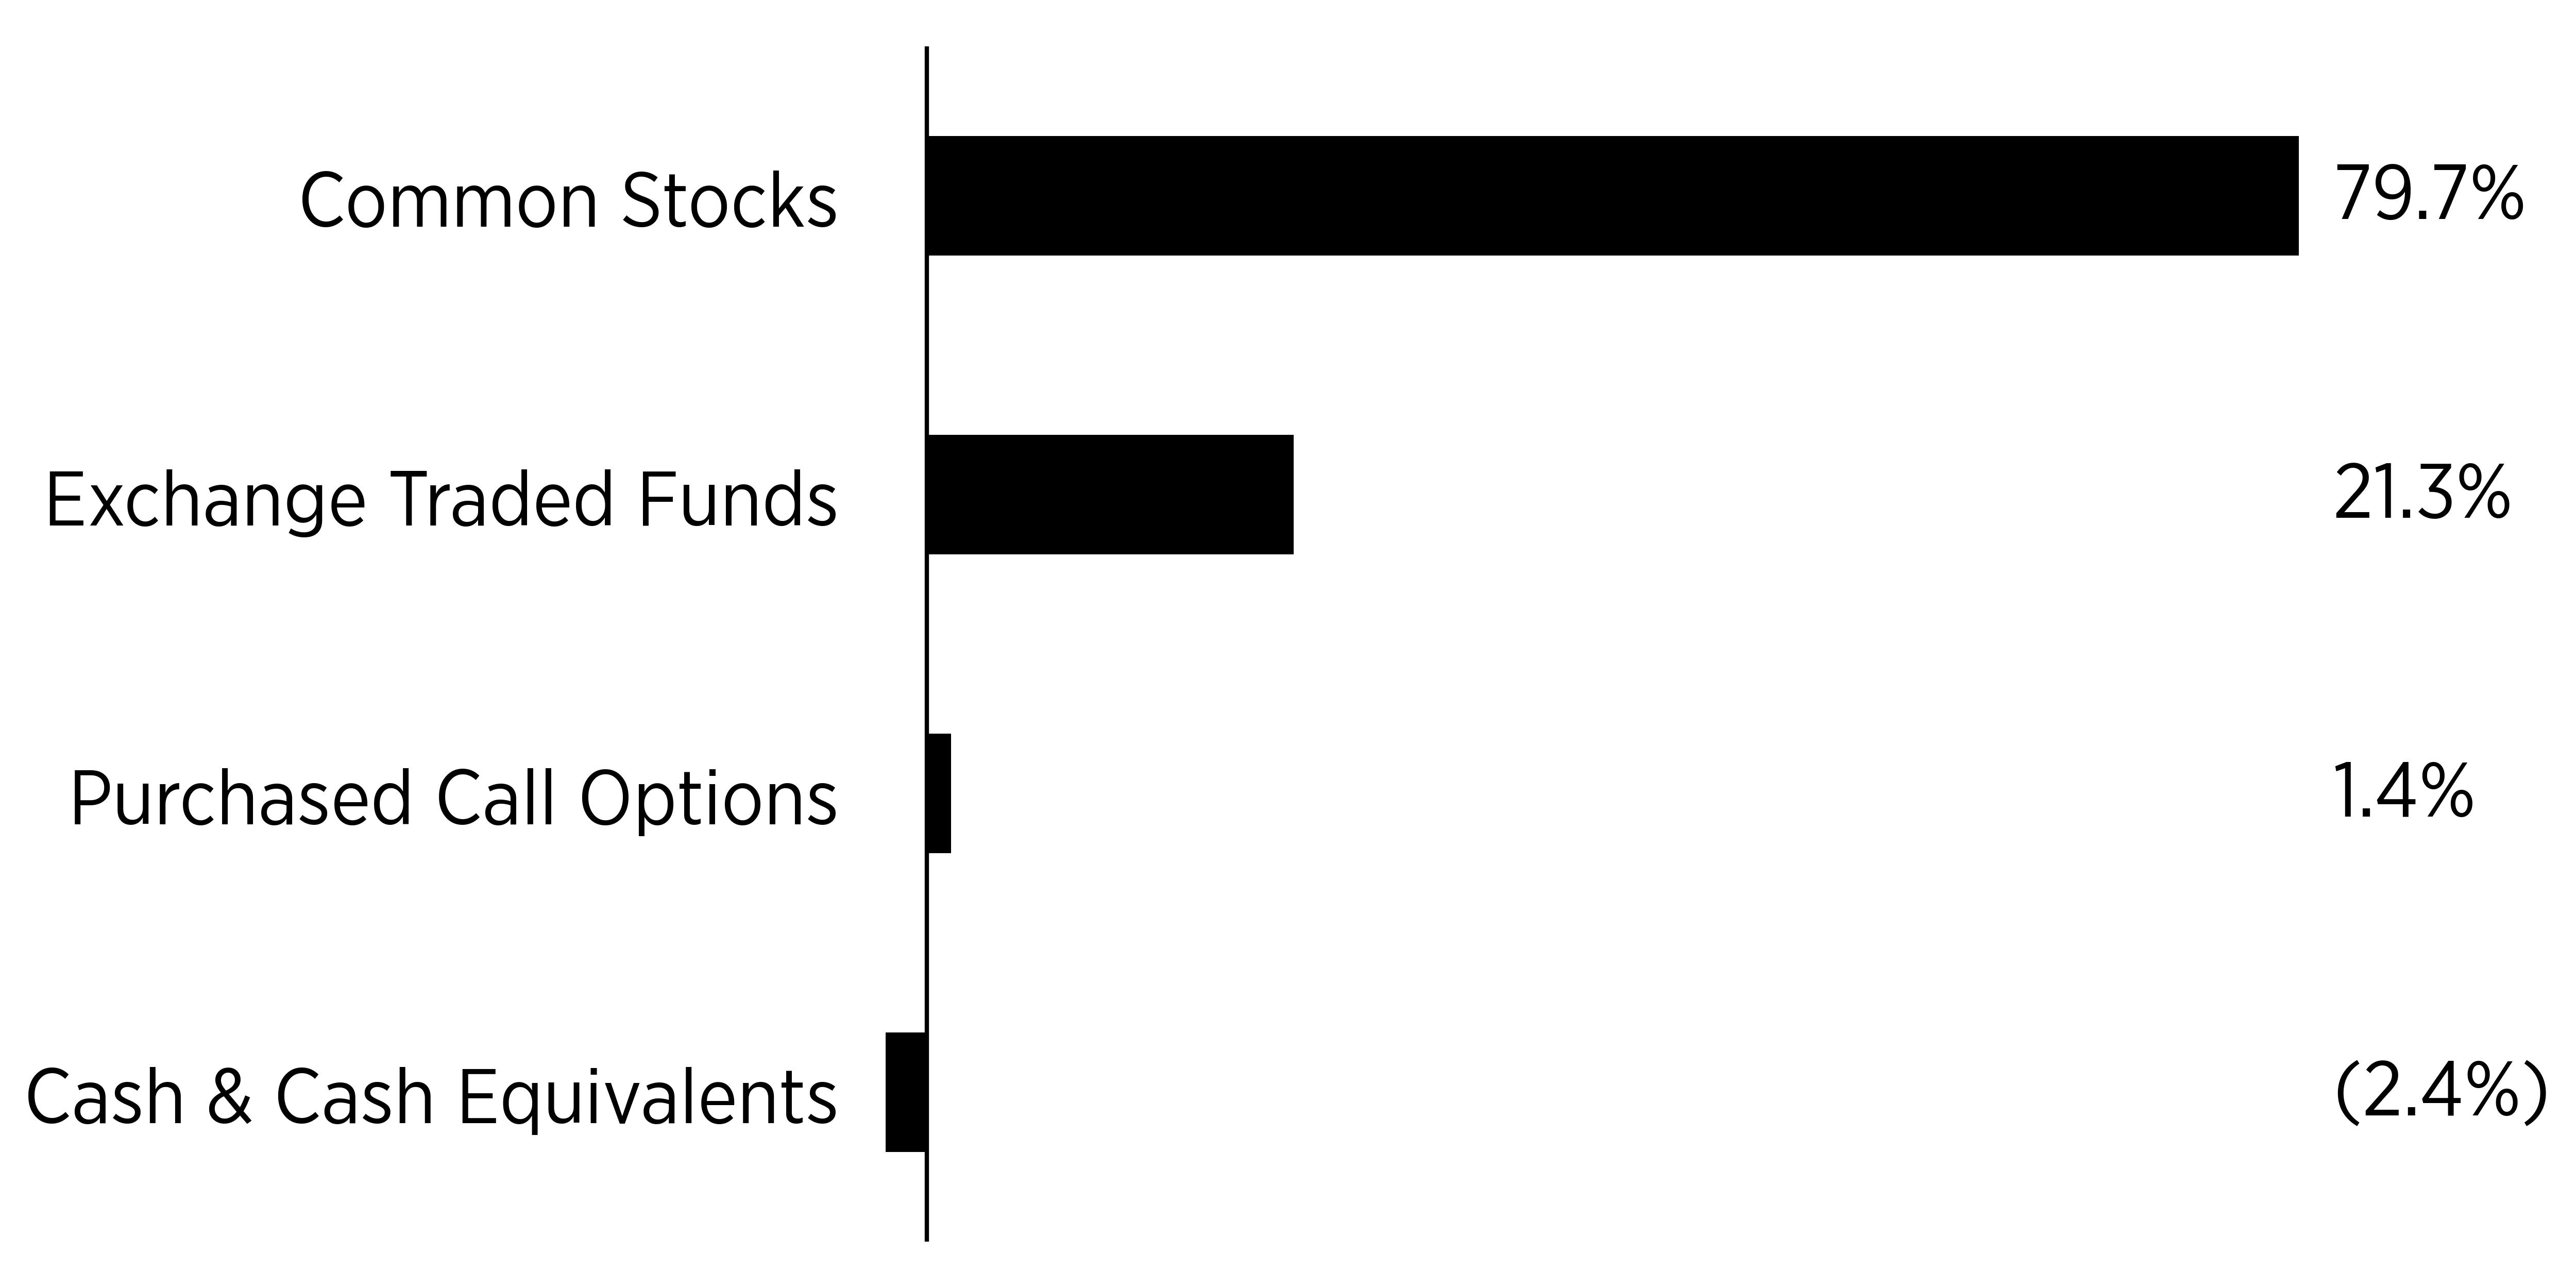
Sector
%
Common Stocks
79.7%
Exchange Traded Funds
21.3%
Purchased Call Options
1.4%
Cash & Cash Equivalents
-2.4%
bar


Security Type - Other Financial Instruments

(% of Net Assets)

Sector
%
Written Call Options
-3.4%
bar


Percentages are based on net assets. Cash & Cash Equivalents represents cash, short-term investments, and liabilities in excess of other assets.


Largest Holdings [Text Block]
Top Holdings
(% of Net
Assets)
Nucor Corp.
7.6
Steel Dynamics, Inc.
6.8
Freeport-McMoRan, Inc.
4.8
Caterpillar, Inc.
4.5
Southern Copper Corp.
4.5
Constellation Energy Corp.
4.3
BHP Group Ltd., ADR
4.1
VanEck Gold Miners ETF
4.0
Global X Lithium & Battery Tech ETF
3.9
Newmont Corp.
3.8
Material Fund Change [Text Block]

Fund Changes

Effective July 23, 2026 the Fund’s investment strategy is revised to provide that the Fund may invest in U.S.-listed equity securities of Strategic Metals & Mining Companies and/or shares of one or more Strategic Metals & Mining ETFs (collectively, the “Underlying Securities”). The Fund will also seek to generate income using options contracts on the Underlying Securities. Strategic Metals & Mining Companies may include foreign companies, including companies located in emerging markets, and their U.S.-listed depositary receipts, including American Depositary Receipts (“ADRs”) and Global Depositary Receipts (“GDRs”).

YieldMax(R) Target 12(TM) Big 50 Option Income ETF  
Shareholder Report [Line Items]  
Fund Name YieldMax™ Target 12 Big 50 Option Income ETF
Class Name YieldMax™ Target 12 Big 50 Option Income ETF
Trading Symbol BIGY
Security Exchange Name NYSEArca
Annual or Semi-Annual Statement [Text Block] This annual shareholder report contains important information about the YieldMax™ Target 12 Big 50 Option Income ETF (the "Fund") for the period August 1, 2025 to July 31, 2026.
Shareholder Report Annual or Semi-Annual annual shareholder report
Additional Information [Text Block] You can find additional information about the Fund at www.yieldmaxetfs.com/our-etfs/bigy/. You can also request this information by contacting us at (844) 737-3001 or by writing to YieldMax™ Target 12 Big 50 Option Income ETF, c/o U.S. Bank Global Fund Services, P.O. Box 701, Milwaukee, Wisconsin 53201‑0701.
Additional Information Phone Number (844) 737-3001
Additional Information Website www.yieldmaxetfs.com/our-etfs/bigy/
Expenses [Text Block]

What were the Fund costs for the past year?

(based on a hypothetical $10,000 investment)

Class Name
Costs of a $10,000 investment
Costs paid as a percentage of a $10,000 investment
YieldMax™ Target 12 Big 50 Option Income ETF
$106
1.01%*
*Costs paid as a percentage of a $10,000 investment is an annualized figure.


Expenses Paid, Amount $ 106
Expense Ratio, Percent 1.01% [25]
Factors Affecting Performance [Text Block]

How Did the Fund Perform During the Reporting Period?

During the reporting period, BIGY generated a positive total return, led by gains among its largest holdings, including NVIDIA, Apple, Alphabet, and Amazon. Beginning in mid-September 2025, the fund made regular monthly distributions to shareholders toward its 12% annual income target.

What Factors Influenced Performance?

Performance was primarily influenced by the returns of the Fund's underlying portfolio of the 50 largest U.S. companies, which benefited from continued strength across mega-cap technology and other large-cap names. The Fund's covered call strategy generated premium income used to help meet its annual 12% target, with the diversified nature of the underlying portfolio helping to reduce the impact of weakness in any single holding.

Positioning of the Fund

The Fund continues to hold a diversified portfolio of the 50 largest U.S. companies (the "Big 50 Companies") and employs a covered call strategy across its holdings. BIGY seeks to generate cash distributions based on a targeted annual cash distribution level of 12% while also seeking capital appreciation.
Performance Past Does Not Indicate Future [Text] The Fund's past performance is not a good indicator of how the Fund will perform in the future.
Line Graph [Table Text Block]

Cumulative Performance

(Initial Investment of $10,000)
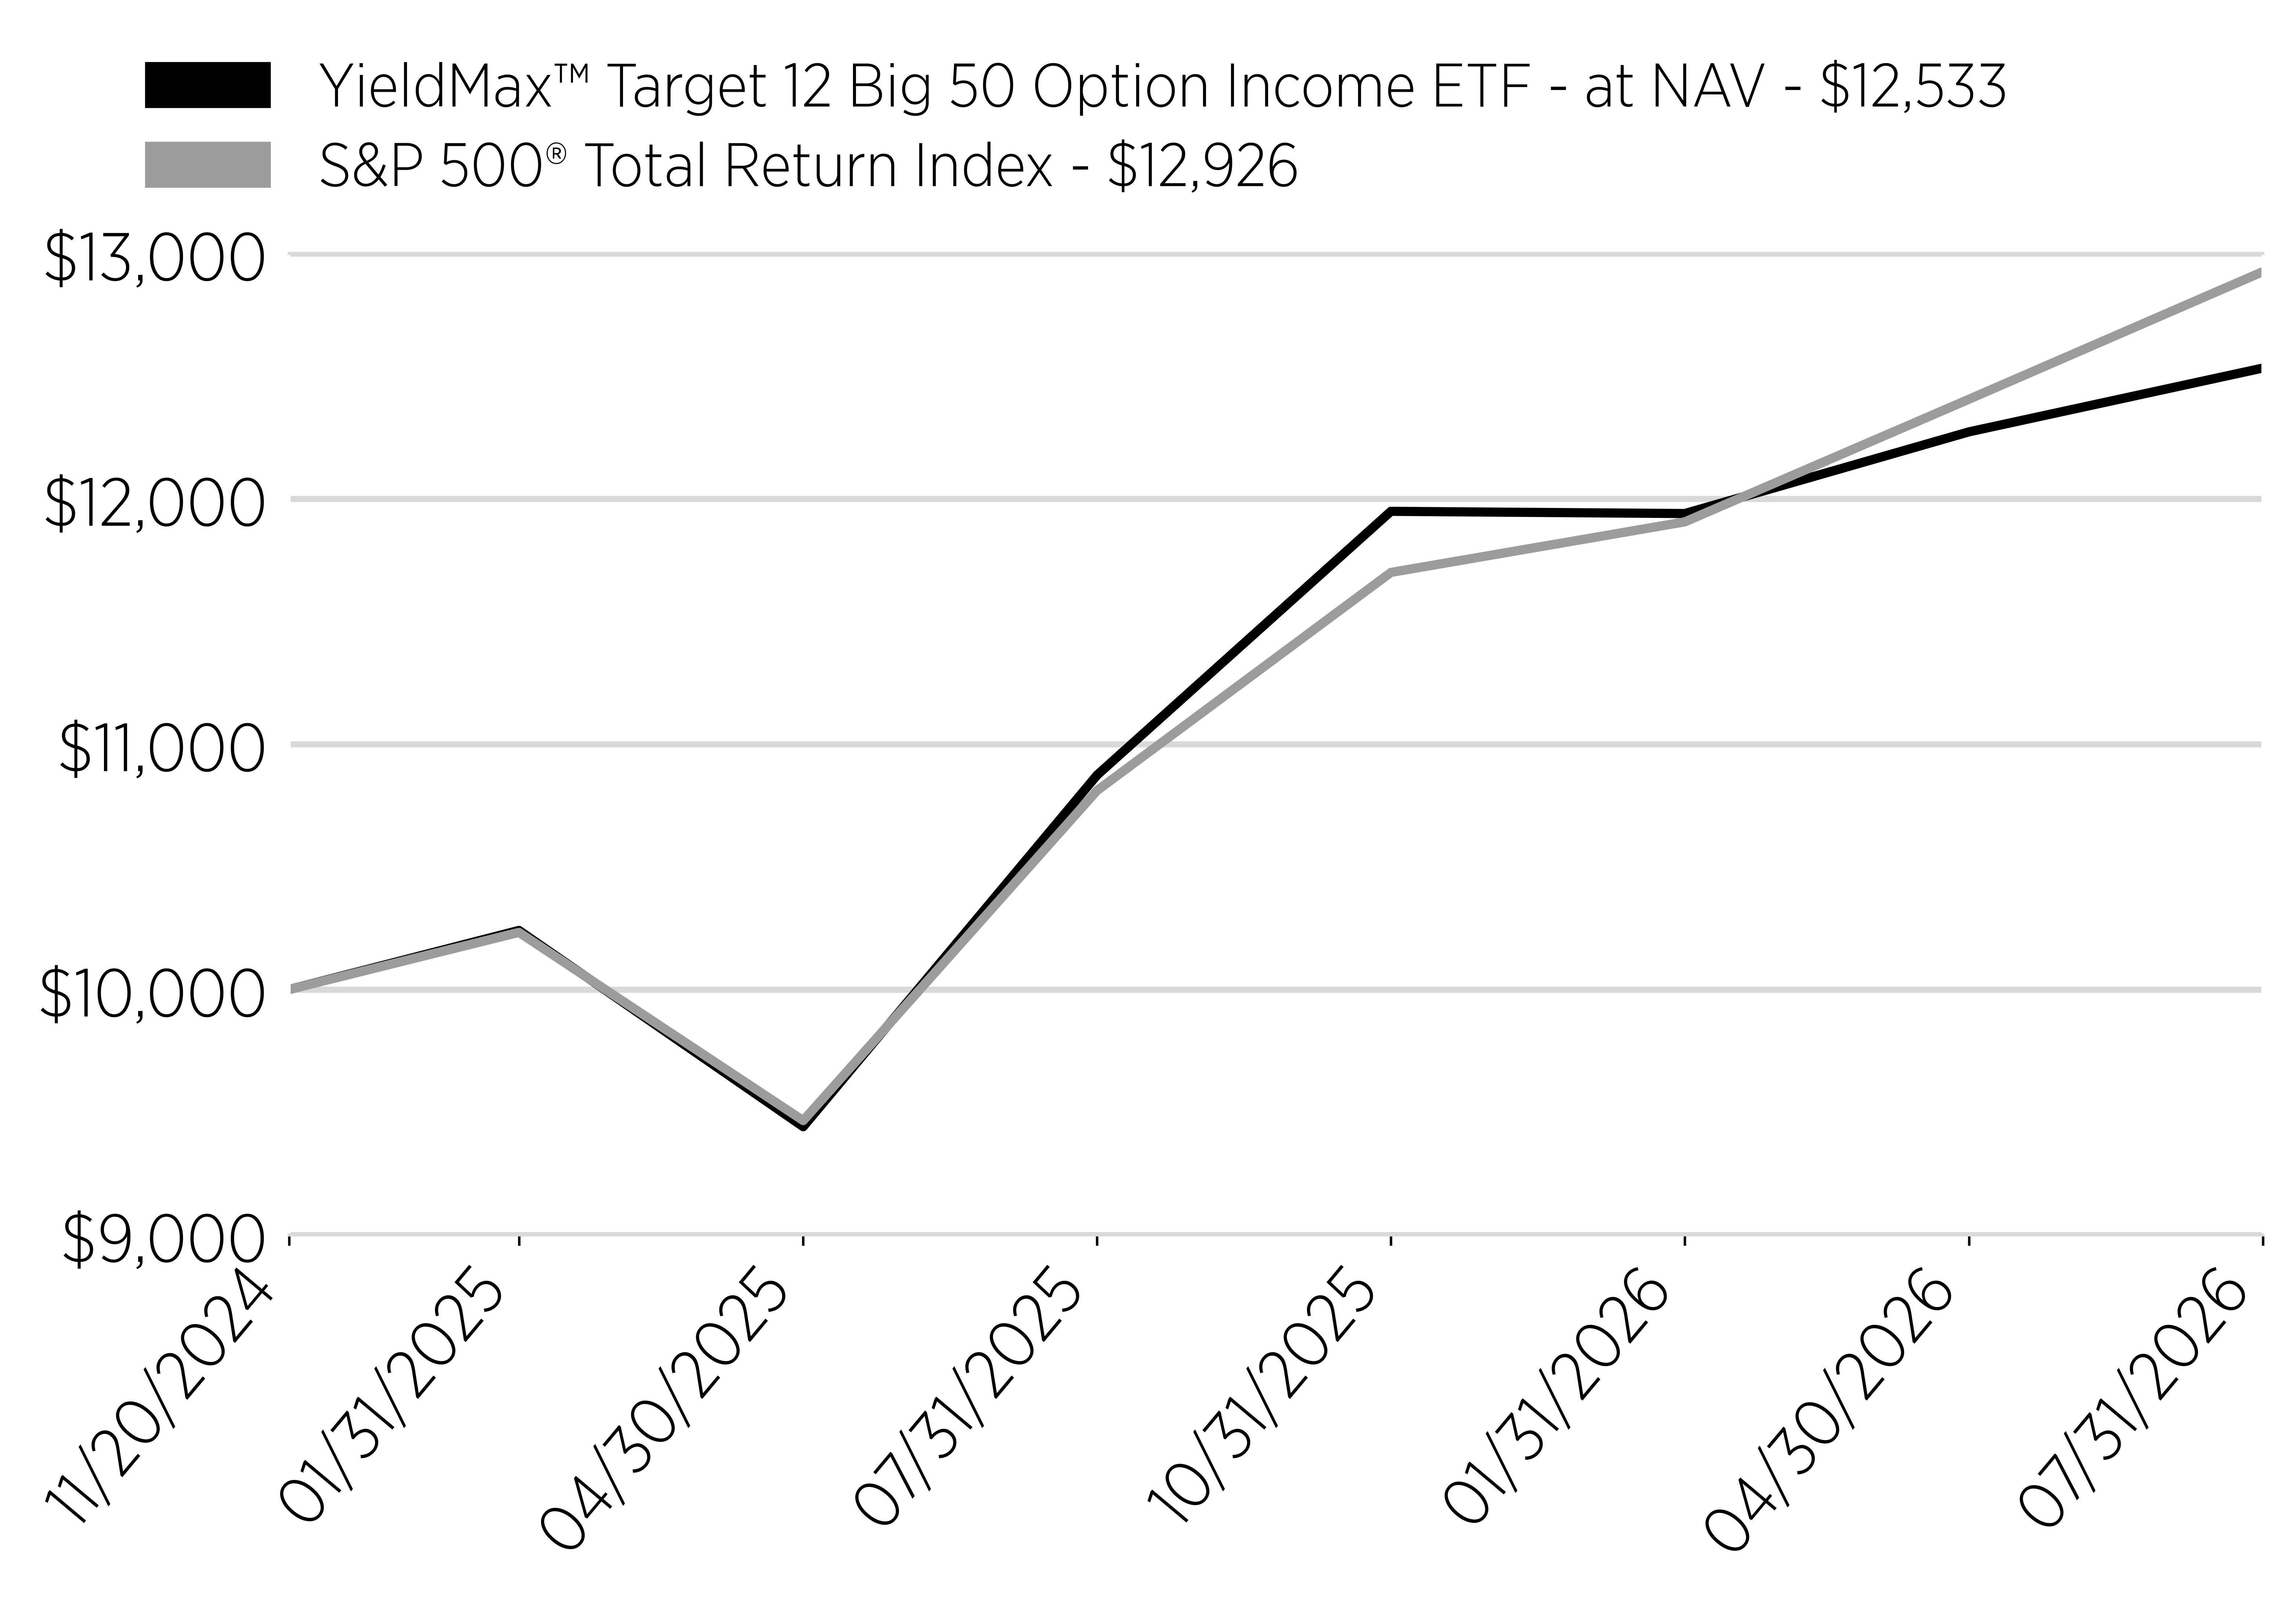
Date
YieldMax™ Target 12 Big 50 Option Income ETF - at NAV - $12,533
S&P 500® Total Return Index - $12,926
11/20/2024
10000
10000
1/31/2025
10241
10233
4/30/2025
9441
9466
7/31/2025
10874
10811
10/31/2025
11949
11700
1/31/2026
11940
11906
4/30/2026
12273
12406
7/31/2026
12533
12926
line
Average Annual Return [Table Text Block]

Annual Performance

1 Year
Since Inception (11/20/24)
Yieldmax™ Target 12 Big 50 Option Income ETF - at NAV
15.25%
14.26%
S&P 500® Total Return Index
19.56%
16.37%
Performance Inception Date Nov. 20, 2024
No Deduction of Taxes [Text Block] The graph and table do not reflect the deduction of taxes that a shareholder would pay on fund distributions or redemption of fund shares.
Material Change Date Sep. 18, 2025
Updated Performance Information Location [Text Block] Visit www.yieldmaxetfs.com/our-etfs/bigy/ for more recent performance information.
Net Assets $ 54,361,000
Holdings Count | Holdings 207
Advisory Fees Paid, Amount $ 227,003
Investment Company, Portfolio Turnover 41.00%
Additional Fund Statistics [Text Block]

Key Fund Statistics

(as of July 31, 2026)

Fund Size (Thousands)
$54,361
Number of Holdings
207
Total Advisory Fee Paid
$227,003
Portfolio Turnover
41%
Holdings [Text Block]

What did the Fund invest in?

(as of July 31, 2026)

Security Type - Investments

(% of Net Assets)
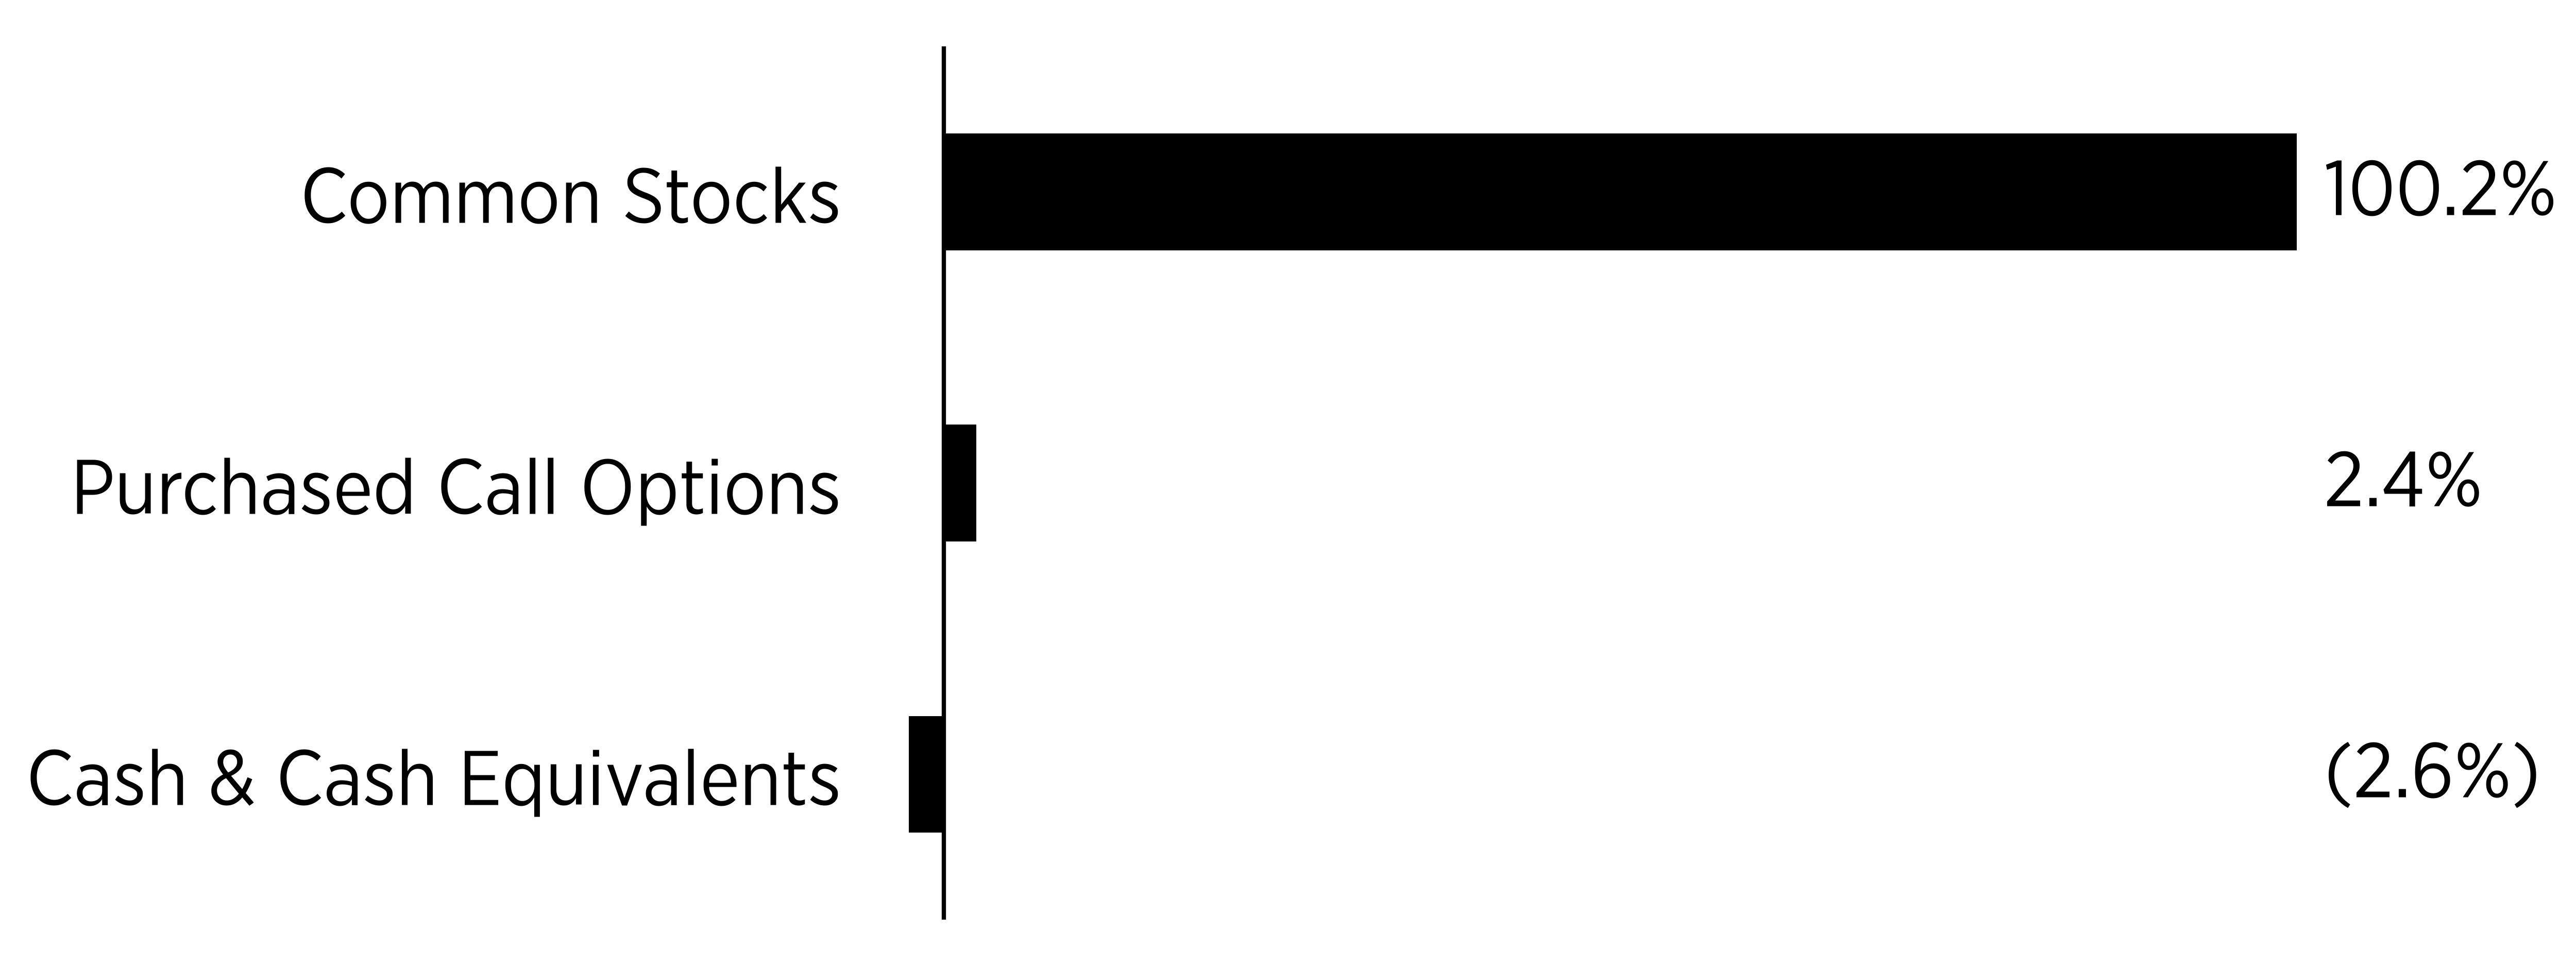
Sector
%
Common Stocks
100.2%
Purchased Call Options
2.4%
Cash & Cash Equivalents
-2.6%
bar


Security Type - Other Financial Instruments

(% of Net Assets)

Sector
%
Written Call Options
-3.7%
bar


Percentages are based on net assets. Cash & Cash Equivalents represents cash, short-term investments, and liabilities in excess of other assets.


Largest Holdings [Text Block]
Top Holdings
(% of Net
Assets)
Apple, Inc.
6.8
NVIDIA Corp.
6.2
Amazon.com, Inc.
5.5
Alphabet, Inc. - Class A
5.1
Microsoft Corp.
3.7
Advanced Micro Devices, Inc.
3.7
Broadcom, Inc.
3.4
JPMorgan Chase & Co.
3.4
Meta Platforms, Inc. - Class A
3.2
Walmart, Inc.
2.7
Material Fund Change [Text Block]

Fund Changes

Effective September 18, 2025 the Fund's payment of income distributions was changed to seek to make such distributions on a monthly or more frequent basis.

YieldMax(R) Target 12(TM) Real Estate Option Income ETF  
Shareholder Report [Line Items]  
Fund Name YieldMax™ Target 12 Real Estate Option Income ETF
Class Name YieldMax™ Target 12 Real Estate Option Income ETF
Trading Symbol RNTY
Security Exchange Name NYSEArca
Annual or Semi-Annual Statement [Text Block] This annual shareholder report contains important information about the YieldMax™ Target 12 Real Estate Option Income ETF (the "Fund") for the period August 1, 2025 to July 31, 2026.
Shareholder Report Annual or Semi-Annual annual shareholder report
Additional Information [Text Block] You can find additional information about the Fund at www.yieldmaxetfs.com/our-etfs/rnty/. You can also request this information by contacting us at (844) 737-3001 or by writing to YieldMax™ Target 12 Real Estate Option Income ETF, c/o U.S. Bank Global Fund Services, P.O. Box 701, Milwaukee, Wisconsin 53201‑0701.
Additional Information Phone Number (844) 737-3001
Additional Information Website www.yieldmaxetfs.com/our-etfs/rnty/
Expenses [Text Block]

What were the Fund costs for the past year?

(based on a hypothetical $10,000 investment)

Class Name
Costs of a $10,000 investment
Costs paid as a percentage of a $10,000 investment
YieldMax™ Target 12 Real Estate Option Income ETF
$107
1.02%*
*Costs paid as a percentage of a $10,000 investment is an annualized figure.


Expenses Paid, Amount $ 107
Expense Ratio, Percent 1.02% [26]
Factors Affecting Performance [Text Block]

How Did the Fund Perform During the Reporting Period?

During the reporting period, RNTY generated a positive total return, as modest gains across its real estate holdings, together with option premium income, contributed to results. Beginning in mid-September 2025, the Fund also made regular monthly distributions toward its 12% annual income target.

What Factors Influenced Performance?

Performance was primarily influenced by the returns of the Fund's underlying portfolio of real estate companies and real estate investment trusts ("REITs"), which benefited from the trajectory of interest rates over the period. The Fund's covered call strategy generated premium income used to help meet its annual 12% target, though this strategy limited participation in a portion of the sector's gains.

Positioning of the Fund

The Fund continues to hold a portfolio of 15 to 30 U.S.-listed real estate companies, REITs, and real estate-related investments, and employs a covered call strategy across its holdings. RNTY seeks to generate current income, so as to be able to make cash distributions based on a targeted annual cash distribution level of 12% while also seeking capital appreciation.

Performance Past Does Not Indicate Future [Text] The Fund's past performance is not a good indicator of how the Fund will perform in the future.
Line Graph [Table Text Block]

Cumulative Performance

(Initial Investment of $10,000)
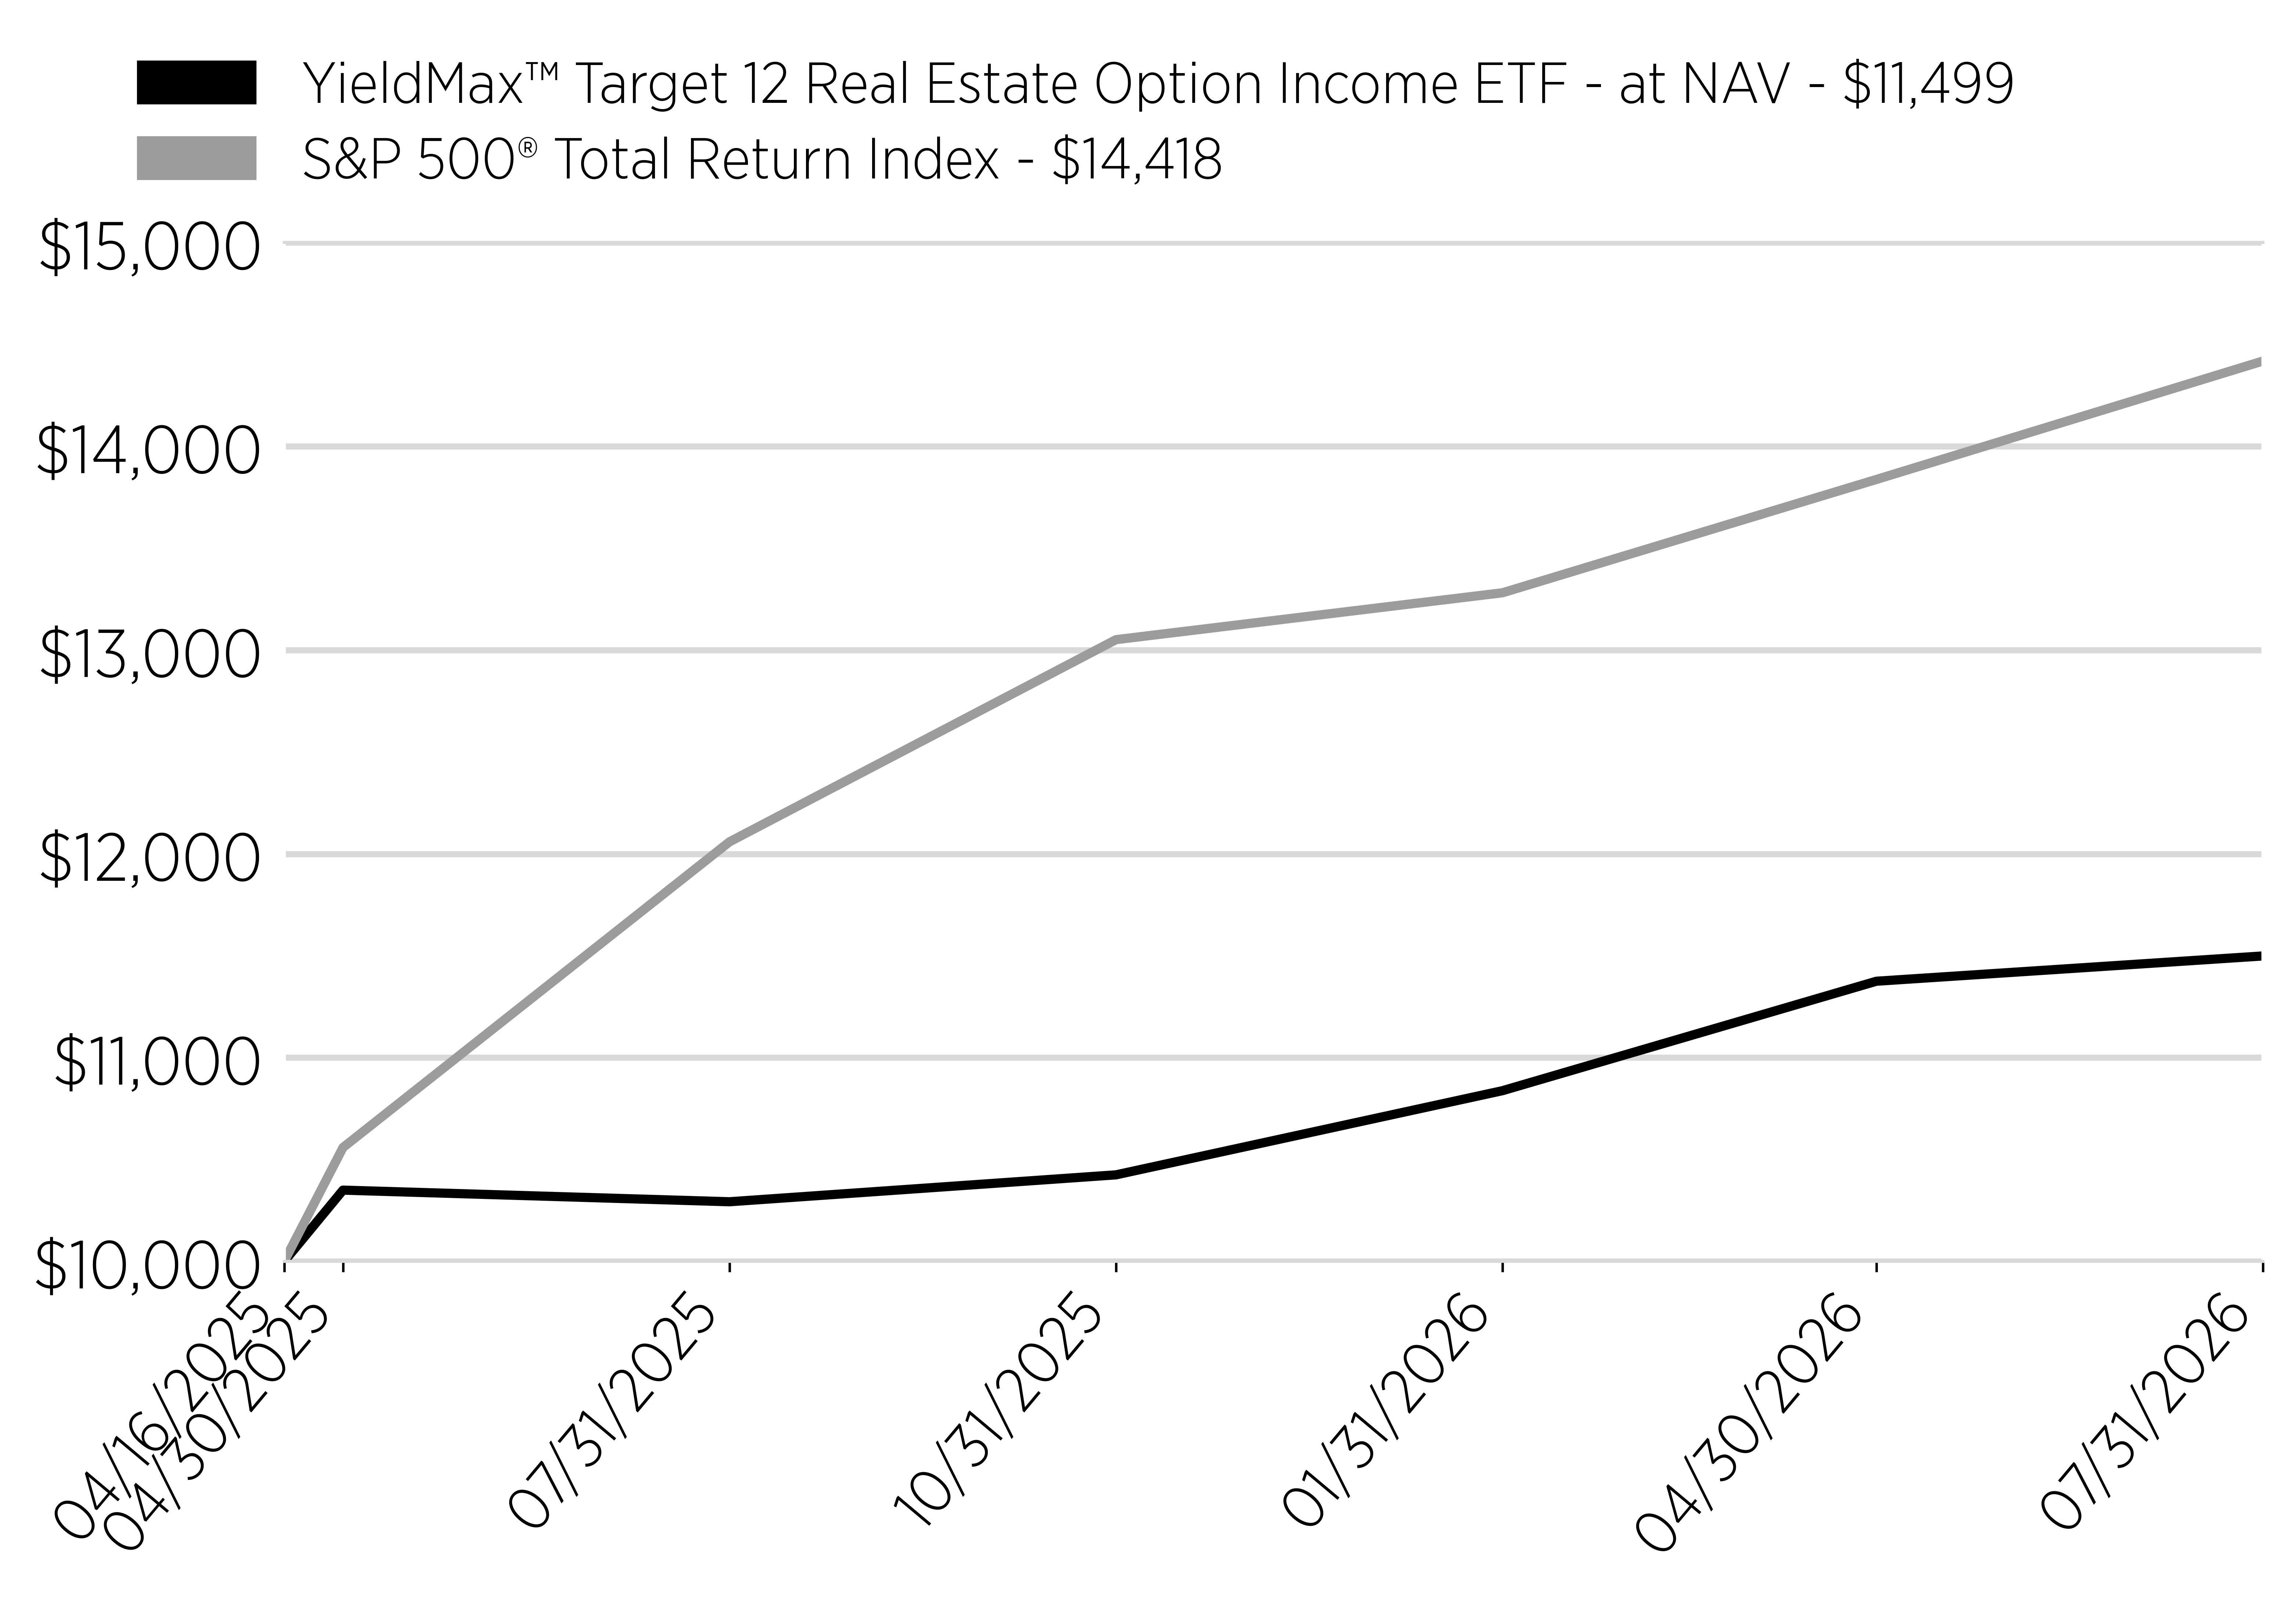
Date
YieldMax™ Target 12 Real Estate Option Income ETF - at NAV - $11,499
S&P 500® Total Return Index - $14,418
4/16/2025
10000
10000
4/30/2025
10350
10559
7/31/2025
10293
12059
10/31/2025
10425
13051
1/31/2026
10838
13281
4/30/2026
11375
13837
7/31/2026
11499
14418
line
Average Annual Return [Table Text Block]

Annual Performance

1 Year
Since Inception (4/16/25)
Yieldmax™ Target 12 Real Estate Option Income ETF - at NAV
11.04%
11.44%
S&P 500® Total Return Index
19.56%
32.78%
Performance Inception Date Apr. 16, 2025
No Deduction of Taxes [Text Block] The graph and table do not reflect the deduction of taxes that a shareholder would pay on fund distributions or redemption of fund shares.
Material Change Date Sep. 18, 2025
Updated Performance Information Location [Text Block] Visit www.yieldmaxetfs.com/our-etfs/rnty/ for more recent performance information.
Net Assets $ 8,739,000
Holdings Count | Holdings 76
Advisory Fees Paid, Amount $ 55,765
Investment Company, Portfolio Turnover 752.00%
Additional Fund Statistics [Text Block]

Key Fund Statistics

(as of July 31, 2026)

Fund Size (Thousands)
$8,739
Number of Holdings
76
Total Advisory Fee Paid
$55,765
Portfolio Turnover
752%
Holdings [Text Block]

What did the Fund invest in?

(as of July 31, 2026)

Security Type - Investments

(% of Net Assets)
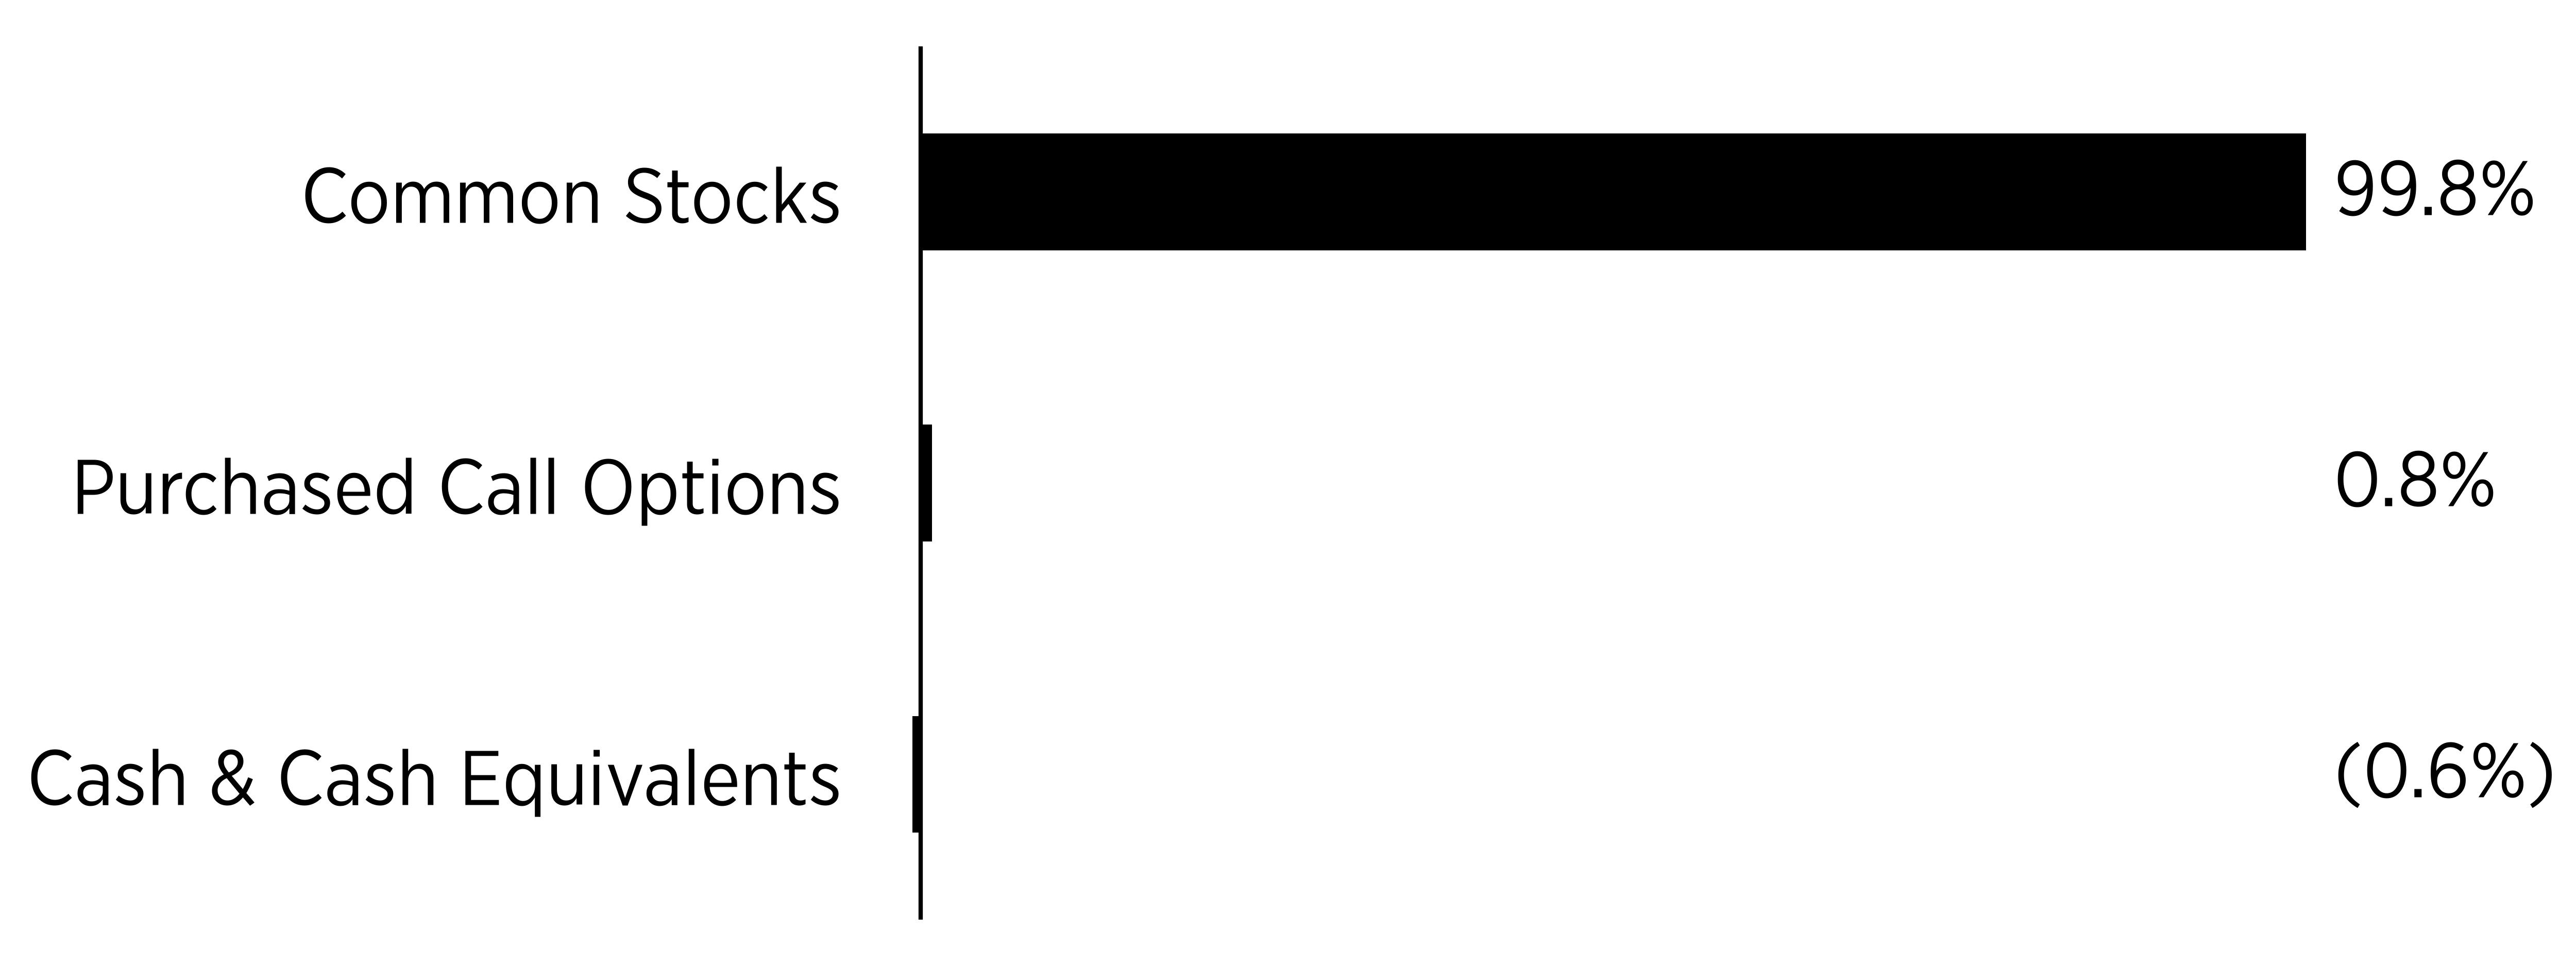
Sector
%
Common Stocks
99.8%
Purchased Call Options
0.8%
Cash & Cash Equivalents
-0.6%
bar


Security Type - Other Financial Instruments

(% of Net Assets)

Sector
%
Written Call Options
-1.6%
bar


Percentages are based on net assets. Cash & Cash Equivalents represents cash, short-term investments, and liabilities in excess of other assets.


Largest Holdings [Text Block]
Top Holdings
(% of Net
Assets)
Welltower, Inc. - REIT
7.2
Prologis, Inc. - REIT
6.7
Digital Realty Trust, Inc. - REIT
5.8
Simon Property Group, Inc. - REIT
5.5
Equinix, Inc. - REIT
4.6
Texas Pacific Land Corp.
4.5
Realty Income Corp. - REIT
4.1
Iron Mountain, Inc. - REIT
4.1
St. Joe Co.
4.0
Public Storage - REIT
4.0
Material Fund Change [Text Block]

Fund Changes

Effective September 18, 2025 the Fund's payment of income distributions was changed to seek to make such distributions on a monthly or more frequent basis.

YieldMax(R) Target 12(TM) Semiconductor Option Income ETF  
Shareholder Report [Line Items]  
Fund Name YieldMax™ Target 12 Semiconductor Option Income ETF
Class Name YieldMax™ Target 12 Semiconductor Option Income ETF
Trading Symbol SOXY
Security Exchange Name NYSEArca
Annual or Semi-Annual Statement [Text Block] This annual shareholder report contains important information about the YieldMax™ Target 12 Semiconductor Option Income ETF (the "Fund") for the period August 1, 2025 to July 31, 2026.
Shareholder Report Annual or Semi-Annual annual shareholder report
Additional Information [Text Block] You can find additional information about the Fund at www.yieldmaxetfs.com/our-etfs/soxy/. You can also request this information by contacting us at (844) 737-3001 or by writing to YieldMax™ Target 12 Semiconductor Option Income ETF, c/o U.S. Bank Global Fund Services, P.O. Box 701, Milwaukee, Wisconsin 53201‑0701.
Additional Information Phone Number (844) 737-3001
Additional Information Website www.yieldmaxetfs.com/our-etfs/soxy/
Expenses [Text Block]

What were the Fund costs for the past year?

(based on a hypothetical $10,000 investment)

Class Name
Costs of a $10,000 investment
Costs paid as a percentage of a $10,000 investment
YieldMax™ Target 12 Semiconductor Option Income ETF
$146
1.01%*
*Costs paid as a percentage of a $10,000 investment is an annualized figure.


Expenses Paid, Amount $ 146
Expense Ratio, Percent 1.01% [27]
Factors Affecting Performance [Text Block]

How Did the Fund Perform During the Reporting Period?

During the reporting period, SOXY generated a strong positive total return, as substantial gains across its semiconductor holdings significantly outweighed the capped upside from its call spread strategy. Beginning in mid-September 2025, the Fund also starting making regular monthly distributions toward its 12% annual income target.

What Factors Influenced Performance?

Performance was primarily influenced by the returns of the Fund's underlying portfolio of semiconductor companies, which benefited from continued demand tied to artificial intelligence infrastructure and data center buildout. The Fund's covered call strategy generated premium income used to help meet its annual 12% target. Elevated implied volatility across the sector supported higher premiums.

Positioning of the Fund

The Fund continues to hold a portfolio of 15 to 30 semiconductor companies directly and employs a covered call strategy across its holdings. SOXY seeks to generate current income to allow for cash distributions based on a targeted annual cash distribution level of 12% while also seeking capital appreciation.

Performance Past Does Not Indicate Future [Text] The Fund's past performance is not a good indicator of how the Fund will perform in the future.
Line Graph [Table Text Block]

Cumulative Performance

(Initial Investment of $10,000)
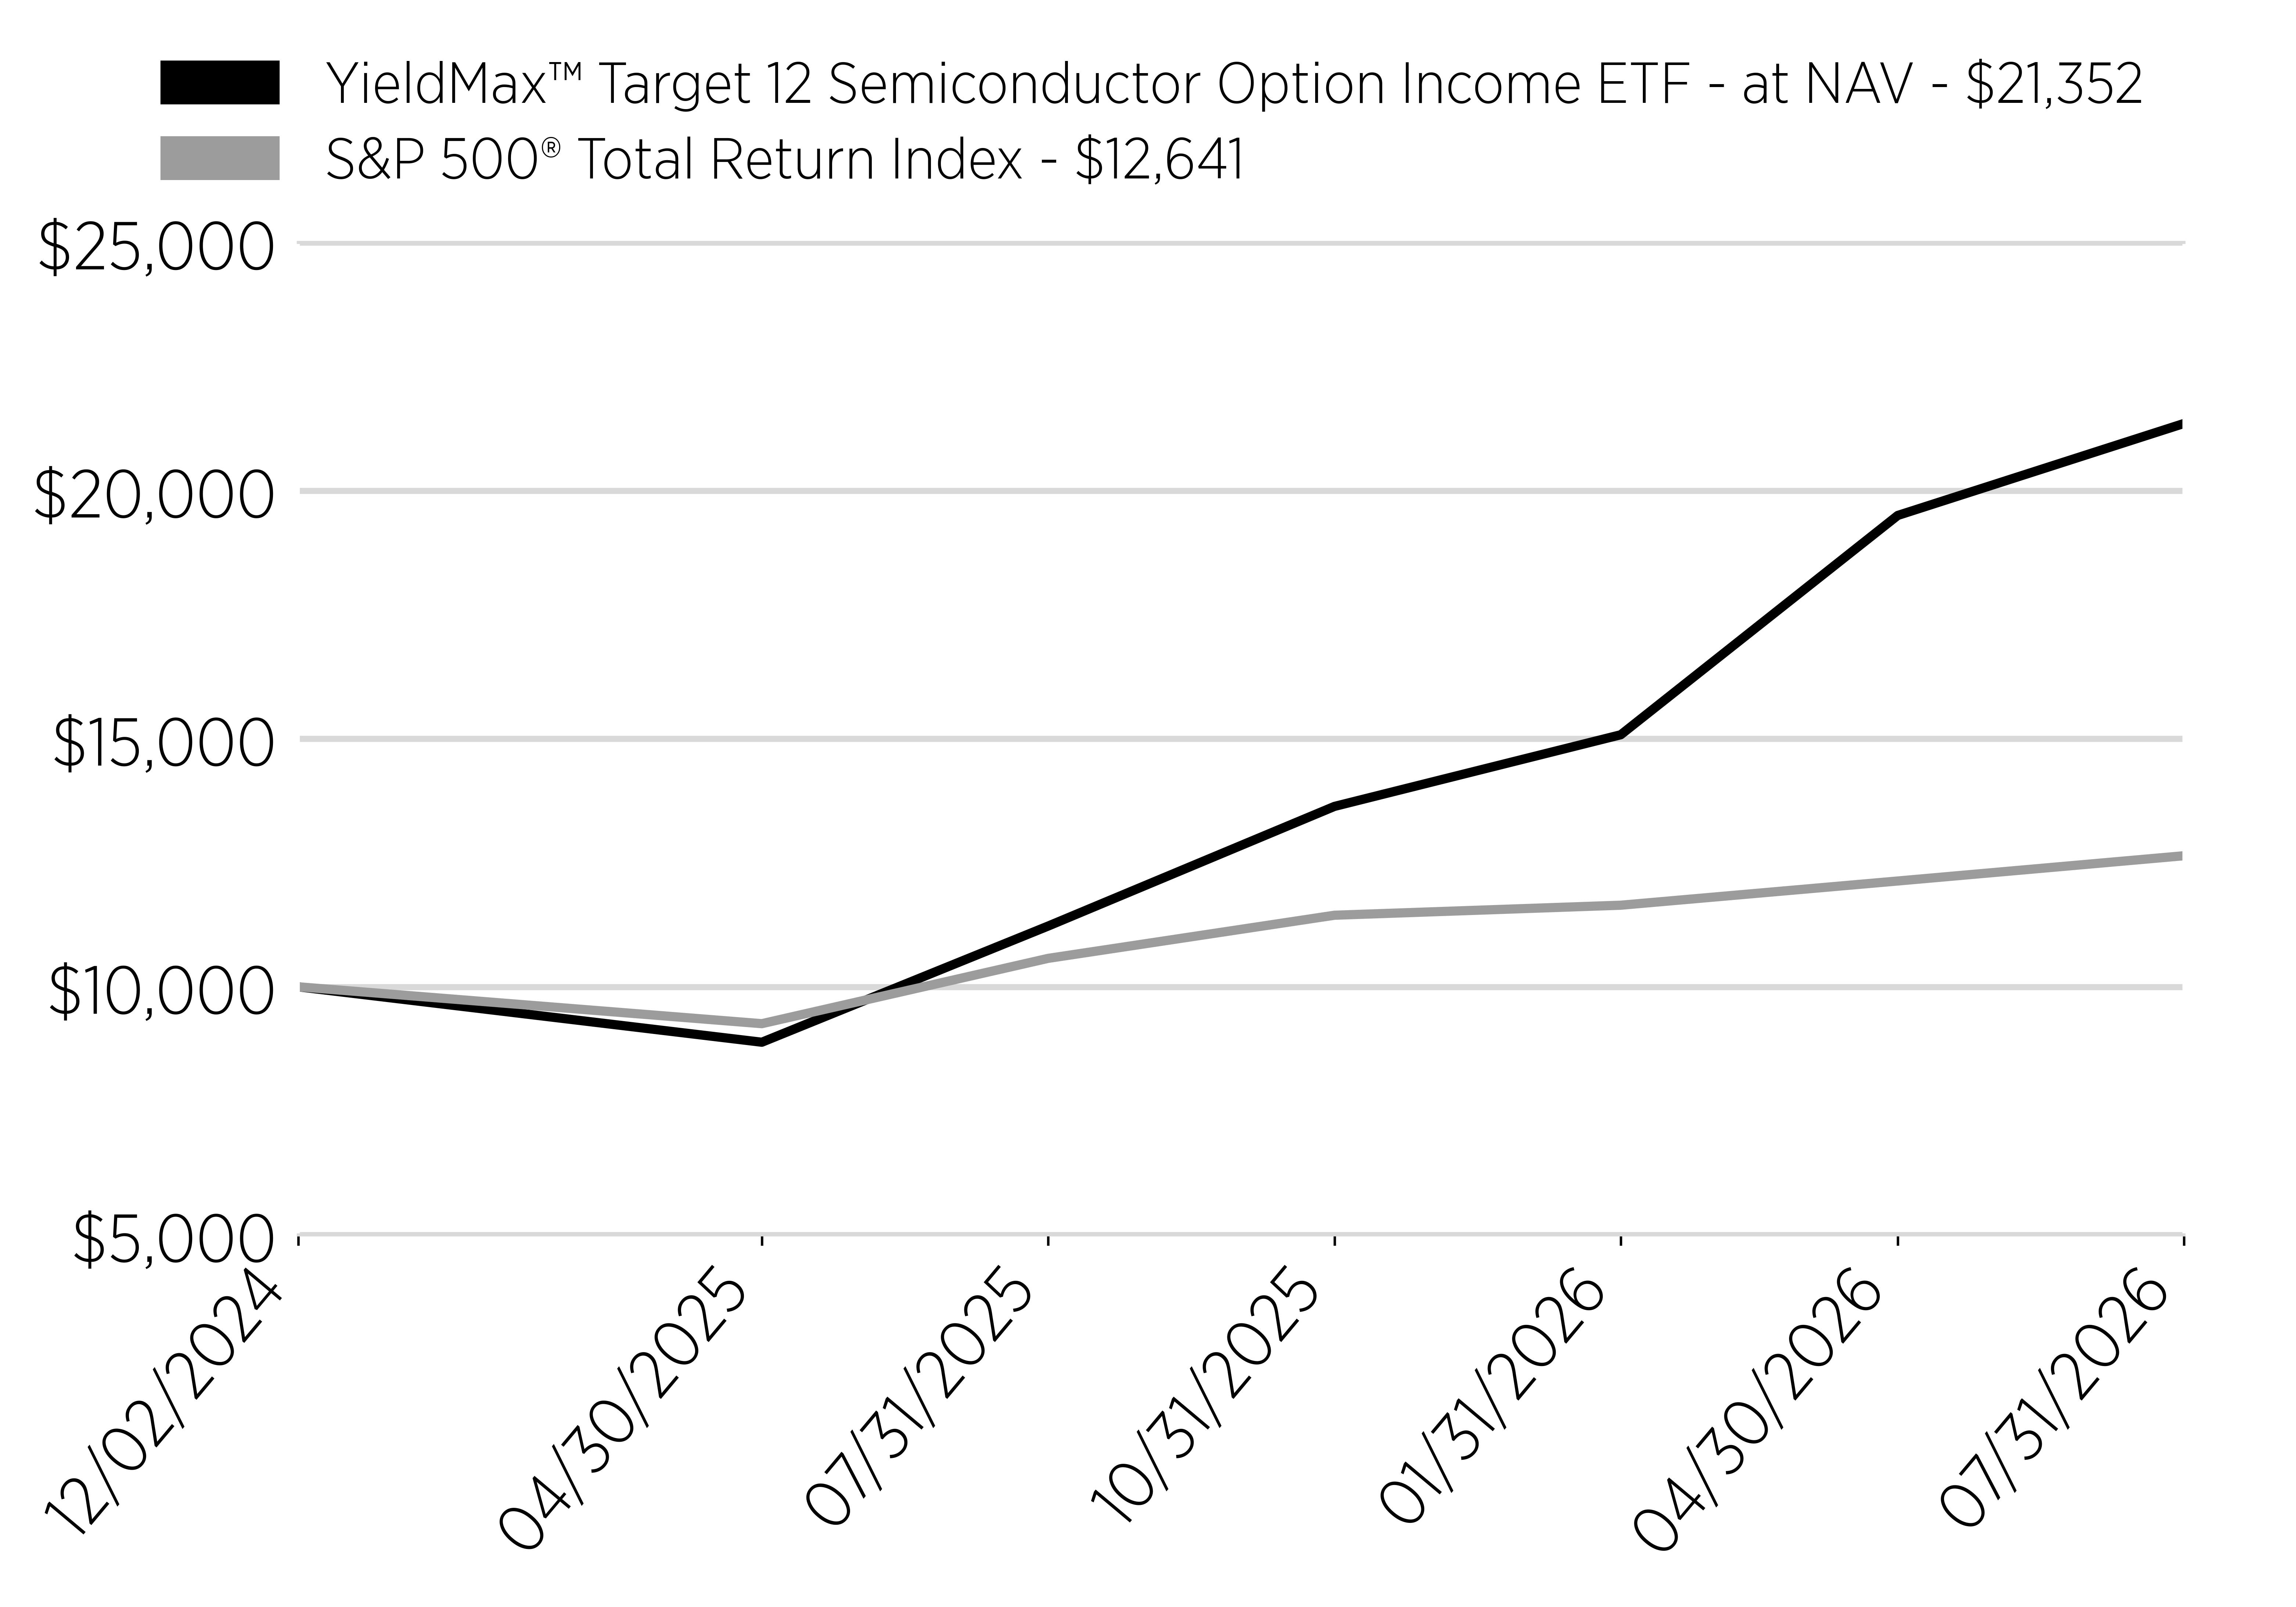
Date
YieldMax™ Target 12 Semiconductor Option Income ETF - at NAV - $21,352
S&P 500® Total Return Index - $12,641
12/2/2024
10000
10000
4/30/2025
8883
9257
7/31/2025
11224
10573
10/31/2025
13635
11442
1/31/2026
15079
11644
4/30/2026
19498
12132
7/31/2026
21352
12641
line
Average Annual Return [Table Text Block]

Annual Performance

1 Year
Since Inception (12/2/24)
Yieldmax™ Target 12 Semiconductor Option Income ETF - at NAV
90.25%
57.91%
S&P 500® Total Return Index
19.56%
15.16%
Performance Inception Date Dec. 02, 2024
No Deduction of Taxes [Text Block] The graph and table do not reflect the deduction of taxes that a shareholder would pay on fund distributions or redemption of fund shares.
Material Change Date Sep. 18, 2025
Updated Performance Information Location [Text Block] Visit www.yieldmaxetfs.com/our-etfs/soxy/ for more recent performance information.
Net Assets $ 64,010,000
Holdings Count | Holdings 85
Advisory Fees Paid, Amount $ 303,976
Investment Company, Portfolio Turnover 68.00%
Additional Fund Statistics [Text Block]

Key Fund Statistics

(as of July 31, 2026)

Fund Size (Thousands)
$64,010
Number of Holdings
85
Total Advisory Fee Paid
$303,976
Portfolio Turnover
68%
Holdings [Text Block]

What did the Fund invest in?

(as of July 31, 2026)

Security Type - Investments

(% of Net Assets)
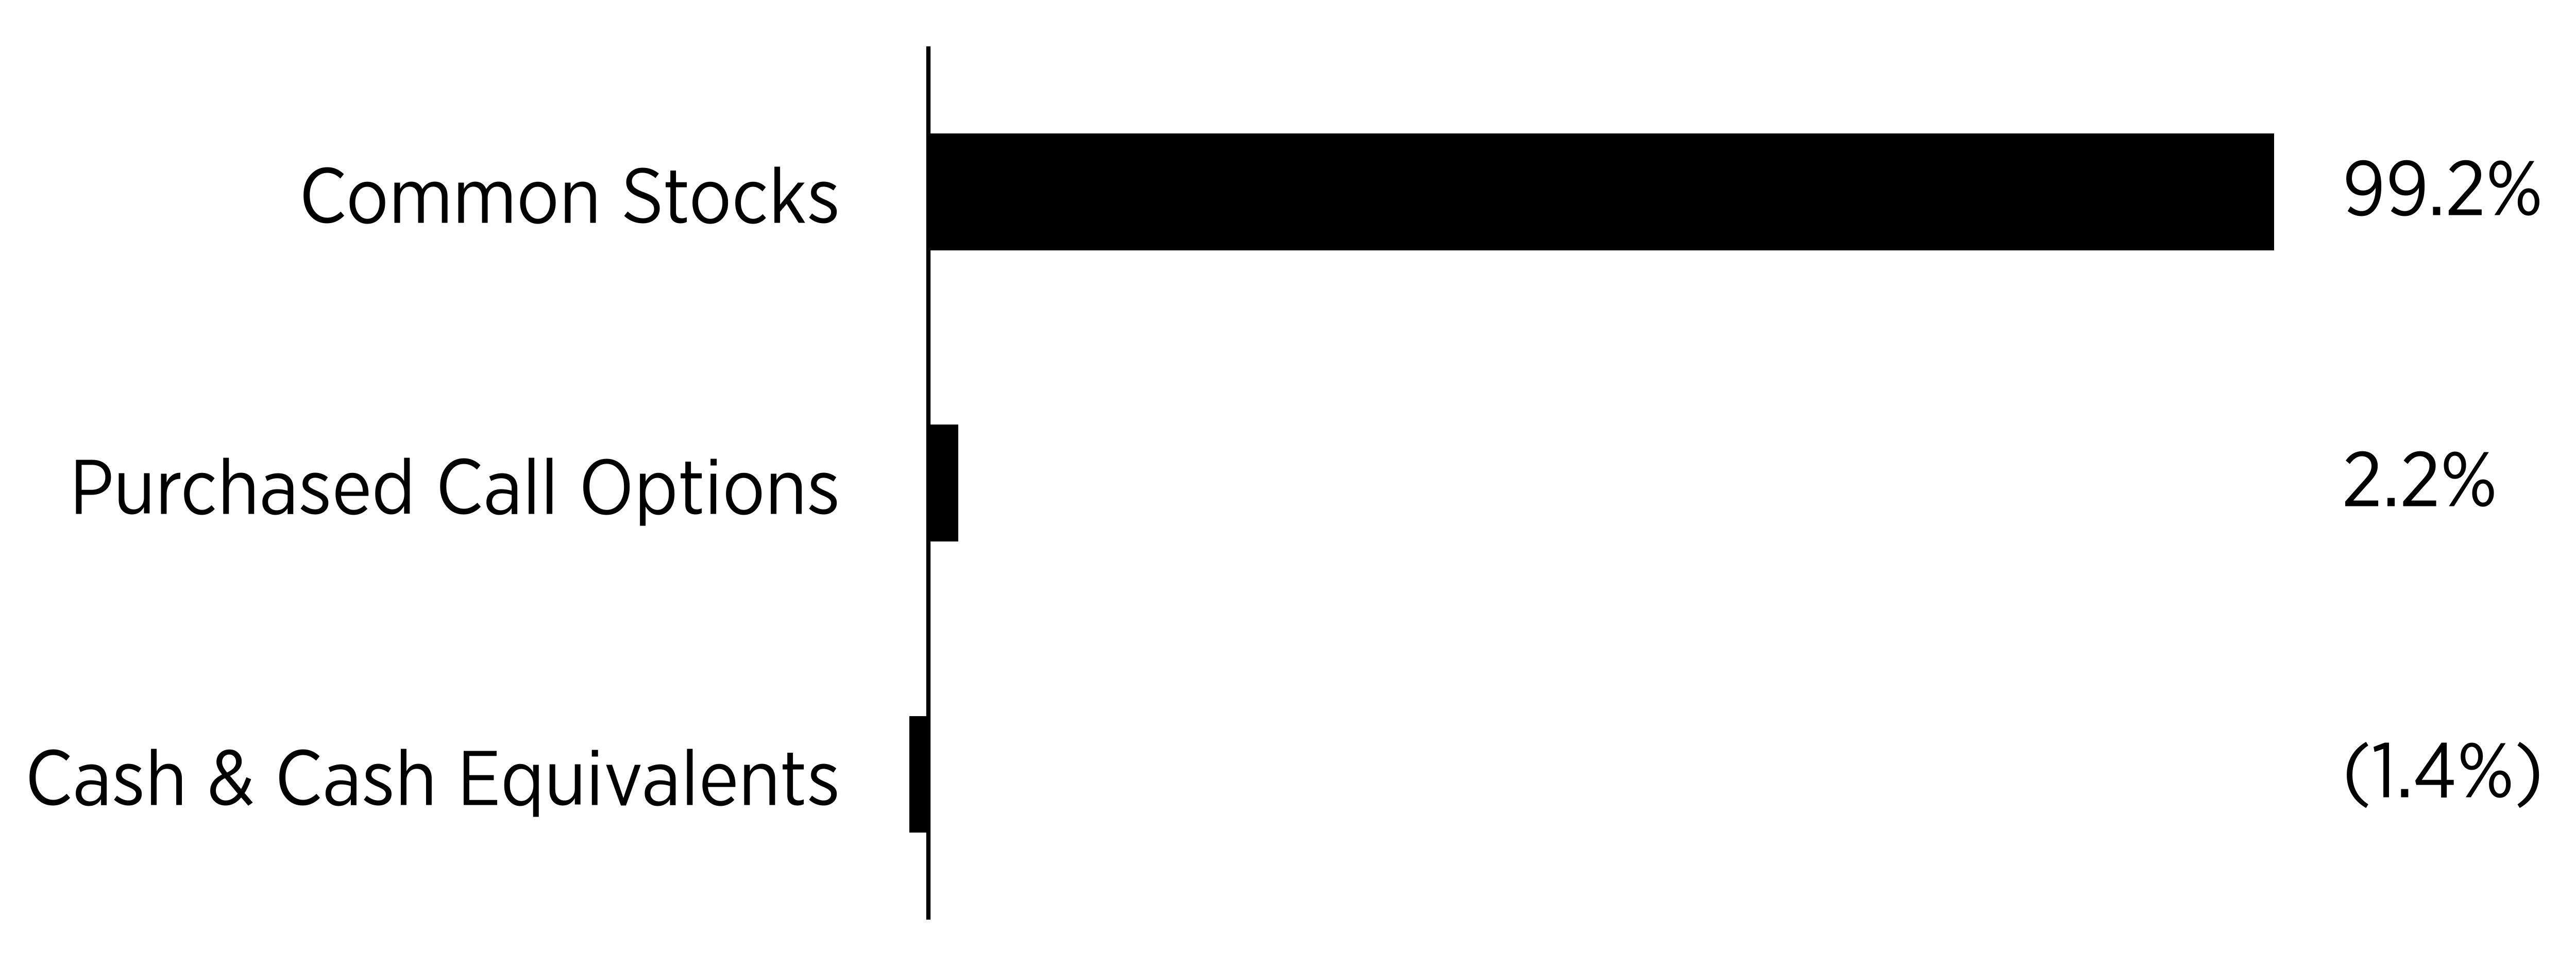
Sector
%
Common Stocks
99.2%
Purchased Call Options
2.2%
Cash & Cash Equivalents
-1.4%
bar


Security Type - Other Financial Instruments

(% of Net Assets)

Sector
%
Written Call Options
-2.8%
bar


Percentages are based on net assets. Cash & Cash Equivalents represents cash, short-term investments, and liabilities in excess of other assets.


Largest Holdings [Text Block]
Top Holdings
(% of Net
Assets)
NVIDIA Corp.
6.1
Advanced Micro Devices, Inc.
5.2
Broadcom, Inc.
4.9
ASML Holding NV
4.7
Marvell Technology Inc
4.5
ACM Research, Inc. - Class A
4.4
Lam Research Corp.
4.4
Applied Materials, Inc.
4.3
Astera Labs, Inc.
4.2
Micron Technology, Inc.
4.2
Material Fund Change [Text Block]

Fund Changes

Effective September 18, 2025 the Fund's payment of income distributions was changed to seek to make such distributions on a monthly or more frequent basis.

YieldMax(R) TSLA Performance & Distribution Target 25(TM) ETF  
Shareholder Report [Line Items]  
Fund Name YieldMax™ TSLA Performance & Distribution Target 25 ETF
Class Name YieldMax™ TSLA Performance & Distribution Target 25 ETF
Trading Symbol TEST
Security Exchange Name CboeBZX
Annual or Semi-Annual Statement [Text Block] This annual shareholder report contains important information about the YieldMax™ TSLA Performance & Distribution Target 25 ETF (the "Fund") for the period August 1, 2025 to July 31, 2026.
Shareholder Report Annual or Semi-Annual annual shareholder report
Additional Information [Text Block] You can find additional information about the Fund at www.yieldmaxetfs.com/our-etfs/test/. You can also request this information by contacting us at (844) 737-3001 or by writing to YieldMax™ TSLA Performance & Distribution Target 25 ETF, c/o U.S. Bank Global Fund Services, P.O. Box 701, Milwaukee, Wisconsin 53201‑0701.
Additional Information Phone Number (844) 737-3001
Additional Information Website www.yieldmaxetfs.com/our-etfs/test/
Expenses [Text Block]

What were the Fund costs for the past year?

(based on a hypothetical $10,000 investment)

Class Name
Costs of a $10,000 investment
Costs paid as a percentage of a $10,000 investment
YieldMax™ TSLA Performance & Distribution Target 25 ETF
$64*
1.01%**
*The Fund commenced operations on November 17, 2025. Expenses for a full reporting period would be higher than the figures shown.
**Costs paid as a percentage of a $10,000 investment is an annualized figure.


Expenses Paid, Amount $ 64 [28]
Expense Ratio, Percent 1.01% [29]
Expenses Short Period Footnote [Text Block] The Fund commenced operations on November 17, 2025. Expenses for a full reporting period would be higher than the figures shown.
Factors Affecting Performance [Text Block]

How Did the Fund Perform During the Reporting Period?

The Fund had a negative total return as declines in Tesla, Inc. (“TSLA”) outweighed income generated by its options strategies. The Fund also made regular distributions.

What Factors Influenced Performance?

Performance was primarily influenced by TSLA’s share price since inception which has been less than 12 months, and implied volatility. Declines in TSLA detracted from results, while option premiums partially offset those losses.

Positioning of the Fund

The Fund maintained synthetic exposure to TSLA and employed options strategies to generate premiums while targeting annual cash distributions of approximately 25% of net asset value and seeking current income and capital appreciation.

Performance Past Does Not Indicate Future [Text] The Fund's past performance is not a good indicator of how the Fund will perform in the future.
Line Graph [Table Text Block]

Cumulative Performance

(Initial Investment of $10,000)
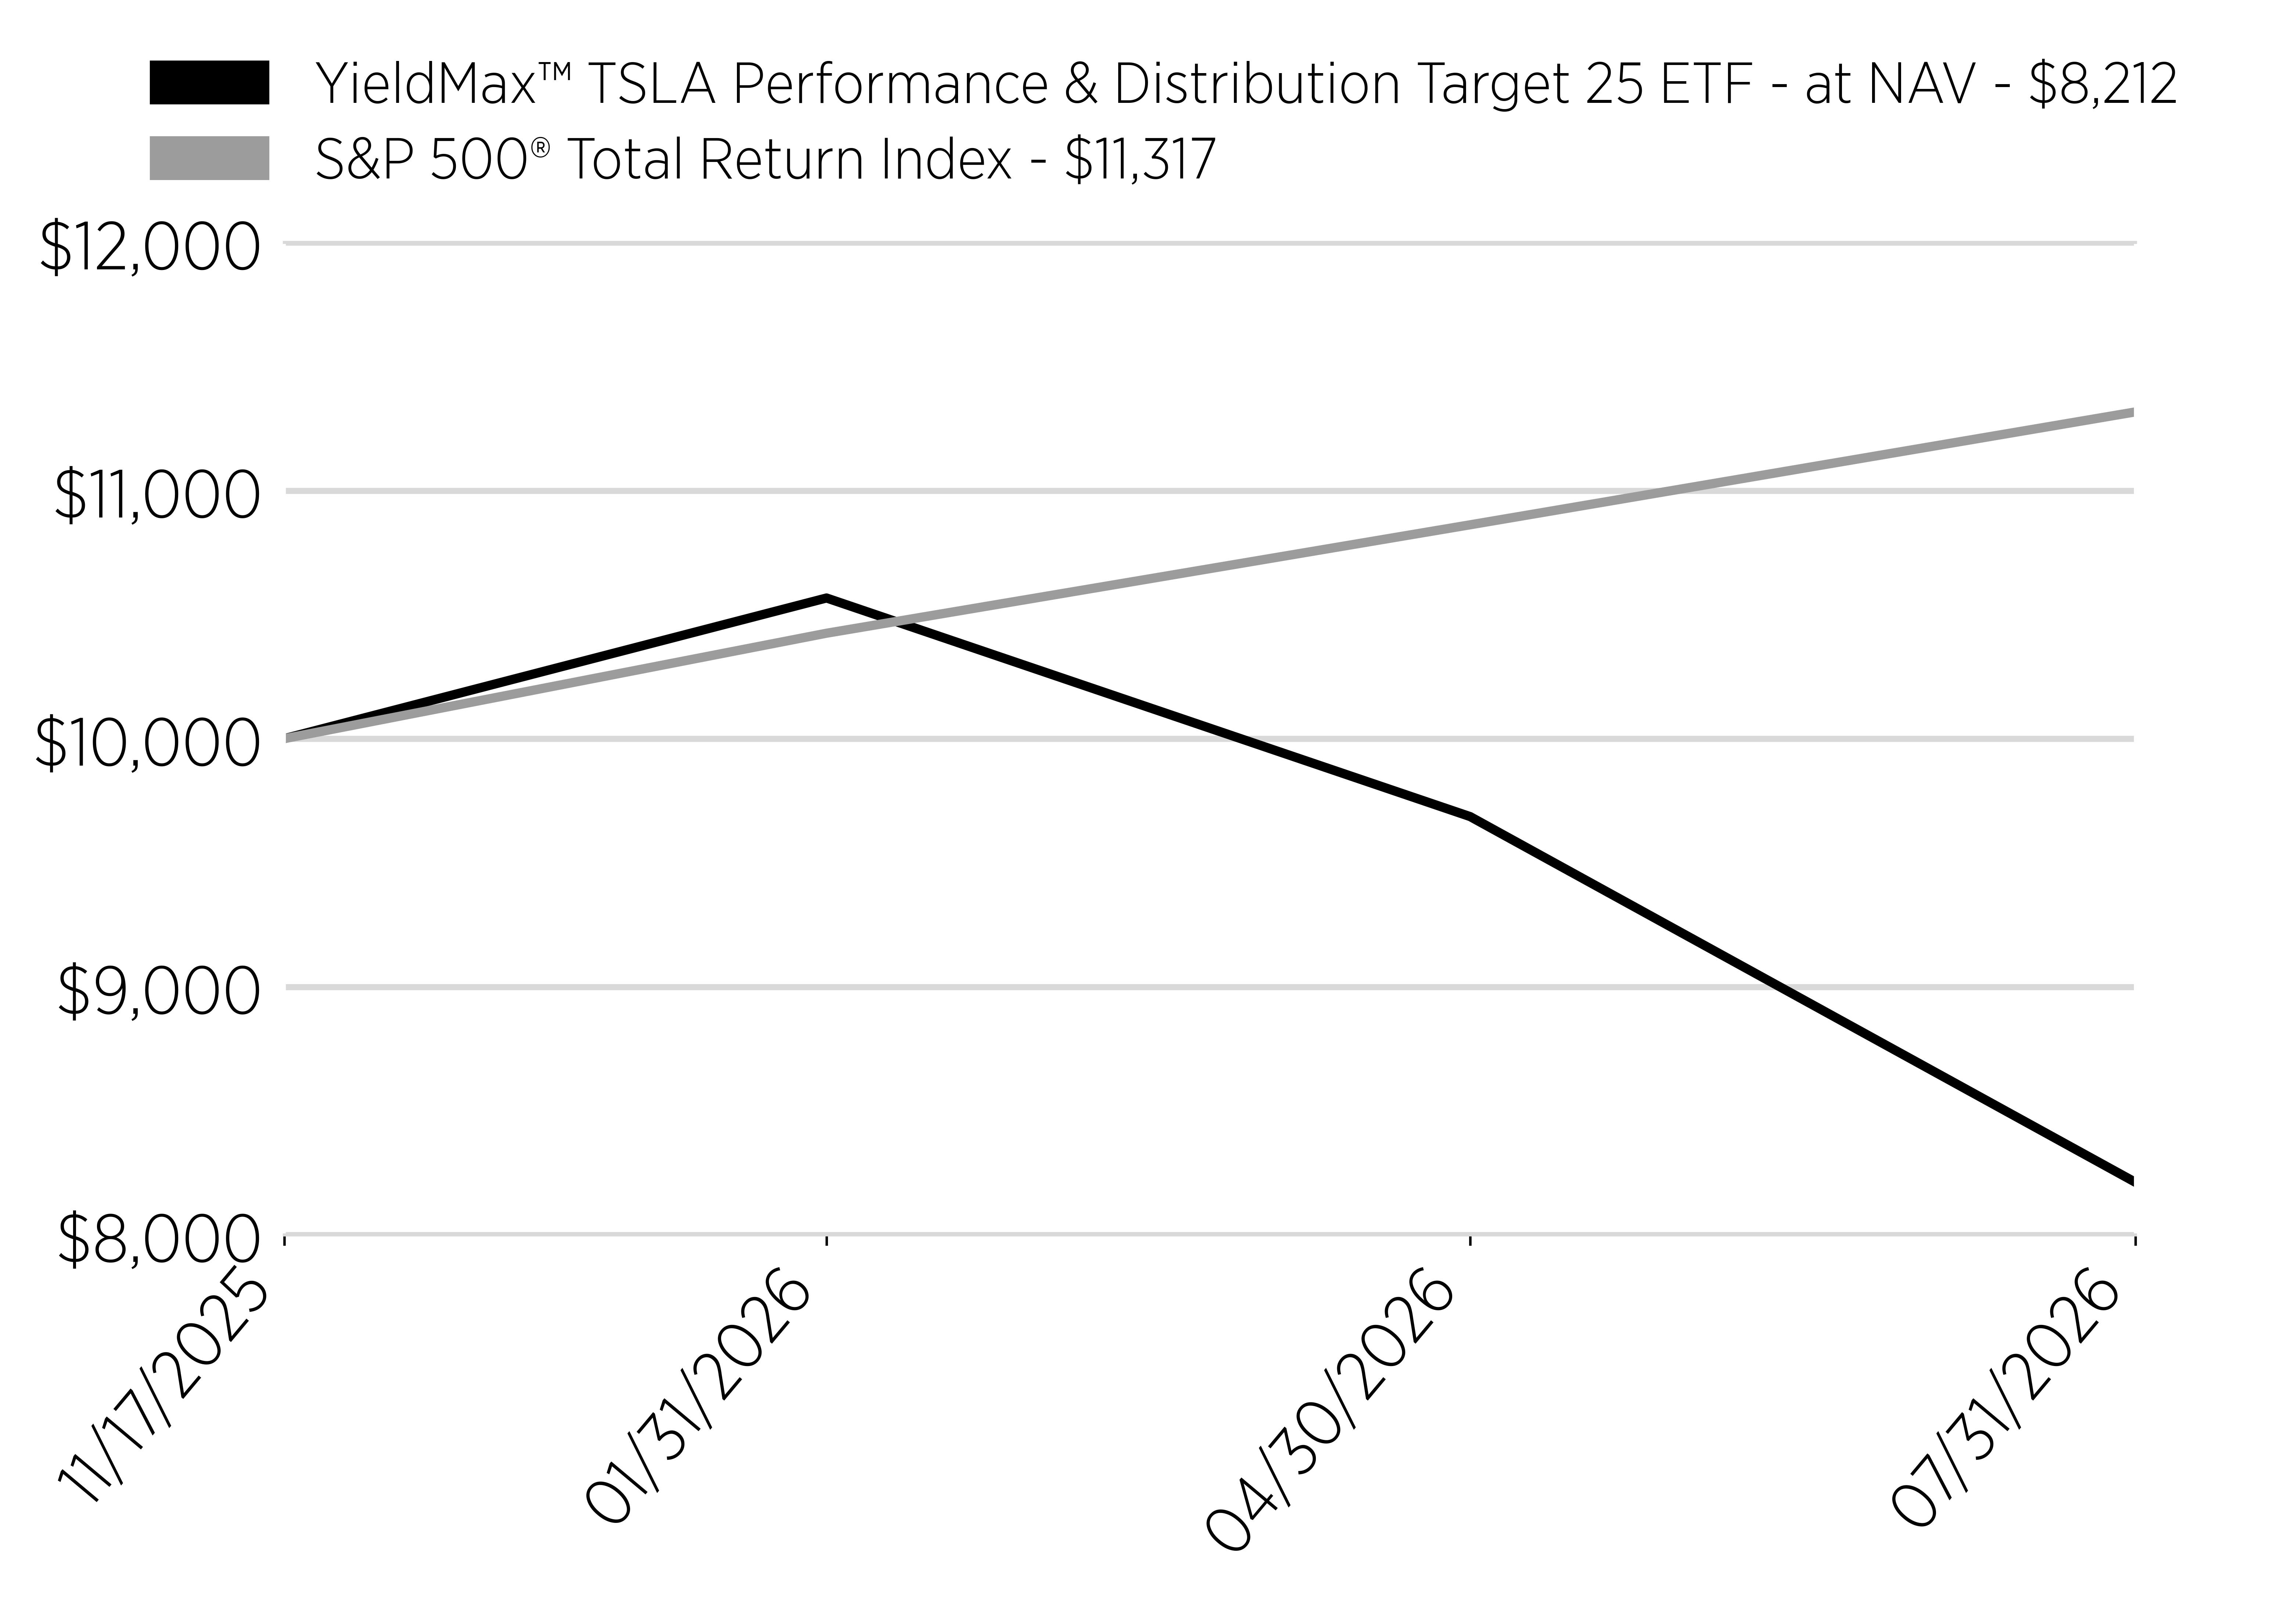
Date
YieldMax™ TSLA Performance & Distribution Target 25 ETF - at NAV - $8,212
S&P 500® Total Return Index - $11,317
11/17/2025
10000
10000
1/31/2026
10567
10425
4/30/2026
9686
10862
7/31/2026
8212
11317
line
Average Annual Return [Table Text Block]

Annual Performance

Since Inception (11/17/25)
Yieldmax™ TSLA Performance & Distribution Target 25 ETF - at NAV
-17.86%*
S&P 500® Total Return Index
13.17%
*Not Annualized for periods less than one year.
Performance Inception Date Nov. 17, 2025
No Deduction of Taxes [Text Block] The graph and table do not reflect the deduction of taxes that a shareholder would pay on fund distributions or redemption of fund shares.
Material Change Date Nov. 12, 2025
Updated Performance Information Location [Text Block] Visit www.yieldmaxetfs.com/our-etfs/test/ for more recent performance information.
Net Assets $ 3,468,000
Holdings Count | Holdings 12
Advisory Fees Paid, Amount $ 17,491
Investment Company, Portfolio Turnover 0.00%
Additional Fund Statistics [Text Block]

Key Fund Statistics

(as of July 31, 2026)

Fund Size (Thousands)
$3,468
Number of Holdings
12
Total Advisory Fee Paid
$17,491
Portfolio Turnover
0%
Holdings [Text Block]

What did the Fund invest in?

(as of July 31, 2026)

Security Type - Investments

(% of Net Assets)
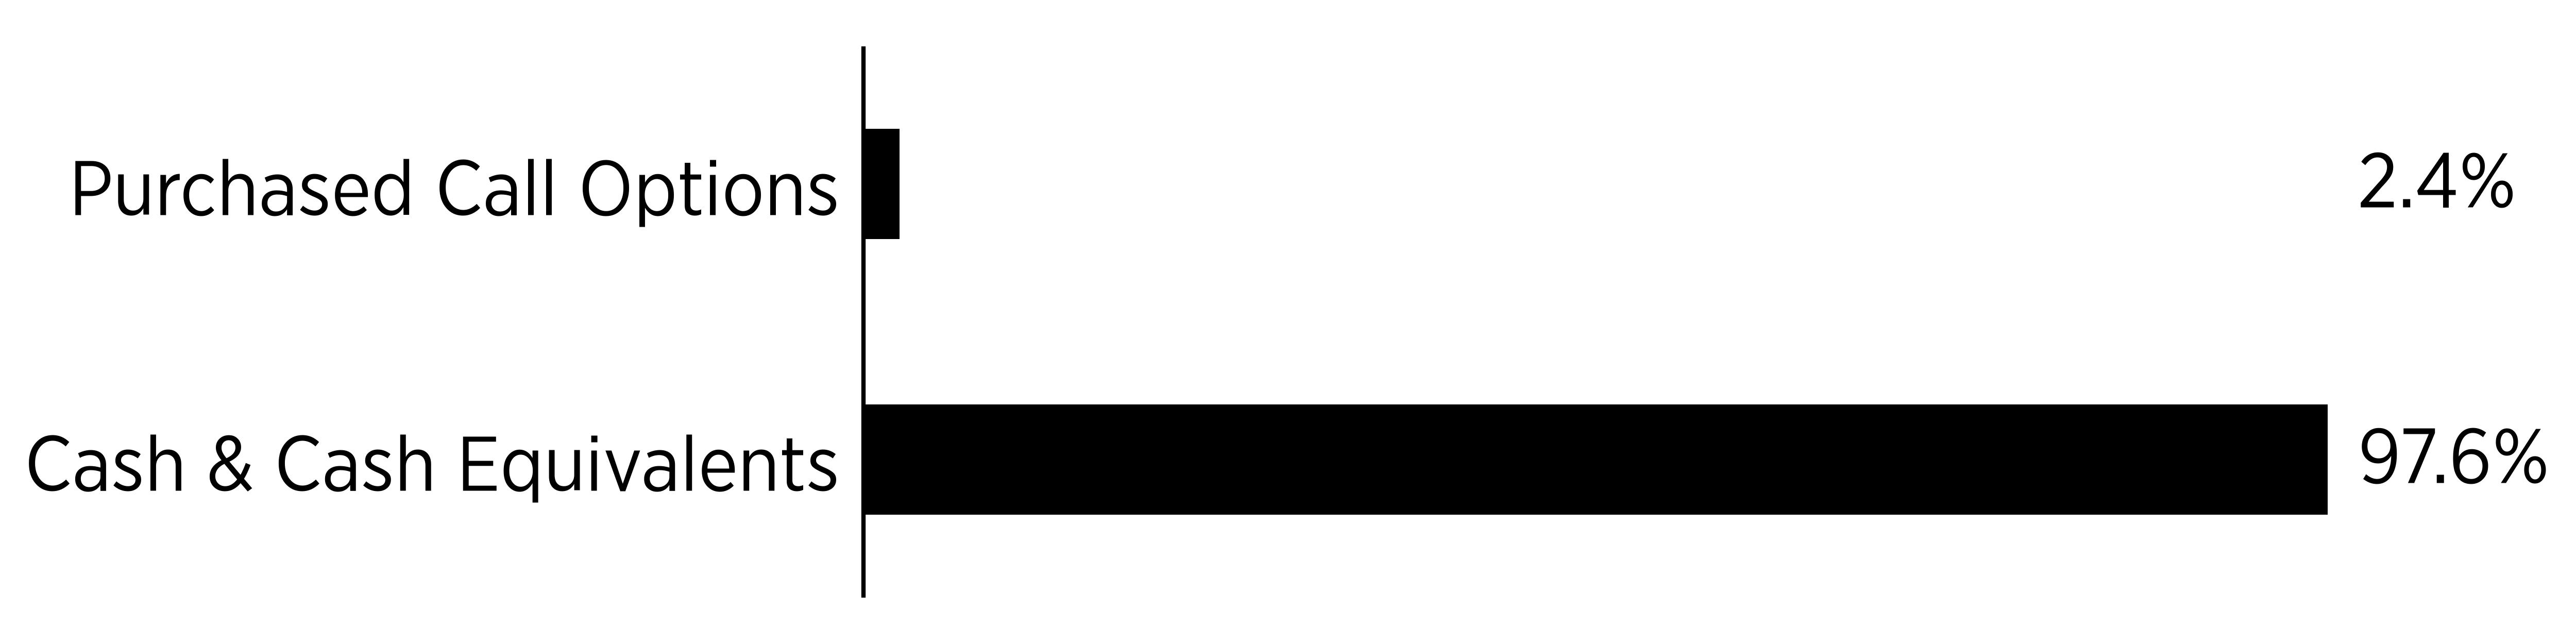
Sector
%
Purchased Call Options
2.4%
Cash & Cash Equivalents
97.6%
bar


Security Type - Other Financial Instruments

(% of Net Assets)
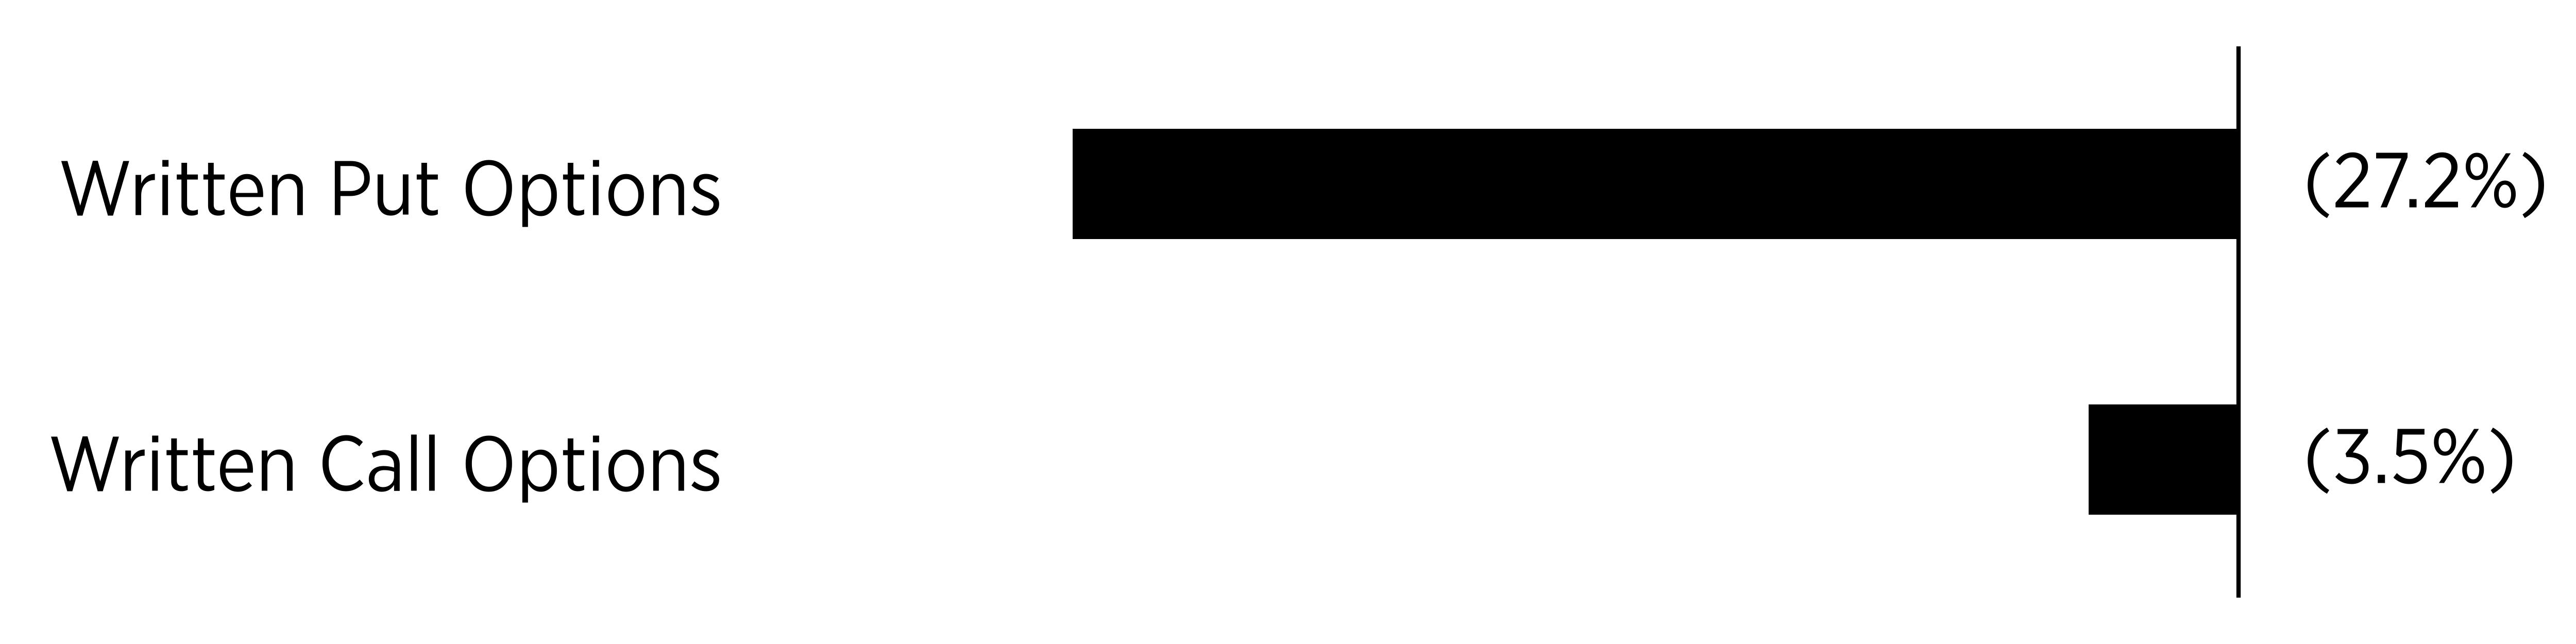
Sector
%
Written Put Options
-27.2%
Written Call Options
-3.5%
bar


Percentages are based on net assets. Cash & Cash Equivalents represents cash, short-term investments, and liabilities in excess of other assets.


Largest Holdings [Text Block]
Top Holdings
(% of Net Assets)
U.S. Treasury Bills
54.0
First American Government Obligations Fund - Class X, 3.58%
52.8
Tesla, Inc., Expiration: 9/18/2026;
Exercise Price: $395.01
-27.2
Tesla, Inc., Expiration: 9/18/2026;
Exercise Price: $330.00
-2.1
Tesla, Inc., Expiration: 9/18/2026;
Exercise Price: $360.00
1.0
Tesla, Inc., Expiration: 9/18/2026;
Exercise Price: $395.01
0.9
Tesla, Inc., Expiration: 8/21/2026;
Exercise Price: $322.50
-0.8
Tesla, Inc., Expiration: 8/21/2026;
Exercise Price: $327.50
-0.6
Tesla, Inc., Expiration: 8/21/2026;
Exercise Price: $345.00
0.3
Tesla, Inc., Expiration: 8/21/2026;
Exercise Price: $355.00
02
Material Fund Change [Text Block]

Fund Changes

Effective November 12, 2025 the Fund's listing exchange has been changed to Cboe BZX Exchange, Inc.
YieldMax(R) U.S. Stocks Target Double Distribution ETF  
Shareholder Report [Line Items]  
Fund Name YieldMax™ U.S. Stocks Target Double Distribution ETF
Class Name YieldMax™ U.S. Stocks Target Double Distribution ETF
Trading Symbol DDDD
Security Exchange Name NYSEArca
Annual or Semi-Annual Statement [Text Block] This annual shareholder report contains important information about the YieldMax™ U.S. Stocks Target Double Distribution ETF (the "Fund") for the period August 1, 2025 to July 31, 2026.
Shareholder Report Annual or Semi-Annual annual shareholder report
Additional Information [Text Block] You can find additional information about the Fund at www.yieldmaxetfs.com/our-etfs/dddd/. You can also request this information by contacting us at (844) 737-3001 or by writing to YieldMax™ U.S. Stocks Target Double Distribution ETF, c/o U.S. Bank Global Fund Services, P.O. Box 701, Milwaukee, Wisconsin 53201‑0701.
Additional Information Phone Number (844) 737-3001
Additional Information Website www.yieldmaxetfs.com/our-etfs/dddd/
Expenses [Text Block]

What were the Fund costs for the past year?

(based on a hypothetical $10,000 investment)

Class Name
Costs of a $10,000 investment
Costs paid as a percentage of a $10,000 investment
YieldMax™ U.S. Stocks Target Double Distribution ETF
$40*
0.99%**
*The Fund commenced operations on March 11, 2026. Expenses for a full reporting period would be higher than the figures shown.
**Costs paid as a percentage of a $10,000 investment is an annualized figure.


Expenses Paid, Amount $ 40 [30]
Expense Ratio, Percent 0.99% [31]
Expenses Short Period Footnote [Text Block] The Fund commenced operations on March 11, 2026. Expenses for a full reporting period would be higher than the figures shown.
Factors Affecting Performance [Text Block]

How Did the Fund Perform During the Reporting Period?

Since its inception in March 2026, DDDD generated a positive total return, as gains among its underlying dividend equity holdings were supplemented by income generated through its options overlay. The Fund made regular distributions designed to approximate double the annualized distribution yield of the Schwab U.S. Dividend Equity ETF (SCHD).

What Factors Influenced Performance?

Performance was primarily influenced by the returns of the Fund's underlying portfolio, which tracks the constituents of the Dow Jones U.S. Dividend 100 Index, comprised of high-quality U.S. companies with strong financial fundamentals and consistent dividend histories. The Fund's actively managed options overlay, which sells credit call and put spreads on a select subset of the underlying holdings, generated additional premium income.

Positioning of the Fund

The Fund continues to combine long positions in high-quality, dividend-paying U.S. companies with an actively managed options overlay designed to generate additional income. DDDD seeks to target approximately double the annualized distribution yield of SCHD while seeking similar price exposure to the underlying dividend equities.
Performance Past Does Not Indicate Future [Text] The Fund's past performance is not a good indicator of how the Fund will perform in the future.
Line Graph [Table Text Block]

Cumulative Performance

(Initial Investment of $10,000)
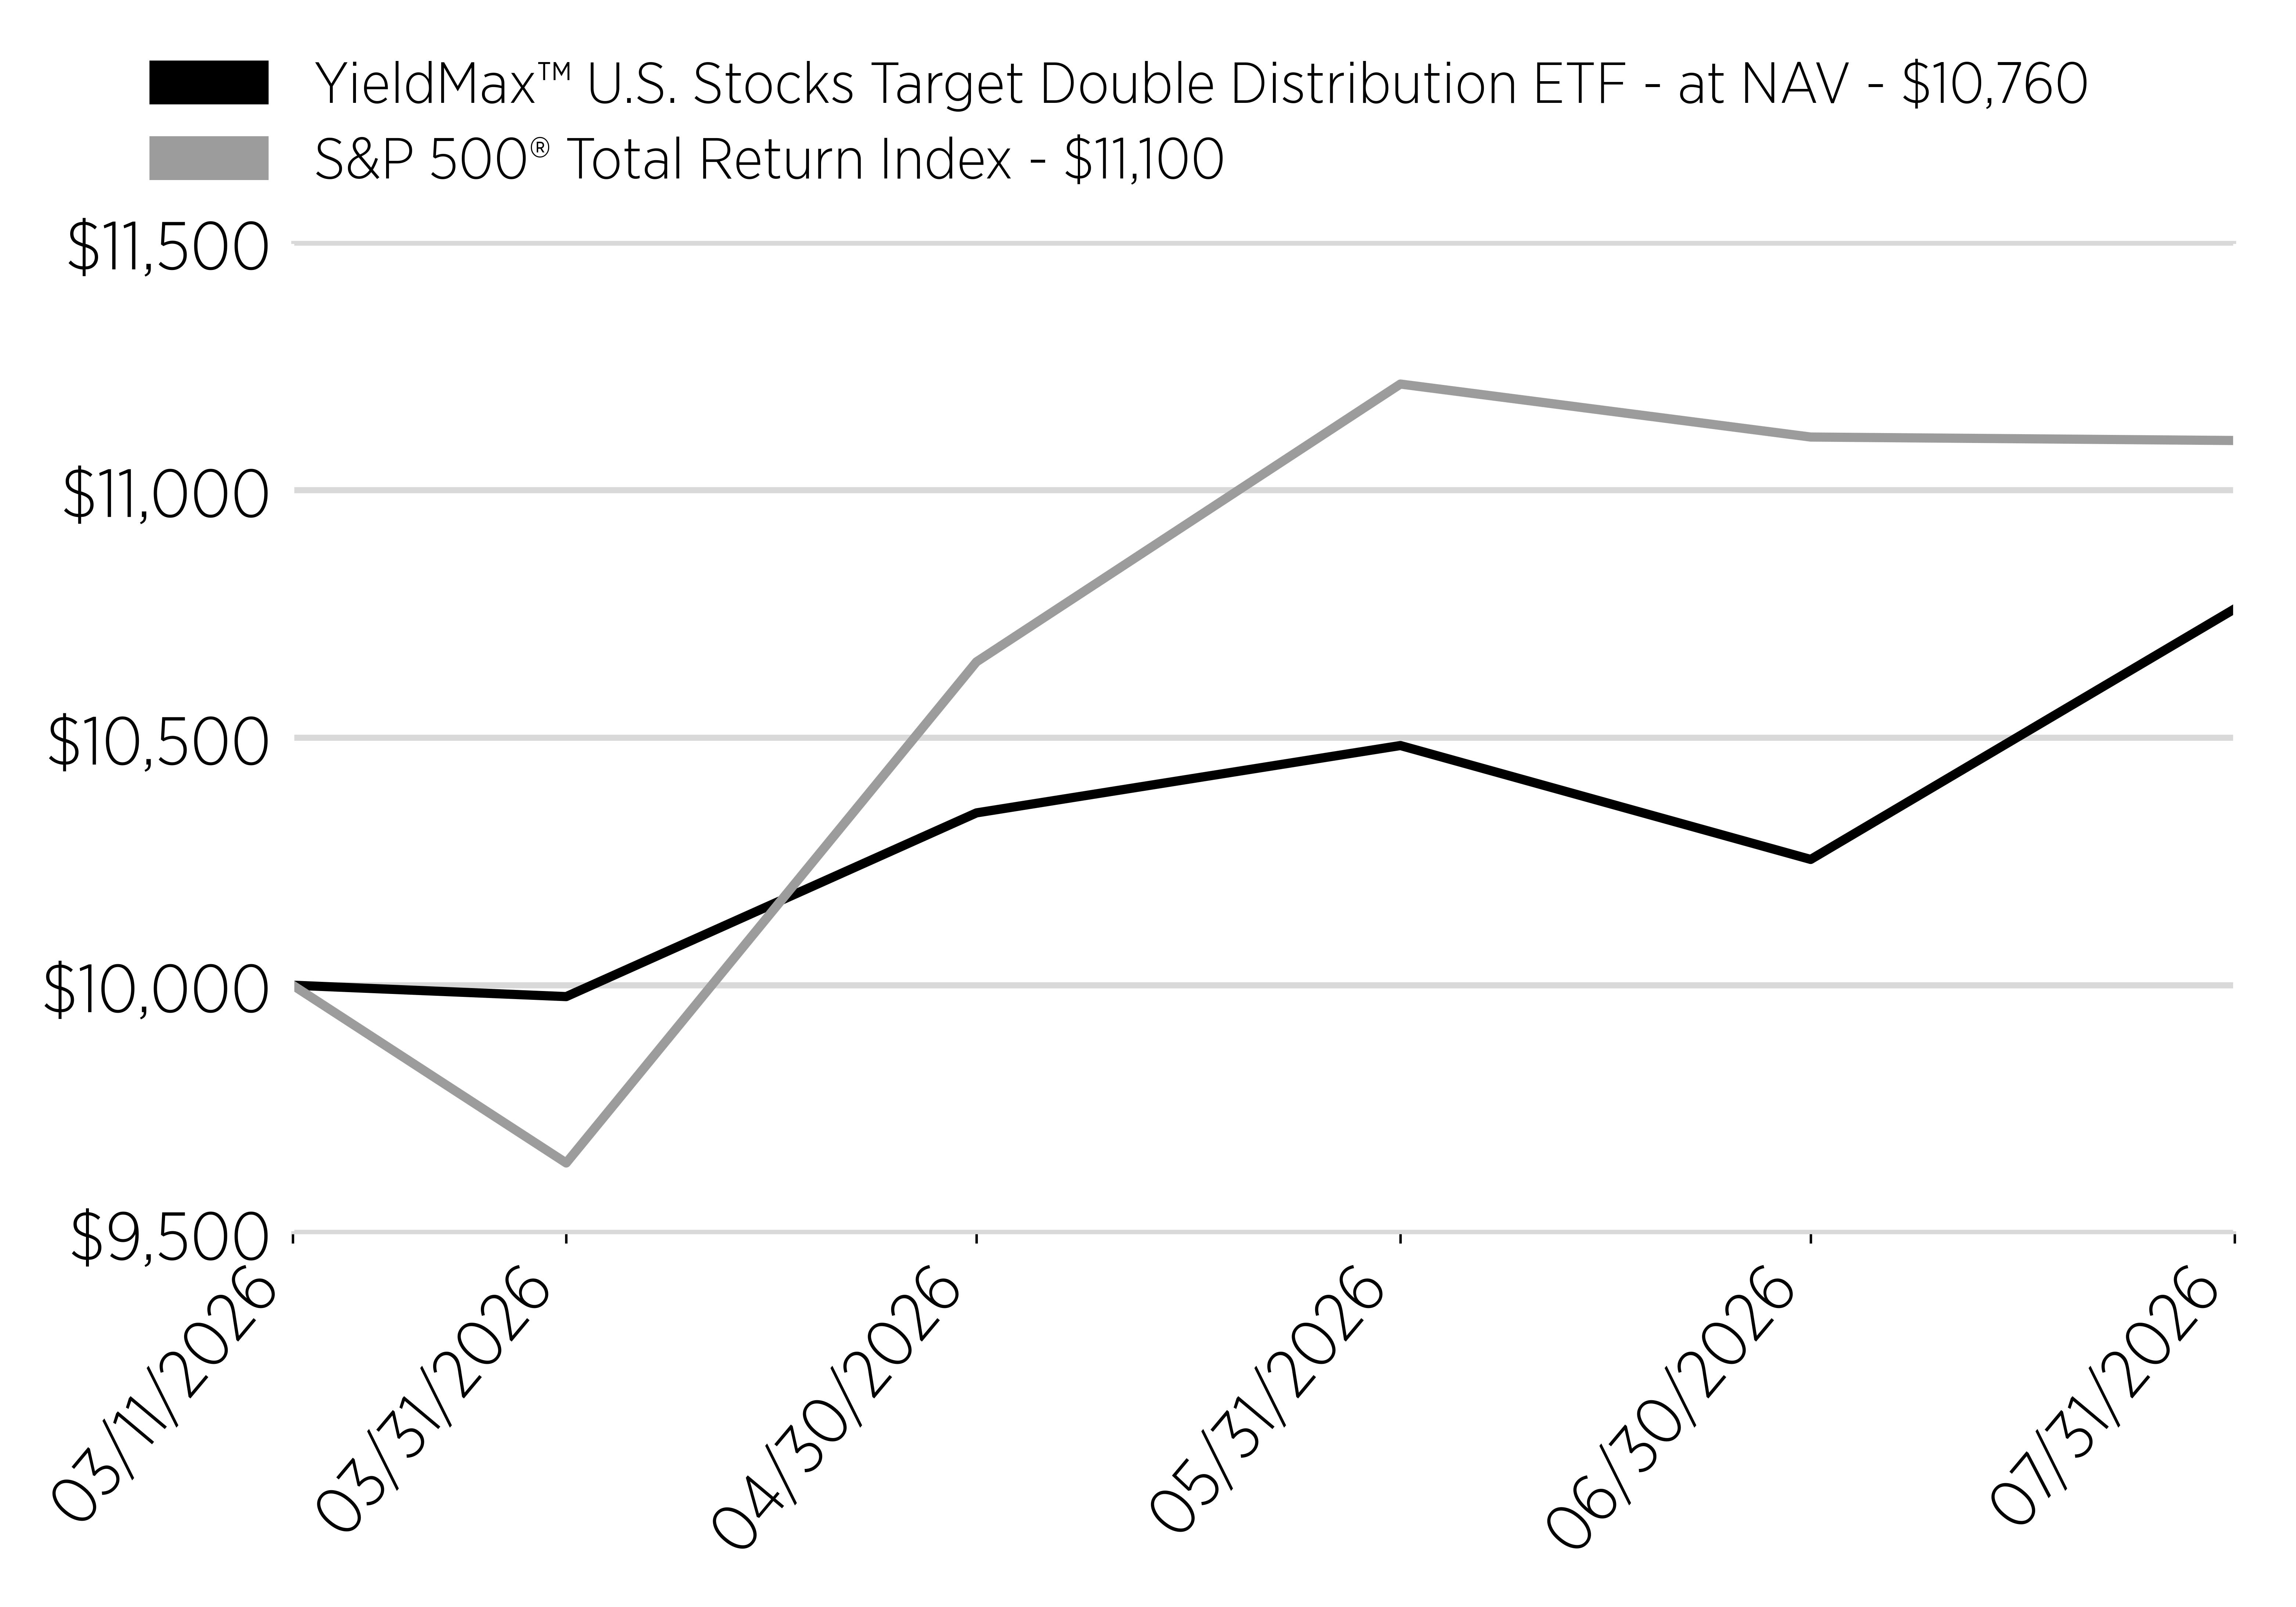
Date
YieldMax™ U.S. Stocks Target Double Distribution ETF - at NAV - $10,760
S&P 500® Total Return Index - $11,100
3/11/2026
10000
10000
3/31/2026
9977
9641
4/30/2026
10348
10653
5/31/2026
10484
11214
6/30/2026
10254
11107
7/31/2026
10760
11100
line
Average Annual Return [Table Text Block]

Annual Performance

Since Inception (3/11/26)
Yieldmax™ U.S. Stocks Target Double Distribution ETF - at NAV
7.61%*
S&P 500® Total Return Index
11.00%
*Not Annualized for periods less than one year.
Performance Inception Date Mar. 11, 2026
No Deduction of Taxes [Text Block] The graph and table do not reflect the deduction of taxes that a shareholder would pay on fund distributions or redemption of fund shares.
Material Change Date Apr. 16, 2026
Updated Performance Information Location [Text Block] Visit www.yieldmaxetfs.com/our-etfs/dddd/ for more recent performance information.
Net Assets $ 6,567,000
Holdings Count | Holdings 264
Advisory Fees Paid, Amount $ 16,507
Investment Company, Portfolio Turnover 40.00%
Additional Fund Statistics [Text Block]

Key Fund Statistics

(as of July 31, 2026)

Fund Size (Thousands)
$6,567
Number of Holdings
264
Total Advisory Fee Paid
$16,507
Portfolio Turnover
40%
Holdings [Text Block]

What did the Fund invest in?

(as of July 31, 2026)

Security Type - Investments

(% of Net Assets)
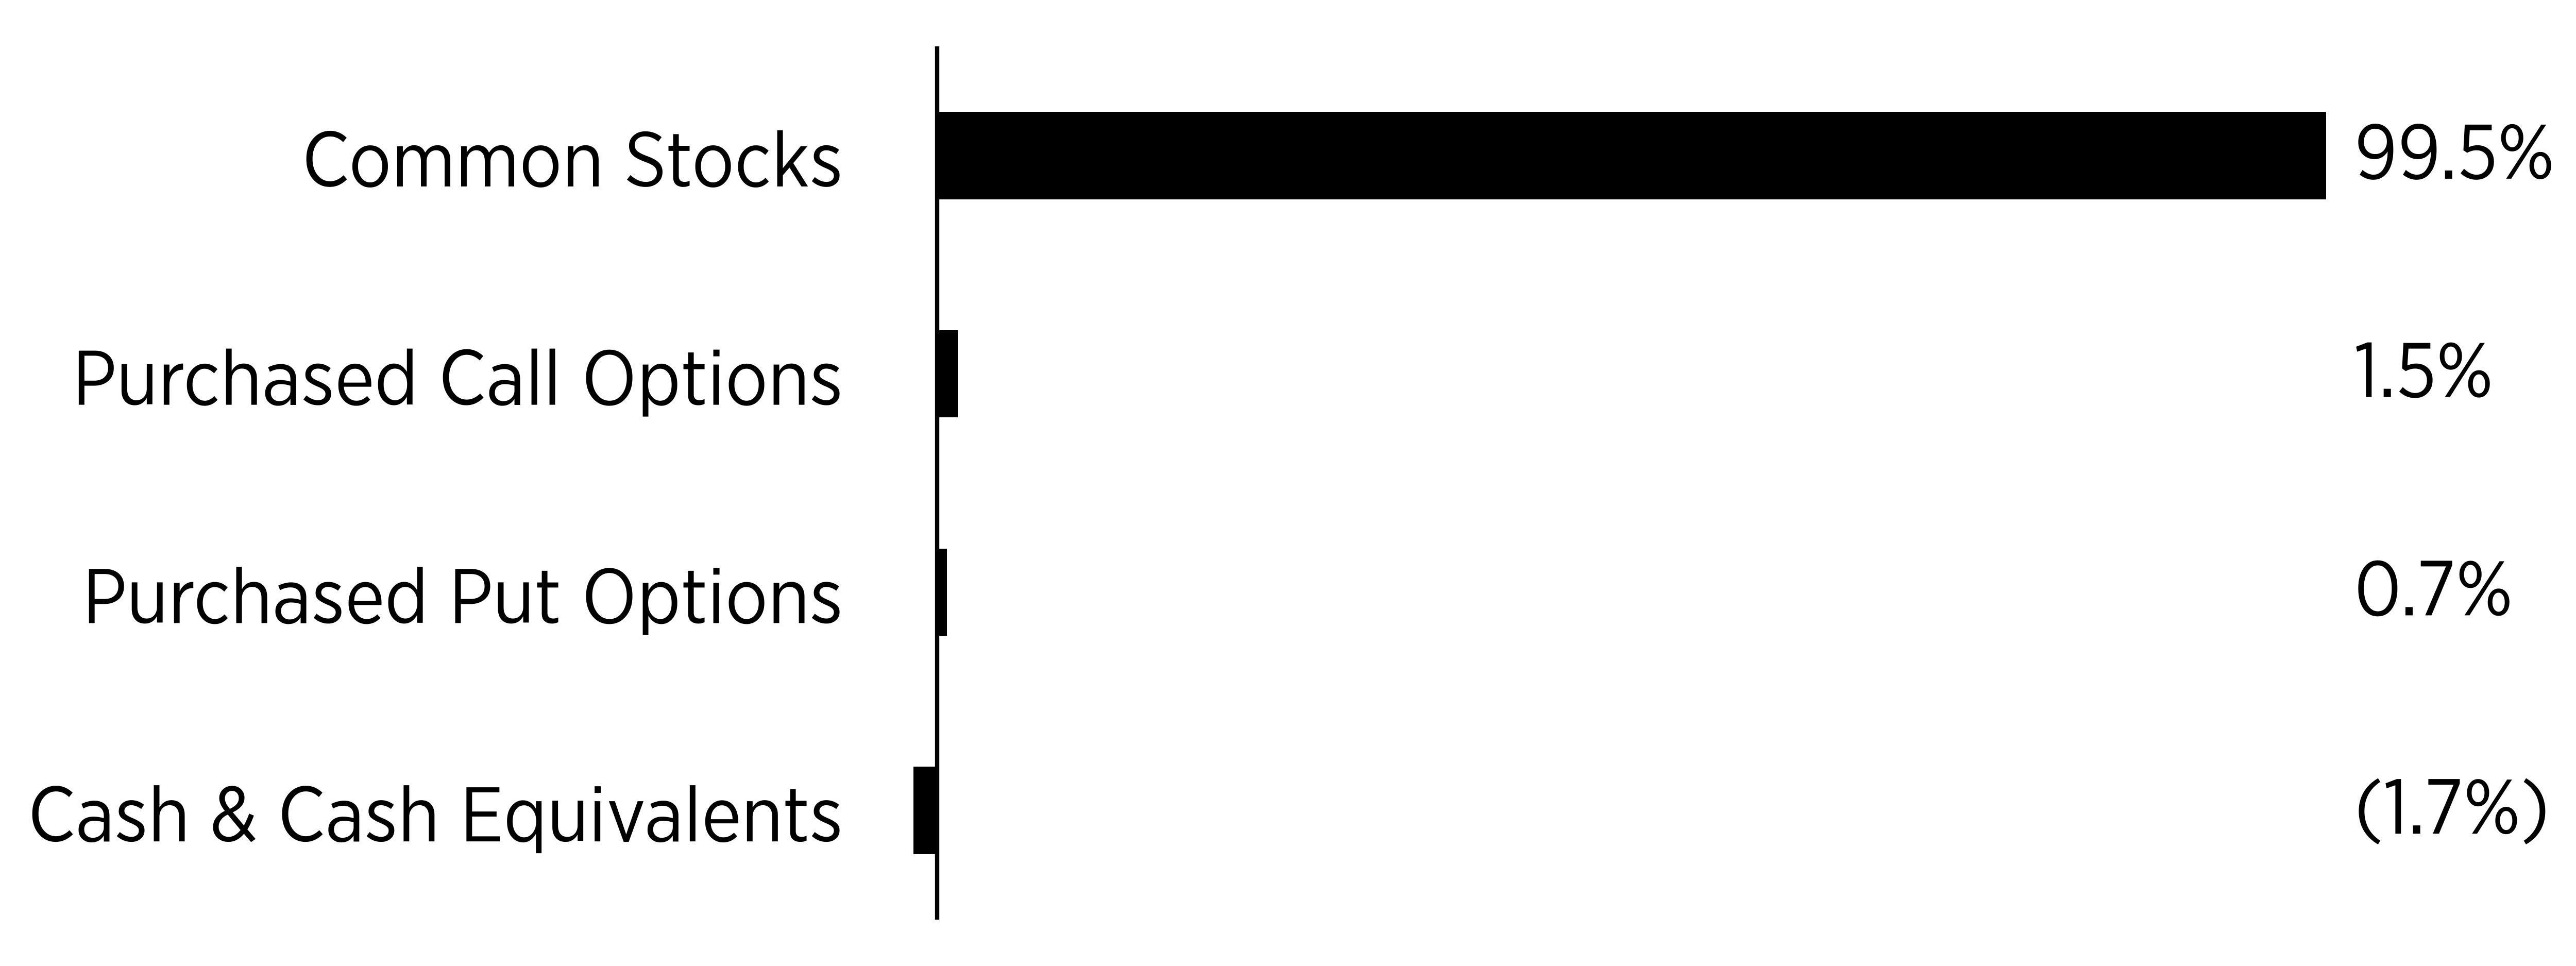
Sector
%
Common Stocks
99.5%
Purchased Call Options
1.5%
Purchased Put Options
0.7%
Cash & Cash Equivalents
-1.7%
bar


Security Type - Other Financial Instruments

(% of Net Assets)
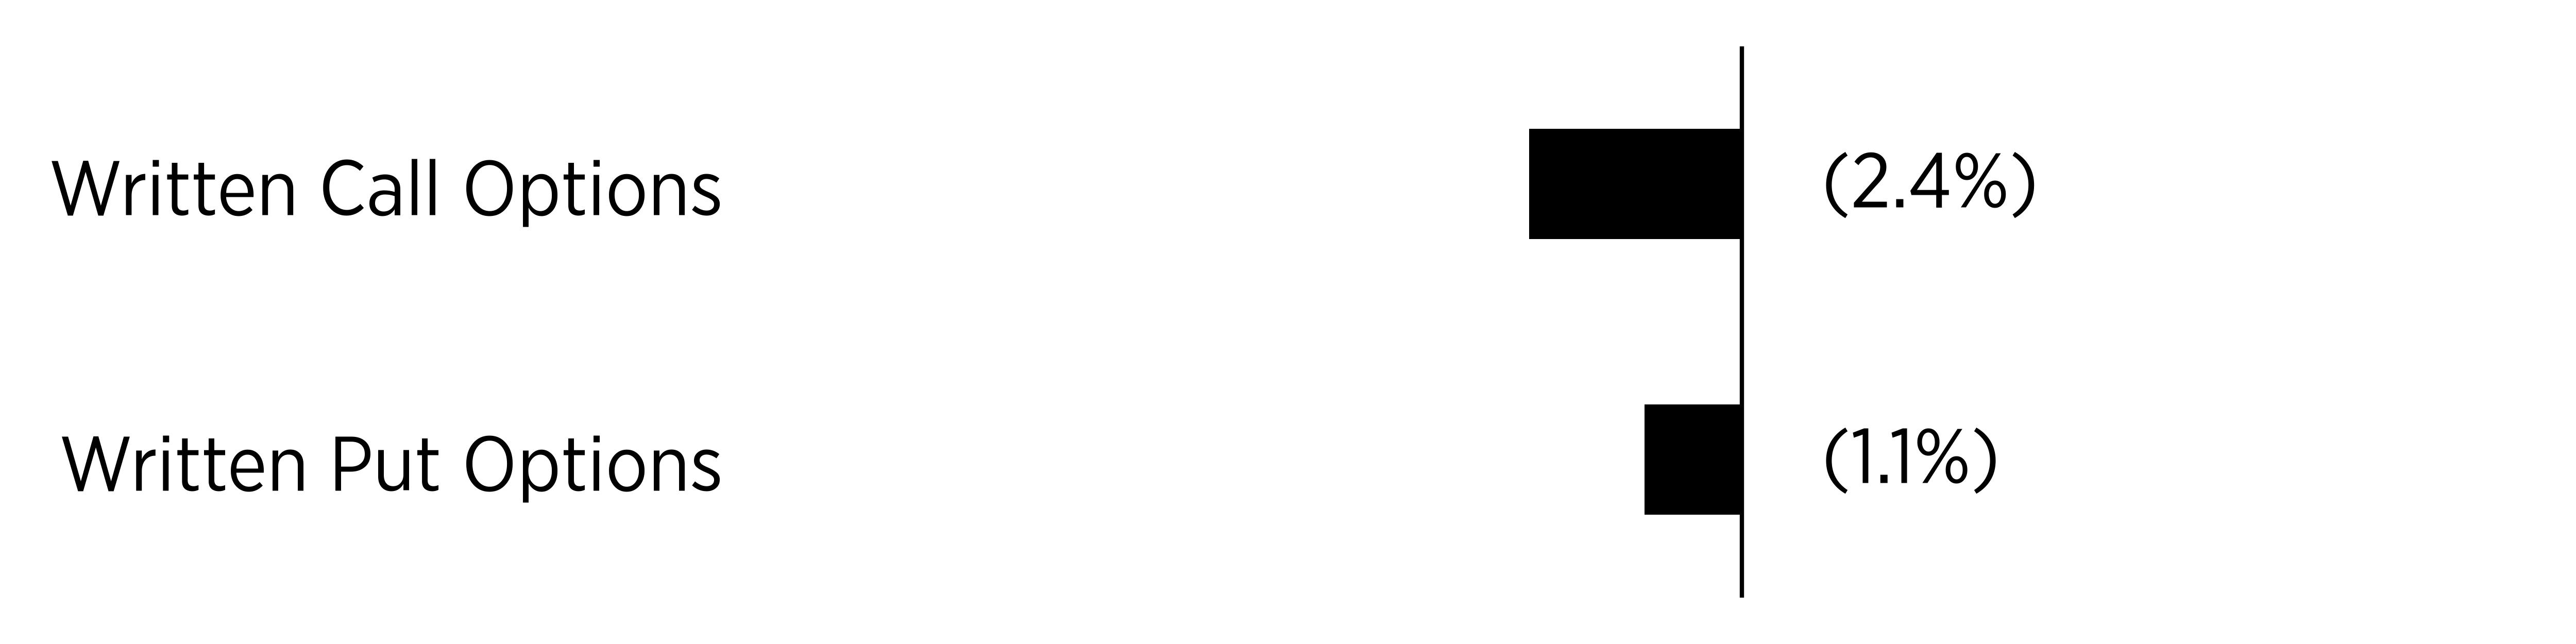
Sector
%
Written Call Options
-2.4%
Written Put Options
-1.1%
bar


Percentages are based on net assets. Cash & Cash Equivalents represents cash, short-term investments, and liabilities in excess of other assets.


Largest Holdings [Text Block]
Top Holdings
(% of Net
Assets)
Abbott Laboratories
4.7
Amgen, Inc.
4.4
Merck & Co., Inc.
4.4
Coca-Cola Co.
4.3
UnitedHealth Group, Inc.
4.2
Home Depot, Inc.
4.1
Chevron Corp.
4.0
Procter & Gamble Co.
4.0
Verizon Communications, Inc.
3.9
PepsiCo, Inc.
3.8
Material Fund Change [Text Block]

Fund Changes

Effective April 16, 2026 the Fund’s investment strategy is revised to provide that the Fund may invest in shares of Schwab U.S. Dividend Equity ETF (“SCHD”), as well as select securities held by SCHD or securities highly correlated with such holdings. The Fund may also generate premiums by selling (writing) options on SCHD and such underlying or correlated securities.
[1] Costs paid as a percentage of a $10,000 investment is an annualized figure.
[2] The Fund commenced operations on September 29, 2025. Expenses for a full reporting period would be higher than the figures shown.
[3] Costs paid as a percentage of a $10,000 investment is an annualized figure.
[4] Costs paid as a percentage of a $10,000 investment is an annualized figure.
[5] The Fund commenced operations on September 8, 2025. Expenses for a full reporting period would be higher than the figures shown.
[6] Costs paid as a percentage of a $10,000 investment is an annualized figure.
[7] The Fund commenced operations on September 22, 2025. Expenses for a full reporting period would be higher than the figures shown.
[8] Costs paid as a percentage of a $10,000 investment is an annualized figure.
[9] The Fund commenced operations on November 17, 2025. Expenses for a full reporting period would be higher than the figures shown.
[10] Costs paid as a percentage of a $10,000 investment is an annualized figure.
[11] Costs paid as a percentage of a $10,000 investment is an annualized figure.
[12] Costs paid as a percentage of a $10,000 investment is an annualized figure.
[13] The Fund commenced operations on November 17, 2025. Expenses for a full reporting period would be higher than the figures shown.
[14] Costs paid as a percentage of a $10,000 investment is an annualized figure.
[15] Costs paid as a percentage of a $10,000 investment is an annualized figure.
[16] The Fund commenced operations on September 8, 2025. Expenses for a full reporting period would be higher than the figures shown.
[17] Costs paid as a percentage of a $10,000 investment is an annualized figure.
[18] Costs paid as a percentage of a $10,000 investment is an annualized figure.
[19] Does not round to 1%.
[20] Costs paid as a percentage of a $10,000 investment is an annualized figure.
[21] The Fund commenced operations on July 14, 2026. Expenses for a full reporting period would be higher than the figures shown.
[22] Costs paid as a percentage of a $10,000 investment is an annualized figure.
[23] The Fund commenced operations on February 26, 2026. Expenses for a full reporting period would be higher than the figures shown.
[24] Costs paid as a percentage of a $10,000 investment is an annualized figure.
[25] Costs paid as a percentage of a $10,000 investment is an annualized figure.
[26] Costs paid as a percentage of a $10,000 investment is an annualized figure.
[27] Costs paid as a percentage of a $10,000 investment is an annualized figure.
[28] The Fund commenced operations on November 17, 2025. Expenses for a full reporting period would be higher than the figures shown.
[29] Costs paid as a percentage of a $10,000 investment is an annualized figure.
[30] The Fund commenced operations on March 11, 2026. Expenses for a full reporting period would be higher than the figures shown.
[31] Costs paid as a percentage of a $10,000 investment is an annualized figure.