What were the Fund costs for the past year?
(based on a hypothetical $10,000 investment)
|
Fund
Name |
Costs
of a $10,000 investment |
Costs
paid as a percentage of a $10,000 investment |
|---|---|---|
|
Grizzle
Growth ETF |
$92 |
0.75% |
How did the Fund perform last year and what affected its performance?
For the fiscal year ended July 31, 2026, the Fund saw a 45.11% total return compared to the benchmark, the S&P 500® Index, seeing a 19.56% total return. Compared to the benchmark, the portfolio outperformed by 25.55%.
The top contributing sectors for the annual period ending July 31, 2026, were the information technology and communications sectors. The top detracting sectors were the energy and financial sectors. Micron Technology (MU), Alphabet (GOOGL) and Ciena (CIEN) were the top contributing stocks. Venture Global (VG), Cheniere Energy (LNG) and Antero Resources (AR) were the top detracting stocks.
What factors influenced performance?
Based on our key investment objectives, we continued to position the strategy with strong and consistent growth characteristics above that of the benchmark and relative to the overall market. Companies with strong revenue growth outlooks that have traded at reasonable valuations versus the market contributed strongly to the overall returns of the fund for the annual period ending July 31, 2026.
Positioning
During the reporting period, we continued to position the Grizzle Growth ETF for disruption at a reasonable price, seeking companies across the growth landscape trading at compelling valuations. We maintained a barbell approach balancing established technology leaders with emerging disruptors, supported by essential supply-chain commodities. In the era of artificial intelligence (AI), mega-cap tech leaders hold distinct funding and competitive advantages. Simultaneously, emerging disruptors - particularly within the industrials sector - continue to capture significant upside by directly supplying and constructing the AI infrastructure buildout. We believe pairing both segments allows the portfolio to capture robust secular growth while maintaining valuation discipline. For the commodity pillar of the fund, we view physical inputs as critical enablers of this technological transition. We remain highly constructive on the broader energy complex, with high conviction in liquefied natural gas, copper, and broad critical minerals essential to meeting the power and hardware demands of next-generation infrastructure.
Cumulative Performance
(Initial Investment of $10,000)
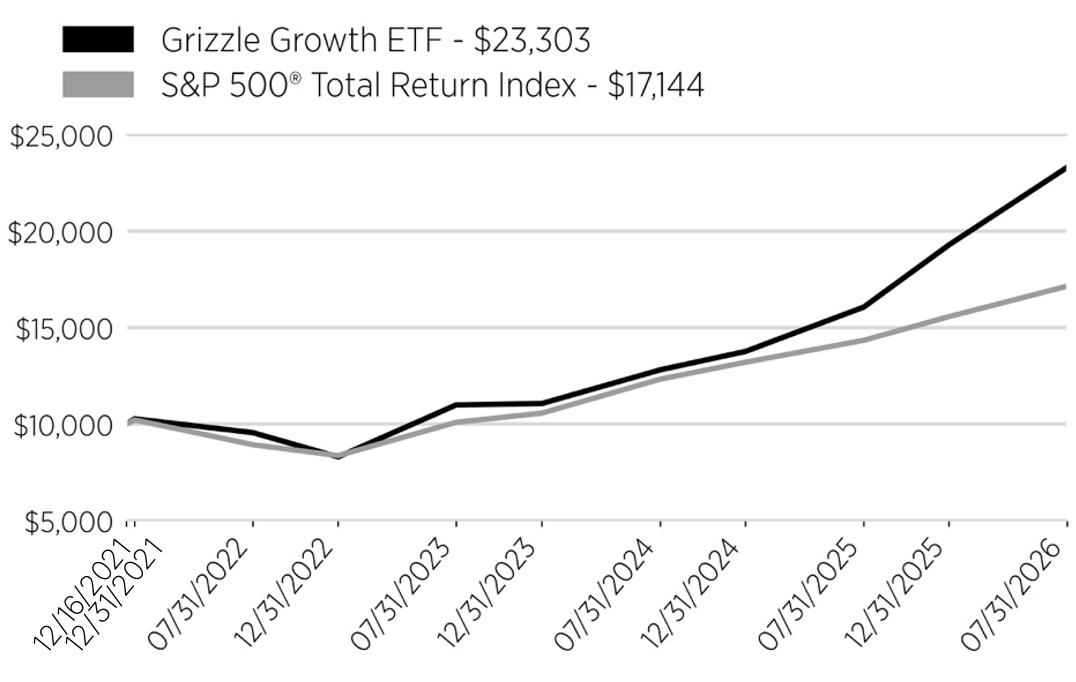
Annual Performance
|
Average
Annual Returns
for
the Periods Ended
July
31, 2026 |
1
Year |
3
Year |
Since
Inception
(12/16/2021) |
|---|---|---|---|
|
Grizzle
Growth ETF -
at
NAV |
45.11% |
28.46% |
20.09% |
|
S&P
500 Total Return
Index |
19.56% |
19.32% |
12.37% |
Key Fund Statistics
(as of July 31, 2026)
|
Fund
Size (Thousands) |
$33,298 |
|
Number
of Holdings |
44 |
|
Total
Advisory Fee Paid |
$152,138 |
|
Portfolio
Turnover Rate |
70% |
What did the Fund invest in?
(as of July 31, 2026)
Sector Breakdown
(% of Net Assets)
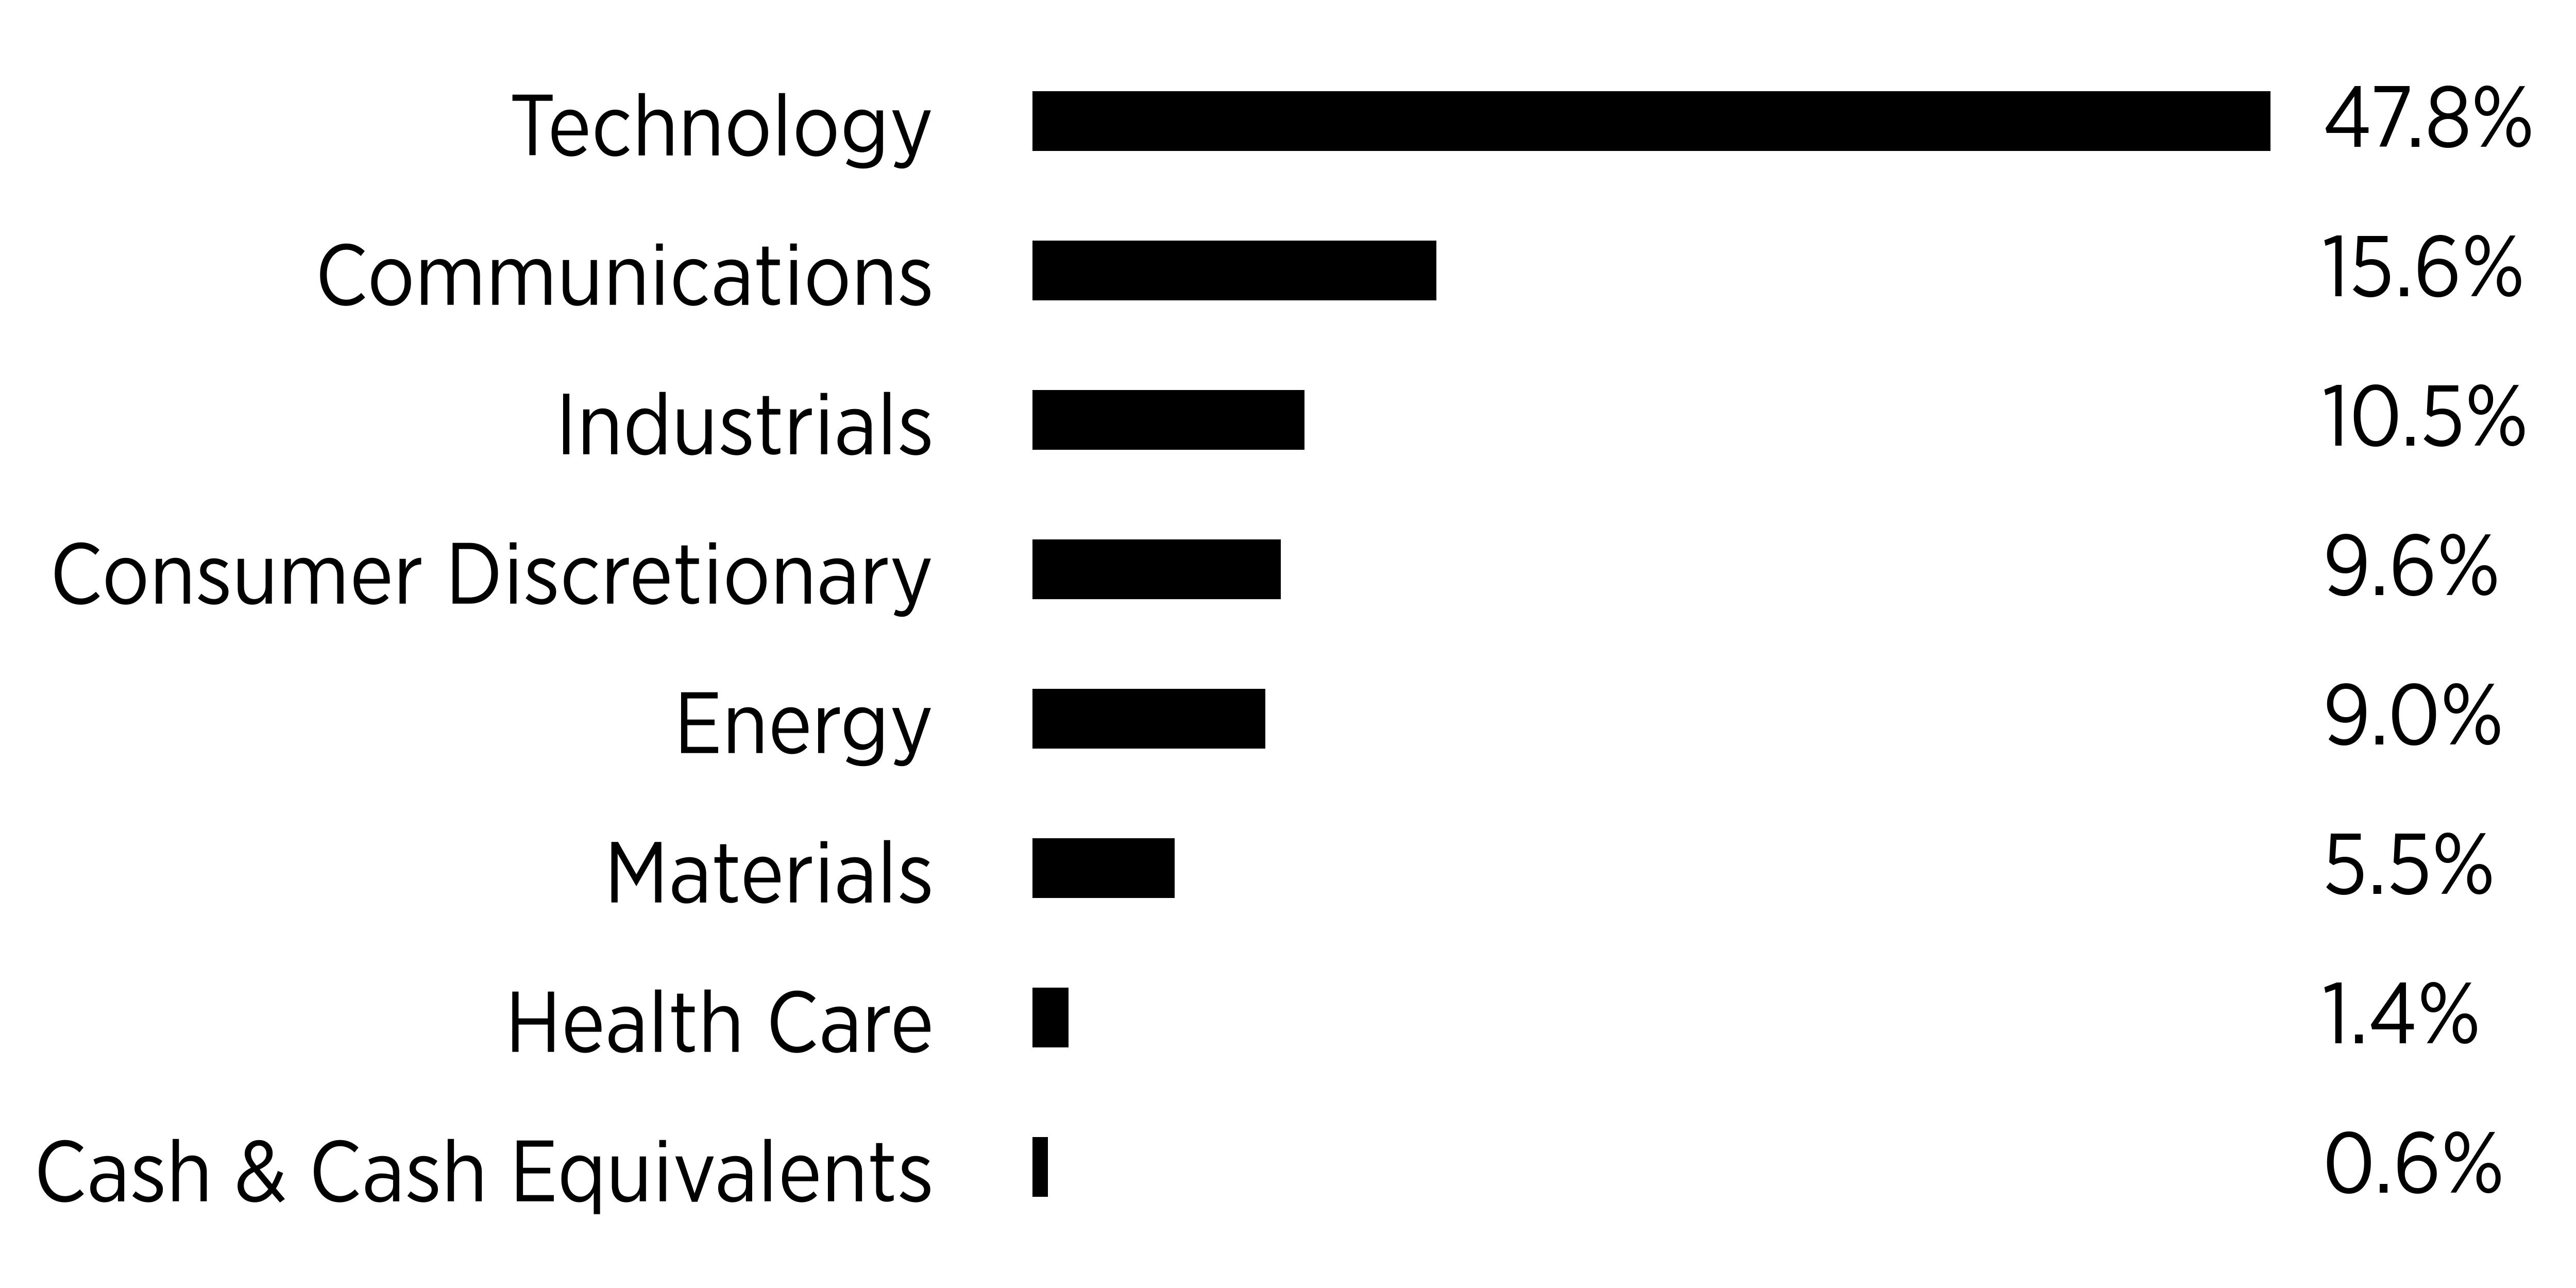
Percentages are based on net assets. Cash & Cash Equivalents represents cash, short-term investments and liabilities in excess of other assets.
|
Top
Holdings |
(%
of Net Assets) |
|---|---|
|
Alphabet,
Inc. - Class A |
|
|
Amazon.com,
Inc. |
|
|
NVIDIA
Corp. |
|
|
Micron
Technology, Inc. |
|
|
GE
Vernova, Inc. |
|
|
Coherent
Corp. |
|
|
Ciena
Corp. |
|
|
Apple,
Inc. |
|
|
Taiwan
Semiconductor Manufacturing
Co.
Ltd., ADR |
|
|
Vertiv
Holdings Co. - Class A |
Fund Changes
There have been no changes.