Shareholder Report
Jul. 31, 2026
USD ($)
Holding
This report describes changes to the Fund that occurred during the reporting period.
What were the Fund costs for the last year? (based on a hypothetical $10,000 investment)
| Cost of a $10,000 investment | Costs paid as a percentage of $10,000 investment* | |||
| Municipal Total Return Managed Accounts Portfolio |
$14 | 0.14% | ||
| * | Annualized for period less than one year. The Fund does not pay a management fee or other expenses (excluding interest expense, taxes, fees incurred in acquiring and disposing of portfolio securities and extraordinary expenses). The Fund’s investment adviser and sub-adviser are compensated from the fee charged by the separately managed account through which Fund shares are held. |
How did the Fund perform last year? What affected the Fund’s performance?
Performance Highlights
The Municipal Total Return Managed Accounts Portfolio returned 7.25% at net asset value (NAV) for the 12 months ended July 31, 2026. The Fund significantly outperformed the Bloomberg 7-Year Municipal Bond Index, which returned 2.43%.
Top contributors to relative performance
| • | Longer-maturity and longer-duration positioning than the index. |
| • | Overweight in non-rated and BBB-rated bonds and underweight in AA-rated and AAA-rated bonds. |
| • | Underweight in state and local general obligation bonds |
| • | Overweights in hospital and special tax bonds. |
Top detractors from relative performance
| • | Underweight in industrial development/pollution control revenue bonds. |
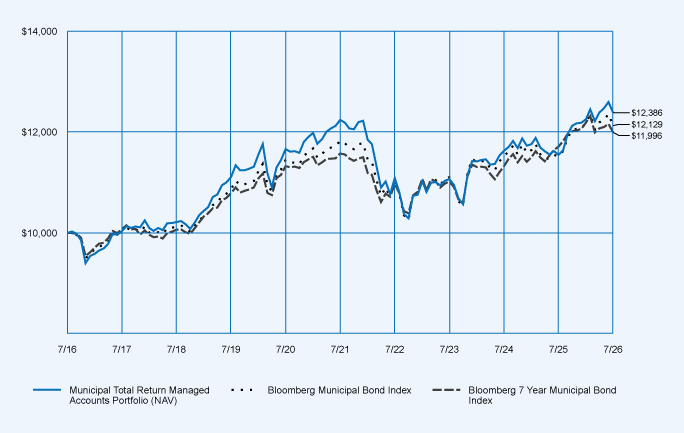
Average Annual Total Returns
| 1-Year | 5-Year | 10-Year | ||||||||||
| Municipal Total Return Managed Accounts Portfolio at NAV |
7.25 | % | 0.23 | % | 2.16 | % | ||||||
| Bloomberg Municipal Bond Index |
5.27 | % | 0.51 | % | 1.95 | % | ||||||
| Bloomberg 7 Year Municipal Bond Index |
2.43 | % | 0.72 | % | 1.84 | % | ||||||
Fund Statistics (as of July 31, 2026)
| Fund net assets |
$ | 1,571,474,977 | ||
| Total number of portfolio holdings |
659 | |||
| Portfolio turnover (%) |
32% | |||
| Total management fees paid for the year |
$ | 0 | ||
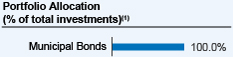 |
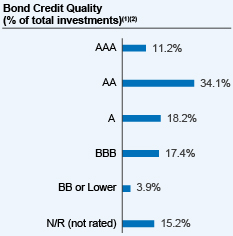 |
| (1) | Total investments include the Fund’s assets attributable to financial leverage. For these purposes, financial leverage includes the Fund’s investments in the residual interest certificates (also called inverse floating rate securities) in tender option bond (TOB) trusts, including the portion of assets held by a TOB trust that has been effectively financed by the trust’s issuance of floating rate securities. |
| (2) | The ratings disclosed are the highest rating given by one of the following national rating agencies: Standard & Poor’s (S&P), Moody’s Investors Service, Inc. (Moody’s) or Fitch, Inc (Fitch). This treatment of split-rated securities may differ from that used for other purposes, such as for Fund investment policies. Credit ratings are subject to change. AAA, AA, A, and BBB are investment grade ratings; BB, B, CCC, CC, C and D are below-investment grade ratings. Holdings designated N/R are not rated by these national ratings agencies. |
How has the Fund changed?
For more complete information, you may review the Fund’s next prospectus, which is expected to be available by November 30, 2026 at https://www.nuveen.com/en-us/mutual-funds/prospectuses or upon request at (800) 257-8787.
For more complete information, you may review the Fund’s next prospectus, which is expected to be available by November 30, 2026 at https://www.nuveen.com/en-us/mutual-funds/prospectuses or upon request at (800) 257-8787.
This report describes changes to the Fund that occurred during the reporting period.
What were the Fund costs for the last year? (based on a hypothetical $10,000 investment)
| Cost of a $10,000 investment | Costs paid as a percentage of $10,000 investment* | |||
| Nuveen Impact Bond Completion Managed Accounts Portfolio |
$0 | 0.00% | ||
| * | Annualized for period less than one year. The Fund does not pay a management fee or other expenses (excluding interest expense, taxes, fees incurred in acquiring and disposing of portfolio securities and extraordinary expenses). The Fund’s investment adviser and sub-adviser are compensated from the fee charged by the separately managed account through which Fund shares are held. |
How did the Fund perform last year? What affected the Fund’s performance?
| Performance Highlights |
The Nuveen Impact Bond Completion Managed Accounts Portfolio returned 3.78% at net asset value (NAV) for the 12 months ended July 31, 2026. The Fund outperformed the Bloomberg U.S. Aggregate Bond Index, which returned 2.71%.
Top contributors to relative performance
| • | Underweight to U.S. Treasury bonds and overweights to municipal bonds and corporate bonds. |
| • | Duration and yield curve positioning. |
| • | Security selection in commercial mortgage-backed securities (CMBS) and municipal bonds. |
Top detractors from relative performance
| • | Underweight to and security selection in mortgage-backed securities (MBS). |
| • | Overweight to government-related credit. |
| • | Security selection in asset-backed securities (ABS). |
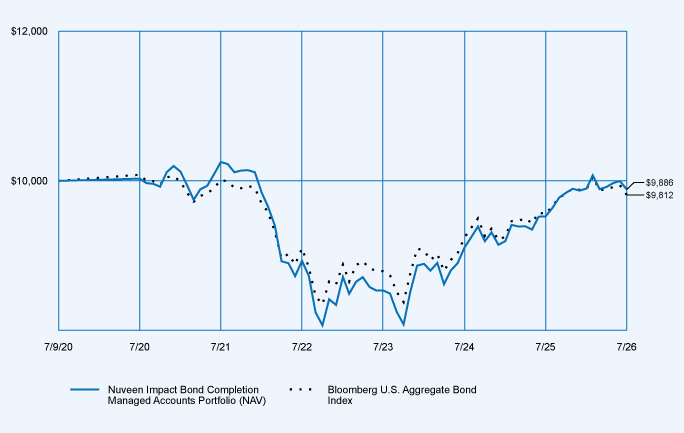
Average Annual Total Returns
| 1-Year | 5-Year | Since Inception (7/9/20) |
||||||||||
| Nuveen Impact Bond Completion Managed Accounts Portfolio at NAV |
3.78 | % | (0.72 | )% | (0.19 | )% | ||||||
| Bloomberg U.S. Aggregate Bond Index |
2.71 | % | (0.40 | )% | (0.31 | )% | ||||||
Fund Statistics (as of July 31, 2026)
| Fund net assets |
$ | 30,344,028 | ||
| Total number of portfolio holdings |
171 | |||
| Portfolio turnover (%) |
30% | |||
| Total management fees paid for the year |
$ | 0 | ||
 |
 |
 |
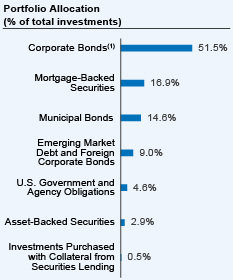
| (1) | Includes 1.3% of $1,000 Par Preferred and/or Contingent Capital Securities. |
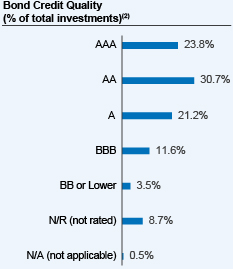
| (2) | The ratings disclosed are the highest rating given by one of the following national rating agencies: Standard & Poor’s (S&P), Moody’s Investors Service, Inc. (Moody’s) or Fitch, Inc (Fitch). This treatment of split-rated securities may differ from that used for other purposes, such as for Fund investment policies. Credit ratings are subject to change. AAA, AA, A, and BBB are investment grade ratings; BB, B, CCC, CC, C and D are below-investment grade ratings. Holdings designated N/R are not rated by these national ratings agencies. |
How has the Fund changed?
Investment policy change: Effective August 1, 2026, the Fund changed its non-fundamental investment policy adopted pursuant to Rule 35d-1 of the Investment Company Act of 1940 to invest at least 80% of the sum of its net assets and the amount of any borrowings for investment purposes in bonds to under normal circumstances, the Fund invests at least 80% of the sum of its net assets and the amount of any borrowings for investment purposes in impact bonds.
For more complete information, you may review the Fund’s next prospectus, which is expected to be available by November 30, 2026 at https://www.nuveen.com/en-us/mutual-funds/prospectuses or upon request at (800) 257-8787.
Investment policy change: Effective August 1, 2026, the Fund changed its non-fundamental investment policy adopted pursuant to Rule 35d-1 of the Investment Company Act of 1940 to invest at least 80% of the sum of its net assets and the amount of any borrowings for investment purposes in bonds to under normal circumstances, the Fund invests at least 80% of the sum of its net assets and the amount of any borrowings for investment purposes in impact bonds.
For more complete information, you may review the Fund’s next prospectus, which is expected to be available by November 30, 2026 at https://www.nuveen.com/en-us/mutual-funds/prospectuses or upon request at (800) 257-8787.
This report describes changes to the Fund that occurred during the reporting period.
What were the Fund costs for the last year? (based on a hypothetical $10,000 investment)
| Cost of a $10,000 investment | Costs paid as a percentage of $10,000 investment* | |||
| Nuveen Emerging Markets Debt Managed Accounts Portfolio |
$0 | 0.00% | ||
| * | Annualized for period less than one year. The Fund does not pay a management fee or other expenses (excluding interest expense, taxes, fees incurred in acquiring and disposing of portfolio securities and extraordinary expenses). The Fund’s investment adviser and sub-adviser are compensated from the fee charged by the separately managed account through which Fund shares are held. |
How did the Fund perform last year? What affected the Fund’s performance?
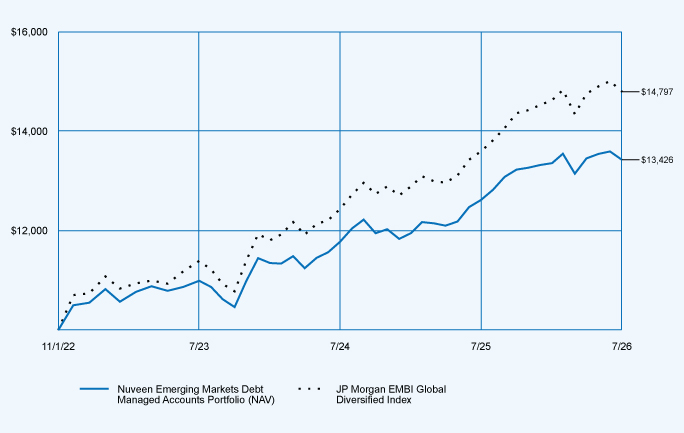
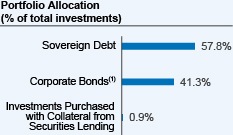
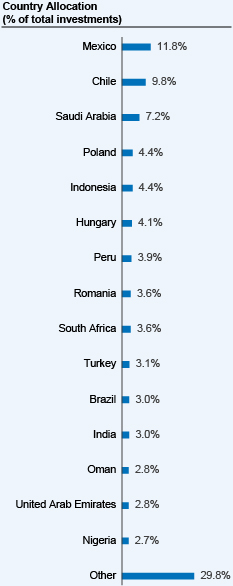
| Performance Highlights The Nuveen Emerging Markets Debt Managed Accounts Portfolio returned 6.39% at net asset value (NAV) for the 12 months ended July 31, 2026. The Fund underperformed the JP Morgan EMBI Global Diversified Index, which returned 8.81%. Top contributors to relative performance • Underweight to Asian debt, most notably a significant underweight to China. • Lack of exposure to Senegal and underweight to Uruguay. • Security selection in Chile and Kazakhstan. Top detractors from relative performance • Underweight to below-investment-grade debt, including a lack of exposure to Venezuelan and Ukrainian debt. • Overweight to Chile and underweight to Ecuador. • Out-of-benchmark exposure to corporate debt. |
Average Annual Total Returns
| 1‑Year | Since Inception (11/1/22) |
|||||||
| Nuveen Emerging Markets Debt Managed Accounts Portfolio at NAV |
6.39 | % | 8.18 | % | ||||
| JP Morgan EMBI Global Diversified Index |
8.81 | % | 11.03 | % | ||||
Fund Statistics (as of July 31, 2026)
| Fund net assets |
$ | 27,743,341 | ||
| Total number of portfolio holdings |
124 | |||
| Portfolio turnover (%) |
47% | |||
| Total management fees paid for the year |
$ | 0 | ||
 |
 |
 |
| (1) | Includes 6.2% of $1,000 Par Preferred and/or Contingent Capital Securities. |
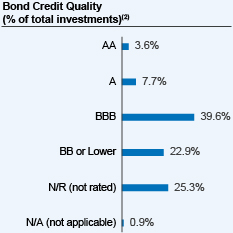
| (2) | The Fund uses credit quality ratings for its portfolio securities provided by Moody’s, S&P and Fitch. If all three of Moody’s, S&P, and Fitch provide a rating for a security, the middle is used; if two of the three agencies rate a security, the lower rating is used; and if only one rating agency rates a security, that rating is used. AAA, AA, A, and BBB are investment grade ratings; BB, B, CCC/CC/C and D are below-investment grade ratings. Credit ratings are subject to change. Holdings designated N/R are not rated by Moody’s, S&P or Fitch. |
How has the Fund changed?
For more complete information, you may review the Fund’s next prospectus, which is expected to be available by November 30, 2026 at https://www.nuveen.com/en-us/mutual-funds/prospectuses or upon request at (800) 257-8787.
For more complete information, you may review the Fund’s next prospectus, which is expected to be available by November 30, 2026 at https://www.nuveen.com/en-us/mutual-funds/prospectuses or upon request at (800) 257-8787.
This report describes changes to the Fund that occurred during the reporting period.
What were the Fund costs for the last year? (based on a hypothetical $10,000 investment)
| Cost of a $10,000 investment | Costs paid as a percentage of $10,000 investment* | |||
| Nuveen High Yield Managed Accounts Portfolio |
$0 | 0.00% | ||
| * | Annualized for period less than one year. The Fund does not pay a management fee or other expenses (excluding interest expense, taxes, fees incurred in acquiring and disposing of portfolio securities and extraordinary expenses). The Fund’s investment adviser and sub-adviser are compensated from the fee charged by the separately managed account through which Fund shares are held. |
How did the Fund perform last year? What affected the Fund’s performance?
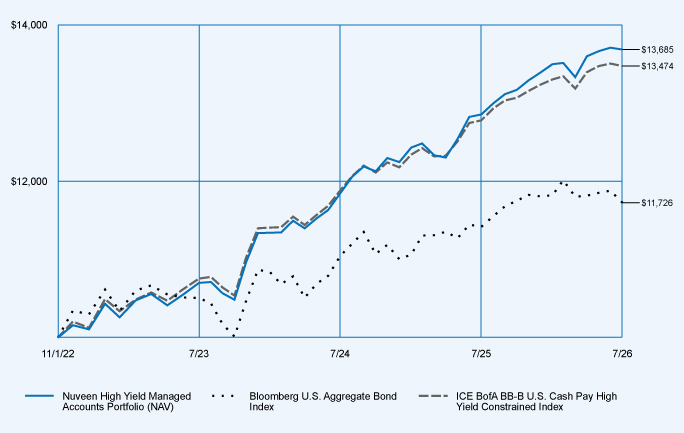
| Performance Highlights The Nuveen High Yield Managed Accounts Portfolio returned 6.46% at net asset value (NAV) for the 12 months ended July 31, 2026. The Fund outperformed the ICE BofA BB-B U.S. Cash Pay High Yield Constrained Index, which returned 5.42%. Top contributors to relative performance • Security selection within the retail and technology industries. • Security selection within BB-rated bonds. Top detractors from relative performance • Security selection within the leisure and gaming industries. • Asset allocation within the insurance industry. |
Average Annual Total Returns
| 1-Year | Since Inception (11/1/22) |
|||||||
| Nuveen High Yield Managed Accounts Portfolio at NAV |
6.46 | % | 8.74 | % | ||||
| Bloomberg U.S. Aggregate Bond Index |
2.71 | % | 4.34 | % | ||||
| ICE BofA BB‑B U.S. Cash Pay High Yield Constrained Index |
5.42 | % | 8.29 | % | ||||
Fund Statistics (as of July 31, 2026)
| Fund net assets |
$ | 19,397,203 | ||
| Total number of portfolio holdings |
296 | |||
| Portfolio turnover (%) |
42% | |||
| Total management fees paid for the year |
$ | 0 | ||
 |
 |
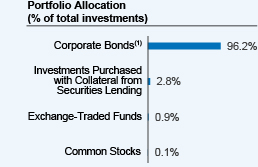
| (1) | Includes 0.7% of $1,000 Par Preferred and/or Contingent Capital Securities. |
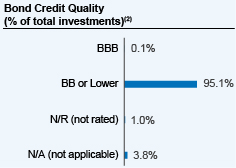
| (2) | The ratings disclosed are the lowest rating given by one of the following national rating agencies: Standard & Poor’s (S&P), Moody’s Investors Service, Inc. (Moody’s) or Fitch, Inc (Fitch). This treatment of split-rated securities may differ from that used for other purposes, such as for Fund investment policies. Credit ratings are subject to change. AAA, AA, A, and BBB are investment grade ratings; BB, B, CCC, CC, C and D are below-investment grade ratings. Holdings designated N/R are not rated by these national ratings agencies. |
How has the Fund changed?
For more complete information, you may review the Fund’s next prospectus, which is expected to be available by November 30, 2026 at https://www.nuveen.com/en-us/mutual-funds/prospectuses or upon request at (800) 257-8787.
For more complete information, you may review the Fund’s next prospectus, which is expected to be available by November 30, 2026 at https://www.nuveen.com/en-us/mutual-funds/prospectuses or upon request at (800) 257-8787.
This report describes changes to the Fund that occurred during the reporting period.
What were the Fund costs for the last year? (based on a hypothetical $10,000 investment)
| Cost of a $10,000 investment | Costs paid as a percentage of $10,000 investment* | |||
| Nuveen Preferred Securities and Income Managed Accounts Portfolio |
$0 | 0.00% | ||
| * | Annualized for period less than one year. The Fund does not pay a management fee or other expenses (excluding interest expense, taxes, fees incurred in acquiring and disposing of portfolio securities and extraordinary expenses). The Fund’s investment adviser and sub-adviser are compensated from the fee charged by the separately managed account through which Fund shares are held. |
How did the Fund perform last year? What affected the Fund’s performance?
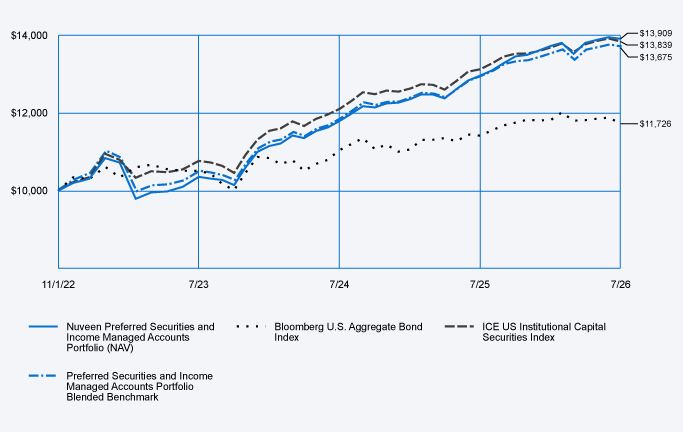
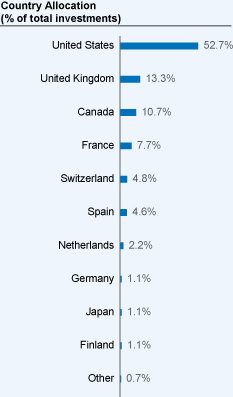
| Performance Highlights The Nuveen Preferred Securities and Income Managed Accounts Portfolio returned 7.33% at net asset value (NAV) for the 12 months ended July 31, 2026. The Fund outperformed the Preferred Securities and Income Managed Accounts Portfolio Blended Benchmark, which returned 5.84%. The Preferred Securities and Income Managed Accounts Portfolio Blended Benchmark consists of: 1) 60% ICE US Institutional Capital Securities Index, 2) 40% ICE USD Contingent Capital Index. Top contributors to relative performance • The Fund benefited from owning claims on legacy Credit Suisse Additional Tier 1 (AT1) securities that were written down to zero in 2023 as part of the Swiss bank regulator’s arranged merger between UBS and Credit Suisse. The value of these claims rose significantly following a favorable Swiss court ruling that is being appealed. • Security selection in the energy and communications industries. Top detractors from relative performance • Underweight to the contingent capital securities (CoCos) segment. |
Average Annual Total Returns
| 1-Year | Since Inception (11/1/22) |
|||||||
| Nuveen Preferred Securities and Income Managed Accounts Portfolio at NAV |
7.33 | % | 9.21 | % | ||||
| Bloomberg U.S. Aggregate Bond Index |
2.71 | % | 4.34 | % | ||||
| ICE US Institutional Capital Securities Index |
5.44 | % | 9.06 | % | ||||
| Preferred Securities and Income Managed Accounts Portfolio Blended Benchmark |
5.84 | % | 8.72 | % | ||||
Fund Statistics (as of July 31, 2026)
| Fund net assets |
$ | 17,856,847 | ||
| Total number of portfolio holdings |
100 | |||
| Portfolio turnover (%) |
20% | |||
| Total management fees paid for the year |
$ | 0 | ||
 |
 |
 |
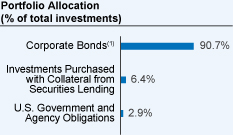
| (1) | Includes 89.4% of $1,000 Par Preferred and/or Contingent Capital Securities. |
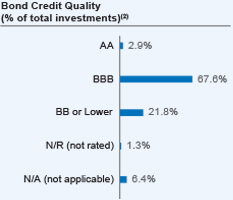
| (2) | The ratings disclosed are the highest rating given by one of the following national rating agencies: Standard & Poor’s (S&P), Moody’s Investors Service, Inc. (Moody’s) or Fitch, Inc (Fitch). This treatment of split-rated securities may differ from that used for other purposes, such as for Fund investment policies. Credit ratings are subject to change. AAA, AA, A, and BBB are investment grade ratings; BB, B, CCC, CC, C and D are below-investment grade ratings. Holdings designated N/R are not rated by these national ratings agencies. |
How has the Fund changed?
For more complete information, you may review the Fund’s next prospectus, which is expected to be available by November 30, 2026 at https://www.nuveen.com/en-us/mutual-funds/prospectuses or upon request at (800) 257-8787.
For more complete information, you may review the Fund’s next prospectus, which is expected to be available by November 30, 2026 at https://www.nuveen.com/en-us/mutual-funds/prospectuses or upon request at (800) 257-8787.
This report describes changes to the Fund that occurred during the reporting period.
What were the Fund costs for the last year? (based on a hypothetical $10,000 investment)
| Cost of a $10,000 investment | Costs paid as a percentage of $10,000 investment* | |||
| Nuveen Securitized Credit Managed Accounts Portfolio |
$0 | 0.00% | ||
| * | Annualized for period less than one year. The Fund does not pay a management fee or other expenses (excluding interest expense, taxes, fees incurred in acquiring and disposing of portfolio securities and extraordinary expenses). The Fund’s investment adviser and sub-adviser are compensated from the fee charged by the separately managed account through which Fund shares are held. |
How did the Fund perform last year? What affected the Fund’s performance?
Performance Highlights
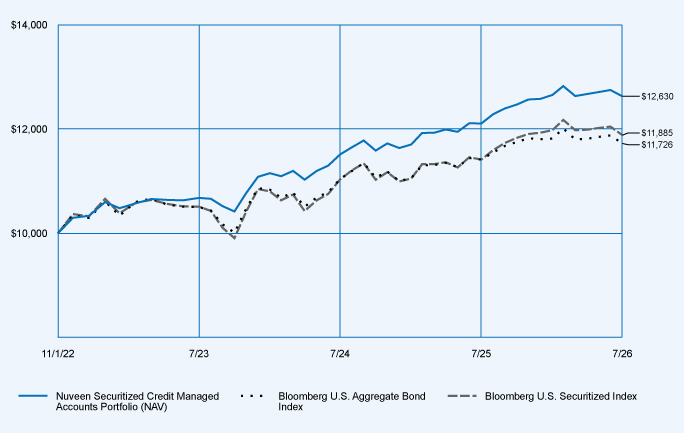
The Nuveen Securitized Credit Managed Accounts Portfolio returned 4.30% at net asset value (NAV) for the 12 months ended July 31, 2026. The Fund performed in line with the Bloomberg U.S. Securitized Index, which returned 4.10%.
Top contributors to relative performance
| • | Security selection within asset-backed securities (ABS), including a higher allocation to esoteric ABS and commercial-focused issues versus consumer-focused issues. |
| • | Allocation to and selection within mortgage-backed securities (MBS), including an out‑of‑benchmark allocation to mortgage credit risk transfer (CRT) securities issued by government-sponsored enterprises and selection within agency MBS. |
| • | Security selection within commercial mortgage-backed securities (CMBS), including a higher allocation to floating-rate single-asset, single-borrower (SASB) securities and seasoned CMBS issues that were less sensitive to interest-rate moves. |
Top detractors from relative performance
| • | Overweight allocation to ABS. |
| • | Overweight allocation to CMBS. |
Average Annual Total Returns
| 1-Year | Since Inception (11/1/22) |
|||||||
| Nuveen Securitized Credit Managed Accounts Portfolio at NAV |
4.30 | % | 6.43 | % | ||||
| Bloomberg U.S. Aggregate Bond Index |
2.71 | % | 4.34 | % | ||||
| Bloomberg U.S. Securitized Index |
4.10 | % | 4.72 | % | ||||
Fund Statistics (as of July 31, 2026)
| Fund net assets |
$ | 57,365,164 | ||
| Total number of portfolio holdings |
217 | |||
| Portfolio turnover (%) |
26% | |||
| Total management fees paid for the year |
$ | 0 | ||
 |
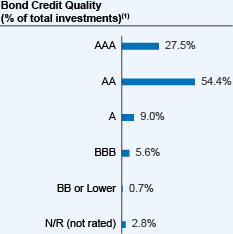 |
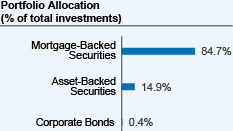
| (1) | The ratings disclosed are the highest rating given by one of the following national rating agencies: Standard & Poor’s (S&P), Moody’s Investors Service, Inc. (Moody’s) or Fitch, Inc (Fitch). This treatment of split-rated securities may differ from that used for other purposes, such as for Fund investment policies. Credit ratings are subject to change. AAA, AA, A, and BBB are investment grade ratings; BB, B, CCC, CC, C and D are below-investment grade ratings. Holdings designated N/R are not rated by these national ratings agencies. |
How has the Fund changed?
Portfolio manager update(s): Effective March 13, 2026, Chris Jeltrup was added as a portfolio manager of the Fund and Peter Lewis was removed as a portfolio manager of the Fund.
For more complete information, you may review the Fund’s next prospectus, which is expected to be available by November 30, 2026 at https://www.nuveen.com/en-us/mutual-funds/prospectuses or upon request at (800) 257-8787.
For more complete information, you may review the Fund’s next prospectus, which is expected to be available by November 30, 2026 at https://www.nuveen.com/en-us/mutual-funds/prospectuses or upon request at (800) 257-8787.
This report describes changes to the Fund that occurred during the reporting period.
What were the Fund costs for the last year? (based on a hypothetical $10,000 investment)
| Cost of a $10,000 investment | Costs paid as a percentage of $10,000 investment* | |||
| Nuveen Ultra Short Municipal Managed Accounts Portfolio |
$0 | 0.00% | ||
| * | Annualized for period less than one year. The Fund does not pay a management fee or other expenses (excluding interest expense, taxes, fees incurred in acquiring and disposing of portfolio securities and extraordinary expenses). The Fund’s investment adviser and sub-adviser are compensated from the fee charged by the separately managed account through which Fund shares are held. |
How did the Fund perform last year? What affected the Fund’s performance?
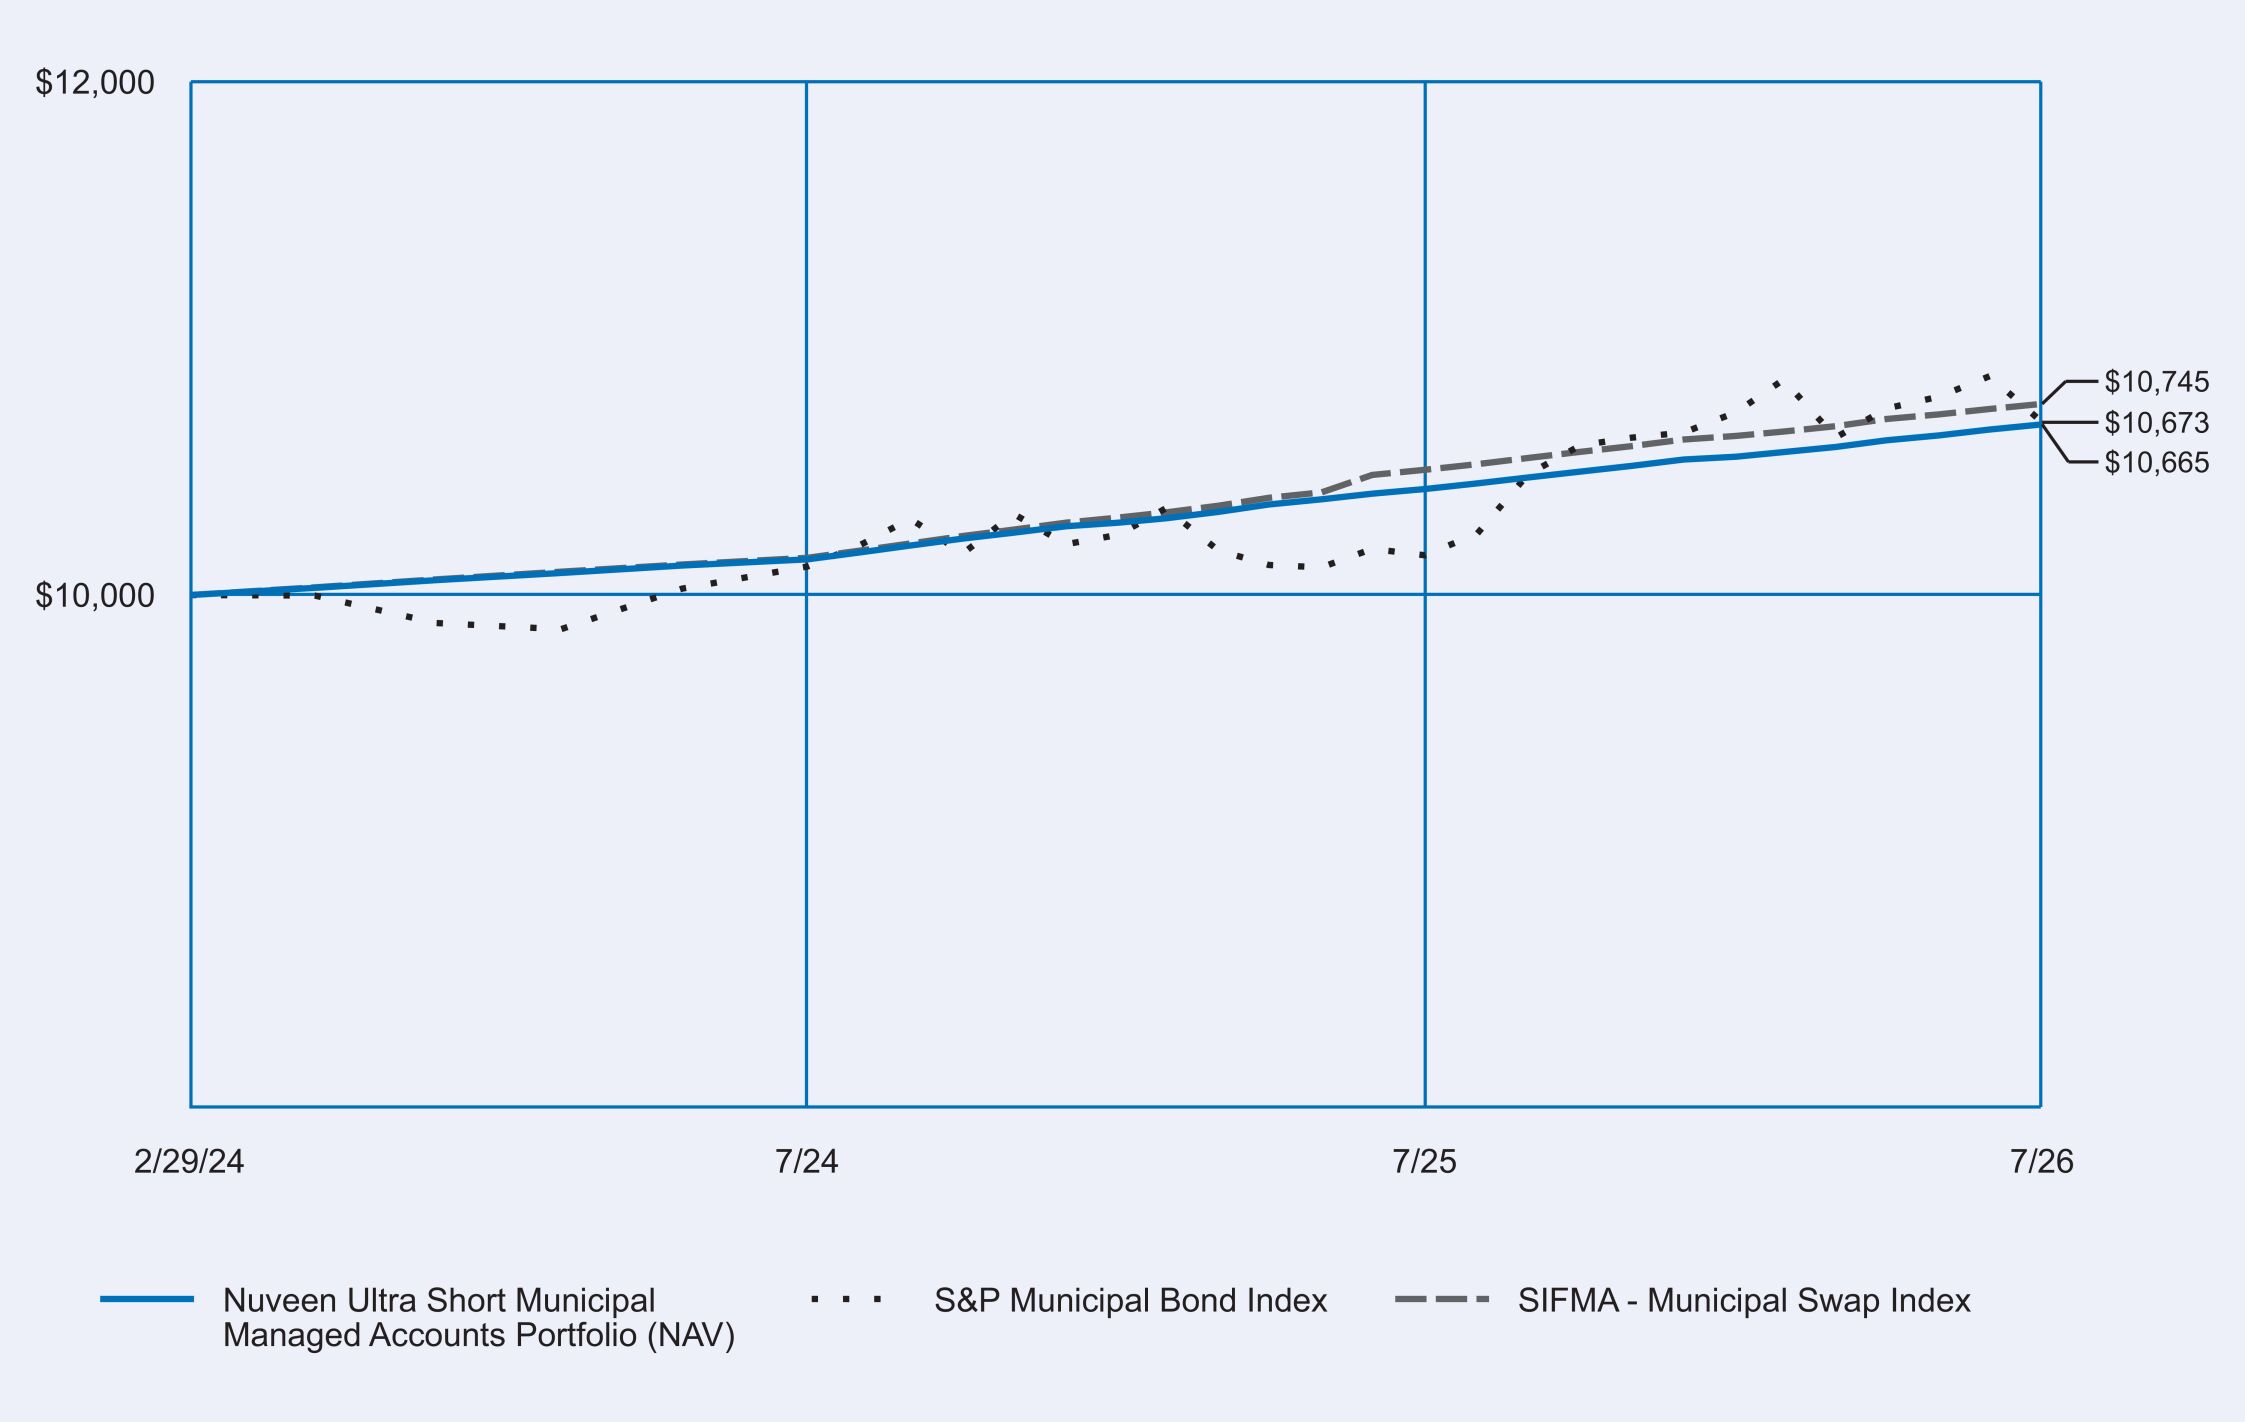
| Performance Highlights The Nuveen Ultra Short Municipal Managed Accounts Portfolio returned 2.41% at net asset value (NAV) for the 12 months ended July 31, 2026. The Fund performed in line with the SIFMA Municipal Swap Index, which returned 2.46%. Primary performance drivers impacting relative yield • Shorter-duration positioning, specifically with more daily than weekly puttable securities. • Overweight to positions in the AAA-rated and AA-rated categories. • Overweight to positions with enhancement features that added another level of security to the bond’s underlying credit quality. |
Average Annual Total Returns
| 1‑Year | Since Inception (2/29/24) |
|||||||
| Nuveen Ultra Short Municipal Managed Accounts Portfolio at NAV |
2.41 | % | 2.70 | % | ||||
| S&P Municipal Bond Index |
5.10 | % | 2.73 | % | ||||
| SIFMA - Municipal Swap Index |
2.46 | % | 3.02 | % | ||||
Fund Statistics (as of July 31, 2026)
| Fund net assets |
$ | 10,000,000 | ||
| Total number of portfolio holdings |
34 | |||
| Portfolio turnover (%) |
0% | |||
| Total management fees paid for the year |
$ | 0 | ||
 |
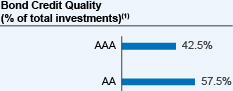 |
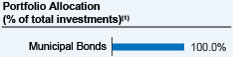
| (1) | The ratings disclosed are the highest rating given by one of the following national rating agencies: Standard & Poor’s (S&P), Moody’s Investors Service, Inc. (Moody’s) or Fitch, Inc (Fitch). This treatment of split-rated securities may differ from that used for other purposes, such as for Fund investment policies. Credit ratings are subject to change. AAA, AA, A, and BBB are investment grade ratings; BB, B, CCC, CC, C and D are below-investment grade ratings. Holdings designated N/R are not rated by these national ratings agencies. |
How has the Fund changed?
For more complete information, you may review the Fund’s next prospectus, which is expected to be available by November 30, 2026 at https://www.nuveen.com/en-us/mutual-funds/prospectuses or upon request at (800) 257-8787.
For more complete information, you may review the Fund’s next prospectus, which is expected to be available by November 30, 2026 at https://www.nuveen.com/en-us/mutual-funds/prospectuses or upon request at (800) 257-8787.
| [1] | Annualized for period less than one year. The Fund does not pay a management fee or other expenses (excluding interest expense, taxes, fees incurred in acquiring and disposing of portfolio securities and extraordinary expenses). The Fund’s investment adviser and sub-adviser are compensated from the fee charged by the separately managed account through which Fund shares are held. |
| [2] | Annualized for period less than one year. The Fund does not pay a management fee or other expenses (excluding interest expense, taxes, fees incurred in acquiring and disposing of portfolio securities and extraordinary expenses). The Fund’s investment adviser and sub-adviser are compensated from the fee charged by the separately managed account through which Fund shares are held. |
| [3] | Annualized for period less than one year. The Fund does not pay a management fee or other expenses (excluding interest expense, taxes, fees incurred in acquiring and disposing of portfolio securities and extraordinary expenses). The Fund’s investment adviser and sub-adviser are compensated from the fee charged by the separately managed account through which Fund shares are held. |
| [4] | Annualized for period less than one year. The Fund does not pay a management fee or other expenses (excluding interest expense, taxes, fees incurred in acquiring and disposing of portfolio securities and extraordinary expenses). The Fund’s investment adviser and sub-adviser are compensated from the fee charged by the separately managed account through which Fund shares are held. |
| [5] | Annualized for period less than one year. The Fund does not pay a management fee or other expenses (excluding interest expense, taxes, fees incurred in acquiring and disposing of portfolio securities and extraordinary expenses). The Fund’s investment adviser and sub-adviser are compensated from the fee charged by the separately managed account through which Fund shares are held. |
| [6] | Annualized for period less than one year. The Fund does not pay a management fee or other expenses (excluding interest expense, taxes, fees incurred in acquiring and disposing of portfolio securities and extraordinary expenses). The Fund’s investment adviser and sub-adviser are compensated from the fee charged by the separately managed account through which Fund shares are held. |
| [7] | Annualized for period less than one year. The Fund does not pay a management fee or other expenses (excluding interest expense, taxes, fees incurred in acquiring and disposing of portfolio securities and extraordinary expenses). The Fund’s investment adviser and sub-adviser are compensated from the fee charged by the separately managed account through which Fund shares are held. |