| Class Name | Costs of a $10,000 investment | Costs paid as a percentage of a $10,000 investment* |
|---|---|---|
| Institutional Class | $78 | 1.19% |
Performance
For the six-month period ended June 30, 2026, the Needham Growth Fund's Institutional Class returned 65.64% , significantly outperforming the Russell 3000 Index's 10.88% and the Russell Midcap Growth Index's 7.27%.
Equity markets were volatile in the first quarter as war, tariff uncertainty, and a 2025 government-shutdown-related slowdown weighed on many industries, including software, autos, and health care equipment. Volatility continued into April as the closing of the Strait of Hormuz pushed oil above $126 per barrel, but markets rallied sharply after a June memorandum of understanding between the United States and Iran eased tensions, oil prices normalized, and the Information Technology sector led a broad-based recovery.
The key factor affecting the Fund's performance was stock selection, particularly among holdings tied to semiconductor manufacturing, data center infrastructure, and defense. Leading contributors for the period included Vicor Corporation (VICR), PDF Solutions, Inc. (PDFS), FormFactor, Inc. (FORM), and Vishay Intertechnology, Inc. (VSH). The Fund's detractors were small relative to its contributors and included Super Micro Computer, Inc. (SMCI), Thermo Fisher Scientific, Inc. (TMO), and Huntington Ingalls Industries, Inc. (HII).
Investment Themes
The Fund's major investment theme remains the importance of U.S. infrastructure. The Fund invests in lesser-known "pick and shovel" providers behind engineering, manufacturing, and technology development. Portfolio companies sell into data centers, life sciences laboratories, semiconductor and other manufacturing facilities, transportation infrastructure, energy systems, and defense-related markets. The U.S. has underinvested in many of these areas, which may create long-term opportunities.
Four areas present throughout the portfolio are: Semiconductor manufacturing, data centers and artificial intelligence (AI) processing, U.S. manufacturing, and defense technology.
Needham Investment Management LLC, the Fund's adviser, believes the AI buildout remains in an early stage. The Fund's strategy is to invest in companies developing new products and services and to hold those that execute successfully over time.
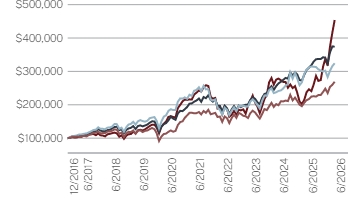
| 1 Year | 5 Year | Since Inception (12/30/2016) | |
|---|---|---|---|
| Institutional Class | 90.95 | 14.51 | 17.27 |
| Russell 3000® Index | 22.82 | 12.31 | 14.89 |
| Russell Midcap® Growth Index | 6.17 | 6.03 | 13.19 |
| S&P MidCap 400® Growth | 25.89 | 9.07 | 10.98 |
| Net Assets | $292,571,662 |
|---|---|
| Number of Holdings | |
| Portfolio Turnover | 24% |
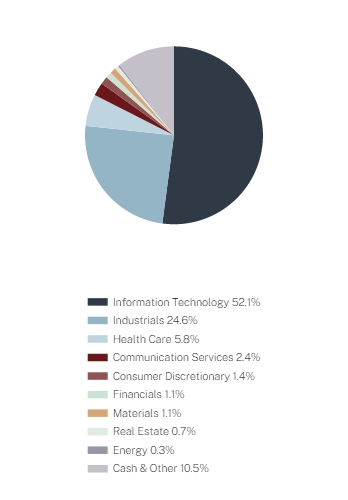
| Dreyfus Treasury Securities Cash Management | |
| PDF Solutions, Inc. | |
| Corning, Inc. | |
| Lam Research Corp. | |
| Vicor Corp. | |
| Vishay Intertechnology, Inc. | |
| FormFactor, Inc. | |
| Marvell Technology, Inc. | |
| MKS, Inc. | |
| Vertiv Holdings Co. |
| Dreyfus Treasury Securities Cash Management | |
| PDF Solutions, Inc. | |
| Corning, Inc. | |
| Lam Research Corp. | |
| Vicor Corp. | |
| Vishay Intertechnology, Inc. | |
| FormFactor, Inc. | |
| Marvell Technology, Inc. | |
| MKS, Inc. | |
| Vertiv Holdings Co. |
| Class Name | Costs of a $10,000 investment | Costs paid as a percentage of a $10,000 investment* |
|---|---|---|
| Retail Class | $107 | 1.62% |
Performance
For the six-month period ended June 30, 2026, the Needham Growth Fund's Retail Class returned 65.33%, significantly outperforming the Russell 3000 Index's 10.88% and the Russell Midcap Growth Index's 7.27%.
Equity markets were volatile in the first quarter as war, tariff uncertainty, and a 2025 government-shutdown-related slowdown weighed on many industries, including software, autos, and health care equipment. Volatility continued into April as the closing of the Strait of Hormuz pushed oil above $126 per barrel, but markets rallied sharply after a June memorandum of understanding between the United States and Iran eased tensions, oil prices normalized, and the Information Technology sector led a broad-based recovery.
The key factor affecting the Fund's performance was stock selection, particularly among holdings tied to semiconductor manufacturing, data center infrastructure, and defense. Leading contributors for the period included Vicor Corporation (VICR), PDF Solutions, Inc. (PDFS), FormFactor, Inc. (FORM), and Vishay Intertechnology, Inc. (VSH). The Fund's detractors were small relative to its contributors and included Super Micro Computer, Inc. (SMCI), Thermo Fisher Scientific, Inc. (TMO), and Huntington Ingalls Industries, Inc. (HII).
Investment Themes
The Fund's major investment theme remains the importance of U.S. infrastructure. The Fund invests in lesser-known "pick and shovel" providers behind engineering, manufacturing, and technology development. Portfolio companies sell into data centers, life sciences laboratories, semiconductor and other manufacturing facilities, transportation infrastructure, energy systems, and defense-related markets. The U.S. has underinvested in many of these areas, which may create long-term opportunities.
Four areas present throughout the portfolio are: Semiconductor manufacturing, data centers and artificial intelligence (AI) processing, U.S. manufacturing, and defense technology.
Needham Investment Management LLC, the Fund's adviser, believes the AI buildout remains in an early stage. The Fund's strategy is to invest in companies developing new products and services and to hold those that execute successfully over time.
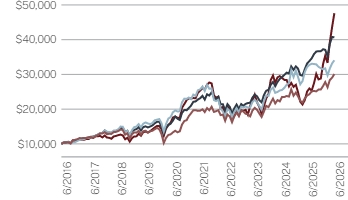
| 1 Year | 5 Year | 10 Year | |
|---|---|---|---|
| Retail Class | 90.12 | 14.01 | 16.89 |
| Russell 3000® Index | 22.82 | 12.31 | 15.06 |
| Russell Midcap® Growth Index | 6.17 | 6.03 | 13.04 |
| S&P MidCap 400® Growth | 25.89 | 9.07 | 11.65 |
| Net Assets | $292,571,662 |
|---|---|
| Number of Holdings | |
| Portfolio Turnover | 24% |
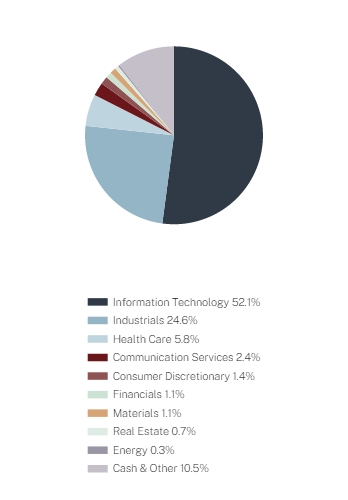
| Dreyfus Treasury Securities Cash Management | |
| PDF Solutions, Inc. | |
| Corning, Inc. | |
| Lam Research Corp. | |
| Vicor Corp. | |
| Vishay Intertechnology, Inc. | |
| FormFactor, Inc. | |
| Marvell Technology, Inc. | |
| MKS, Inc. | |
| Vertiv Holdings Co. |
| Dreyfus Treasury Securities Cash Management | |
| PDF Solutions, Inc. | |
| Corning, Inc. | |
| Lam Research Corp. | |
| Vicor Corp. | |
| Vishay Intertechnology, Inc. | |
| FormFactor, Inc. | |
| Marvell Technology, Inc. | |
| MKS, Inc. | |
| Vertiv Holdings Co. |
| Class Name | Costs of a $10,000 investment | Costs paid as a percentage of a $10,000 investment* |
|---|---|---|
| Institutional Class | $78 | 1.18% |
Performance
For the six-month period ended June 30, 2026, the Needham Aggressive Growth Fund's Institutional Class returned 66.22%, significantly outperforming the Russell 2000 Growth Index's 22.18% and the Russell 3000 Index's 10.88%.
Equity markets were volatile in the first quarter as war, tariff uncertainty, and a 2025 government-shutdown-related slowdown weighed on many industries, including software, autos, and health care equipment. Volatility continued into April as the closing of the Strait of Hormuz pushed oil above $126 per barrel, but markets rallied sharply after a June memorandum of understanding between the United States and Iran eased tensions, oil prices normalized, and the Information Technology sector led a broad-based recovery.
The key factor affecting the Fund's performance was stock selection, particularly among holdings tied to semiconductor manufacturing, data center infrastructure, and defense. Leading contributors included nLIGHT, Inc. (LASR), which continued to benefit from strength in its laser-based defense business; Vicor Corporation (VICR), which reported strong results tied to AI-related power delivery demand; Arteris, Inc. (AIP), which raised guidance following expanded hyperscaler adoption of its technology; and Vishay Intertechnology, Inc. (VSH), which advanced its capacity expansion plans and raised $750 million to fund growth and reduce debt. The Fund's detractors were small relative to its contributors and included Vital Farms, Inc. (VITL) and Huntington Ingalls Industries, Inc. (HII).
Investment Themes
Needham Investment Management LLC (the "Adviser") looks to invest in companies when they are investing in something new that is supported by an established business. The Fund's major investment theme remains the importance of U.S. infrastructure. The Fund invests in lesser-known "pick and shovel" providers behind engineering, manufacturing, and technology development. Portfolio companies sell into data centers, life sciences laboratories, semiconductor and other manufacturing facilities, transportation infrastructure, energy systems, and defense-related markets. The U.S. has underinvested in many of these areas, which may create long-term opportunities.
Four areas present throughout the portfolio are: Semiconductor manufacturing, data centers and artificial intelligence (AI) processing, U.S. manufacturing, and defense technology.
The Adviser believes the AI buildout remains in an early stage. The Fund's strategy is to invest in companies developing new products and services and to hold those that are successful over time.
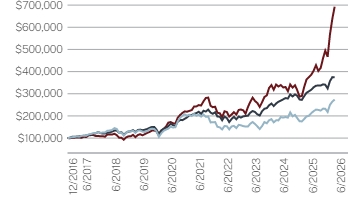
| 1 Year | 5 Year | Since Inception (12/30/2016) | |
|---|---|---|---|
| Institutional Class | 89.98 | 23.39 | 22.60 |
| Russell 3000® Index | 22.82 | 12.31 | 14.89 |
| Russell 2000® Growth Index | 38.74 | 5.57 | 11.19 |
| Net Assets | $2,611,604,938 |
|---|---|
| Number of Holdings | |
| Portfolio Turnover | 7% |
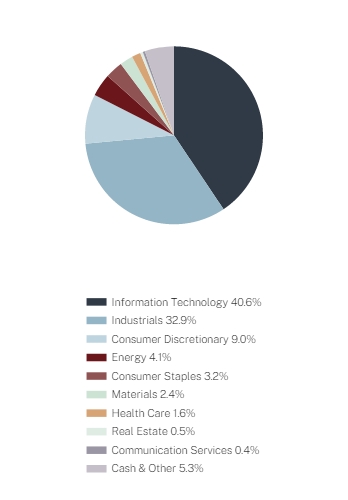
| Vicor Corp. | |
| Arteris, Inc. | |
| Vishay Intertechnology, Inc. | |
| Dreyfus Treasury Securities Cash Management | |
| PDF Solutions, Inc. | |
| nLight, Inc. | |
| Vertiv Holdings Co. | |
| Vishay Precision Group, Inc. | |
| CECO Environmental Corp. | |
| Oil-Dri Corp. of America |
| Vicor Corp. | |
| Arteris, Inc. | |
| Vishay Intertechnology, Inc. | |
| Dreyfus Treasury Securities Cash Management | |
| PDF Solutions, Inc. | |
| nLight, Inc. | |
| Vertiv Holdings Co. | |
| Vishay Precision Group, Inc. | |
| CECO Environmental Corp. | |
| Oil-Dri Corp. of America |
| Class Name | Costs of a $10,000 investment | Costs paid as a percentage of a $10,000 investment* |
|---|---|---|
| Retail Class | $102 | 1.55% |
Performance
For the six-month period ended June 30, 2026, the Needham Aggressive Growth Fund's Retail Class returned 65.91%, significantly outperforming the Russell 2000 Growth Index's 22.18% and the Russell 3000 Index's 10.88%.
Equity markets were volatile in the first quarter as war, tariff uncertainty, and a 2025 government-shutdown-related slowdown weighed on many industries, including software, autos, and health care equipment. Volatility continued into April as the closing of the Strait of Hormuz pushed oil above $126 per barrel, but markets rallied sharply after a June memorandum of understanding between the United States and Iran eased tensions, oil prices normalized, and the Information Technology sector led a broad-based recovery.
The key factor affecting the Fund's performance was stock selection, particularly among holdings tied to semiconductor manufacturing, data center infrastructure, and defense. Leading contributors included nLIGHT, Inc. (LASR), which continued to benefit from strength in its laser-based defense business; Vicor Corporation (VICR), which reported strong results tied to AI-related power delivery demand; Arteris, Inc. (AIP), which raised guidance following expanded hyperscaler adoption of its technology; and Vishay Intertechnology, Inc. (VSH), which advanced its capacity expansion plans and raised $750 million to fund growth and reduce debt. The Fund's detractors were small relative to its contributors and included Vital Farms, Inc. (VITL) and Huntington Ingalls Industries, Inc. (HII).
Investment Themes
Needham Investment Management LLC (the "Adviser") looks to invest in companies when they are investing in something new that is supported by an established business. The Fund's major investment theme remains the importance of U.S. infrastructure. The Fund invests in lesser-known "pick and shovel" providers behind engineering, manufacturing, and technology development. Portfolio companies sell into data centers, life sciences laboratories, semiconductor and other manufacturing facilities, transportation infrastructure, energy systems, and defense-related markets. The U.S. has underinvested in many of these areas, which may create long-term opportunities.
Four areas present throughout the portfolio are: Semiconductor manufacturing, data centers and artificial intelligence (AI) processing, U.S. manufacturing, and defense technology.
The Adviser believes the AI buildout remains in an early stage. The Fund's strategy is to invest in companies developing new products and services and to hold those that are successful over time.
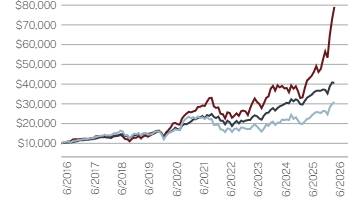
| 1 Year | 5 Year | 10 Year | |
|---|---|---|---|
| Retail Class | 89.23 | 22.73 | 22.98 |
| Russell 3000® Index | 22.82 | 12.31 | 15.06 |
| Russell 2000® Growth Index | 38.74 | 5.57 | 11.97 |
| Net Assets | $2,611,604,938 |
|---|---|
| Number of Holdings | |
| Portfolio Turnover | 7% |
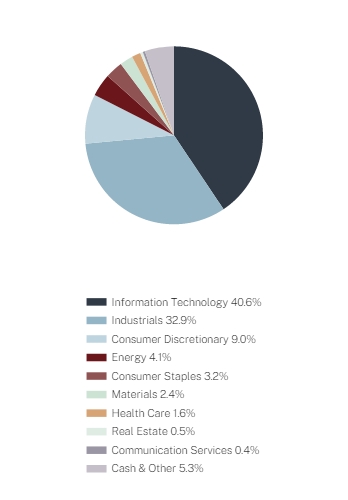
| Vicor Corp. | |
| Arteris, Inc. | |
| Vishay Intertechnology, Inc. | |
| Dreyfus Treasury Securities Cash Management | |
| PDF Solutions, Inc. | |
| nLight, Inc. | |
| Vertiv Holdings Co. | |
| Vishay Precision Group, Inc. | |
| CECO Environmental Corp. | |
| Oil-Dri Corp. of America |
| Vicor Corp. | |
| Arteris, Inc. | |
| Vishay Intertechnology, Inc. | |
| Dreyfus Treasury Securities Cash Management | |
| PDF Solutions, Inc. | |
| nLight, Inc. | |
| Vertiv Holdings Co. | |
| Vishay Precision Group, Inc. | |
| CECO Environmental Corp. | |
| Oil-Dri Corp. of America |
| Class Name | Costs of a $10,000 investment | Costs paid as a percentage of a $10,000 investment* |
|---|---|---|
| Institutional Class | $84 | 1.18% |
Performance
For the six-month period ended June 30, 2026, the Needham Small Cap Growth Fund's Institutional Class returned 87.13%, significantly outperforming the Russell 2000 Growth Index's 22.18% and the Russell 3000 Index's 10.88%.
Small-cap equities were volatile early in 2026 as the U.S.-Iran war drove oil prices above $100 per barrel and introduced broad market uncertainty. Volatility continued into April with the closing of the Strait of Hormuz, which pushed oil to a peak of $126 per barrel, before a June memorandum of understanding between the United States and Iran eased tensions. Small-cap stocks staged a significant recovery in the second quarter as investor interest in the asset class accelerated, merger and acquisition activity picked up, and Information Technology led market gains.
The key factor affecting the Fund's performance was stock selection, particularly among semiconductor, communications infrastructure, and specialty materials holdings. Leading contributors for the period included Arteris, Inc. (AIP), which reported strong bookings and raised guidance; Vishay Intertechnology, Inc. (VSH), which advanced its capacity expansion strategy; and TTM Technologies, Inc. (TTMI) and nLIGHT, Inc. (LASR), which benefited from improving fundamentals and renewed investor confidence earlier in the period. The Fund's detractors were small relative to its contributors and included CoStar Group, Inc. (CSGP), Harmonic, Inc. (HLIT), and Lantronix, Inc. (LTRX).
Investment Themes
The Fund's major investment theme remains the importance of technology-driven infrastructure and industrial innovation. Portfolio companies sell products and services into data centers, communications infrastructure, semiconductor and advanced manufacturing facilities, defense systems, and specialty material markets. Needham Investment Management LLC, the Fund's investment adviser, believes that many of these industries continue to benefit from long-term capital spending trends and ongoing technological innovation.
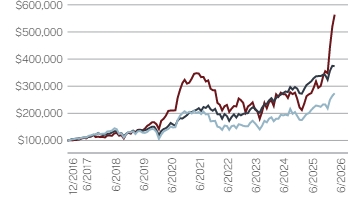
| 1 Year | 5 Year | Since Inception (12/30/2016) | |
|---|---|---|---|
| Institutional Class | 114.10 | 10.27 | 19.96 |
| Russell 3000® Index | 22.82 | 12.31 | 14.89 |
| Russell 2000® Growth Index | 38.74 | 5.57 | 11.19 |
| Net Assets | $419,641,238 |
|---|---|
| Number of Holdings | |
| Portfolio Turnover | 80% |
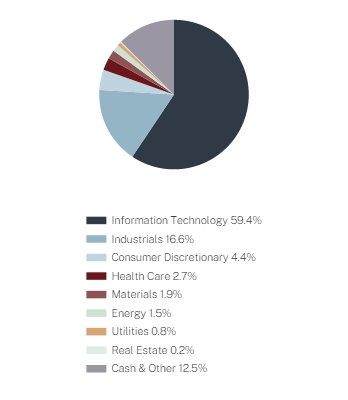
| Dreyfus Treasury Securities Cash Management | |
| Arteris, Inc. | |
| Badger Meter, Inc. | |
| Vishay Intertechnology, Inc. | |
| Ambarella, Inc. | |
| Harmonic, Inc. | |
| Veeco Instruments, Inc. | |
| Calix, Inc. | |
| PDF Solutions, Inc. | |
| CEVA, Inc. |
| Dreyfus Treasury Securities Cash Management | |
| Arteris, Inc. | |
| Badger Meter, Inc. | |
| Vishay Intertechnology, Inc. | |
| Ambarella, Inc. | |
| Harmonic, Inc. | |
| Veeco Instruments, Inc. | |
| Calix, Inc. | |
| PDF Solutions, Inc. | |
| CEVA, Inc. |
| Class Name | Costs of a $10,000 investment | Costs paid as a percentage of a $10,000 investment* |
|---|---|---|
| Retail Class | $127 | 1.78% |
Performance
For the six-month period ended June 30, 2026, the Needham Small Cap Growth Fund's Retail Class returned 86.58%, significantly outperforming the Russell 2000 Growth Index's 22.18% and the Russell 3000 Index's 10.88%.
Small-cap equities were volatile early in 2026 as the U.S.-Iran war drove oil prices above $100 per barrel and introduced broad market uncertainty. Volatility continued into April with the closing of the Strait of Hormuz, which pushed oil to a peak of $126 per barrel, before a June memorandum of understanding between the United States and Iran eased tensions. Small-cap stocks staged a significant recovery in the second quarter as investor interest in the asset class accelerated, merger and acquisition activity picked up, and Information Technology led market gains.
The key factor affecting the Fund's performance was stock selection, particularly among semiconductor, communications infrastructure, and specialty materials holdings. Leading contributors for the period included Arteris, Inc. (AIP), which reported strong bookings and raised guidance; Vishay Intertechnology, Inc. (VSH), which advanced its capacity expansion strategy; and TTM Technologies, Inc. (TTMI) and nLIGHT, Inc. (LASR), which benefited from improving fundamentals and renewed investor confidence earlier in the period. The Fund's detractors were small relative to its contributors and included CoStar Group, Inc. (CSGP), Harmonic, Inc. (HLIT), and Lantronix, Inc. (LTRX).
Investment Themes
The Fund's major investment theme remains the importance of technology-driven infrastructure and industrial innovation. Portfolio companies sell products and services into data centers, communications infrastructure, semiconductor and advanced manufacturing facilities, defense systems, and specialty material markets. Needham Investment Management LLC, the Fund's investment adviser, believes that many of these industries continue to benefit from long-term capital spending trends and ongoing technological innovation.
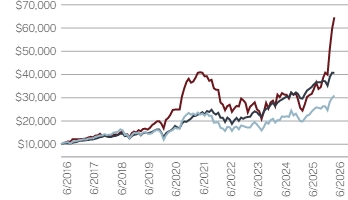
| 1 Year | 5 Year | 10 Year | |
|---|---|---|---|
| Retail Class | 112.86 | 9.66 | 20.51 |
| Russell 3000® Index | 22.82 | 12.31 | 15.06 |
| Russell 2000® Growth Index | 38.74 | 5.57 | 11.97 |
| Net Assets | $419,641,238 |
|---|---|
| Number of Holdings | |
| Portfolio Turnover | 80% |
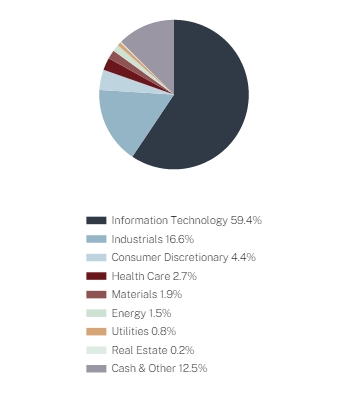
| Dreyfus Treasury Securities Cash Management | |
| Arteris, Inc. | |
| Badger Meter, Inc. | |
| Vishay Intertechnology, Inc. | |
| Ambarella, Inc. | |
| Harmonic, Inc. | |
| Veeco Instruments, Inc. | |
| Calix, Inc. | |
| PDF Solutions, Inc. | |
| CEVA, Inc. |
| Dreyfus Treasury Securities Cash Management | |
| Arteris, Inc. | |
| Badger Meter, Inc. | |
| Vishay Intertechnology, Inc. | |
| Ambarella, Inc. | |
| Harmonic, Inc. | |
| Veeco Instruments, Inc. | |
| Calix, Inc. | |
| PDF Solutions, Inc. | |
| CEVA, Inc. |