Shareholder Report
Jul. 31, 2026
USD ($)
Holding
This report describes changes to the Fund that occurred during the reporting period.
What were the Fund costs for the last year? (based on a hypothetical $10,000 investment)
| Cost of a $10,000 investment | Costs paid as a percentage of $10,000 investment* | |||
| Nuveen Enhanced Yield U.S. Aggregate Bond ETF |
$18 | 0.18% | ||
| * | Annualized for period less than one year. |
How did the Fund perform last year? What affected the Fund’s performance?
| Performance Highlights The Nuveen Enhanced Yield U.S. Aggregate Bond ETF (NUAG)’s total return at net asset value (NAV) was 2.98% for the 12 months ended July 31, 2026. The Fund’s custom index, the ICE BofA Enhanced Yield U.S. Broad Bond Index, returned 3.17%. The difference between the Fund’s total return at NAV and that of the custom index is attributable to management fees and other expenses incurred by the Fund that are not incurred by the custom index, along with the representative sampling process. The representative sampling process utilizes a subset of index securities in an effort to provide exposure similar to that of the custom index. During the reporting period, the Fund’s custom index outperformed the Fund’s base index, the ICE BofA U.S. Broad Market Index, which returned 2.72%. The top contributors to the custom index’s relative performance were an overweight to corporates and an underweight to U.S. treasury bonds. There were no material detractors from the custom index’s relative performance during the reporting period. |
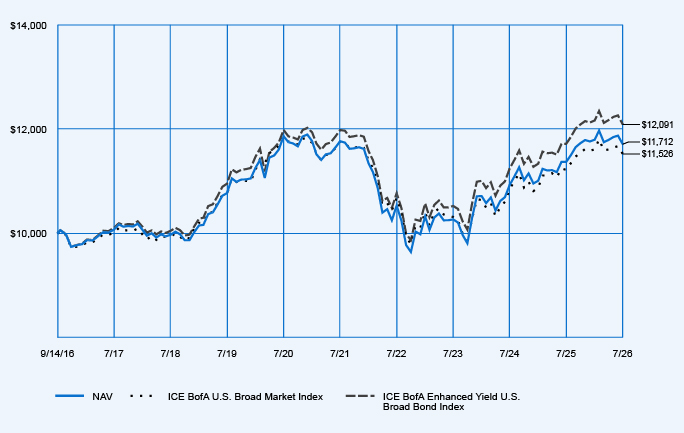
Average Annual Total Returns
| 1-Year | 5-Year | Since Inception (9/14/16) |
||||||||||
| NAV |
2.98 | % | (0.10 | )% | 1.61 | % | ||||||
| ICE BofA U.S. Broad Market Index |
2.72 | % | (0.40 | )% | 1.45 | % | ||||||
| ICE BofA Enhanced Yield U.S. Broad Bond Index |
3.17 | % | 0.18 | % | 1.94 | % | ||||||
Fund Statistics (as of July 31, 2026)
| Fund net assets |
$ | 96,407,847 | ||
| Total number of portfolio holdings |
1,303 | |||
| Portfolio turnover (%) |
60% | |||
| Total management fees paid for the year |
$ | 126,955 | ||
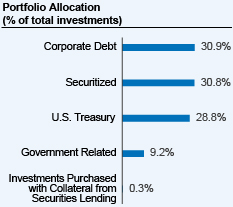 |
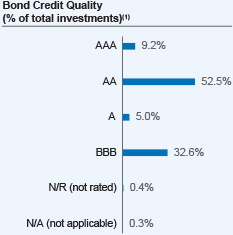 |
| (1) | The Fund uses credit quality ratings for its portfolio securities provided by Moody’s, S&P and Fitch. If all three of Moody’s, S&P, and Fitch provide a rating for a security, an average of the ratings is used; if two of the three agencies rate a security, an average of the two is used; and if only one rating agency rates a security, that rating is used. AAA, AA, A, and BBB are investment grade ratings; BB, B, CCC/CC/C and D are below‑investment grade ratings. Credit ratings are subject to change. Holdings designated N/R are not rated by Moody’s, S&P or Fitch. |
How has the Fund changed?
Portfolio manager update(s): Effective January 23, 2026, Joseph Spinelli was added as a portfolio manager of the Fund and Vivian Liu was removed as a portfolio manager of the Fund.
Management fees: Effective May 1, 2026, the Fund’s contractual management fee was reduced to 0.15% from 0.18%.
Sub‑Adviser merger: At the close of business on July 31, 2026, Teachers Advisors, LLC merged into Nuveen Asset Management, LLC (“Nuveen Asset Management”). In connection with this merger, effective August 1, 2026 Nuveen Asset Management became the sub‑adviser to the Funds. Nuveen Fund Advisors and Nuveen Asset Management are each wholly owned subsidiaries of Nuveen, LLC and, ultimately, Teachers Insurance and Annuity Association of America.
For more complete information, you may review the Fund’s next prospectus, which is expected to be available by November 30, 2026 at https://www.nuveen.com/en‑us/exchange‑traded‑funds/prospectuses or upon request at (800) 257‑8787.
Management fees: Effective May 1, 2026, the Fund’s contractual management fee was reduced to 0.15% from 0.18%.
For more complete information, you may review the Fund’s next prospectus, which is expected to be available by November 30, 2026 at https://www.nuveen.com/en‑us/exchange‑traded‑funds/prospectuses or upon request at (800) 257‑8787.
This report describes changes to the Fund that occurred during the reporting period.
What were the Fund costs for the last year? (based on a hypothetical $10,000 investment)
| Cost of a $10,000 investment | Costs paid as a percentage of $10,000 investment* | |||
| Nuveen ESG 1‑5 Year U.S. Aggregate Bond ETF |
$15 | 0.15% | ||
| * | Annualized for period less than one year. |
How did the Fund perform last year? What affected the Fund’s performance?
| Performance Highlights The Nuveen ESG 1‑5 Year U.S. Aggregate Bond ETF (NUSA)‘s total return at net asset value (NAV) was 2.87% for the 12 months ended July 31, 2026. The Fund’s custom index, the Bloomberg MSCI 1‑5 Year U.S. Aggregate ESG Select Index, returned 3.04%. The difference between the Fund’s total return at NAV and that of the custom index is attributable to management fees and other expenses incurred by the Fund that are not incurred by the custom index, along with the representative sampling process. The representative sampling process utilizes a subset of index securities in an effort to provide exposure similar to that of the custom index. During the reporting period, the Fund’s custom index performed in line with the Fund’s base index, the Bloomberg 1‑5 Year U.S. Aggregate Bond Index, which returned 3.17%. Performance drivers between the Fund’s custom index and base index during the reporting period: • The top contributor to the custom index’s relative performance was security selection within corporates. • The top detractor to the custom index’s relative performance was security selection within MBS. |
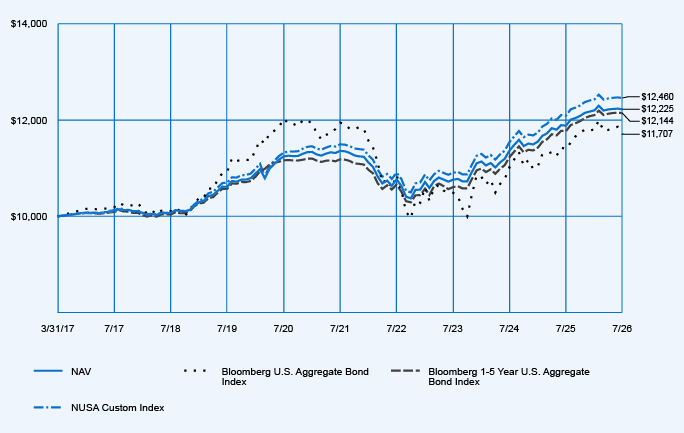
Average Annual Total Returns
| 1-Year | 5-Year | Since Inception (3/31/17) |
||||||||||
| NAV |
2.87 | % | 1.48 | % | 2.18 | % | ||||||
| Bloomberg U.S. Aggregate Bond Index |
2.71 | % | (0.40 | )% | 1.70 | % | ||||||
| Bloomberg 1‑5 Year U.S. Aggregate Bond Index |
3.17 | % | 1.66 | % | 2.10 | % | ||||||
| NUSA Custom Index* |
3.04 | % | 1.62 | % | 2.38 | % | ||||||
| * | The NUSA Custom Index is defined as the linked returns between the Bloomberg MSCI 1‑5 Year U.S. Aggregate ESG Select index (effective July 1, 2023) and the ICE BofA Enhanced Yield 1‑5 Year U.S. Broad Bond Index (through market close on June 30, 2023). |
Fund Statistics (as of July 31, 2026)
| Fund net assets |
$ | 34,552,030 | ||
| Total number of portfolio holdings |
330 | |||
| Portfolio turnover (%) |
44% | |||
| Total management fees paid for the year |
$ | 50,427 | ||
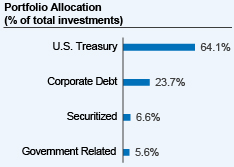 |
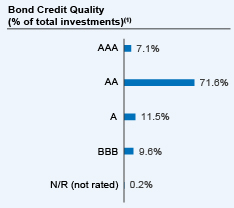 |
| (1) | The Fund uses credit quality ratings for its portfolio securities provided by Moody’s, S&P and Fitch. If all three of Moody’s, S&P, and Fitch provide a rating for a security, the middle is used; if two of the three agencies rate a security, the lower rating is used; and if only one rating agency rates a security, that rating is used. AAA, AA, A, and BBB are investment grade ratings; BB, B, CCC/CC/C and D are below-investment grade ratings. Credit ratings are subject to change. Holdings designated N/R are not rated by Moody’s, S&P or Fitch. |
How has the Fund changed?
Portfolio manager update(s): Effective January 23, 2026, Joseph Spinelli was added as a portfolio manager of the Fund and Vivian Liu was removed as a portfolio manager of the Fund.
Management fees: Effective May 1, 2026, the Fund’s contractual management fee was reduced to 0.14% from 0.15%.
Sub‑Adviser merger: At the close of business on July 31, 2026, Teachers Advisors, LLC merged into Nuveen Asset Management, LLC (“Nuveen Asset Management”). In connection with this merger, effective August 1, 2026 Nuveen Asset Management became the sub‑adviser to the Funds. Nuveen Fund Advisors and Nuveen Asset Management are each wholly owned subsidiaries of Nuveen, LLC and, ultimately, Teachers Insurance and Annuity Association of America.
For more complete information, you may review the Fund’s next prospectus, which is expected to be available by November 30, 2026 at https://www.nuveen.com/en‑us/exchange‑traded‑funds/prospectuses or upon request at (800) 257‑8787.
Management fees: Effective May 1, 2026, the Fund’s contractual management fee was reduced to 0.14% from 0.15%.
For more complete information, you may review the Fund’s next prospectus, which is expected to be available by November 30, 2026 at https://www.nuveen.com/en‑us/exchange‑traded‑funds/prospectuses or upon request at (800) 257‑8787.
This report describes changes to the Fund that occurred during the reporting period.
What were the Fund costs for the last year? (based on a hypothetical $10,000 investment)
| Cost of a $10,000 investment | Costs paid as a percentage of $10,000 investment* | |||
| Nuveen ESG U.S. Aggregate Bond ETF |
$15 | 0.15% | ||
| * | Annualized for period less than one year. |
How did the Fund perform last year? What affected the Fund’s performance?
| Performance Highlights The Nuveen ESG U.S. Aggregate Bond ETF (NUBD)‘s total return at net asset value (NAV) was 2.53% for the 12 months ended July 31, 2026. The Fund’s custom index, the Bloomberg MSCI U.S. Aggregate ESG Select Index, returned 2.70%. The difference between the Fund’s total return at NAV and that of the custom index is attributable to management fees and other expenses incurred by the Fund that are not incurred by the custom index, along with the representative sampling process. The representative sampling process utilizes a subset of index securities in an effort to provide exposure similar to that of the custom index. During the reporting period, the Fund’s custom index performed in line with the Fund’s base index, the Bloomberg U.S. Aggregate Bond Index, which returned 2.71%. Sector allocations and performance were consistent in both the custom index and base index, and there were no material contributors or detractors between the custom index and base index over the reporting period. |
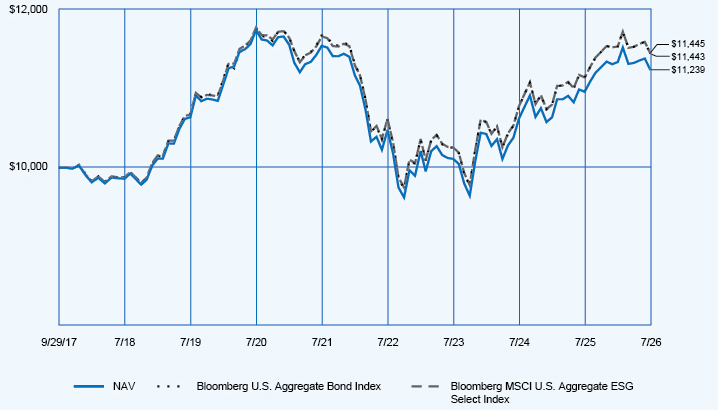
Average Annual Total Returns
| 1-Year | 5-Year | Since Inception (9/29/17) |
||||||||||
| NAV |
2.53 | % | (0.53 | )% | 1.33 | % | ||||||
| Bloomberg U.S. Aggregate Bond Index |
2.71 | % | (0.40 | )% | 1.54 | % | ||||||
| Bloomberg MSCI U.S. Aggregate ESG Select Index |
2.70 | % | (0.37 | )% | 1.54 | % | ||||||
Fund Statistics (as of July 31, 2026)
| Fund net assets |
$ | 463,183,920 | ||
| Total number of portfolio holdings |
2,384 | |||
| Portfolio turnover (%) |
15% | |||
| Total management fees paid for the year |
$ | 644,632 | ||
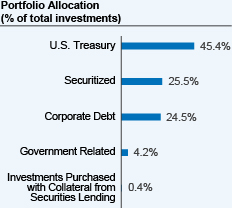 |
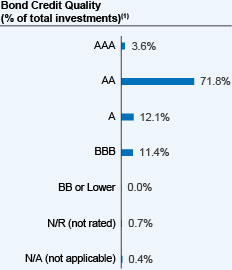 |
| (1) | The Fund uses credit quality ratings for its portfolio securities provided by Moody’s, S&P and Fitch. If all three of Moody’s, S&P, and Fitch provide a rating for a security, the middle is used; if two of the three agencies rate a security, the lower rating is used; and if only one rating agency rates a security, that rating is used. AAA, AA, A, and BBB are investment grade ratings; BB, B, CCC/CC/C and D are below-investment grade ratings. Credit ratings are subject to change. Holdings designated N/R are not rated by Moody’s, S&P or Fitch. |
How has the Fund changed?
Portfolio manager update(s): Effective January 23, 2026, Joseph Spinelli was added as a portfolio manager of the Fund and Vivian Liu was removed as a portfolio manager of the Fund.
Management fees: Effective May 1, 2026, the Fund’s contractual management fee was reduced to 0.12% from 0.15%.
Sub‑Adviser merger: At the close of business on July 31, 2026, Teachers Advisors, LLC merged into Nuveen Asset Management, LLC (“Nuveen Asset Management”). In connection with this merger, effective August 1, 2026 Nuveen Asset Management became the sub‑adviser to the Funds. Nuveen Fund Advisors and Nuveen Asset Management are each wholly owned subsidiaries of Nuveen, LLC and, ultimately, Teachers Insurance and Annuity Association of America.
For more complete information, you may review the Fund’s next prospectus, which is expected to be available by November 30, 2026 at https://www.nuveen.com/en‑us/exchange‑traded‑funds/prospectuses or upon request at (800) 257‑8787.
Management fees: Effective May 1, 2026, the Fund’s contractual management fee was reduced to 0.12% from 0.15%.
For more complete information, you may review the Fund’s next prospectus, which is expected to be available by November 30, 2026 at https://www.nuveen.com/en‑us/exchange‑traded‑funds/prospectuses or upon request at (800) 257‑8787.
This report describes changes to the Fund that occurred during the reporting period.
What were the Fund costs for the last year? (based on a hypothetical $10,000 investment)
| Cost of a $10,000 investment | Costs paid as a percentage of $10,000 investment* | |||
| Nuveen ESG High Yield Corporate Bond ETF |
$32 | 0.31% | ||
| * | Annualized for period less than one year. |
How did the Fund perform last year? What affected the Fund’s performance?
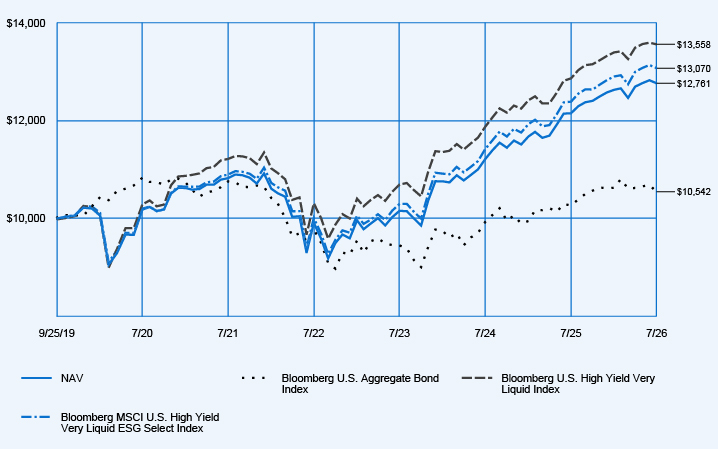
| Performance Highlights The Nuveen ESG High Yield Corporate Bond ETF (NUHY)‘s total return at net asset value (NAV) was 5.04% for the 12 months ended July 31, 2026. The Fund’s custom index, the Bloomberg MSCI U.S. High Yield Very Liquid ESG Select Index, returned 5.53%. The difference between the Fund’s total return at NAV and that of the custom index is attributable to management fees and other expenses incurred by the Fund that are not incurred by the custom index, along with the representative sampling process. The representative sampling process utilizes a subset of index securities in an effort to provide exposure similar to that of the custom index. During the reporting period, the Fund’s custom index performed in line with the Fund’s base index, the Bloomberg U.S. High Yield Very Liquid Index, which returned 5.41%. Performance drivers between the Fund’s custom index and base index during the reporting period: • The top contributor to the custom index’s relative performance was security selection within the industrial sector. • The top detractor to the custom index’s relative performance was security selection within the financial institutions sector. |
Average Annual Total Returns
| 1-Year | 5-Year | Since Inception (9/25/19) |
||||||||||
| NAV |
5.04 | % | 3.35 | % | 3.62 | % | ||||||
| Bloomberg U.S. Aggregate Bond Index |
2.71 | % | (0.40 | )% | 0.77 | % | ||||||
| Bloomberg U.S. High Yield Very Liquid Index |
5.41 | % | 3.87 | % | 4.54 | % | ||||||
| Bloomberg MSCI U.S. High Yield Very Liquid ESG Select Index |
5.53 | % | 3.71 | % | 3.99 | % | ||||||
Fund Statistics (as of July 31, 2026)
| Fund net assets |
$ | 110,701,288 | ||
| Total number of portfolio holdings |
382 | |||
| Portfolio turnover (%) |
81% | |||
| Total management fees paid for the year |
$ | 322,035 | ||
 |
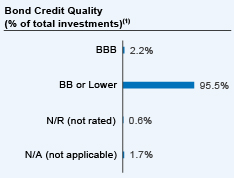 |
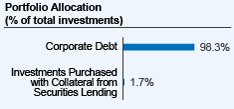
| (1) | The Fund uses credit quality ratings for its portfolio securities provided by Moody’s, S&P and Fitch. If all three of Moody’s, S&P, and Fitch provide a rating for a security, the middle is used; if two of the three agencies rate a security, the lower rating is used; and if only one rating agency rates a security, that rating is used. AAA, AA, A, and BBB are investment grade ratings; BB, B, CCC/CC/C and D are below-investment grade ratings. Credit ratings are subject to change. Holdings designated N/R are not rated by Moody’s, S&P or Fitch. |
How has the Fund changed?
Portfolio manager update(s): Effective January 23, 2026, Joseph Spinelli was added as a portfolio manager of the Fund and Vivian Liu was removed as a portfolio manager of the Fund.
Sub‑Adviser merger: At the close of business on July 31, 2026, Teachers Advisors, LLC merged into Nuveen Asset Management, LLC (“Nuveen Asset Management”). In connection with this merger, effective August 1, 2026 Nuveen Asset Management became the sub‑adviser to the Funds. Nuveen Fund Advisors and Nuveen Asset Management are each wholly owned subsidiaries of Nuveen, LLC and, ultimately, Teachers Insurance and Annuity Association of America.
For more complete information, you may review the Fund’s next prospectus, which is expected to be available by November 30, 2026 at https://www.nuveen.com/en‑us/exchange‑traded‑funds/prospectuses or upon request at (800) 257‑8787.
For more complete information, you may review the Fund’s next prospectus, which is expected to be available by November 30, 2026 at https://www.nuveen.com/en‑us/exchange‑traded‑funds/prospectuses or upon request at (800) 257‑8787.
This report describes changes to the Fund that occurred during the reporting period.
What were the Fund costs for the last year? (based on a hypothetical $10,000 investment)
| Cost of a $10,000 investment | Costs paid as a percentage of $10,000 investment* | |||
| Nuveen Core Plus Bond ETF |
$32 | 0.31% | ||
| * | Annualized for period less than one year. |
How did the Fund perform last year? What affected the Fund’s performance?
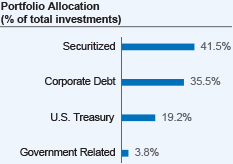
| Performance Highlights The Nuveen Core Plus Bond ETF returned 3.70% for Common Shares at net asset value (NAV) for the 12 months ended July 31, 2026. The Fund outperformed the Bloomberg U.S. Aggregate Bond Index, which returned 2.71%. Top contributors to relative performance • Overweight allocation and security selection in the corporate bond sector, led by out‑of‑index exposure to high-yield bonds, preferred securities, leveraged loans and emerging markets (EM) corporate bonds. • Overweight allocations and security selection in securitized sectors, including mortgage-backed securities (MBS), commercial mortgage-backed securities (CMBS) and asset-backed securities (ABS). • Underweight allocation to U.S. Treasury bonds. Top detractors from relative performance • Small cash allocation. • Security selection in EM sovereign bonds. |
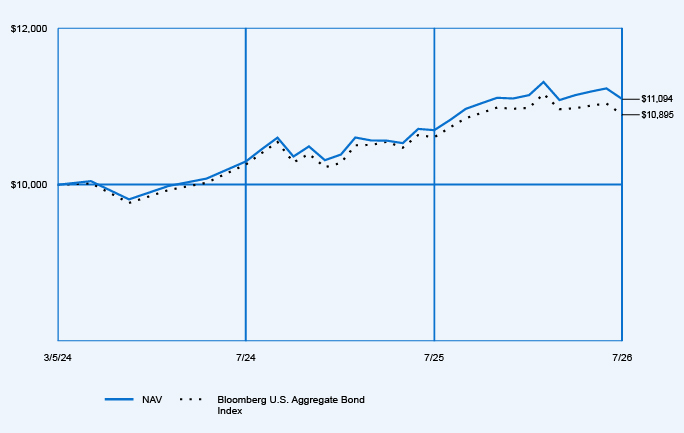
Average Annual Total Returns
| 1-Year | Since Inception (3/5/24) |
|||||||
| NAV |
3.70 | % | 4.41 | % | ||||
| Bloomberg U.S. Aggregate Bond Index |
2.71 | % | 3.63 | % | ||||
Fund Statistics (as of July 31, 2026)
| Fund net assets |
$ | 55,288,704 | ||
| Total number of portfolio holdings |
475 | |||
| Portfolio turnover (%) |
66% | |||
| Total management fees paid for the year |
$ | 171,067 | ||
 |
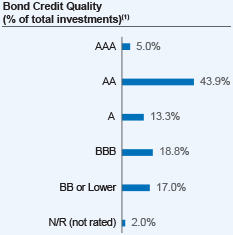 |
| (1) | The Fund uses credit quality ratings for its portfolio securities provided by Moody’s, S&P and Fitch. If all three of Moody’s, S&P, and Fitch provide a rating for a security, the middle is used; if two of the three agencies rate a security, the lower rating is used; and if only one rating agency rates a security, that rating is used. AAA, AA, A, and BBB are investment grade ratings; BB, B, CCC/CC/C and D are below-investment grade ratings. Credit ratings are subject to change. Holdings designated N/R are not rated by Moody’s, S&P or Fitch. |
How has the Fund changed?
For more complete information, you may review the Fund’s next prospectus, which is expected to be available by November 30, 2026 at https://www.nuveen.com/en‑us/exchange‑traded‑funds/prospectuses or upon request at (800) 257‑8787.
For more complete information, you may review the Fund’s next prospectus, which is expected to be available by November 30, 2026 at https://www.nuveen.com/en‑us/exchange‑traded‑funds/prospectuses or upon request at (800) 257‑8787.
This report describes changes to the Fund that occurred during the reporting period.
What were the Fund costs for the last year? (based on a hypothetical $10,000 investment)
| Cost of a $10,000 investment | Costs paid as a percentage of $10,000 investment* | |||
| Nuveen Preferred and Income ETF |
$58 | 0.56% | ||
| * | Annualized for period less than one year. |
How did the Fund perform last year? What affected the Fund’s performance?
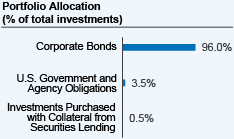
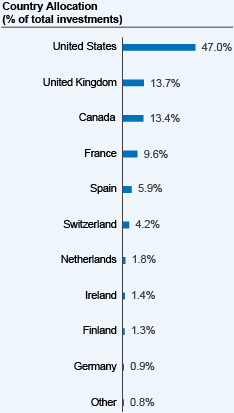
| Performance Highlights The Nuveen Preferred and Income ETF returned 5.61% for Common Shares at net asset value (NAV) for the 12 months ended July 31, 2026. The Fund performed in line with the NPFI Blended Benchmark, which returned 5.84%. The NPFI Blended Benchmark consists of: 1) 60% ICE U.S. Institutional Capital Securities Index (IIPS), 2) 40% ICE USD Contingent Capital Index (CDLR). Top contributors to relative performance • Security selection in the banking and energy industries. Top detractors from relative performance • Underweight to the contingent capital securities (CoCos) segment. |
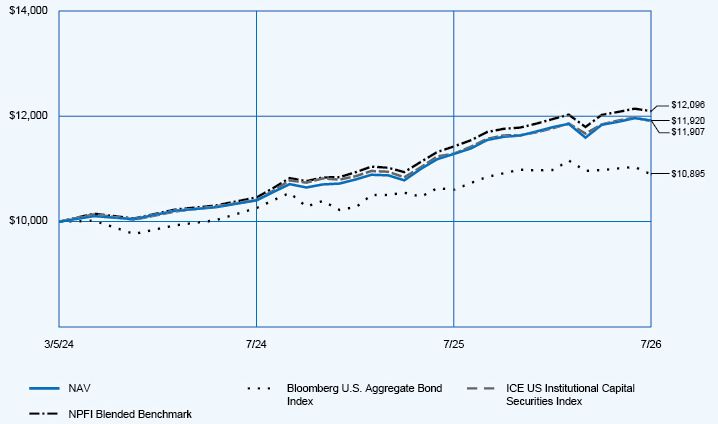
Average Annual Total Returns
| 1-Year | Since Inception (3/5/24) |
|||||||
| NAV |
5.61 | % | 7.57 | % | ||||
| Bloomberg U.S. Aggregate Bond Index |
2.71 | % | 3.63 | % | ||||
| ICE US Institutional Capital Securities Index |
5.44 | % | 7.52 | % | ||||
| NPFI Blended Benchmark |
5.84 | % | 8.23 | % | ||||
Fund Statistics (as of July 31, 2026)
| Fund net assets |
$ | 174,031,005 | ||
| Total number of portfolio holdings |
163 | |||
| Portfolio turnover (%) |
13% | |||
| Total management fees paid for the year |
$ | 647,263 | ||
 |
 |
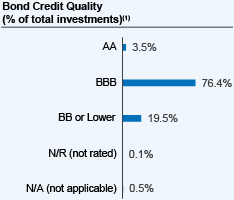 |
| (1) | The ratings disclosed are the highest rating given by one of the following national rating agencies: Standard & Poor’s (S&P), Moody’s Investors Service, Inc. (Moody’s) or Fitch, Inc (Fitch). This treatment of split-rated securities may differ from that used for other purposes, such as for Fund investment policies. Credit ratings are subject to change. AAA, AA, A, and BBB are investment grade ratings; BB, B, CCC, CC, C and D are below-investment grade ratings. Holdings designated N/R are not rated by these national ratings agencies. |
How has the Fund changed?
For more complete information, you may review the Fund’s next prospectus, which is expected to be available by November 30, 2026 at https://www.nuveen.com/en‑us/exchange‑traded‑funds/prospectuses or upon request at (800) 257‑8787.
For more complete information, you may review the Fund’s next prospectus, which is expected to be available by November 30, 2026 at https://www.nuveen.com/en‑us/exchange‑traded‑funds/prospectuses or upon request at (800) 257‑8787.
This report describes changes to the Fund that occurred during the reporting period.
What were the Fund costs for the last year? (based on a hypothetical $10,000 investment)
| Cost of a $10,000 investment | Costs paid as a percentage of $10,000 investment* | |||
| Nuveen Ultra Short Income ETF |
$18 | 0.18% | ||
| * | Annualized for period less than one year. |
How did the Fund perform last year? What affected the Fund’s performance?
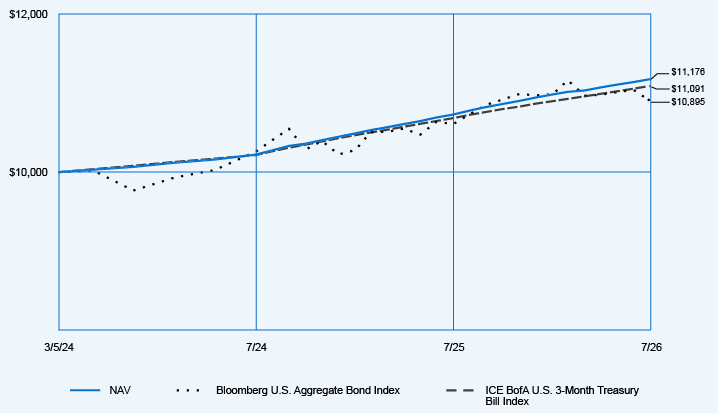
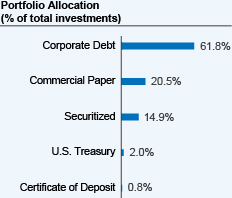
| Performance Highlights The Nuveen Ultra Short Income ETF returned 4.18% for Common Shares at net asset value (NAV) for the 12 months ended July 31, 2026. The Fund outperformed the ICE BofA U.S. 3‑Month Treasury Bill Index, which returned 3.82%. Top contributors to relative performance • Out‑of‑benchmark allocation to investment-grade corporate bonds. • Out‑of‑benchmark allocations to securitized sectors, including commercial mortgage-backed securities (CMBS) and asset-backed securities (ABS). • Out‑of‑benchmark allocation to commercial paper. Top detractors from relative performance • Yield curve positioning, primarily an overweight to two‑year maturity bonds. |
Average Annual Total Returns
| 1‑Year | Since Inception (3/5/24) |
|||||||
| NAV |
4.18 | % | 4.73 | % | ||||
| Bloomberg U.S. Aggregate Bond Index |
2.71 | % | 3.63 | % | ||||
| ICE BofA U.S. 3‑Month Treasury Bill Index |
3.82 | % | 4.40 | % | ||||
Fund Statistics (as of July 31, 2026)
| Fund net assets |
$ | 156,610,096 | ||
| Total number of portfolio holdings |
142 | |||
| Portfolio turnover (%) |
26% | |||
| Total management fees paid for the year |
$ | 265,930 | ||
 |
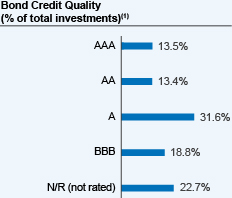 |
| (1) | The Fund uses credit quality ratings for its portfolio securities provided by Moody’s, S&P and Fitch. If all three of Moody’s, S&P, and Fitch provide a rating for a security, the middle is used; if two of the three agencies rate a security, the lower rating is used; and if only one rating agency rates a security, that rating is used. AAA, AA, A, and BBB are investment grade ratings; BB, B, CCC/CC/C and D are below-investment grade ratings. Credit ratings are subject to change. Holdings designated N/R are not rated by Moody’s, S&P or Fitch. |
How has the Fund changed?
For more complete information, you may review the Fund’s next prospectus, which is expected to be available by November 30, 2026 at https://www.nuveen.com/en‑us/exchange‑traded‑funds/prospectuses or upon request at (800) 257‑8787.
For more complete information, you may review the Fund’s next prospectus, which is expected to be available by November 30, 2026 at https://www.nuveen.com/en‑us/exchange‑traded‑funds/prospectuses or upon request at (800) 257‑8787.
This report describes changes to the Fund that occurred during the reporting period.
What were the Fund costs for the last year? (based on a hypothetical $10,000 investment)
| Cost of a $10,000 investment | Costs paid as a percentage of $10,000 investment* | |||
| Nuveen AA‑BBB CLO ETF |
$27 | 0.26% | ||
| * | Annualized for period less than one year. |
How did the Fund perform last year? What affected the Fund’s performance?
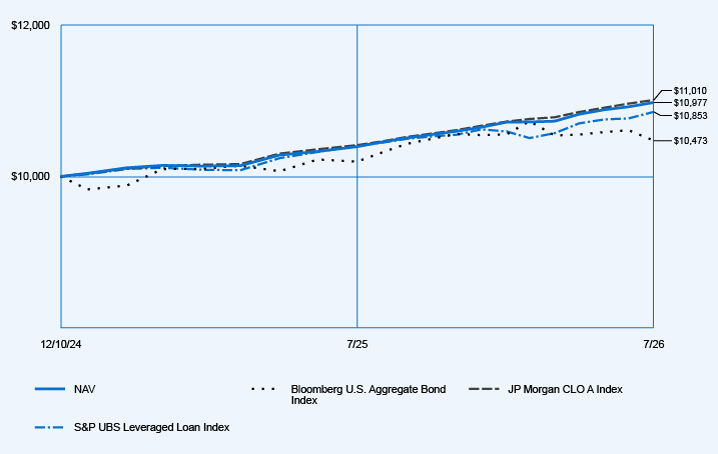
| Performance Highlights The Nuveen AA‑BBB CLO ETF returned 5.61% for Common Shares at net asset value (NAV) for the 12 months ended July 31, 2026. The Fund performed in line with the JP Morgan CLO A Index, which returned 5.72%. Top contributors to relative performance • Security selection within A‑rated and BBB‑rated collateralized loan obligation (CLO) tranches. • Active management and tactical rotation, including an emphasis on more liquid CLO debt. • Manager selection within top‑tier CLO managers, with an emphasis on higher-quality underlying loan portfolios. Top detractors from relative performance • Exposure to AA‑rated CLO tranches. |
Average Annual Total Returns
| 1-Year | Since Inception (12/10/24) |
|||||||
| NAV |
5.61 | % | 5.85 | % | ||||
| Bloomberg U.S. Aggregate Bond Index |
2.71 | % | 2.86 | % | ||||
| JP Morgan CLO A Index |
5.72 | % | 6.05 | % | ||||
| S&P UBS Leveraged Loan Index |
4.27 | % | 5.12 | % | ||||
Fund Statistics (as of July 31, 2026)
| Fund net assets |
$ | 152,169,995 | ||
| Total number of portfolio holdings |
106 | |||
| Portfolio turnover (%) |
94% | |||
| Total management fees paid for the year |
$ | 331,226 | ||
 |
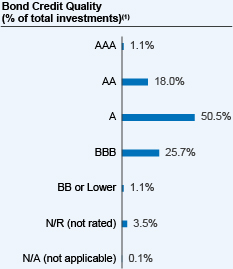 |
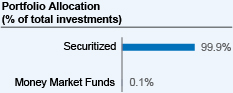
| (1) | The Fund uses credit quality ratings for its portfolio securities provided by Moody’s, S&P and Fitch. If all three of Moody’s, S&P, and Fitch provide a rating for a security, the middle is used; if two of the three agencies rate a security, the lower rating is used; and if only one rating agency rates a security, that rating is used. AAA, AA, A, and BBB are investment grade ratings; BB, B, CCC/CC/C and D are below-investment grade ratings. Credit ratings are subject to change. Holdings designated N/R are not rated by Moody’s, S&P or Fitch. |
How has the Fund changed?
For more complete information, you may review the Fund’s next prospectus, which is expected to be available by November 30, 2026 at https://www.nuveen.com/en‑us/exchange‑traded‑funds/prospectuses or upon request at (800) 257‑8787.
For more complete information, you may review the Fund’s next prospectus, which is expected to be available by November 30, 2026 at https://www.nuveen.com/en‑us/exchange‑traded‑funds/prospectuses or upon request at (800) 257‑8787.
This report describes changes to the Fund that occurred during the reporting period.
What were the Fund costs for the period since inception? (based on a hypothetical $10,000 investment)
| Cost of a $10,000 investment | Costs paid as a percentage of $10,000 investment* | |||
| Nuveen Securitized Income ETF |
$40 | 0.39% | ||
| * | Annualized for period less than one year. |
How did the Fund perform since inception? What affected the Fund’s performance?
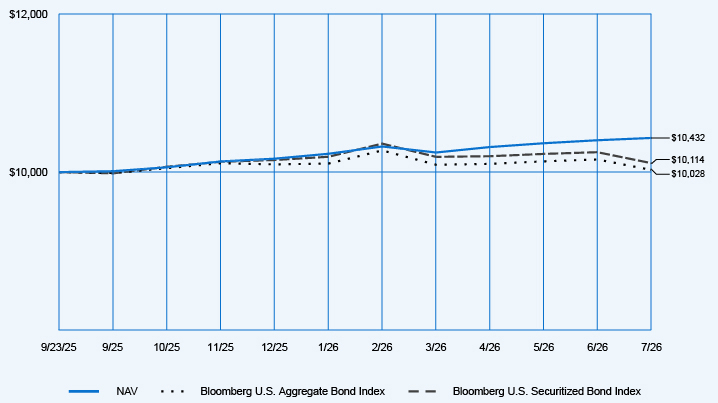
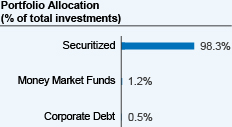
| Performance Highlights The Nuveen Securitized Income ETF returned 4.32% for Common Shares at net asset value (NAV) for the abbreviated annual reporting period from the Fund’s inception on September 23, 2025, through July 31, 2026. The Fund outperformed the Bloomberg U.S. Securitized Index, which returned 1.14%. Top contributors to relative performance • Security selection and an overweight to commercial mortgage-backed securities and asset-backed securities. • Yield curve positioning. Top detractors from relative performance • Transaction costs as the ETF scaled following launch. |
Cumulative Total Returns
| Since Inception (9/23/25) |
||||
| NAV |
4.32 | % | ||
| Bloomberg U.S. Aggregate Bond Index |
0.28 | % | ||
| Bloomberg U.S. Securitized Bond Index |
1.14 | % | ||
Fund Statistics (as of July 31, 2026)
| Fund net assets |
$ | 207,239,714 | ||
| Total number of portfolio holdings |
222 | |||
| Portfolio turnover (%) |
73% | |||
| Total management fees paid for the year |
$ | 389,973 | ||
 |
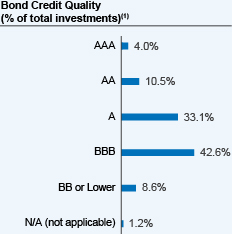 |
| (1) | The Fund uses credit quality ratings for its portfolio securities provided by Moody’s, S&P, Fitch. DBRS or KBRA. Ratings provided by S&P, Moody’s and Fitch are used where available, while DBRS and KBRA are used to supplement if no other ratings are available. If all three of Moody’s, S&P, and Fitch provide a rating for a security, the middle is used; if two of the three agencies rate a security, the lower rating is used; and if only one rating agency rates a security, that rating is used. If ratings are provided only by DBRS and KBRA, the lower of the two ratings is used AAA, AA, A, and BBB are investment grade ratings; BB, B, CCC/CC/C and D are below-investment grade ratings. Credit ratings are subject to change. Holdings designated N/R are not rated by these rating agencies and, where applicable, include net derivative positions. |
How has the Fund changed?
For more complete information, you may review the Fund’s next prospectus, which is expected to be available by November 30, 2026 at https://www.nuveen.com/en‑us/exchange‑traded‑funds/prospectuses or upon request at (800) 257‑8787.
For more complete information, you may review the Fund’s next prospectus, which is expected to be available by November 30, 2026 at https://www.nuveen.com/en‑us/exchange‑traded‑funds/prospectuses or upon request at (800) 257‑8787.
This report describes changes to the Fund that occurred during the reporting period.
What were the Fund costs for the period since inception? (based on a hypothetical $10,000 investment)
| Cost of a $10,000 investment | Costs paid as a percentage of $10,000 investment* | |||
| Nuveen High Yield Corporate Bond ETF |
$9 | 0.09% | ||
| * | Annualized for period less than one year. |
How did the Fund perform since inception? What affected the Fund’s performance?
| Performance Highlights The Nuveen High Yield Corporate Bond ETF’s total return at net asset value (NAV) was 3.03% for the abbreviated annual reporting period from the Fund’s inception on September 23, 2025, through July 31, 2026. The Fund’s index, the ICE BofA BB‑B U.S. Cash Pay High Yield Constrained Index, returned 3.17%. The difference between the Fund’s total return at NAV and that of the index is attributable to management fees and other expenses incurred by the Fund that are not incurred by the index. The Fund had a risk profile similar to that of its benchmark. As such, there were no material contributors or detractors relative to the Fund’s benchmark during the period. |
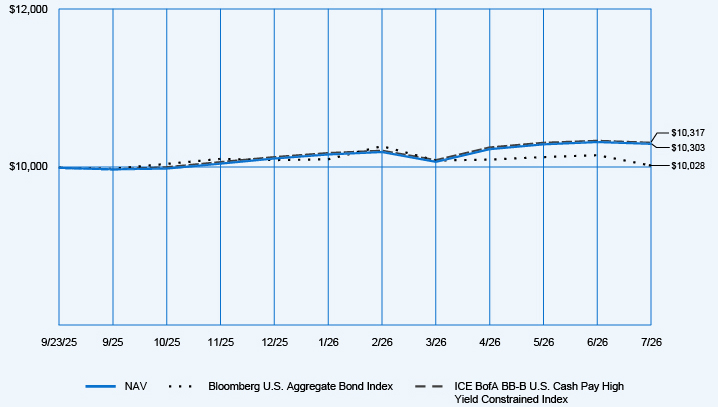
Cumulative Total Returns
| Since Inception (9/23/25) |
||||
| NAV |
3.03 | % | ||
| Bloomberg U.S. Aggregate Bond Index |
0.28 | % | ||
| ICE BofA BB‑B U.S. Cash Pay High Yield Constrained Index |
3.17 | % | ||
Fund Statistics (as of July 31, 2026)
| Fund net assets |
$ | 1,721,948,412 | ||
| Total number of portfolio holdings |
1,677 | |||
| Portfolio turnover (%) |
33% | |||
| Total management fees paid for the year |
$ | 951,743 | ||
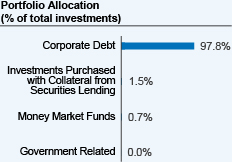 |
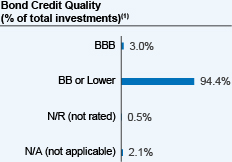 |
| (1) | The Fund uses credit quality ratings for its portfolio securities provided by Moody’s, S&P and Fitch. If all three of Moody’s, S&P, and Fitch provide a rating for a security, the middle is used; if two of the three agencies rate a security, the lower rating is used; and if only one rating agency rates a security, that rating is used. AAA, AA, A, and BBB are investment grade ratings; BB, B, CCC/CC/C and D are below-investment grade ratings. Credit ratings are subject to change. Holdings designated N/R are not rated by Moody’s, S&P or Fitch. |
How has the Fund changed?
Portfolio manager update(s): Effective January 23, 2026, Rui (Vivian) Liu, CFA was removed as a portfolio manager of the Fund.
For more complete information, you may review the Fund’s next prospectus, which is expected to be available by November 30, 2026 at https://www.nuveen.com/en‑us/exchange‑traded‑funds/prospectuses or upon request at (800) 257‑8787.
For more complete information, you may review the Fund’s next prospectus, which is expected to be available by November 30, 2026 at https://www.nuveen.com/en‑us/exchange‑traded‑funds/prospectuses or upon request at (800) 257‑8787.
| [1] | Annualized for period less than one year. |
| [2] | Annualized for period less than one year. |
| [3] | Annualized for period less than one year. |
| [4] | Annualized for period less than one year. |
| [5] | Annualized for period less than one year. |
| [6] | Annualized for period less than one year. |
| [7] | Annualized for period less than one year. |
| [8] | Annualized for period less than one year. |
| [9] | Annualized for period less than one year. |
| [10] | Annualized for period less than one year. |