Year |
SCT for PEO(1) |
CAP for PEO(2) | SCT for Non-PEO NEO(3) | CAP for Non-PEO NEO(4) | Fixed $100 Investment Based on TSR(5) | Net Income (in 000’s)(6) | ||||||||||||||||||||
| (a) | (b) | (c) | (d) | (e) | (f) | (g) | ||||||||||||||||||||
| 2026 | $ | 727,584 | $ | 1,124,023 | $ | 353,737 | $ | 521,452 | $ | 306.54 | $ | 13,662 | ||||||||||||||
| 2025 | $ | 652,951 | $ | 1,948,805 | $ | 357,825 | $ | 773,236 | $ | 225.65 | $ | 8,978 | ||||||||||||||
| 2024 | $ | 441,303 | $ | 397,475 | $ | 320,500 | $ | 328,349 | $ | 102.83 | $ | 2,127 | ||||||||||||||
| (1) | The dollar amounts reported in column (b) are the amounts of total compensation reported for Rick, our Chief Executive Officer, for each corresponding year in the “Total” column of the SCT. Refer to “Compensation of Executive Officers – Summary Compensation Table.” |
| (2) | The dollar amounts reported in column (c) represent the amount of CAP to Rick, as computed in accordance with Item 402(v) of Regulation S-K. The dollar amounts do not reflect the actual amount of compensation earned by or paid to Rick during the applicable year. In accordance with the requirements of Item 402(v) of Regulation S-K, the following adjustments were made to Rick’s total compensation as reported in the SCT for each year to determine the CAP: |
Year |
SCT Total for PEO | SCT Reported Equity Award Value for PEO | Equity Award Adjustments for PEO(A) | CAP to PEO | ||||||||||||||
| 2026 | $ | 727,584 | $ | — | $ | 396,439 | $ | 1,124,023 | ||||||||||
| 2025 | $ | 652,951 | $ | (47,630 | ) | $ | 1,343,484 | $ | 1,948,805 | |||||||||
| 2024 | $ | 441,303 | $ | — | $ | (43,828 | ) | $ | 397,475 | |||||||||
| (A) | Represents the year-over-year change in the fair value of equity awards to Rick as summarized below: |
Year |
Add: fair value of awards granted during FY at end of year |
Change in fair value of awards granted in any PY unvested at end of FY |
Add for awards granted and vested in the same FY the fair value as of vesting date |
Change in fair value as of vesting date of any awards from a PY vested in CY |
Subtract: Awards granted in any PY fail to meet vesting conditions during the year; value at end of PY |
Total Equity Award Adjustments | ||||||||||||||||||||
| 2026 | $ | — | $ | 399,799 | $ | — | $ | (3,360 | ) | $ | — | $ | 396,439 | |||||||||||||
| 2025 | $ | 43,640 | $ | 1,394,524 | $ | — | $ | (6,300 | ) | $ | (88,380 | ) | $ | 1,343,484 | ||||||||||||
| 2024 | $ | — | $ | 42,122 | $ | — | $ | — | $ | (85,950 | ) | $ | (43,828 | ) | ||||||||||||
| (3) | The dollar amounts reported in column (d) of the PvP table represent the amounts reported for Alisha, who is the Company’s only Non-PEO NEOs in the “Total” column of the SCT in each applicable year. Refer to “Compensation of Executive Officers – Summary Compensation Table.” |
| (4) | The dollar amounts reported in column (e) represent the amount of CAP to Alisha, as computed in accordance with Item 402(v) of Regulation S-K. The dollar amounts do not reflect the actual amount of compensation earned by or paid to Alisha during the applicable year. In accordance with the requirements of Item 402(v) of Regulation S-K, the following adjustments were made to Alisha’s total compensation as reported in the SCT for each year to determine the CAP: |
Year |
SCT for Alisha Charlton | SCT Reported Equity Award Value for Alisha Charlton | Equity Award Adjustments for Alisha Charlton(A) |
CAP to Alisha Charlton | ||||||||||||||
| 2026 | $ | 353,737 | $ | (30,830 | ) | $ | 198,545 | $ | 521,452 | |||||||||
| 2025 | $ | 357,825 | $ | (47,630 | ) | $ | 463,041 | $ | 773,236 | |||||||||
| 2024 | $ | 320,500 | $ | (20,070 | ) | $ | 27,919 | $ | 328,349 | |||||||||
| (A) | Represents the year-over-year change in the fair value of Alisha’s equity awards as summarized below: |
Year |
Add: fair value of awards granted during FY at end of year |
Change in fair value of awards granted in any PY unvested at end of FY |
Add for awards granted and vested in the same FY the fair value as of vesting date |
Change in fair value as of vesting date of any awards from a PY vested in CY |
Subtract: Awards granted in any PY fail to meet vesting conditions during the year; value at end of PY |
Total Equity Award Adjustments | ||||||||||||||||||||
| 2026 | $ | 58,550 | $ | 143,355 | $ | — | $ | (3,360 | ) | $ | — | $ | 198,545 | |||||||||||||
| 2025 | $ | 43,640 | $ | 451,867 | $ | — | $ | (6,688 | ) | $ | (25,778 | ) | $ | 463,041 | ||||||||||||
| 2024 | $ | 39,280 | $ | 13,708 | $ | — | $ | — | $ | (25,069 | ) | $ | 27,919 | |||||||||||||
| (5) | Cumulative total shareholder return (“TSR”) assumes $100 is invested in our Common Stock as of July 1, 2023. The TSR represents the cumulative value of the $100 investment as of the end of each fiscal year presented (each, a measurement period). Pursuant to SEC rules, TSR is calculated by dividing the sum of the cumulative amount of dividends for the measurement period, assuming dividend reinvestment, and the difference between the Company’s share price at the end and the beginning of the measurement period by the Company’s share price at the beginning of the measurement period. However, as the Company does not pay dividends, TSR in this proxy statement is calculated by dividing the difference between the Company’s share price at the end and the beginning of the measurement periods by the Company’s share price at the beginning of the measurement period. |
| (6) | The dollar amounts reported represent the amount of net income reflected in the Company’s audited financial statements for the applicable year. |
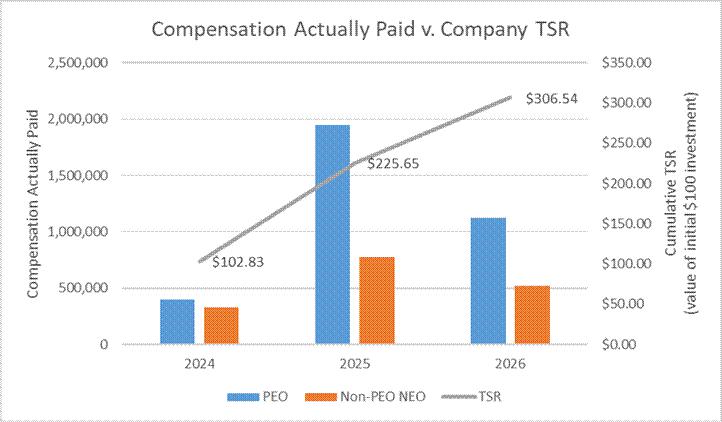
As demonstrated by the following graph, the amount of CAP for 2024, 2025 and 2026 is generally aligned with our TSR over the three years presented in the table. The alignment of CAP with our TSR over the period presented is because a significant portion of the CAP is comprised of equity awards. However, CAP in a particular year can fluctuate dramatically due to volatility of our stock price during the course of any fiscal year as well as the timing of equity award grants.
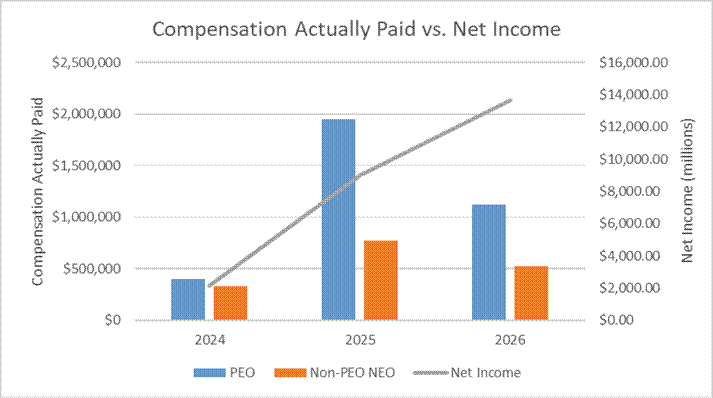
CAP and Net Income
As demonstrated by the following graph, the amount of CAP for 2024, 2025 and 2025 and is generally aligned with our net income over the three years presented in the table. However, as noted above, a significant portion of the CAP is comprised of equity awards, and therefore this may not always be the case.