What
were the Fund costs for the past year?
(based
on a hypothetical $10,000 investment)
|
Fund
Name |
Costs
of a $10,000 investment |
Costs
paid as a percentage of a $10,000 investment |
|---|---|---|
|
Matisse
Discounted Closed-End Fund Strategy |
$165 |
1.50% |
How did the Fund perform last year and what affected its performance?
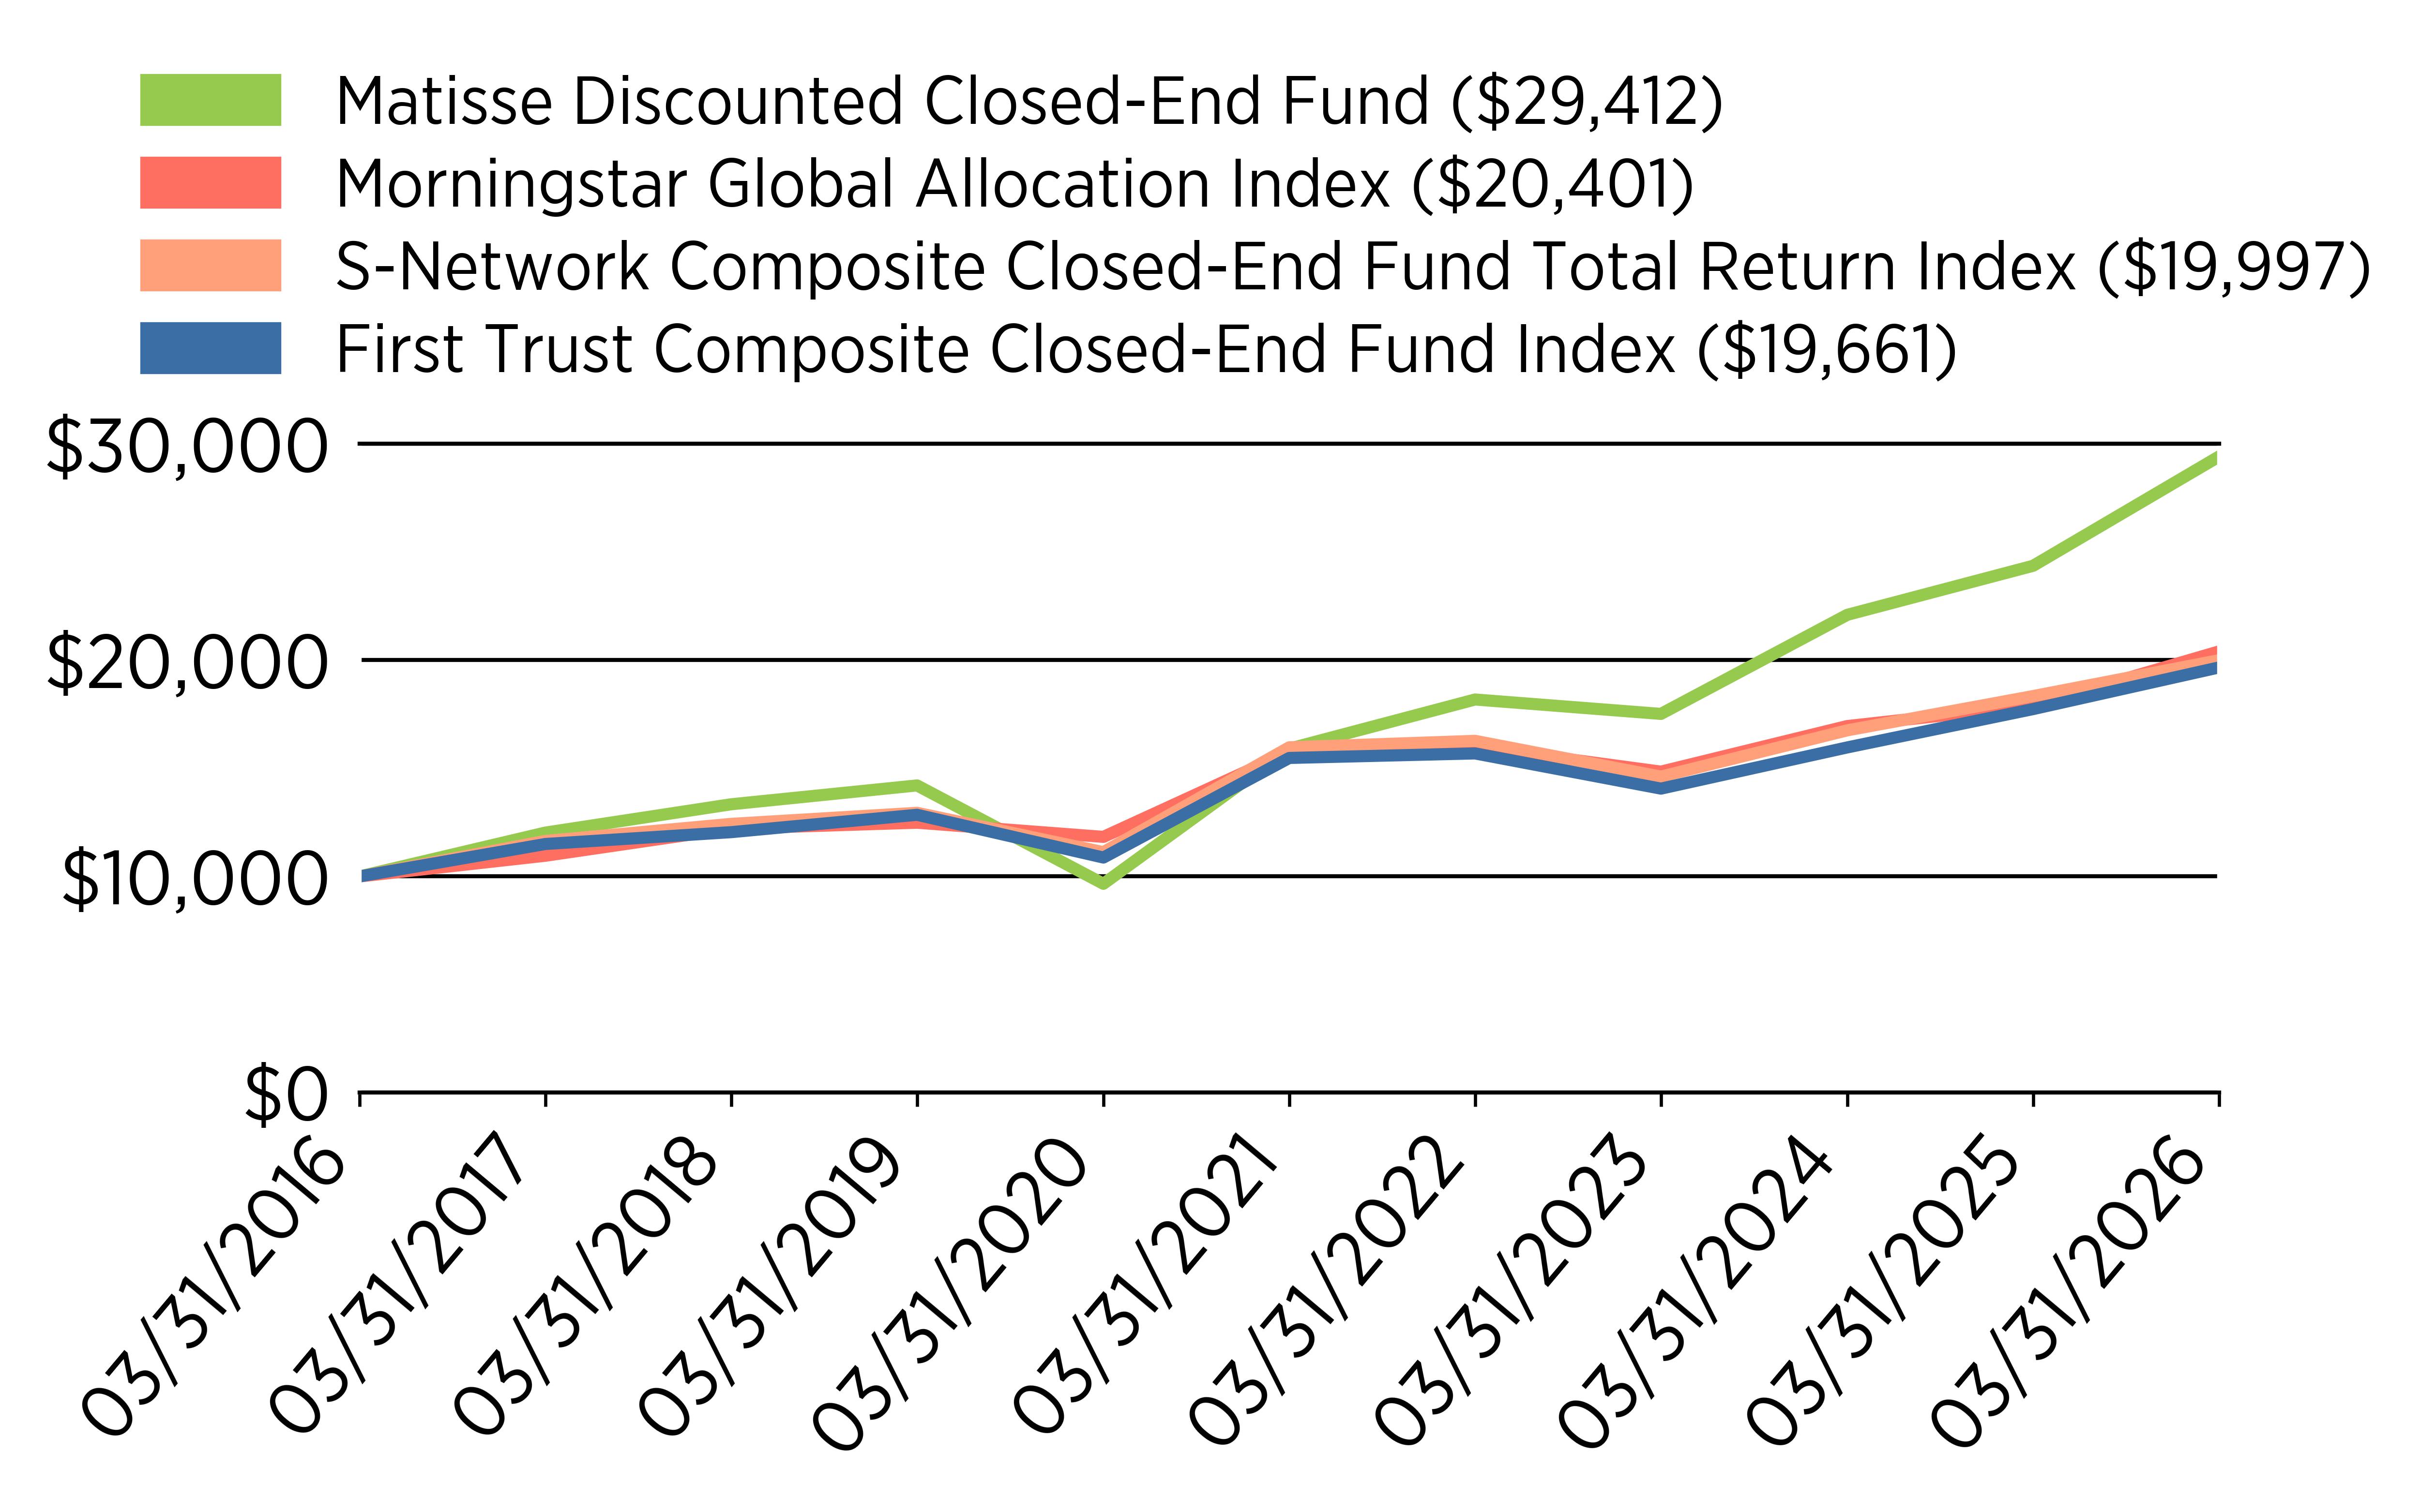
For the fiscal year ended March 31, 2026, the Fund returned 20.73%. It outperformed its primary benchmark, the Morningstar Global Allocation Index, which returned 13.96% for the period. It also outperformed the S-Network Composite Closed-End Fund Index and the First Trust Composite Closed-End Fund Index, which returned 9.05% and 10.85%, respectively, for the same period.
Stocks broadly outperformed bonds, and foreign stocks broadly outperformed US stocks during the period, both of which were positive contributing factors to the Fund’s outperformance, given our higher weight in these areas.
Overall, discounts in the closed-end fund universe were a headwind for our Fund’s performance during the period, as the average discount widened from -4.58% to -6.18%. However, our disciplined execution of our discount capture strategy paid off, as “discount capture” contributed +490 bps to our Fund performance during the period.
The three largest contributors to performance were:
• The Taiwan Fund, which gained +121.15%, primarily from underlying at-NAV performance, plus a slight narrowing of its discount.
• NexPoint Diversified Real Estate Trust, which gained +43.85%, as its discount narrowed from -76.52% to -55.98% even though its NAV declined.
• Korea Fund, which gained +133.73%, primarily from underlying at-NAV performance, plus a slight narrowing of its discount.
The three largest negative contributors to performance were:
• XAI Octagon Floating Rate & Alternative Income Trust, which lost -31.23% due to a combination of at-NAV decline and discount widening.
• Malibu Life Holdings, which lost -38.04%, primarily due to a sharp widening of its discount post its conversion from a Closed-End Fund (Third Point) to a life insurance operating company in September. As part of the conversion, the company tendered for some of its shares at a premium to the trading price, which our Fund was able to benefit from. At less than half of its NAV (book value), we see tremendous upside opportunity in Malibu Life, although there is of course no guarantee.
• FS Credit Opportunities, which lost -18.25% due to substantial discount widening, only partially offset by its positive at-NAV performance.
Even though the Fund had a very good year, we finish the fiscal year with our average holding at approximately a 27% discount to NAV… wider than a year ago! For each of our highly discounted holdings, our investment thesis centers around our expectation that those discounts will narrow substantially in the future.
How
did the Fund perform in the
last ten years?
The following graph compares the initial and subsequent account values at the end of the most recently completed fiscal years of the Fund. It assumes a $10,000 initial investment at the inception date of the Fund in an appropriate broad-based index that reflects the market sectors that the Fund invests in for the same period.
Average Annual Total Returns
(as of March 31, 2026)
|
|
1
Year |
5
Years |
10
Years |
|---|---|---|---|
|
Matisse
Discounted
Closed-End
Fund Strategy |
20.73% |
13.08% |
11.39% |
|
Morningstar
Global Allocation Index |
13.96% |
5.29% |
7.39% |
|
S-Network
Composite Closed-End Fund Index |
9.05% |
4.60% |
7.18% |
|
First
Trust Composite
Closed-End
Fund Index |
10.85% |
4.90% |
6.99% |
Key Fund Statistics
(as of March 31, 2026)
|
Net
Assets |
$64,879,254 |
|
Number
of Holdings |
37 |
|
Net
Advisory Fee |
$597,067 |
|
Portfolio
Turnover Rate |
31.38% |
What did the Fund invest in?
(as
of March
31, 2026)
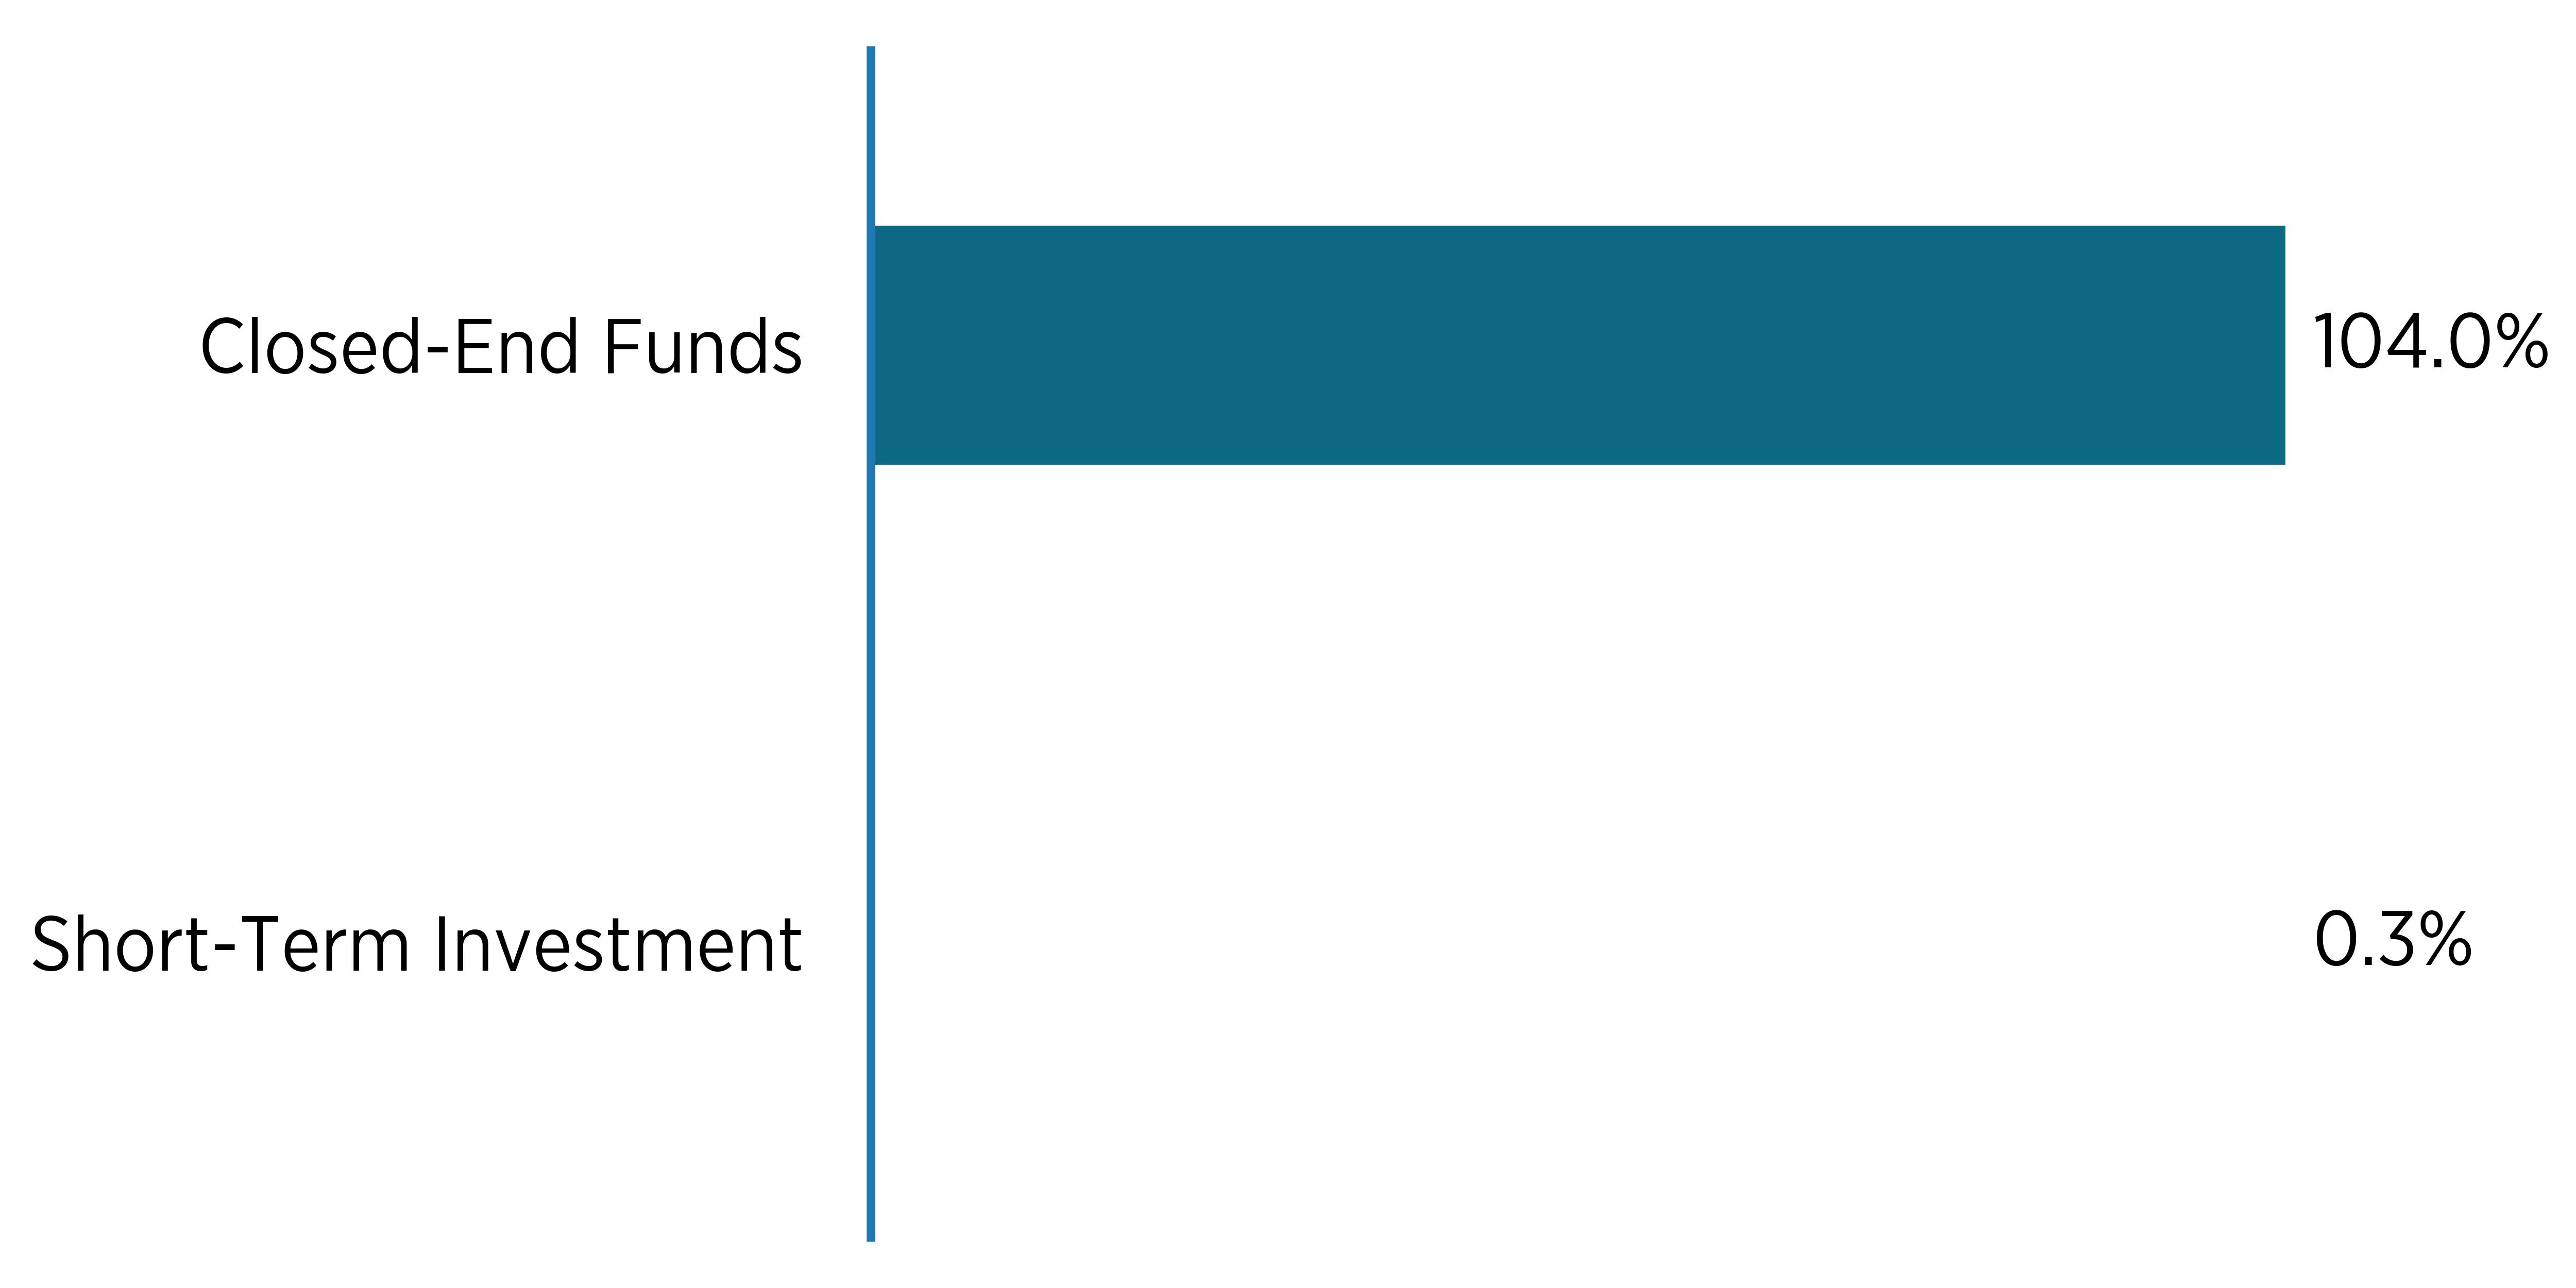
Breakdown by Security Type (% of net assets)
|
Top
Ten Holdings |
(%
of net assets) |
|---|---|
|
Tetragon
Financial Group Ltd |
|
|
NexPoint
Diversified Real Estate Trust |
|
|
Taiwan
Fund Inc/The/MD |
|
|
Pershing
Square Holdings Ltd/Fund |
|
|
Mexico
Fund Inc/The |
|
|
Bluerock
Private Real Estate Fund |
|
|
XAI
Octagon Floating Rate Alternative Income Trust |
|
|
Royce
Global Trust Inc |
|
|
BlackRock
Technology and Private Equity Term Trust |
|
|
FS
Credit Opportunities Corp |
What
were the Fund costs for the past year?
(based
on a hypothetical $10,000 investment)
|
Fund
Name |
Costs
of a $10,000 investment |
Costs
paid as a percentage of a $10,000 investment |
|---|---|---|
|
Matisse
Discounted Bond CEF Strategy |
$127 |
1.24% |
How did the Fund perform last year and what affected its performance?
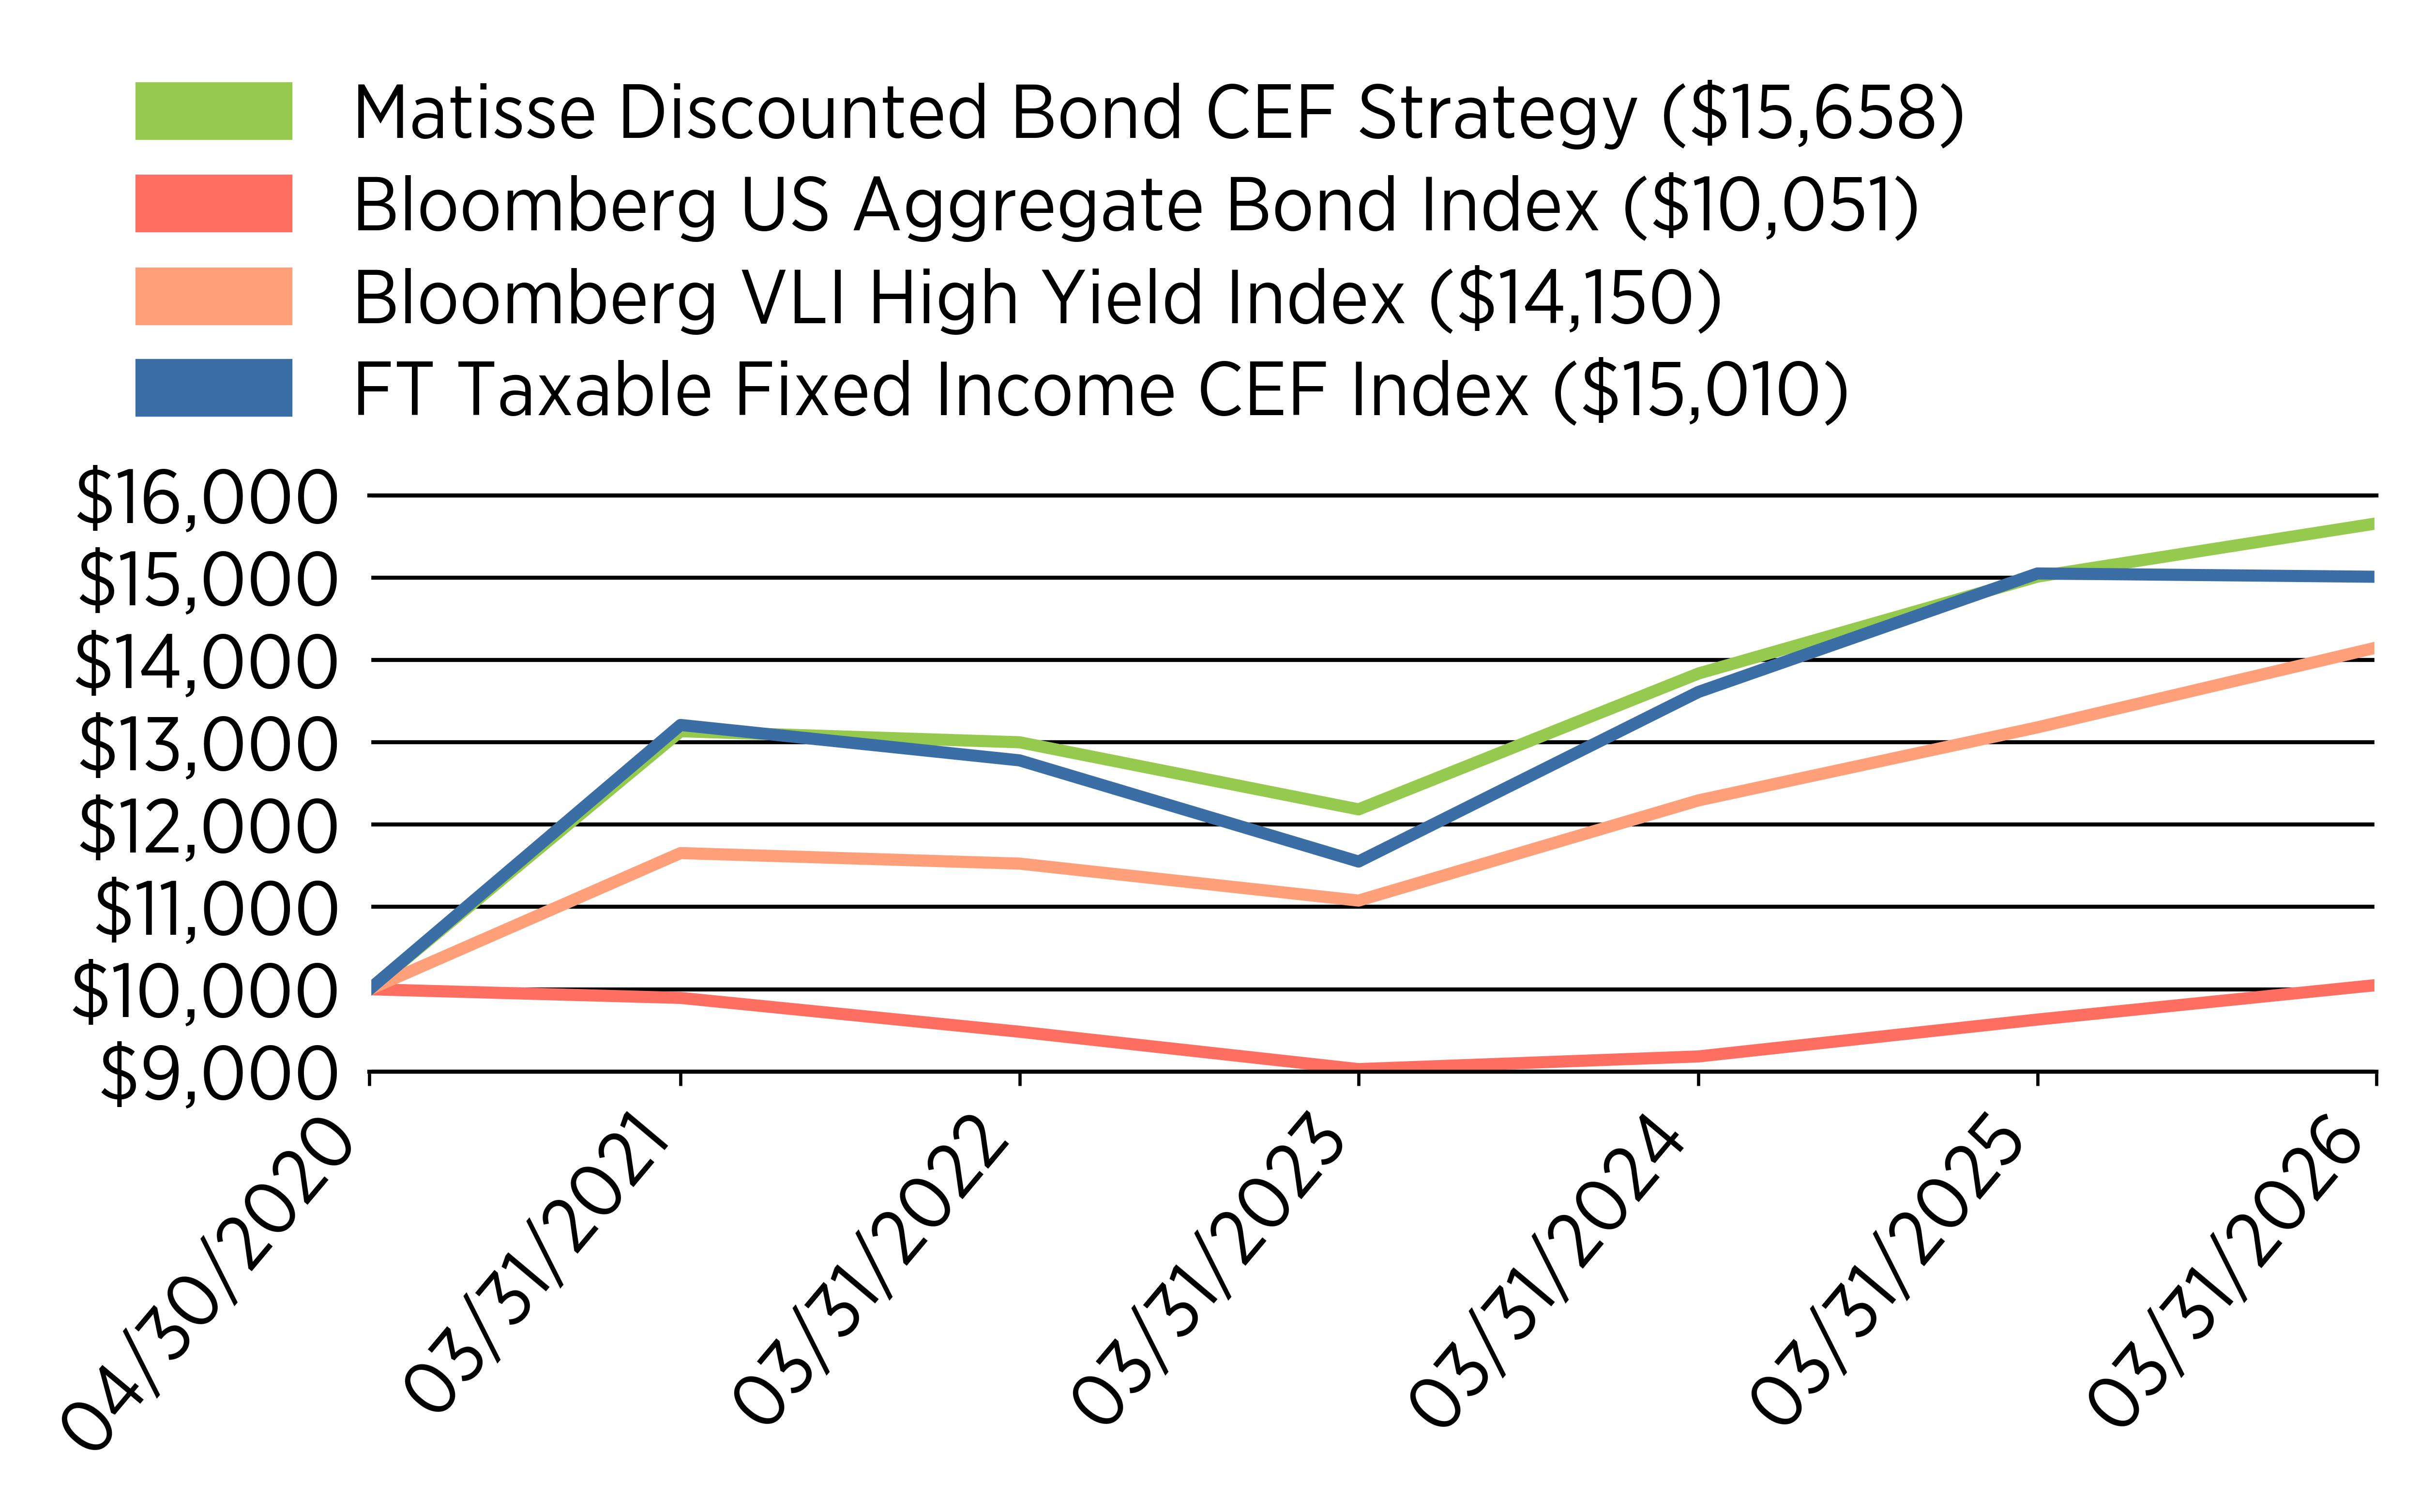
For the fiscal year ended March 31, 2026, the Fund returned 4.31%. It underperformed its primary benchmark, the Bloomberg U.S. Aggregate Bond Index, which returned 4.35% for the period. It underperformed the Bloomberg VLI HIgh Yield Index and outperformed the FT Taxable Fixed Income CEF Index, which returned 7.35% and -0.27%, respectively, for the period.
Our Fund’s longer duration (via a high exposure to long duration, high credit quality, Municipal Bond CEFs) was a headwind, as longer-term interest rates generally rose.
Overall, discounts in the bond closed-end fund universe were also a headwind during the period, as the average discount widened from -3.59% to -5.23%. However, our disciplined execution of our discount capture strategy paid off, as “discount capture” contributed +147 bps to our Fund performance during the period.
The three largest contributors to performance were:
• PIMCO California Municipal Income Fund, which gained +1.90%, primarily from at-NAV performance, partly offset by some discount widening. We obtained a much larger position as PIMCO California Municipal Income Fund merged together with some other PIMCO Municipal Bond CEFs we also owned.
• PIMCO New York Municipal Income Fund II, which gained +1.88%, primarily from at-NAV performance, partly offset by some discount widening. PNI, similarly to PCQ above, merged together with some other PIMCO Municipal Bond CEFs we also owned.
• Morgan Stanley Emerging Markets Domestic Debt Fund, which gained +18.73%, driven by at-NAV return partially offset by some discount widening.
The three largest negative contributors to performance were:
• XAI Octagon Floating Rate & Alternative Income Trust, which lost -31.23% due to a combination of at-NAV decline and discount widening. XFLT detracted -112 bps from Fund performance.
• PIMCO New York Municipal Income Fund, which lost -7.37% from 3/31/25 until August, when it was merged into PNI. This loss was driven primarily by at-NAV decline and in part by some discount widening.
• PIMCO California Municipal Income Fund II, which lost -5.06% from 3/31/25 until August, when it was merged into PCQ (see above). This loss was driven primarily by at-NAV decline offset by some discount narrowing.
Our elevated cash position helped reduce portfolio volatility and had a limited impact on returns, as money market yields were comparable to Fund performance. We believe the current environment is increasingly favorable. Recent dislocation in private credit markets has led to a wider opportunity set at more attractive valuations. The Fund’s weighted average discount has widened from -9.07% a year ago to -12.75% as of 3/31/26, improving prospective return potential.
How did the Fund perform since inception?
The following graph compares the initial and subsequent account values at the end of the most recently completed fiscal years of the Fund. It assumes a $10,000 initial investment at the inception date (April 30, 2020) of the Fund in an appropriate broad-based index that reflects the market sectors that the Fund invests in for the same period.
Average Annual Total Returns
(as of March 31, 2026)
|
|
1
Year |
5
Years |
Since
Inception |
|---|---|---|---|
|
Matisse
Discounted Bond CEF Strategy |
4.31% |
8.72% |
7.87% |
|
Bloomberg
U.S. Aggregate Bond |
4.35% |
3.63% |
0.09% |
|
Bloomberg
VLI High Yield Index |
7.35% |
8.50% |
6.04% |
|
FT
Taxable Fixed Income CEF Index |
-0.27% |
9.12% |
7.11% |
Key Fund Statistics
(as of March 31, 2026)
|
Net
Assets |
$53,013,282 |
|
Number
of Holdings |
28 |
|
Net
Advisory Fee |
$342,169 |
|
Portfolio
Turnover Rate |
62.71% |
What did the Fund invest in?
(as
of March
31, 2026)
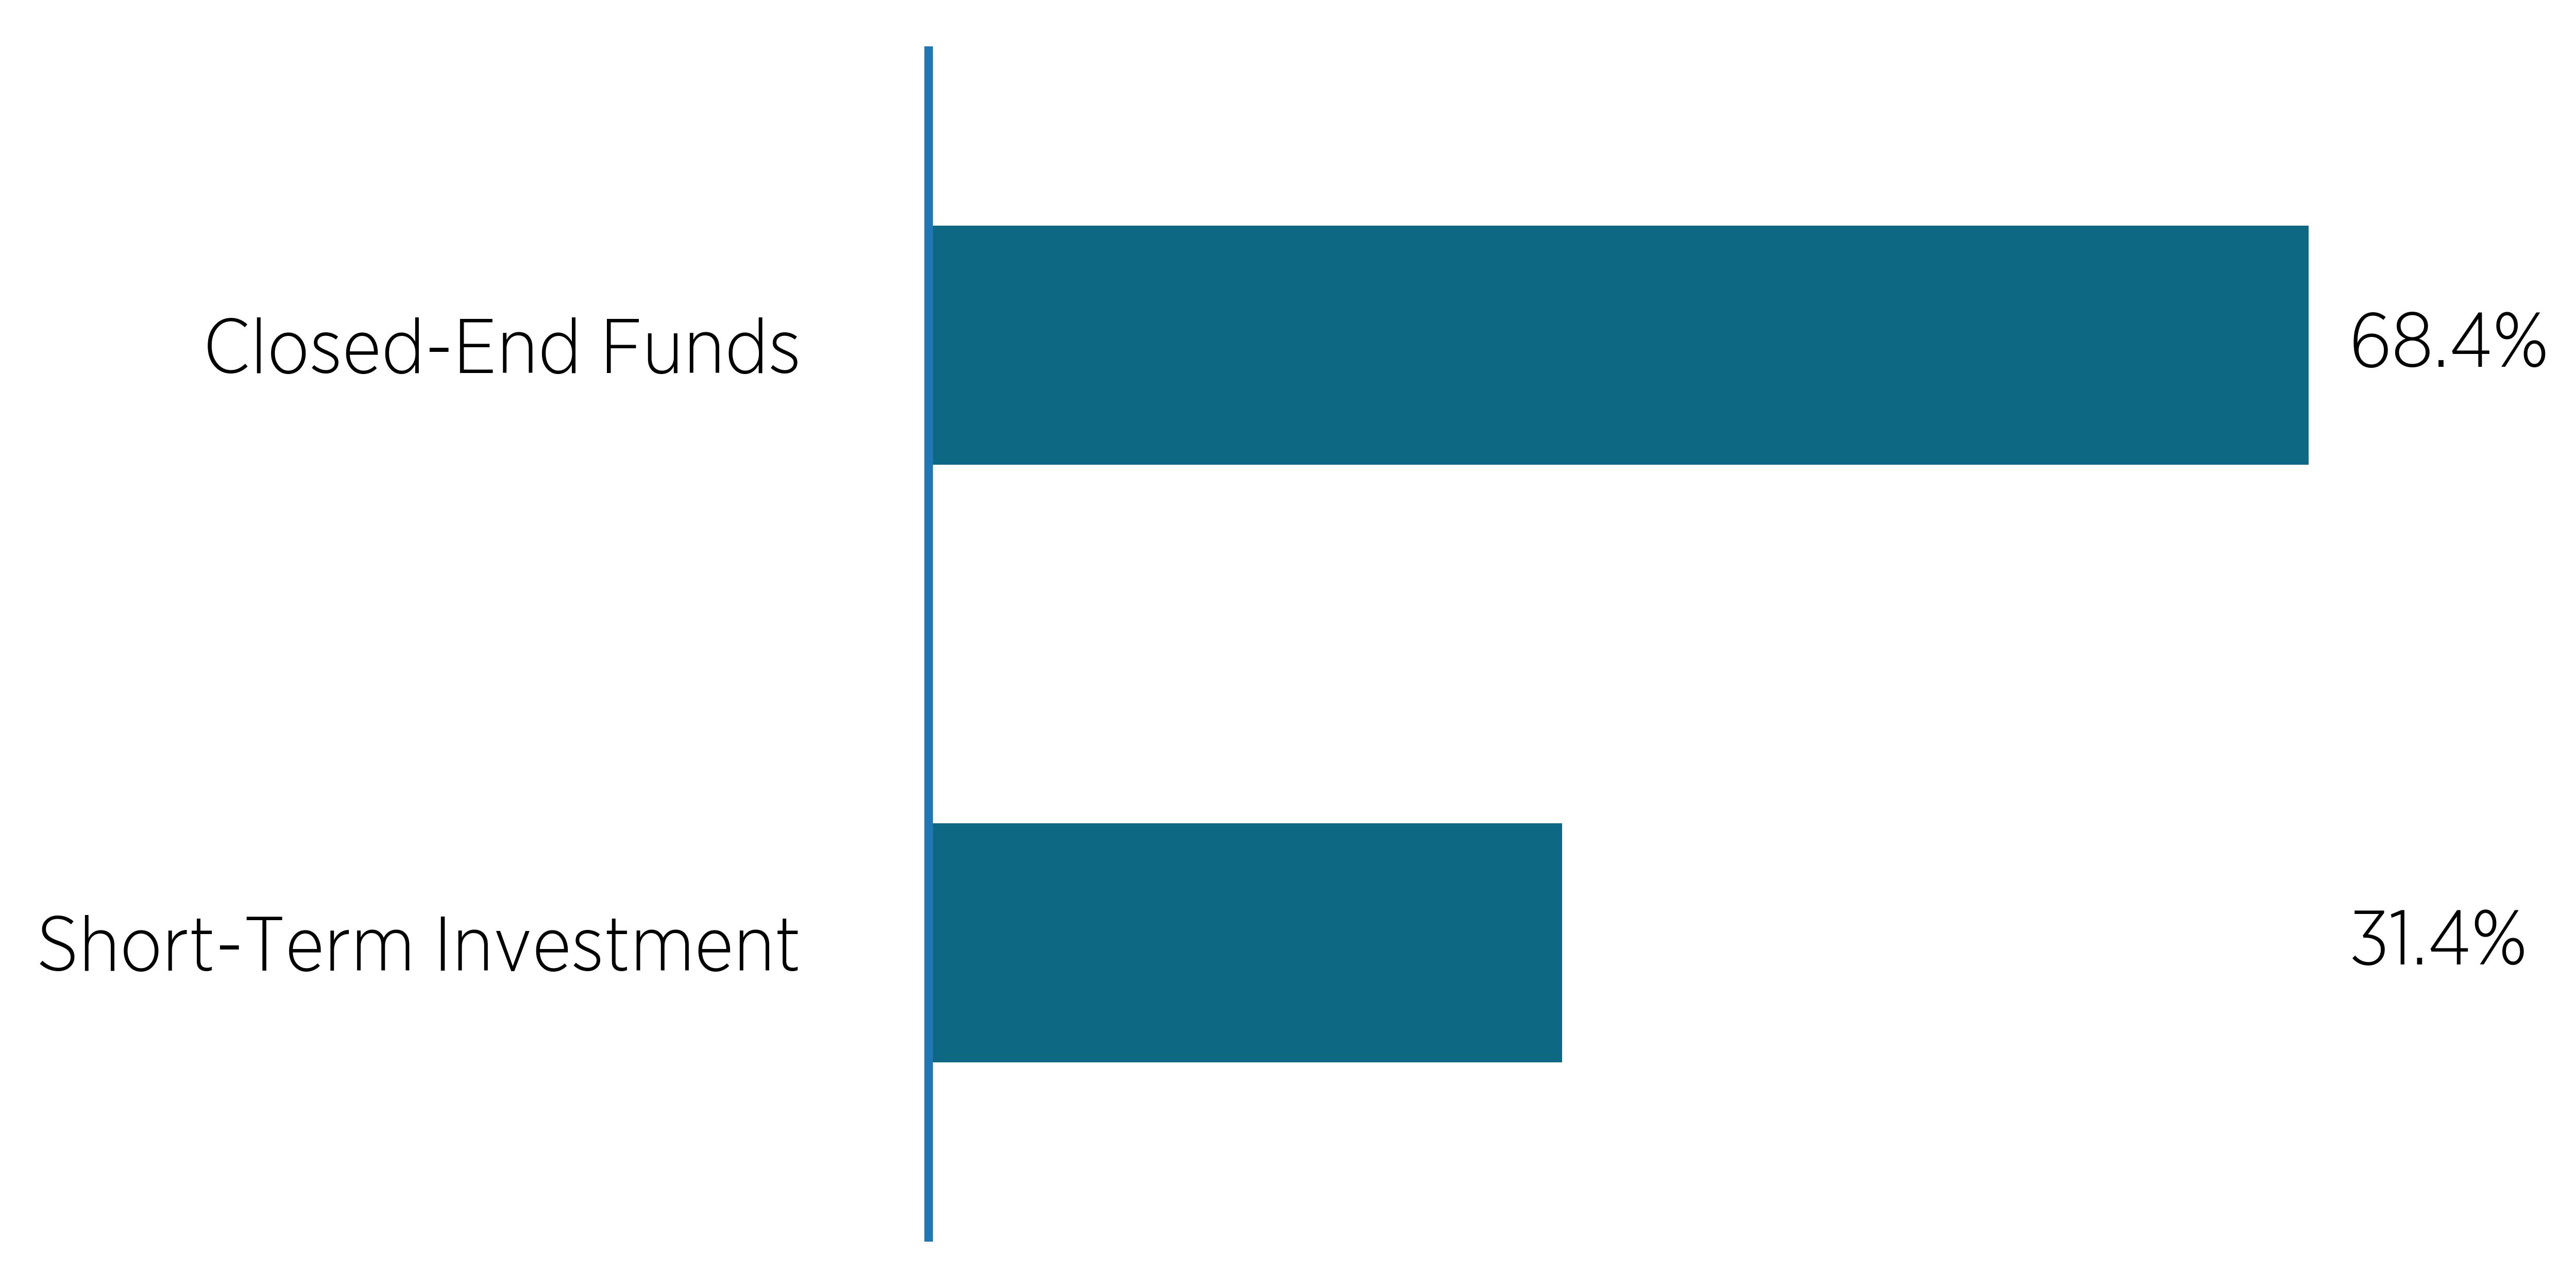
Breakdown by Security Type (% of net assets)
|
Top
Ten Holdings |
(%
of net assets) |
|---|---|
|
Fidelity
Government Portfolio |
|
|
PIMCO
California Municipal Income Fund |
|
|
PIMCO
New York Municipal Income Fund II |
|
|
FS
Credit Opportunities Corp |
|
|
XAI
Octagon Floating Rate Alternative Income Trust |
|
|
FS
Specialty Lending Fund |
|
|
Western
Asset Inflation-Linked Opportunities & Income Fund |
|
|
Invesco
Senior Income Trust |
|
|
Nuveen
Floating Rate Income Fund/Closed-end Fund |
|
|
Blackstone
Long-Short Credit Income Fund |