2027-2029 CAPTAIN OF FROZEN Analyst & Investor Day October 6th 2026

Disclaimer This Presentation has been prepared and issued by Nomad Foods Limited (the “Company”). This Presentation has been provided solely for information and background. The information in this Presentation is provided as at the date of the Presentation (unless stated otherwise). This Presentation does not constitute or form part of, and should not be construed as: (i) an offer, solicitation or invitation to subscribe for, sell or issue, underwrite or otherwise acquire any securities or financial instruments, nor shall it, or the fact of its communication, form the basis of, or be relied upon in connection with, or act as any inducement to enter into any contract or commitment whatsoever with respect to such securities or financial instruments, or (ii) any form of financial opinion, recommendation or investment advice with respect to any securities or financial instruments. The preliminary estimated financial results for the third quarter ended September 30, 2026 and full year ended December 31, 2026 included in this presentation are preliminary, unaudited and subject to completion, and may change as a result of management's continued review. Such preliminary results are subject to the finalization of quarter-end and year-end financial and accounting procedures. The preliminary financial results represent management estimates that constitute forward-looking statements subject to risks and uncertainties. As a result, the preliminary financial results may materially differ from the actual results when they are completed and publicly disclosed. Certain statements and matters discussed in this Presentation may constitute forward-looking statements. Forward-looking statements are statements that are not historical facts and may be identified by words such as “aim”, “anticipate”, “believe”, “continue”, “estimate”, “expect”, “intend”, “may”, “should”, “strategy”, “will” and words of similar meaning, including all matters that are not historical facts. This Presentation includes forward-looking statements about the Company’s expectations regarding: (i) its 2027-2029 value creation plan, (ii) its future operating and financial performance, including its expectations regarding sales trends, margins, capital expenditures, market share performance, and organic growth, (iii) its 2026 and 2027 guidance, including with respect to revenue, revenue growth, organic revenue, organic revenue growth, Adjusted free cash flow conversion, Adjusted free cash flow, Adjusted EBITDA, Adjusted EBITDA growth, Adjusted EPS and net debt, (iv) category and market growth, (v) its competitive advantages and expectations regarding food service, (vi) its projections for 2026 Adjusted EBITDA and revenue, and financial results for ice cream, (vii) its ability to deliver strong, sustainable financial results and create meaningful value for shareholders, (viii) its long term goal and ability to become a €4 billion company, (ix) its ability to expand its total addressable market, (x) its cost of capital and return on invested capital, (xi) its growth strategies, including, with respect to top and bottom-line growth, cash flows, earnings quality and sustainable, long-term growth, (xii) its ability to reduce leverage, improve market share and maximize shareholder returns, including through future dividends and share repurchases, (xiii) its marketing, renovation and innovation strategies and new product launches and expansions, (xiv) its capital expenditures, network capacity management, COGS productivity and savings targets,(xv) its 2027-2029 financial goals and targets, including its CAGR over the next three years, and (xvi) its capital allocation strategy. The forward-looking statements in this Presentation speak only as of the date hereof and are based upon various assumptions, many of which are based, in turn, upon further assumptions. Although the Company believes that these assumptions were reasonable when made, these assumptions are inherently subject to significant known and unknown risks, uncertainties, contingencies and other important factors which are difficult or impossible to predict and are beyond the Company’s control. These statements are not guarantees of future performance and are subject to known and unknown risks, uncertainties and other factors that could cause actual results to differ materially from those expressed or implied by such forward-looking statements, including: (i) the Company’s ability to effectively mitigate factors that negatively impact its supply of raw materials, including the conflict in Ukraine and the Middle East; (ii) the Company’s ability to successfully mitigate inflationary changes in the market, (iii) disruptions or inefficiencies in the Company’s operations or supply chain, including as a result of the conflict in Ukraine and the Middle East or trade conflicts; (iv) the Company’s ability to successfully implement its strategies or strategic initiatives and recognize the anticipated benefits of such strategic initiatives; (v) innovations introduced to the markets and the Company’s ability to accurately forecast the brands’ performance; (vi) the Company’s ability to effectively compete in its markets, including the ability capture a greater share of the frozen food market; (vii) changes in consumer preferences, such as meat substitutes, and the Company’s failure to anticipate and respond to such changes or to successfully develop and renovate products; (viii) the impact of weather conditions, natural disasters, and other factors beyond the Company’s control on the Company’s business, suppliers, co-manufacturers, distributors, transportation or logistics providers, customers, consumers and employees, and the Company’s ability to maintain the health and safety of its workforce; (ix) the effects of reputational damage from unsafe or poor quality food products; (x) increases in operating costs, including labor costs, and the Company’s ability to manage its cost structure; (xi) fluctuations in the availability of food ingredients and packaging materials that the Company uses in its products; (xii) the Company’s ability to protect its brand names and trademarks; (xiii) the Company’s ability to prevent, or remediate, any future cybersecurity incidents; (xiv) the loss of any of the Company’s major customers or a decrease in demand for its products; (xv) economic conditions that may affect the Company’s future performance including exchange rate fluctuations and trade conflicts; (xvi) the Company’s ability to remediate any material weaknesses in its internal control over financial reporting; (xvii) the Company’s ability to effectively execute its comprehensive value creation plan and other strategic initiatives; (xviii) the Company’s ability to hire, retain and motivate key employees and top tier talent; and (xix) the other risks and uncertainties disclosed in the Company’s public filings and any other public disclosures by the Company. Given these risks and uncertainties, prospective investors are cautioned not to place undue reliance on forward-looking statements. Other than in accordance with its legal or regulatory obligations, the Company is not under any obligation and the Company and its affiliates expressly disclaim any intention, obligation or undertaking to update or revise any forward-looking statements, whether as a result of new information, future events or otherwise. This Presentation shall not, under any circumstances, create any implication that there has been no change in the business or affairs of the Company since the date of this Presentation or that the information contained herein is correct as at any time subsequent to its date. No statement in this Presentation is intended as a profit forecast or estimate. Unless otherwise indicated, market and competitive position data in this Presentation has been published by Nielsen or Euromonitor. Given this data has been obtained from industry publications and surveys or studies conducted by third-party sources, there are limitations with respect to the availability, accuracy, completeness and comparability of such data. The Company has not independently verified such data, can provide no assurance of its accuracy or completeness and is not under any obligation to update, complete, revise or keep current the information contained in this Presentation. Certain statements in this document regarding the market and competitive position data are based on the internal analyses of the Company, which involves certain assumptions and estimates. These internal analyses have not been verified by any independent sources and there can be no assurance that the assumptions or estimates are accurate. This Presentation includes certain additional key performance indicators which are considered non-IFRS financial measures including, but not limited to, organic revenue, organic revenue growth/decline, Adjusted EBITDA, Adjusted EPS, Adjusted EPS growth, Adjusted EBITDA growth, Adjusted gross margin, Adjusted Free Cash Flow, Free Cash Flow, Free Cash Flow Conversion and net debt. Nomad Foods believes these non-IFRS financial measures provide an important alternative measure with which to monitor and evaluate the Company’s ongoing financial results, as well as to reflect its acquisitions. Nomad Foods’ calculation of these financial measures maybe different from the calculations used by other companies and comparability may therefore be limited. You should not consider the Company’s non-IFRS financial measures an alternative or substitute for the Company’s reported results. For a reconciliation of Adjusted EBITDA, organic revenue growth/decline, Adjusted Free Cash Flow and Free Cash Flow to the most directly comparable IFRS measures, refer to the Appendix to this Presentation. The Company is unable to reconcile, without unreasonable efforts, organic revenue, organic revenue growth/decline, Free Cash Flow, Adjusted free cash flow conversion, Adjusted EBITDA, Adjusted EBITDA growth, net debt and Adjusted EPS guidance to the most directly comparable IFRS measures. 2
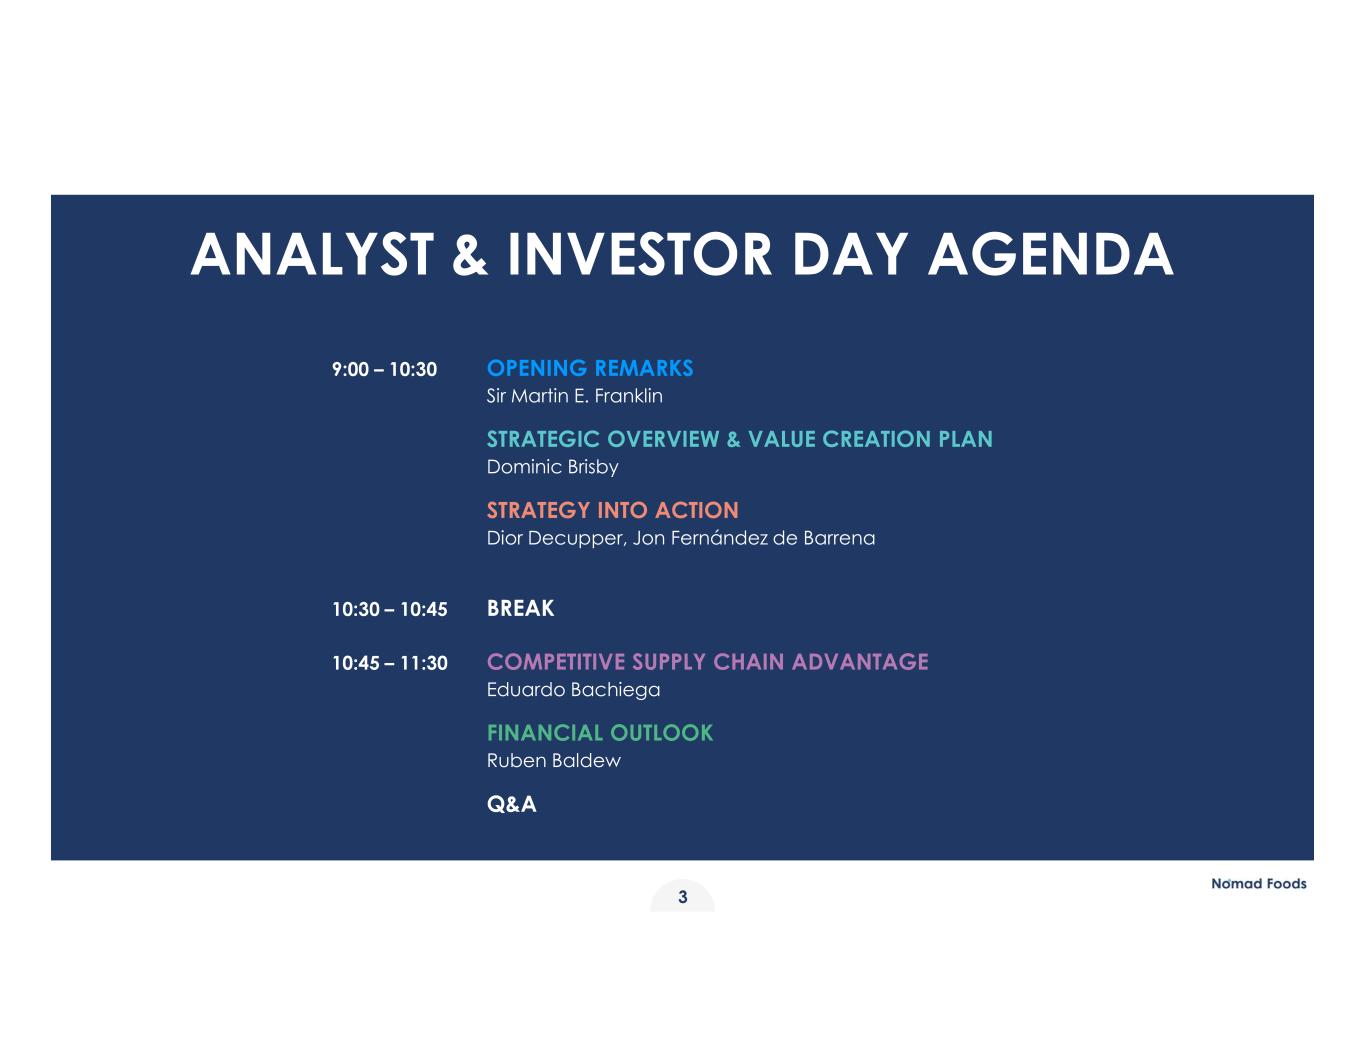
3 ANALYST & INVESTOR DAY AGENDA 9:00 – 10:30 OPENING REMARKS Sir Martin E. Franklin STRATEGIC OVERVIEW & VALUE CREATION PLAN Dominic Brisby STRATEGY INTO ACTION Dior Decupper, Jon Fernández de Barrena 10:30 – 10:45 BREAK 10:45 – 11:30 COMPETITIVE SUPPLY CHAIN ADVANTAGE Eduardo Bachiega FINANCIAL OUTLOOK Ruben Baldew Q&A
4 OPENING REMARKS Sir Martin E. Franklin
5 STRATEGIC OVERVIEW & VALUE CREATION PLAN Dominic Brisby
video 6
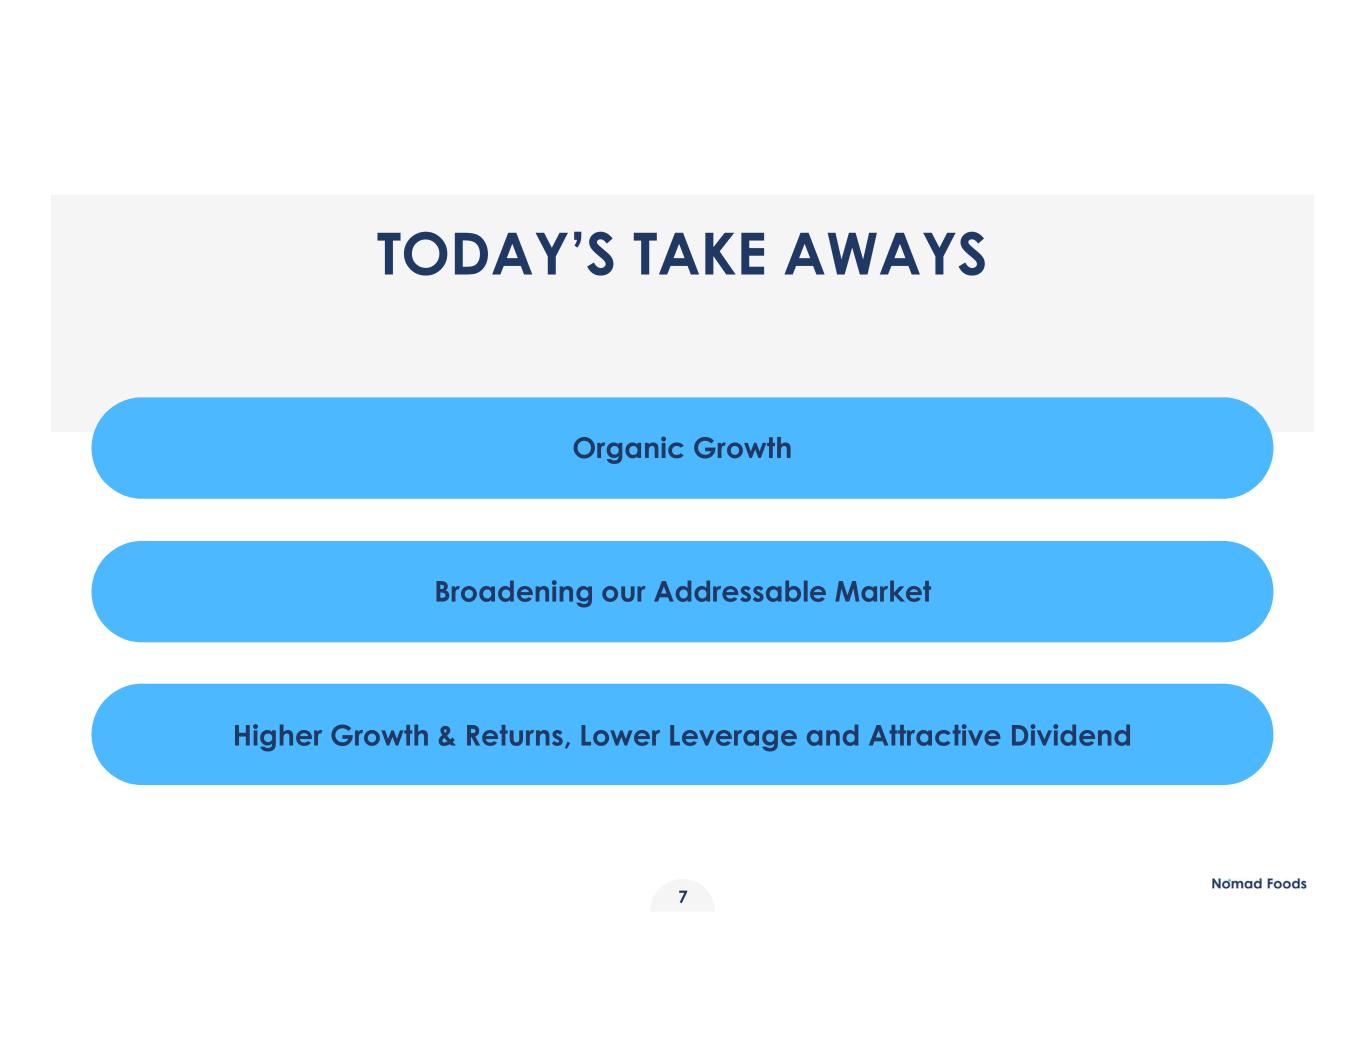
7 Higher Growth & Returns, Lower Leverage and Attractive Dividend TODAY’S TAKE AWAYS Organic Growth Broadening our Addressable Market
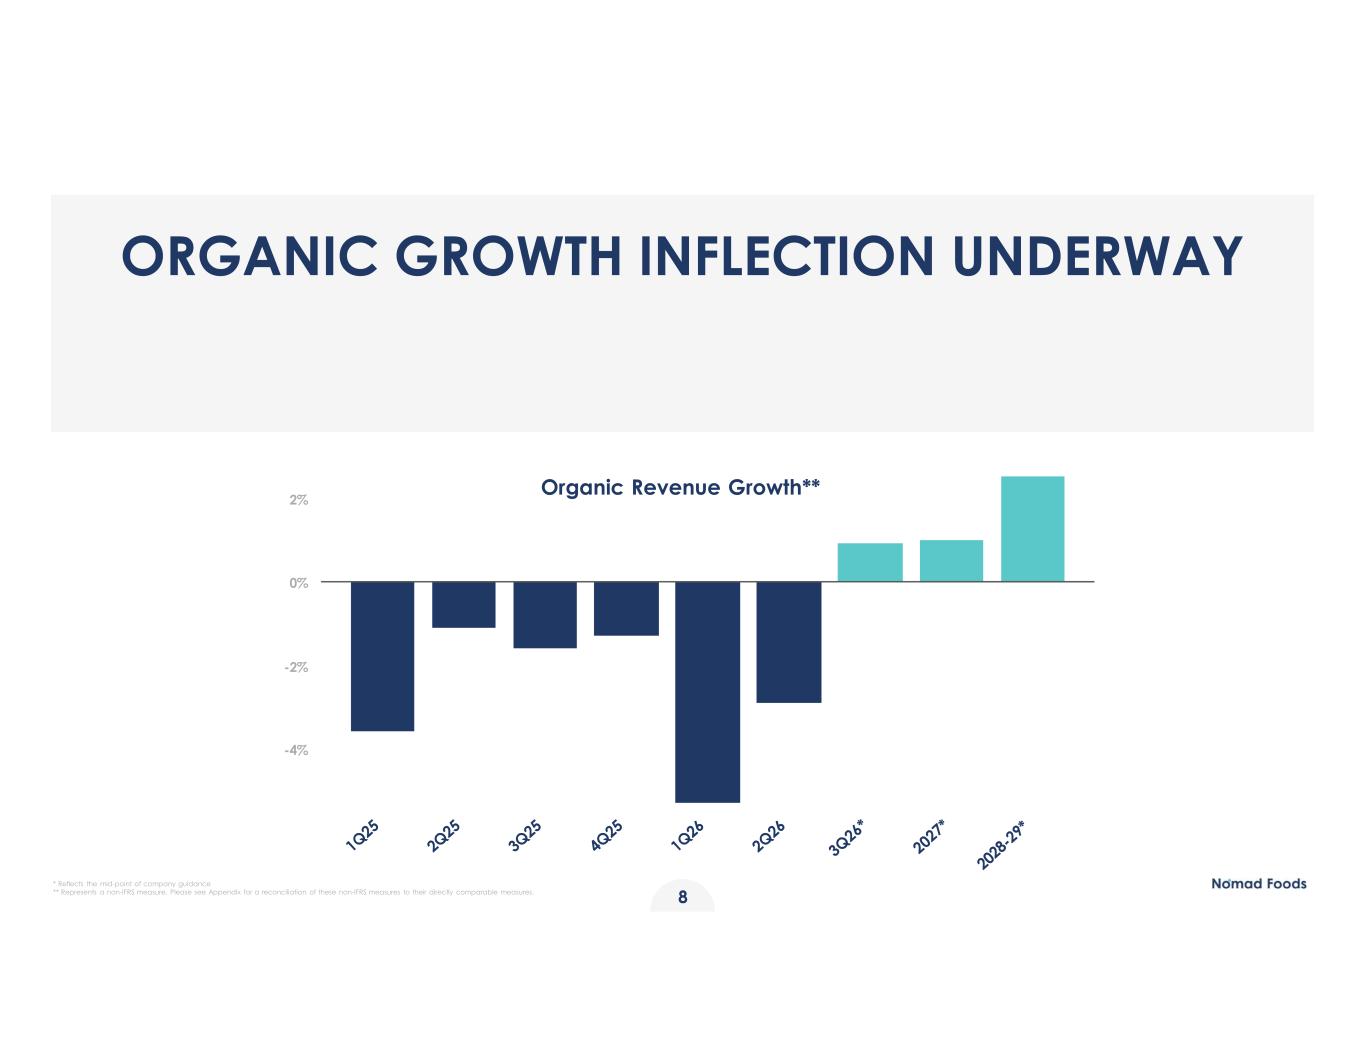
SMALLEST TITLE 8 ORGANIC GROWTH INFLECTION UNDERWAY Organic Revenue Growth** -4% -2% 0% 2% * Reflects the mid-point of company guidance ** Represents a non-IFRS measure. Please see Appendix for a reconciliation of these non-IFRS measures to their directly comparable measures.
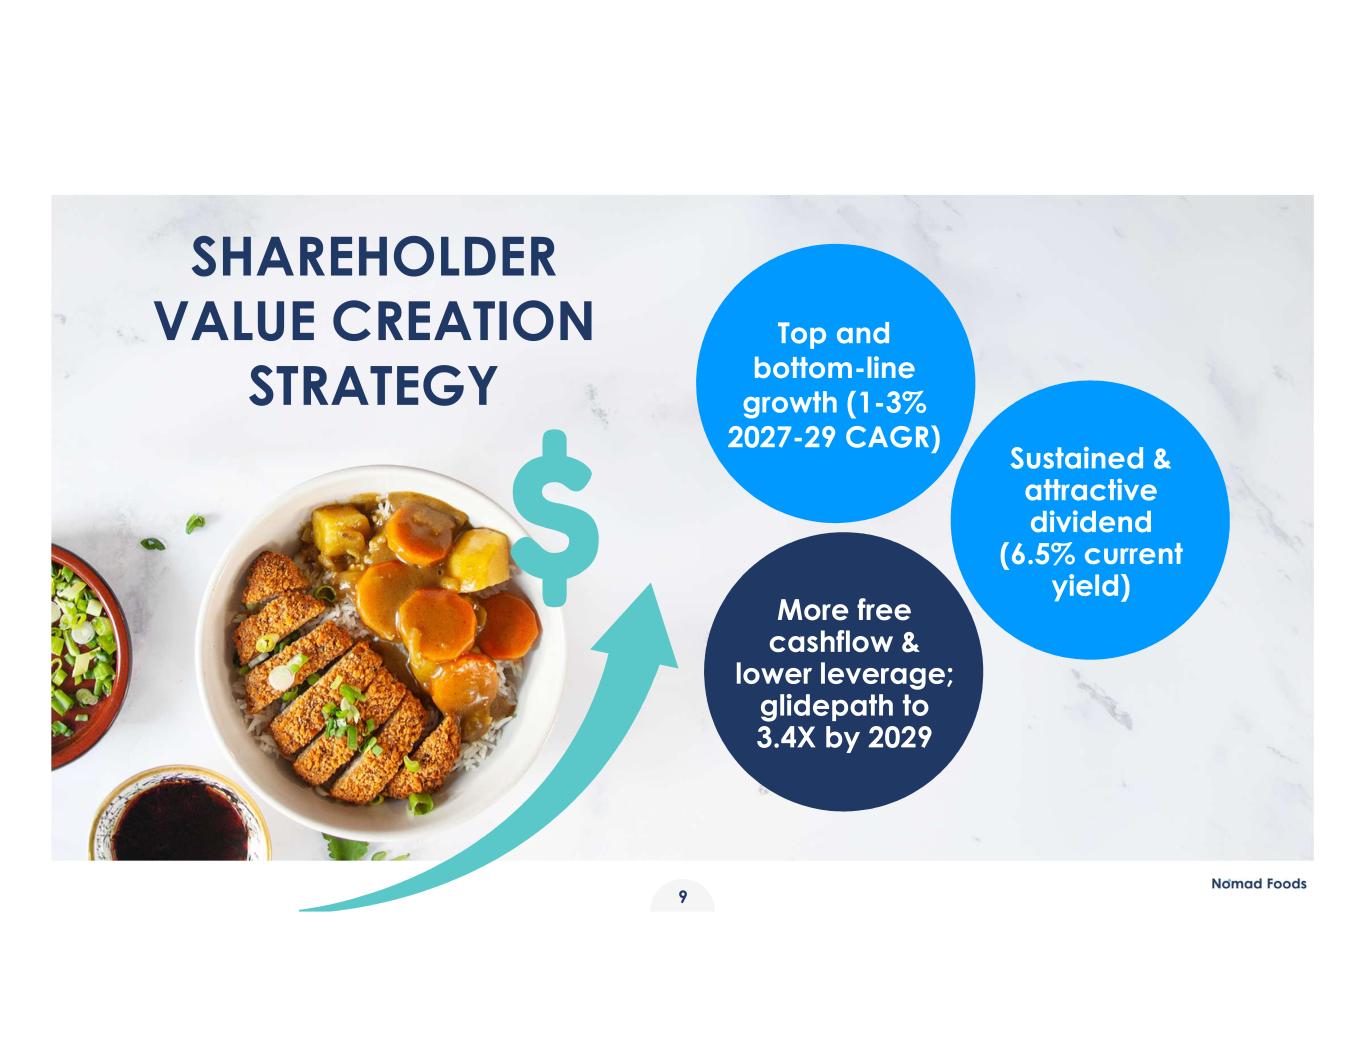
SHAREHOLDER VALUE CREATION STRATEGY More free cashflow & lower leverage; glidepath to 3.4X by 2029 Top and bottom-line growth (1-3% 2027-29 CAGR) Sustained & attractive dividend (6.5% current yield) 9
10 CLEAR MARKET LEADER
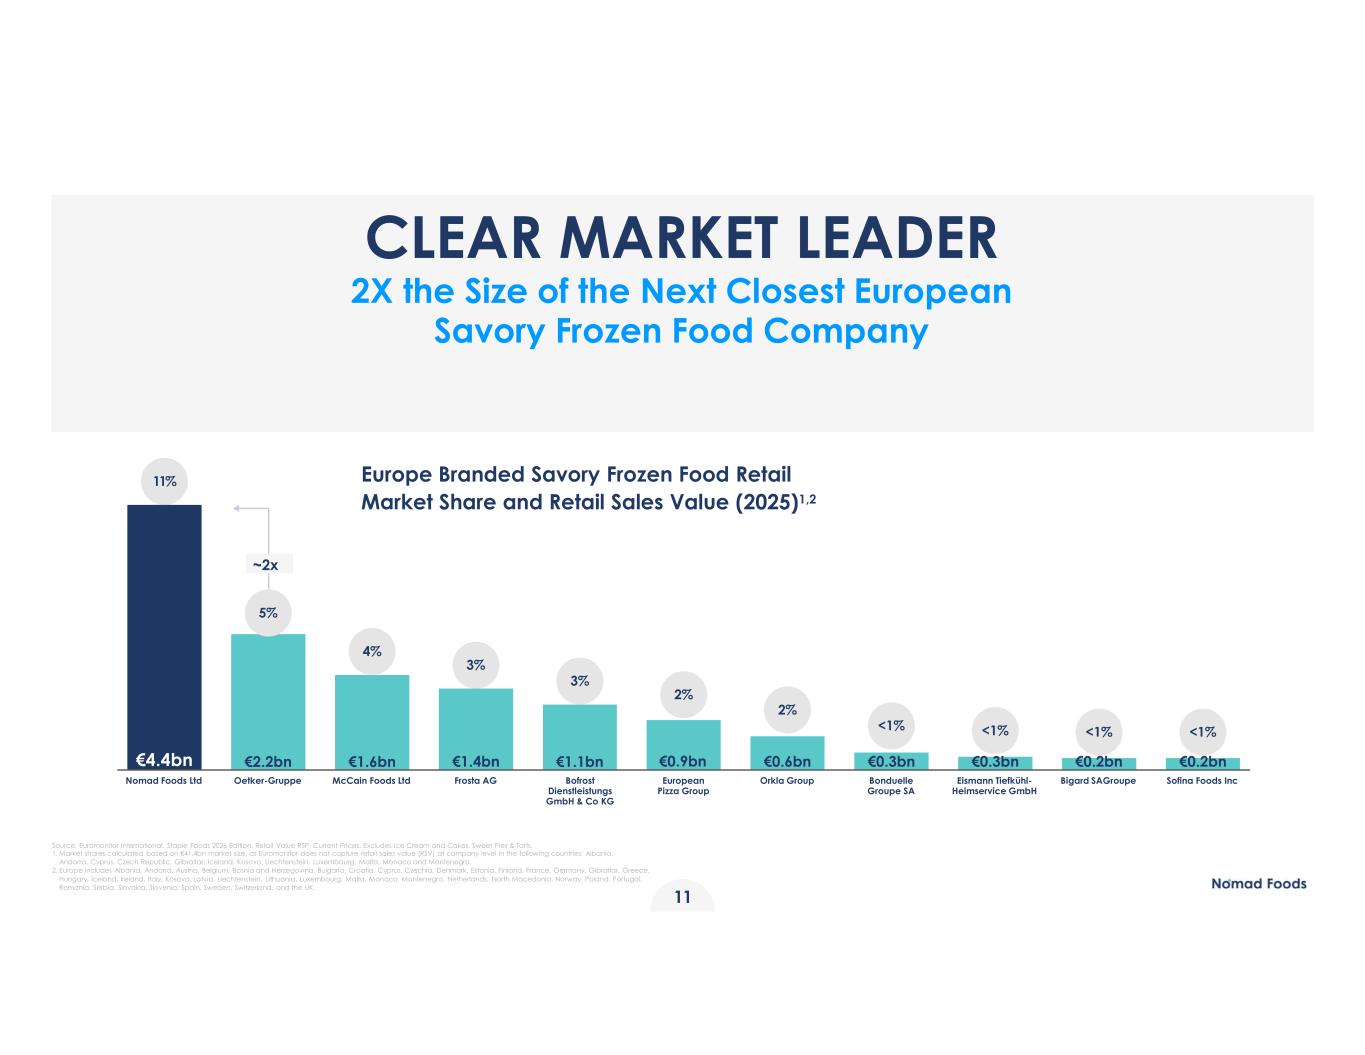
Source: Euromonitor International, Staple Foods 2026 Edition, Retail Value RSP, Current Prices. Excludes Ice Cream and Cakes, Sweet Pies & Tarts. 1. Market shares calculated based on €41.4bn market size, as Euromonitor does not capture retail sales value (RSV) at company level in the following countries: Albania, Andorra, Cyprus, Czech Republic, Gibraltar, Iceland, Kosovo, Liechtenstein, Luxembourg, Malta, Monaco and Montenegro. 2. Europe includes Albania, Andorra, Austria, Belgium, Bosnia and Herzegovina, Bulgaria, Croatia, Cyprus, Czechia, Denmark, Estonia, Finland, France, Germany, Gibraltar, Greece, Hungary, Iceland, Ireland, Italy, Kosovo, Latvia, Liechtenstein, Lithuania, Luxembourg, Malta, Monaco, Montenegro, Netherlands, North Macedonia, Norway, Poland, Portugal, Romania, Serbia, Slovakia, Slovenia, Spain, Sweden, Switzerland, and the UK. Europe Branded Savory Frozen Food Retail Market Share and Retail Sales Value (2025)1,2 2% 2% <1% 3% <1% <1% <1% Nomad Foods Ltd Oetker-Gruppe McCain Foods Ltd Frosta AG Bofrost Dienstleistungs GmbH & Co KG European Pizza Group Orkla Group Bonduelle Groupe SA Eismann Tiefkühl- Heimservice GmbH Bigard SAGroupe Sofina Foods Inc €4.4bn €2.2bn €1.6bn €1.4bn €1.1bn €0.9bn €0.6bn €0.3bn €0.3bn €0.2bn €0.2bn ~2x 11% 5% 4% 3% CLEAR MARKET LEADER 2X the Size of the Next Closest European Savory Frozen Food Company 11
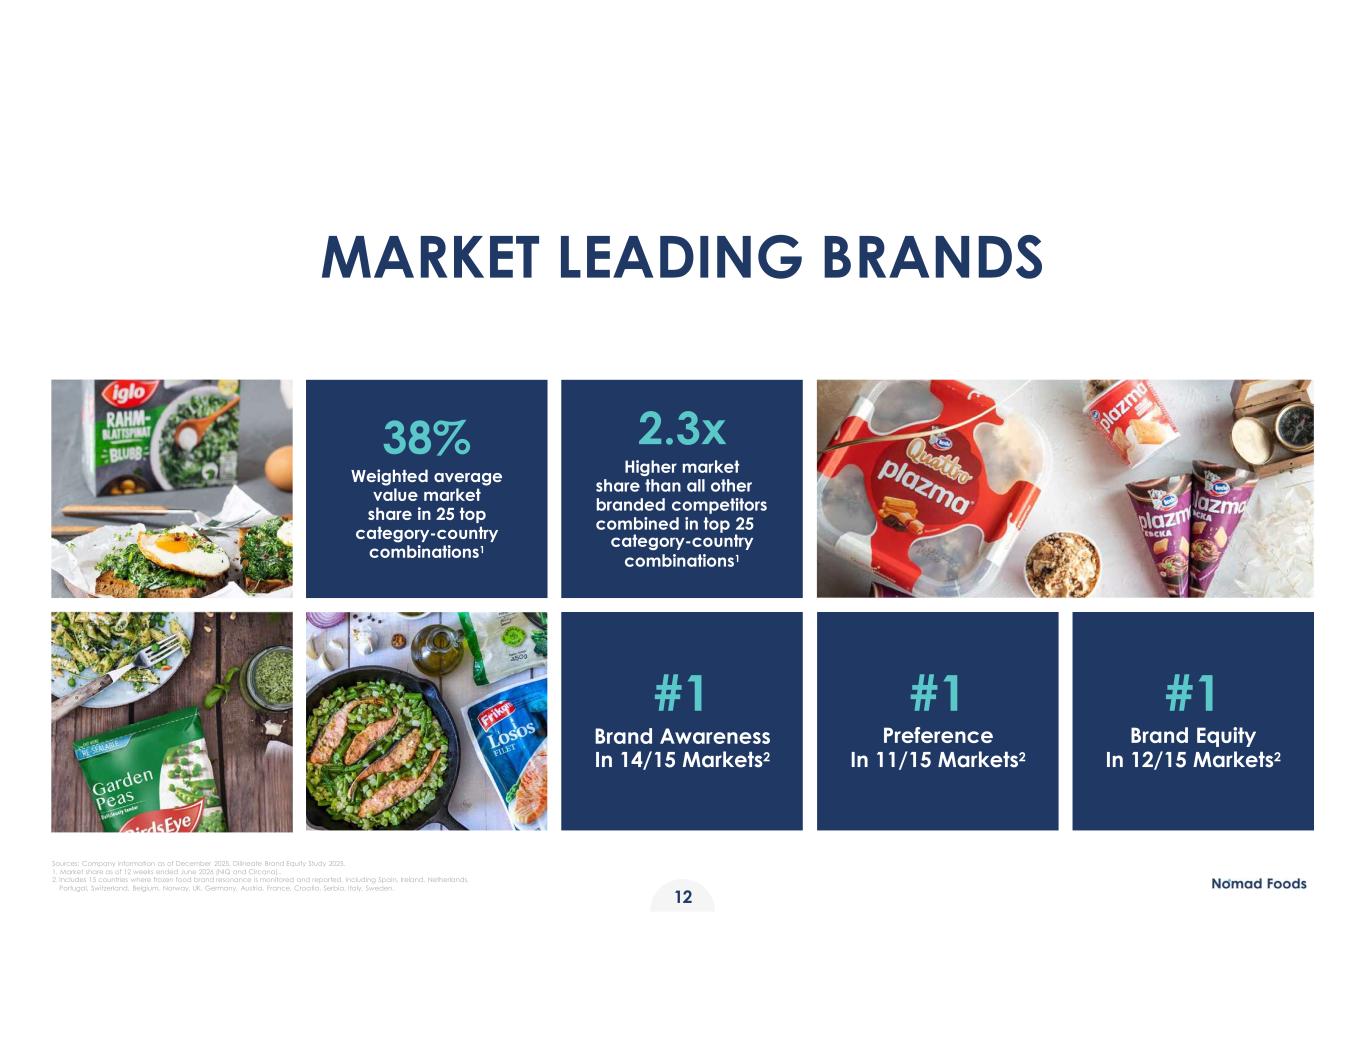
MARKET LEADING BRANDS 38% Weighted average value market share in 25 top category-country combinations1 2.3x Higher market share than all other branded competitors combined in top 25 category-country combinations1 #1 Preference In 11/15 Markets2 #1 Brand Awareness In 14/15 Markets2 #1 Brand Equity In 12/15 Markets2 Sources: Company information as of December 2025, Dilineate Brand Equity Study 2025. 1. Market share as of 12 weeks ended June 2026 (NIQ and Circana).. 2. Includes 15 countries where frozen food brand resonance is monitored and reported, including Spain, Ireland, Netherlands, Portugal, Switzerland, Belgium, Norway, UK, Germany, Austria, France, Croatia, Serbia, Italy, Sweden. 12
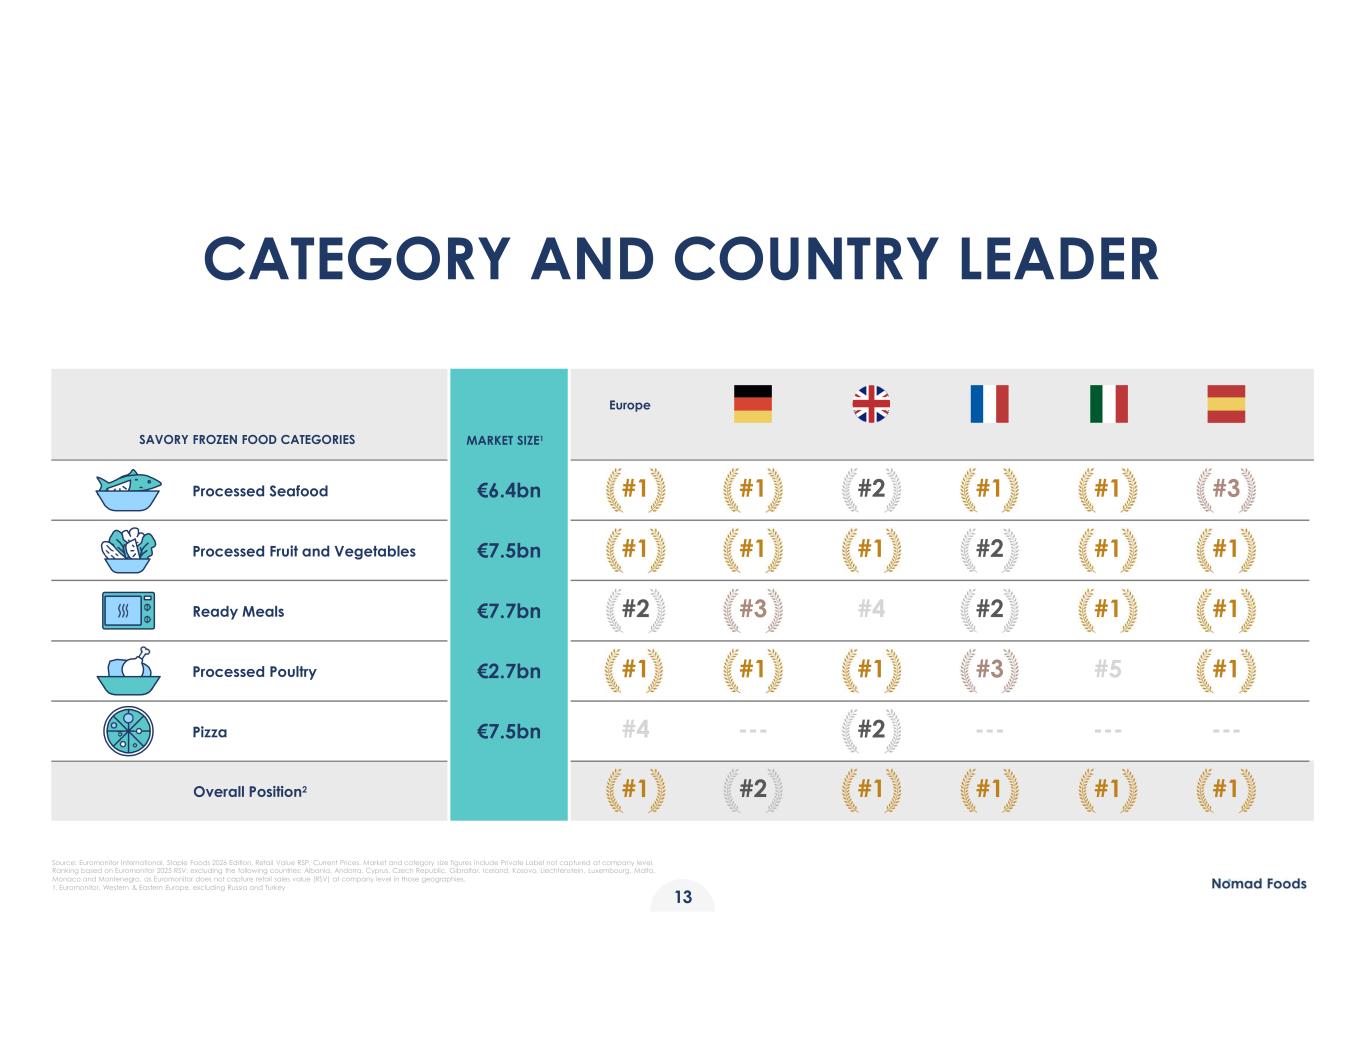
CATEGORY AND COUNTRY LEADER Processed Seafood Ready Meals Processed Poultry Pizza Overall Position2 €6.4bn €7.7bn €7.5bn €2.7bn #5 --- #1 #1 #1 #4 #1 #1 #1 #2 --- #1 #1 #2 #3 --- #1 #1 #1 #3 --- #1 #1 #3 #2#4 MARKET SIZE1SAVORY FROZEN FOOD CATEGORIES Europe #1 #1 #2 #2 Processed Fruit and Vegetables €7.5bn #1#1 #1 #1#2#1 13 Source: Euromonitor International, Staple Foods 2026 Edition, Retail Value RSP, Current Prices. Market and category size figures include Private Label not captured at company level. Ranking based on Euromonitor 2025 RSV; excluding the following countries: Albania, Andorra, Cyprus, Czech Republic, Gibraltar, Iceland, Kosovo, Liechtenstein, Luxembourg, Malta, Monaco and Montenegro, as Euromonitor does not capture retail sales value (RSV) at company level in those geographies. 1. Euromonitor, Western & Eastern Europe, excluding Russia and Turkey
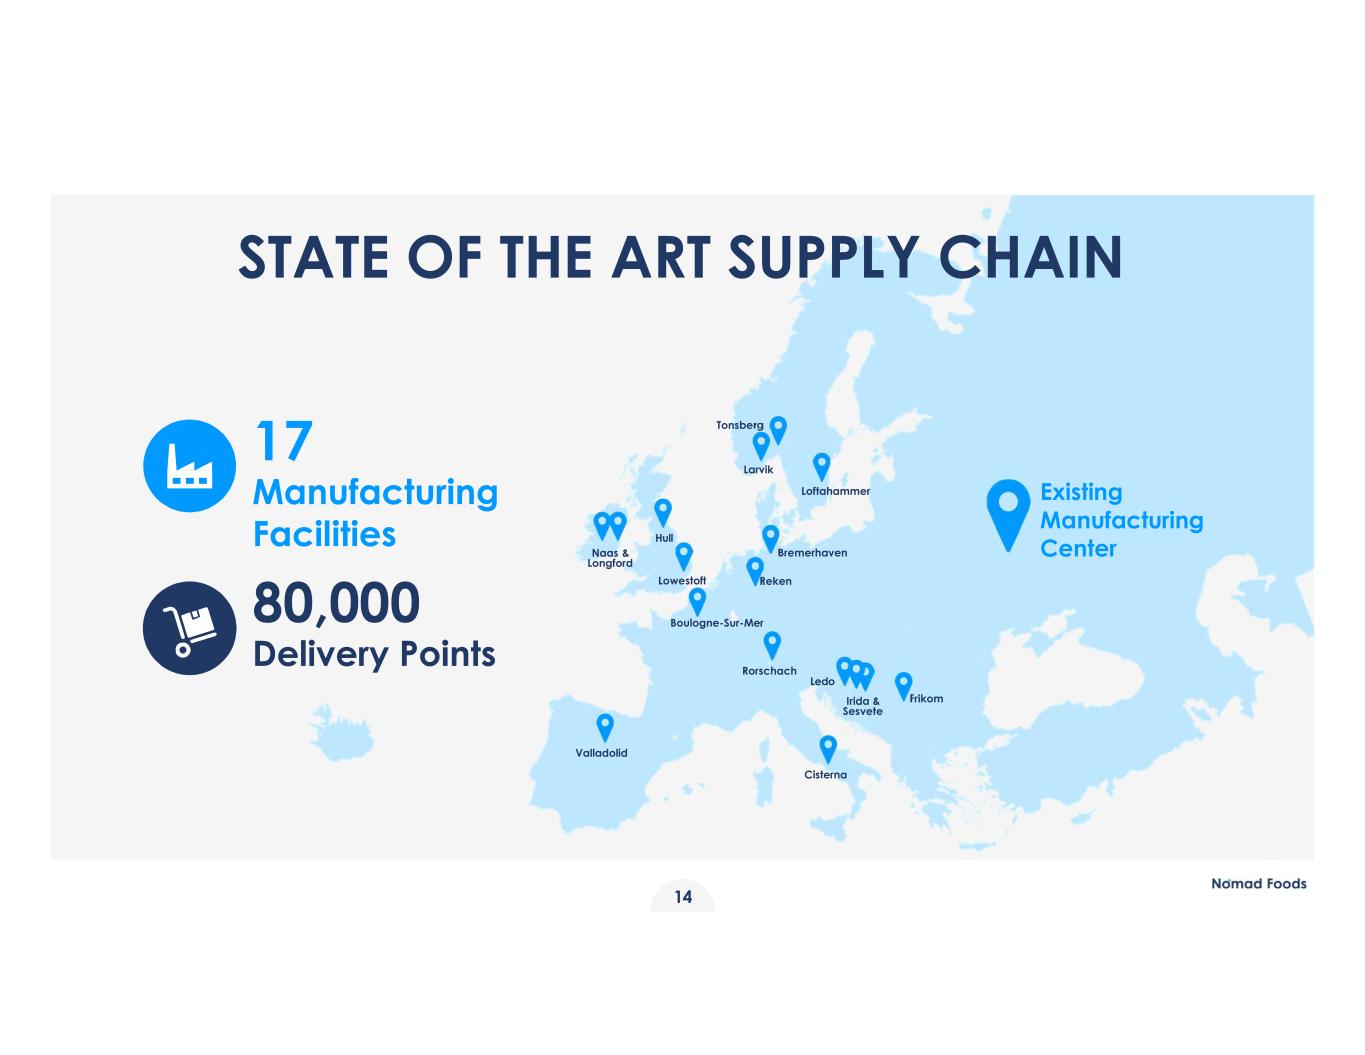
14 Existing Manufacturing Center Valladolid Rorschach Boulogne-Sur-Mer RekenLowestoft Hull Naas & Longford Bremerhaven Loftahammer Larvik Tonsberg Cisterna Frikom Ledo Irida & Sesvete 17 Manufacturing Facilities 80,000 Delivery Points STATE OF THE ART SUPPLY CHAIN
15 CATEGORY TAILWINDS
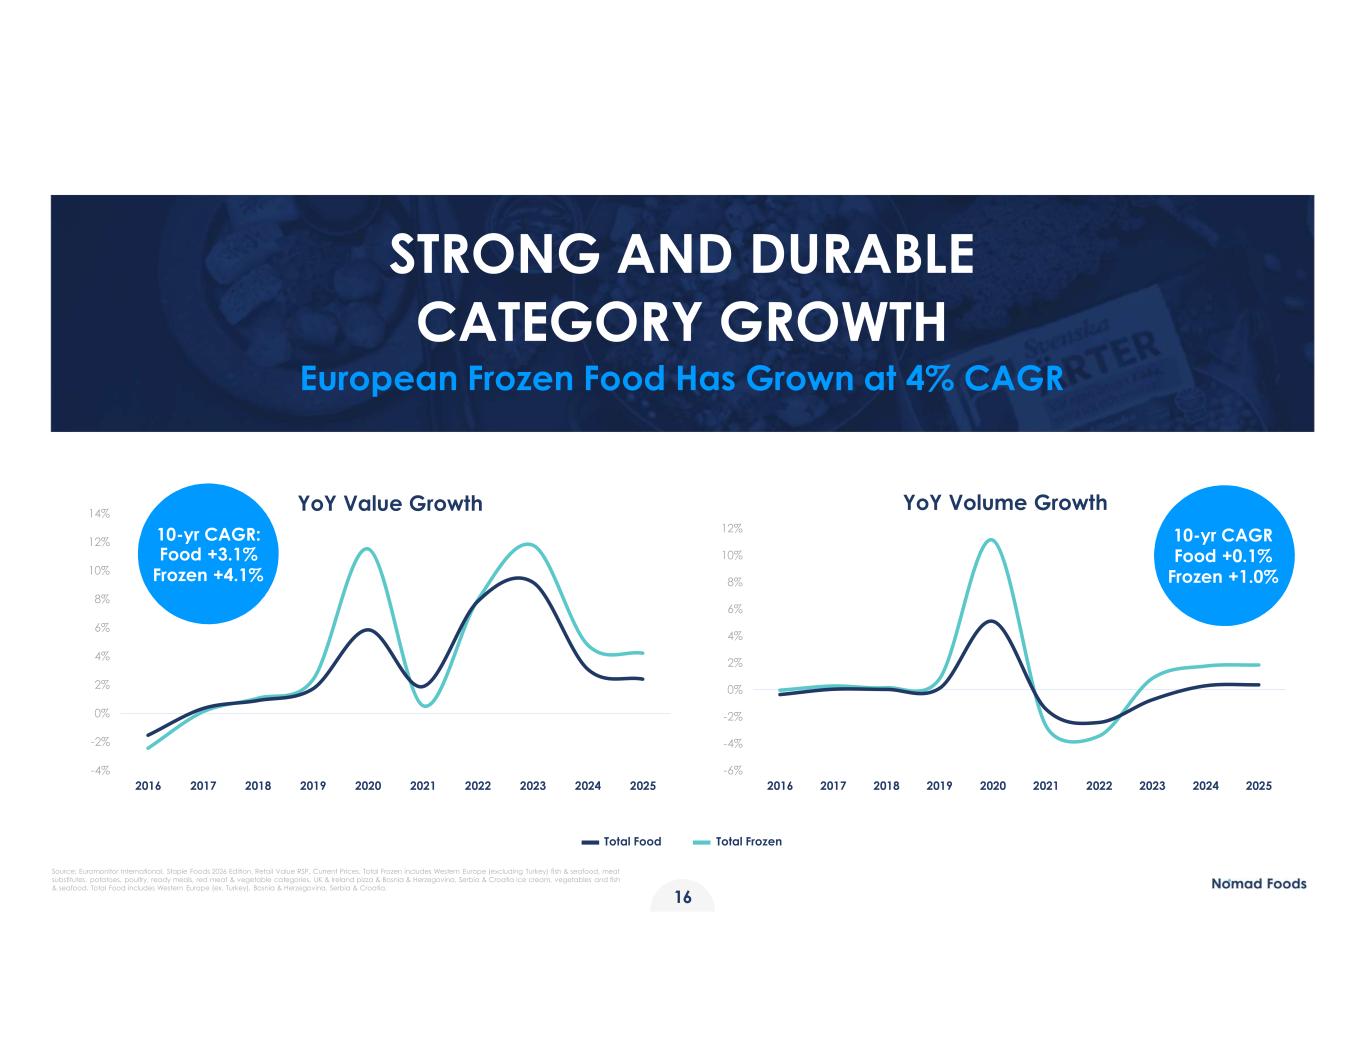
-6% -4% -2% 0% 2% 4% 6% 8% 10% 12% 2016 2017 2018 2019 2020 2021 2022 2023 2024 2025 -4% -2% 0% 2% 4% 6% 8% 10% 12% 14% 2016 2017 2018 2019 2020 2021 2022 2023 2024 2025 10-yr CAGR Food +0.1% Frozen +1.0% Total Food Total Frozen STRONG AND DURABLE CATEGORY GROWTH European Frozen Food Has Grown at 4% CAGR YoY Volume GrowthYoY Value Growth 10-yr CAGR: Food +3.1% Frozen +4.1% Source: Euromonitor International, Staple Foods 2026 Edition, Retail Value RSP, Current Prices. Total Frozen includes Western Europe (excluding Turkey) fish & seafood, meat substitutes, potatoes, poultry, ready meals, red meat & vegetable categories, UK & Ireland pizza & Bosnia & Herzegovina, Serbia & Croatia ice cream, vegetables and fish & seafood. Total Food includes Western Europe (ex. Turkey), Bosnia & Herzegovina, Serbia & Croatia. 16
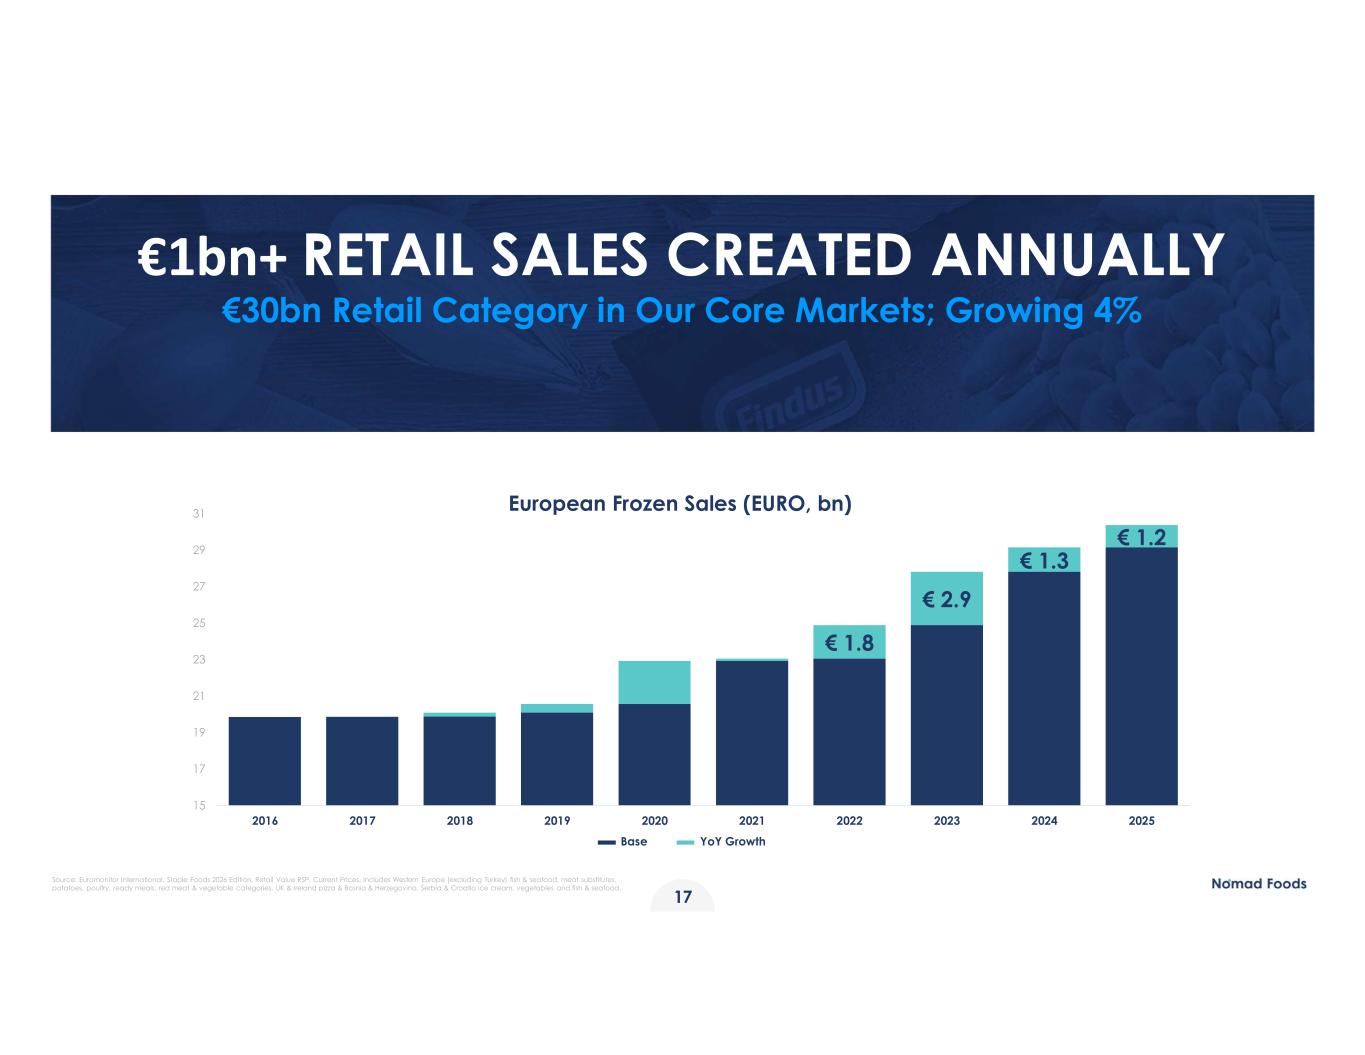
SMALLEST TITLE 17 European Frozen Sales (EURO, bn) €1bn+ RETAIL SALES CREAT D ANNUALLY €30bn Retail Category in Our Core Markets; Growing 4% Base YoY Growth € 1.8 € 2.9 € 1.3 € 1.2 15 17 19 21 23 25 27 29 31 2016 2017 2018 2019 2020 2021 2022 2023 2024 2025 Source: Euromonitor International, Staple Foods 2026 Edition, Retail Value RSP, Current Prices. Includes Western Europe (excluding Turkey) fish & seafood, meat substitutes, potatoes, poultry, ready meals, red meat & vegetable categories, UK & Ireland pizza & Bosnia & Herzegovina, Serbia & Croatia ice cream, vegetables and fish & seafood.
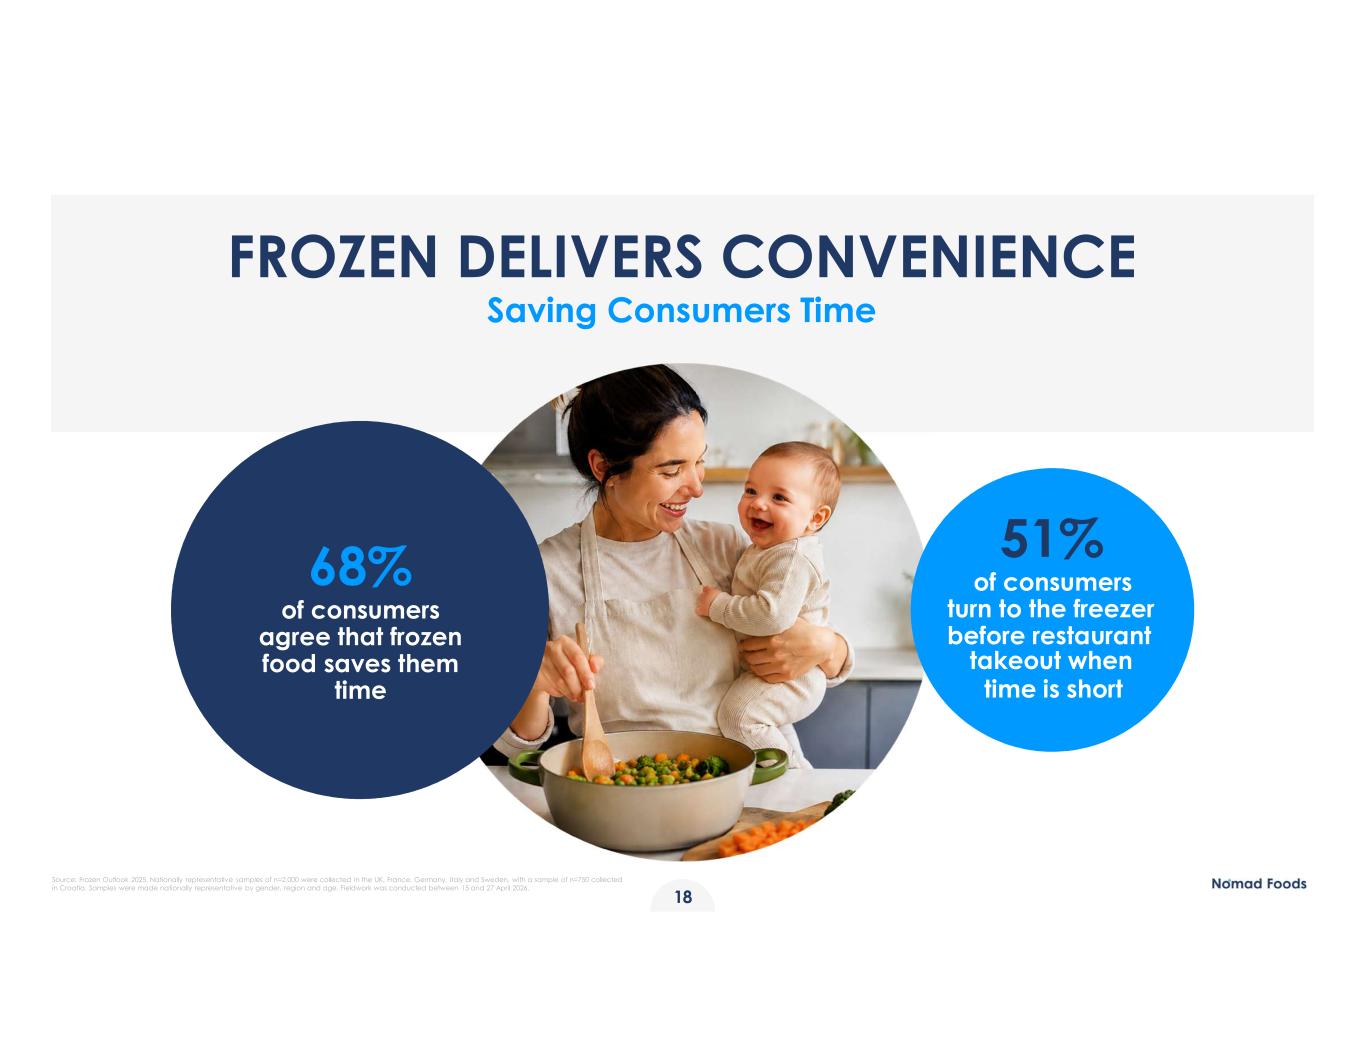
SMALLEST TITLE 18 FROZEN DELIVERS CONVENIENCE Saving Consumers Time 68% of consumers agree that frozen food saves them time 51% of consumers turn to the freezer before restaurant takeout when time is short Source: Frozen Outlook 2025. Nationally representative samples of n=2,000 were collected in the UK, France, Germany, Italy and Sweden, with a sample of n=750 collected in Croatia. Samples were made nationally representative by gender, region and age. Fieldwork was conducted between 15 and 27 April 2026.
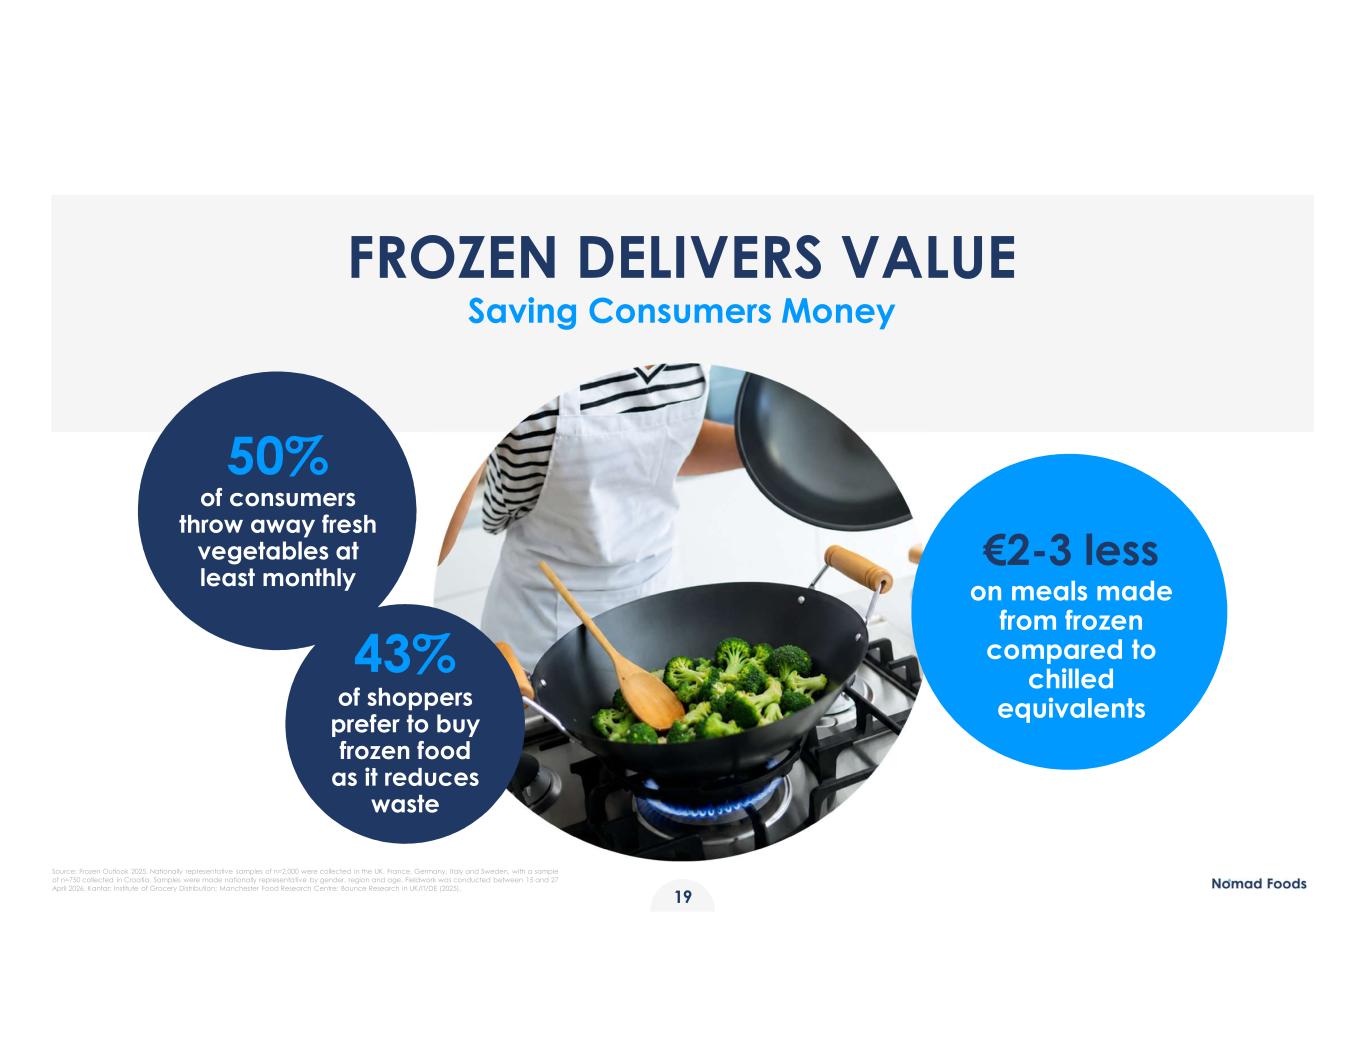
Source: Frozen Outlook 2025. Nationally representative samples of n=2,000 were collected in the UK, France, Germany, Italy and Sweden, with a sample of n=750 collected in Croatia. Samples were made nationally representative by gender, region and age. Fieldwork was conducted between 15 and 27 April 2026. Kantar; Institute of Grocery Distribution; Manchester Food Research Centre; Bounce Research in UK/IT/DE (2025). FROZEN DELIVERS VALUE Saving Consumers Money 50% of consumers throw away fresh vegetables at least monthly €2-3 less on meals made from frozen compared to chilled equivalents 43% of shoppers prefer to buy frozen food as it reduces waste 19
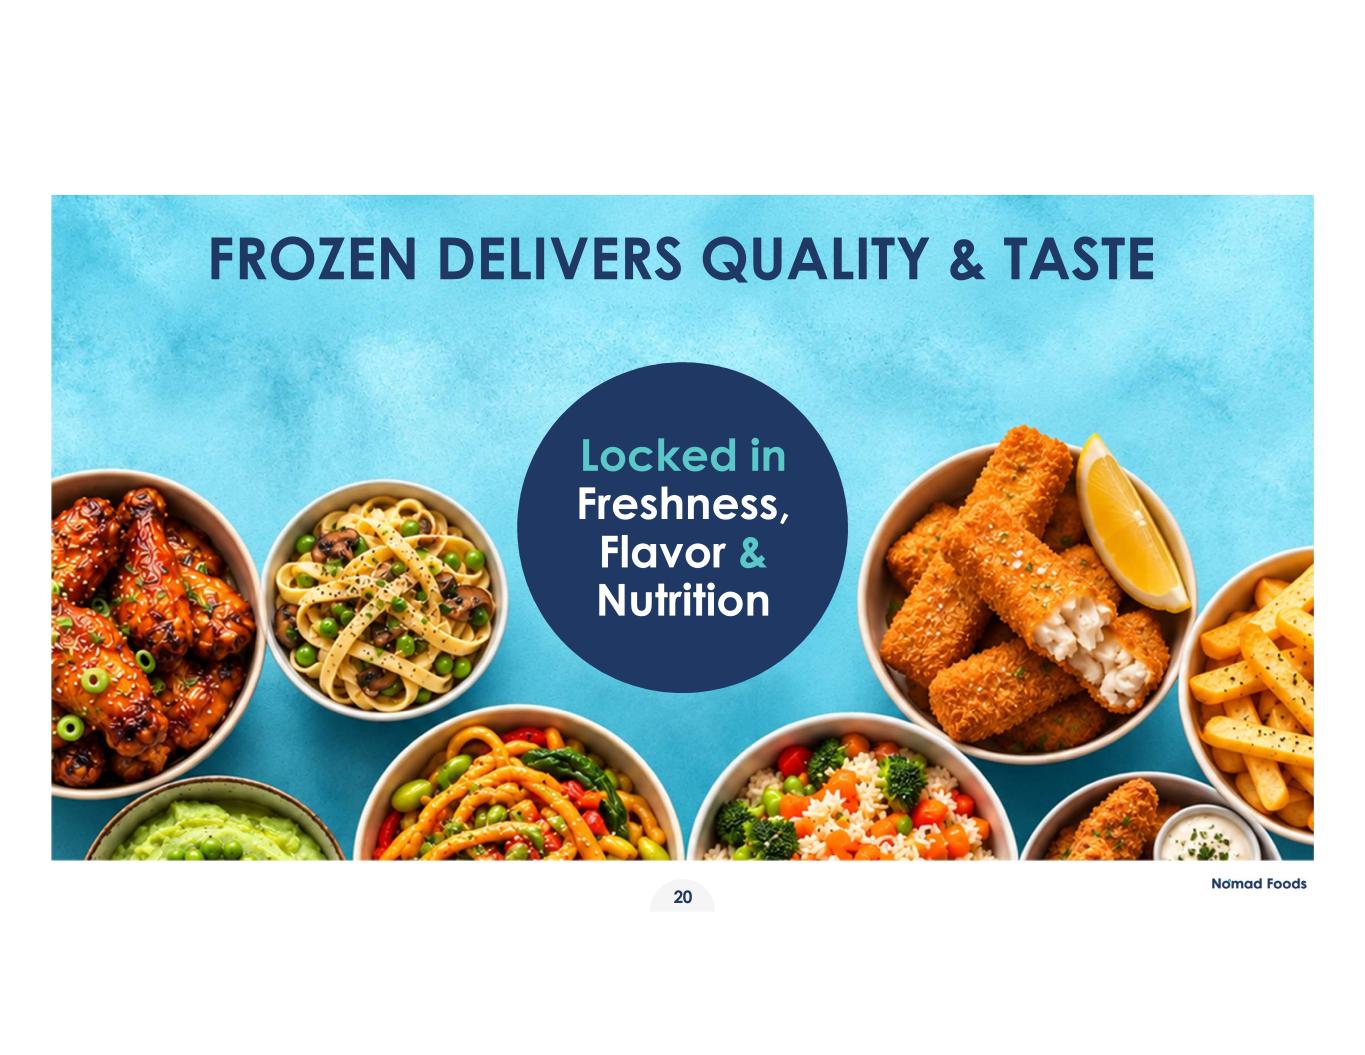
20 FROZEN DELIVERS QUALITY & TASTE Locked in Freshness, Flavor & Nutrition
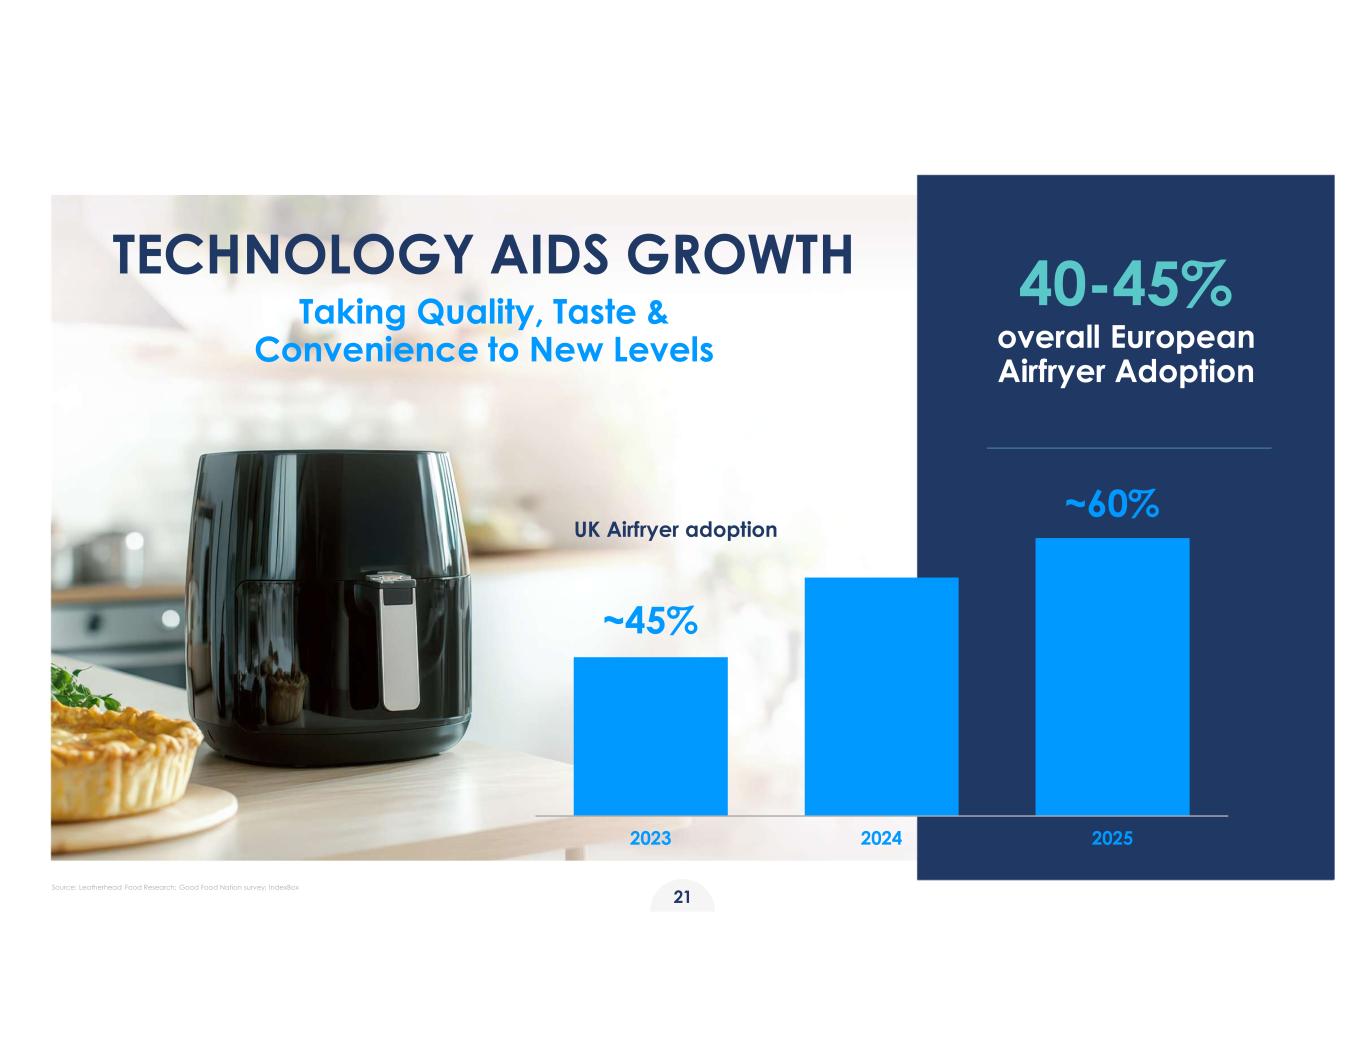
TECHNOLOGY AIDS GROWTH Taking Quality, Taste & Convenience to New Levels 40-45% overall European Airfryer Adoption 2023 2024 2025 ~45% ~60% UK Airfryer adoption 21 Source: Leatherhead Food Research; Good Food Nation survey; IndexBox
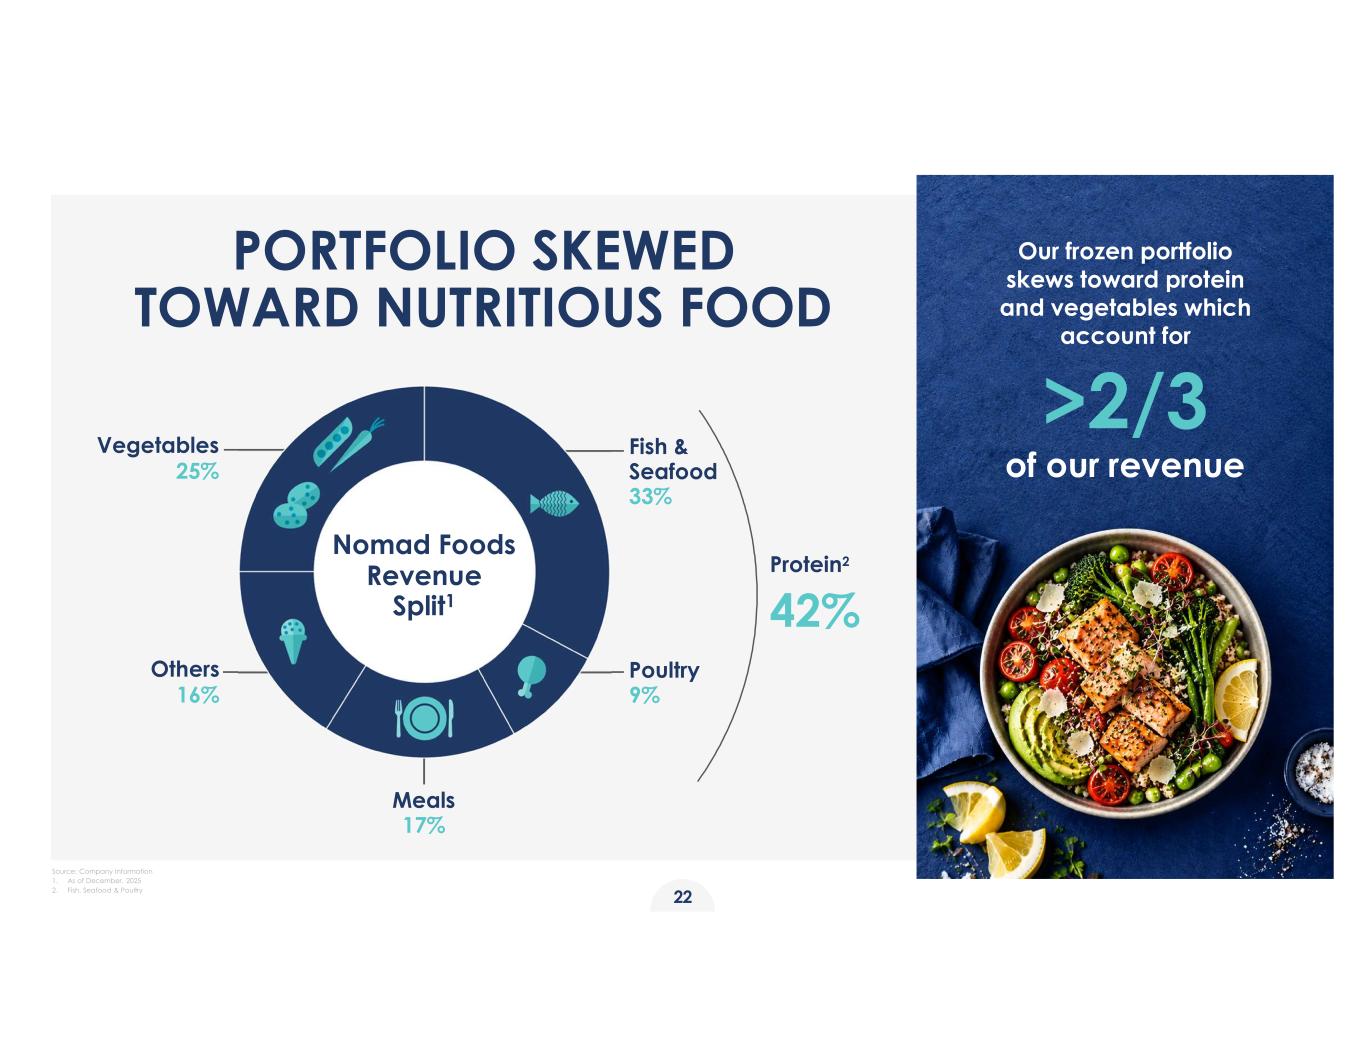
Our frozen portfolio skews toward protein and vegetables which account for >2/3 of our revenue Nomad Foods Revenue Split1 Others 16% Meals 17% Vegetables 25% Poultry 9% Fish & Seafood 33% Protein2 42% Source: Company Information 1. As of December, 2025 2. Fish, Seafood & Poultry 22 PORTFOLIO SKEWED TOWARD NUTRITIOUS FOOD
23 9 MONTHS IN: Analysis & Evolution
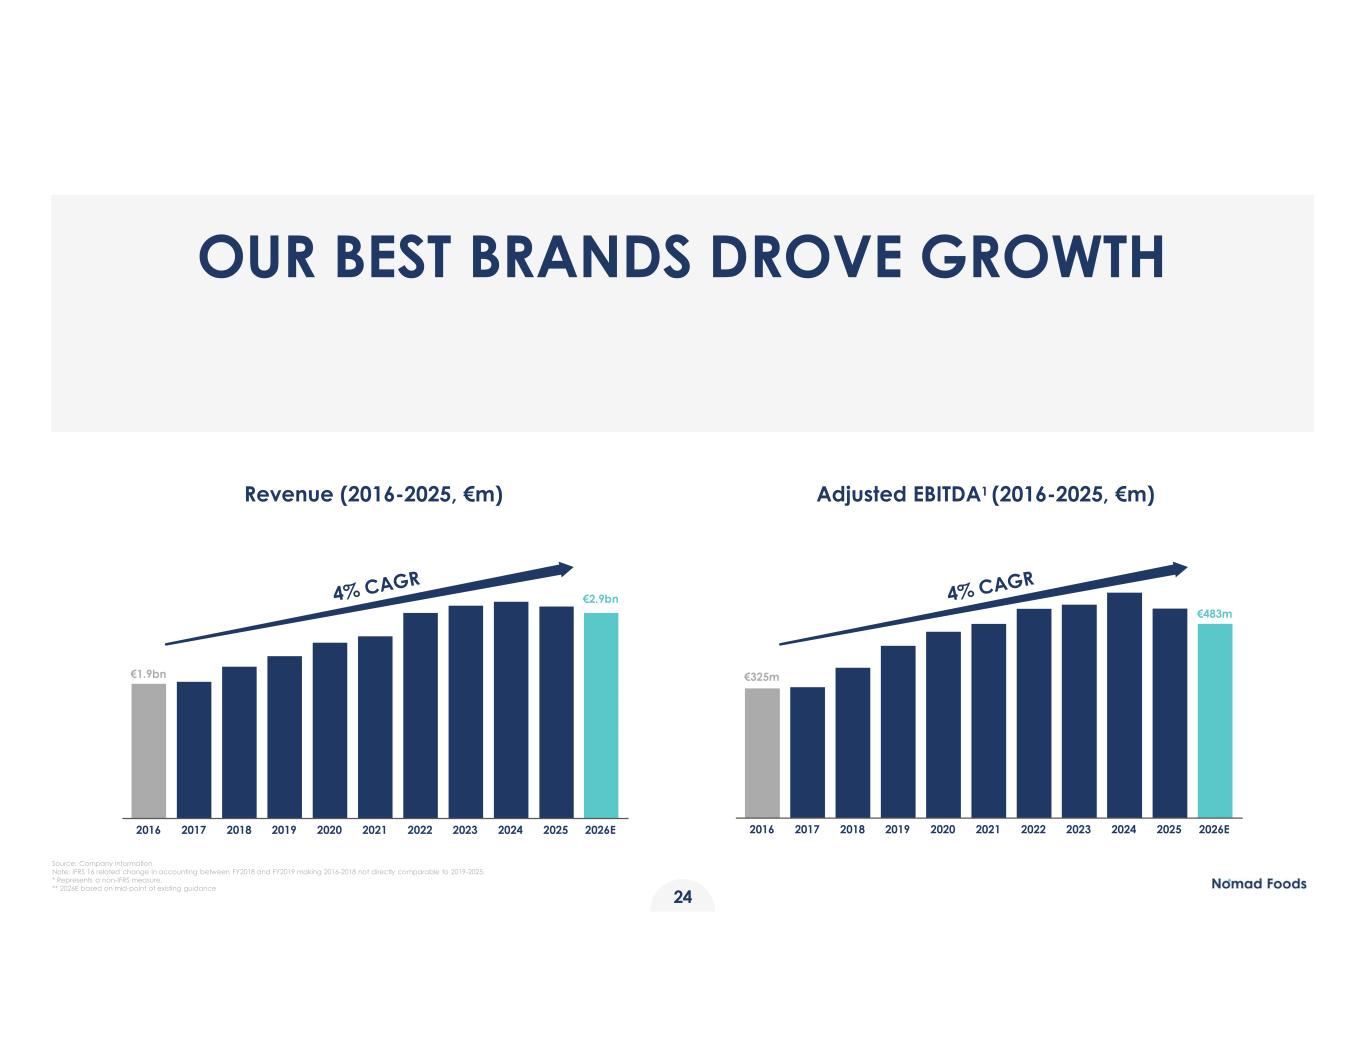
OUR BEST BRANDS DROVE GROWTH Source: Company information Note: IFRS 16 related change in accounting between FY2018 and FY2019 making 2016-2018 not directly comparable to 2019-2025. * Represents a non-IFRS measure. ** 2026E based on mid-point of existing guidance Adjusted EBITDA1 (2016-2025, €m) €483m €325m 2016 2017 2018 2019 2020 2021 2022 2023 2024 2025 2026E Revenue (2016-2025, €m) €1.9bn €2.9bn 2016 2017 2018 2019 2020 2021 2022 2023 2024 2025 2026E 24
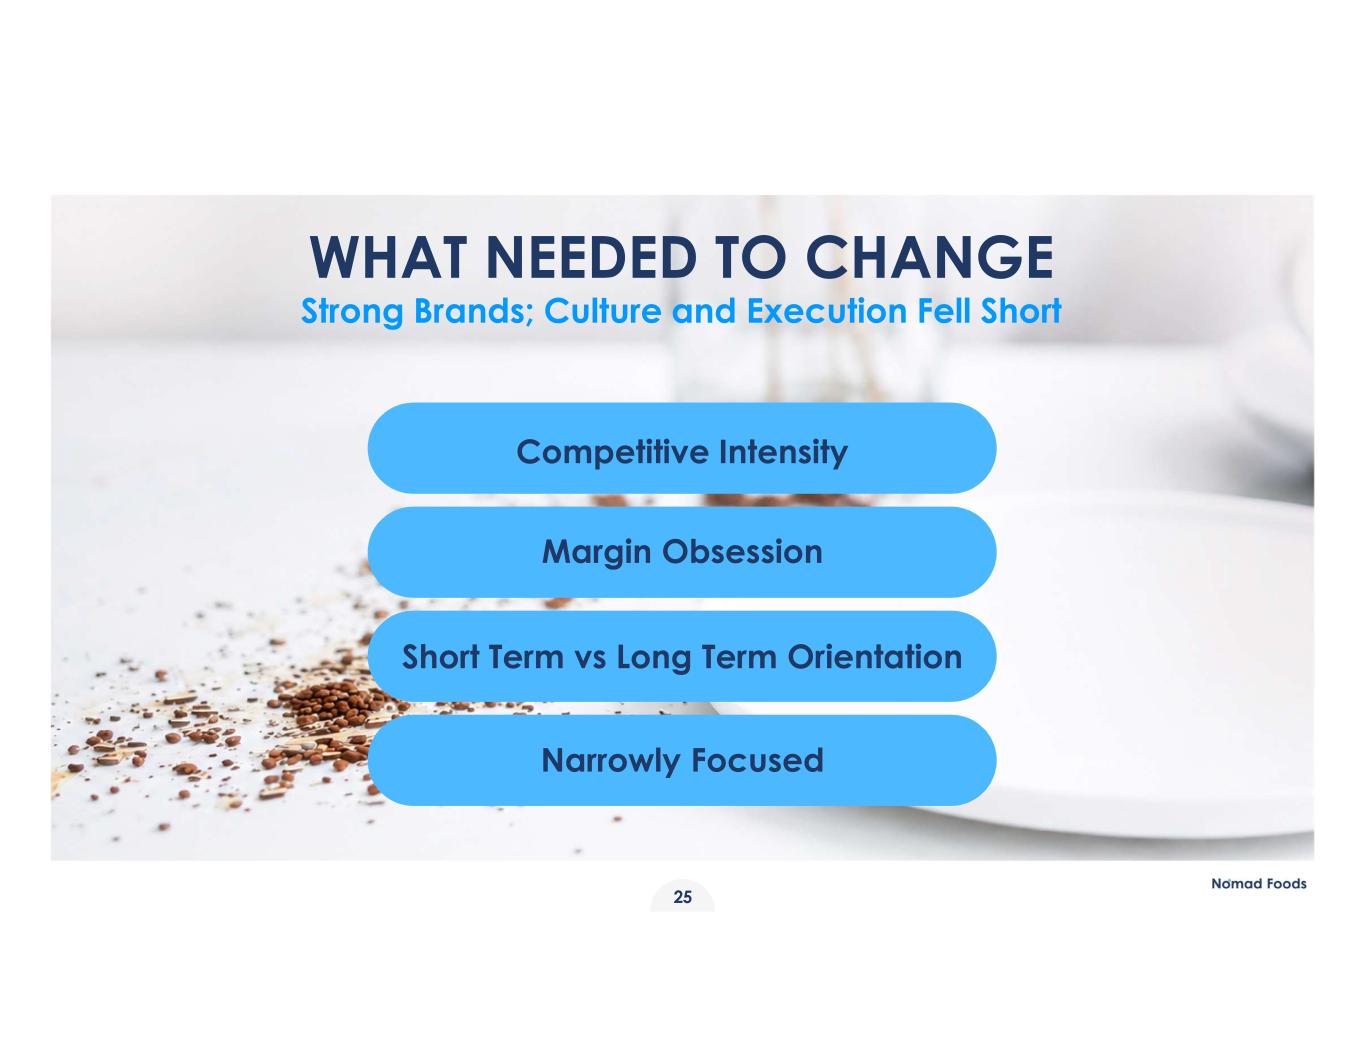
25 WHAT NEEDED TO CHANGE Strong Brands; Culture and Execution Fell Short Competitive Intensity Margin Obsession Short Term vs Long Term Orientation Narrowly Focused
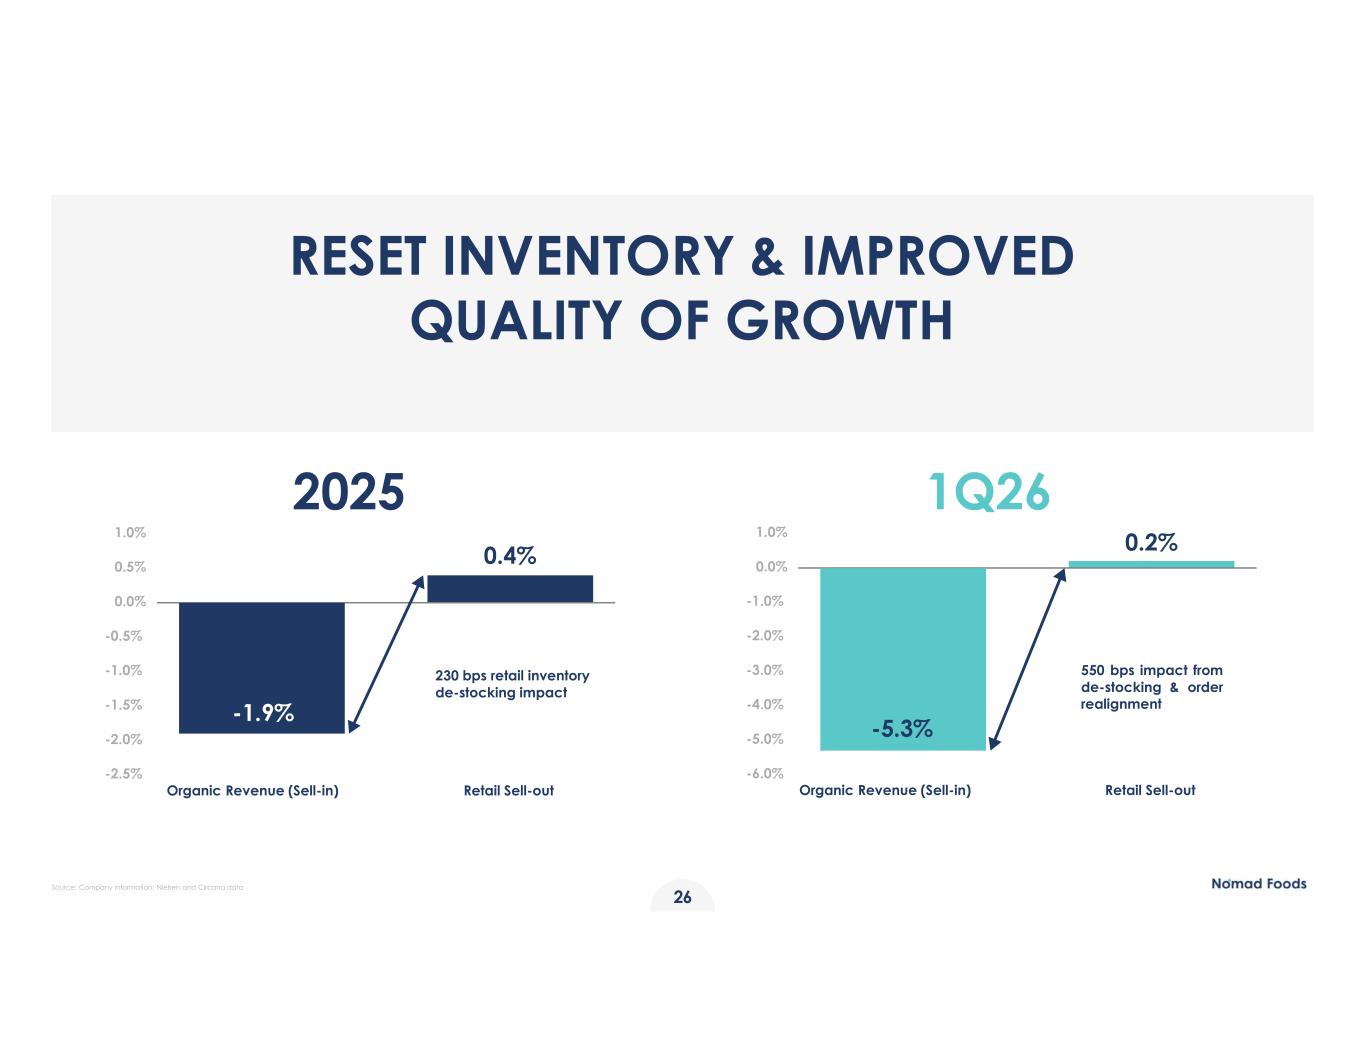
RESET INVENTORY & IMPROVED QUALITY OF GROWTH 0.4% -2.5% -2.0% -1.5% -1.0% -0.5% 0.0% 0.5% 1.0% Organic Revenue (Sell-in) Retail Sell-out 2025 1Q26 230 bps retail inventory de-stocking impact 0.2% -6.0% -5.0% -4.0% -3.0% -2.0% -1.0% 0.0% 1.0% Organic Revenue (Sell-in) Retail Sell-out 550 bps impact from de-stocking & order realignment-1.9% -5.3% 26 Source: Company information; Nielsen and Circana data
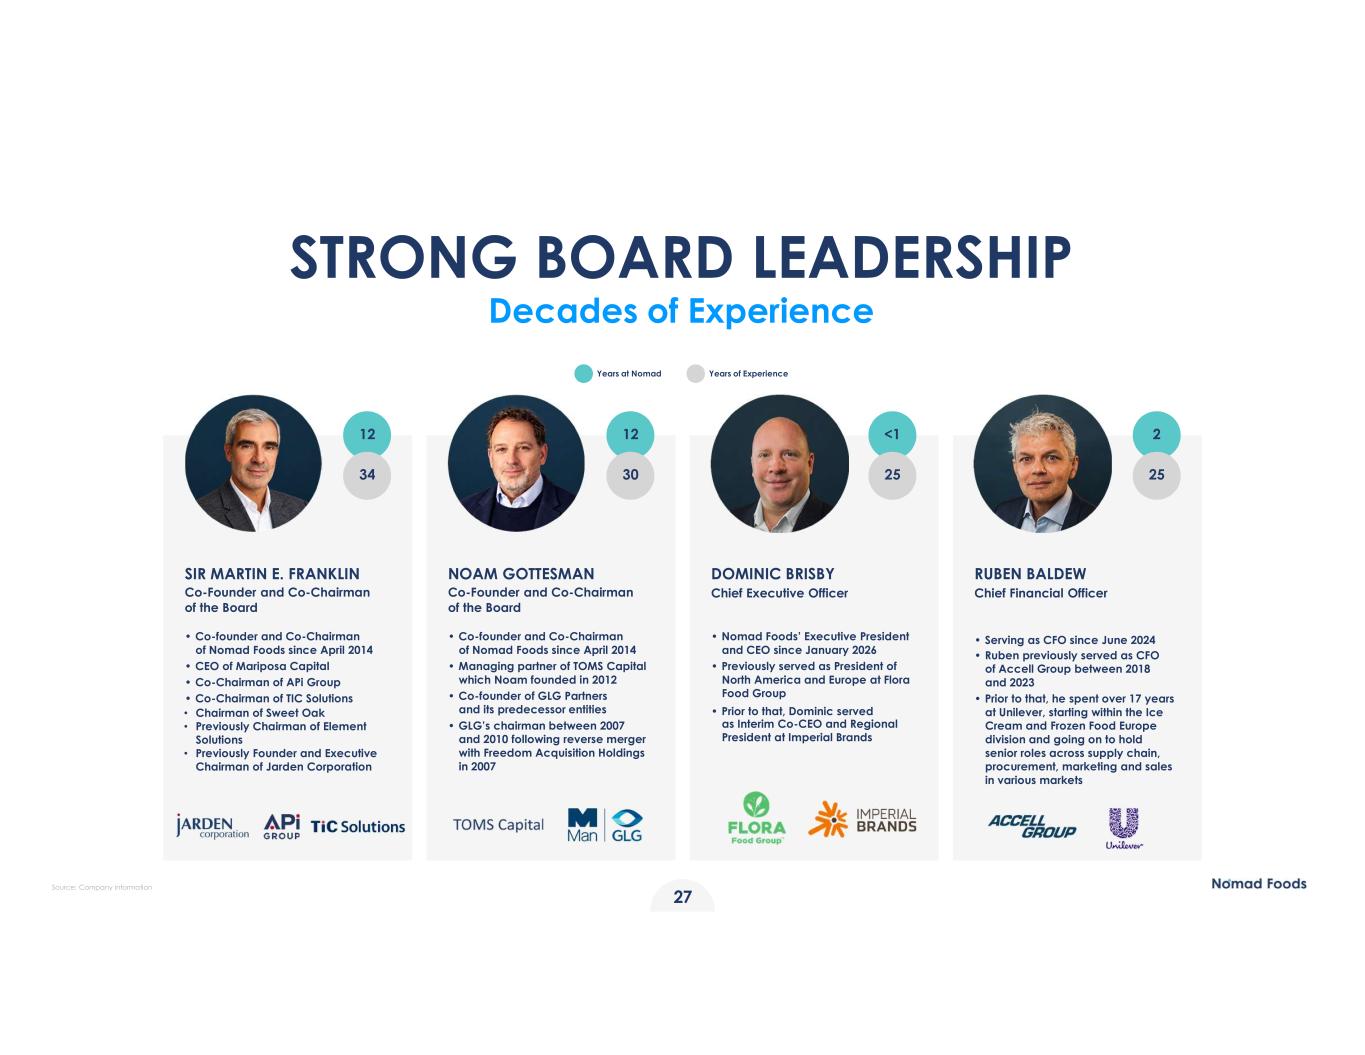
27 SIR MARTIN E. FRANKLIN Co-Founder and Co-Chairman of the Board • Co-founder and Co-Chairman of Nomad Foods since April 2014 • CEO of Mariposa Capital • Co-Chairman of APi Group • Co-Chairman of TIC Solutions • Chairman of Sweet Oak • Previously Chairman of Element Solutions • Previously Founder and Executive Chairman of Jarden Corporation NOAM GOTTESMAN Co-Founder and Co-Chairman of the Board • Co-founder and Co-Chairman of Nomad Foods since April 2014 • Managing partner of TOMS Capital which Noam founded in 2012 • Co-founder of GLG Partners and its predecessor entities • GLG’s chairman between 2007 and 2010 following reverse merger with Freedom Acquisition Holdings in 2007 DOMINIC BRISBY Chief Executive Officer • Nomad Foods’ Executive President and CEO since January 2026 • Previously served as President of North America and Europe at Flora Food Group • Prior to that, Dominic served as Interim Co-CEO and Regional President at Imperial Brands RUBEN BALDEW Chief Financial Officer • Serving as CFO since June 2024 • Ruben previously served as CFO of Accell Group between 2018 and 2023 • Prior to that, he spent over 17 years at Unilever, starting within the Ice Cream and Frozen Food Europe division and going on to hold senior roles across supply chain, procurement, marketing and sales in various markets 12 34 12 30 <1 25 2 25 STRONG BOARD LEADERSHIP Decades of Experience Years at Nomad Years of Experience Source: Company information
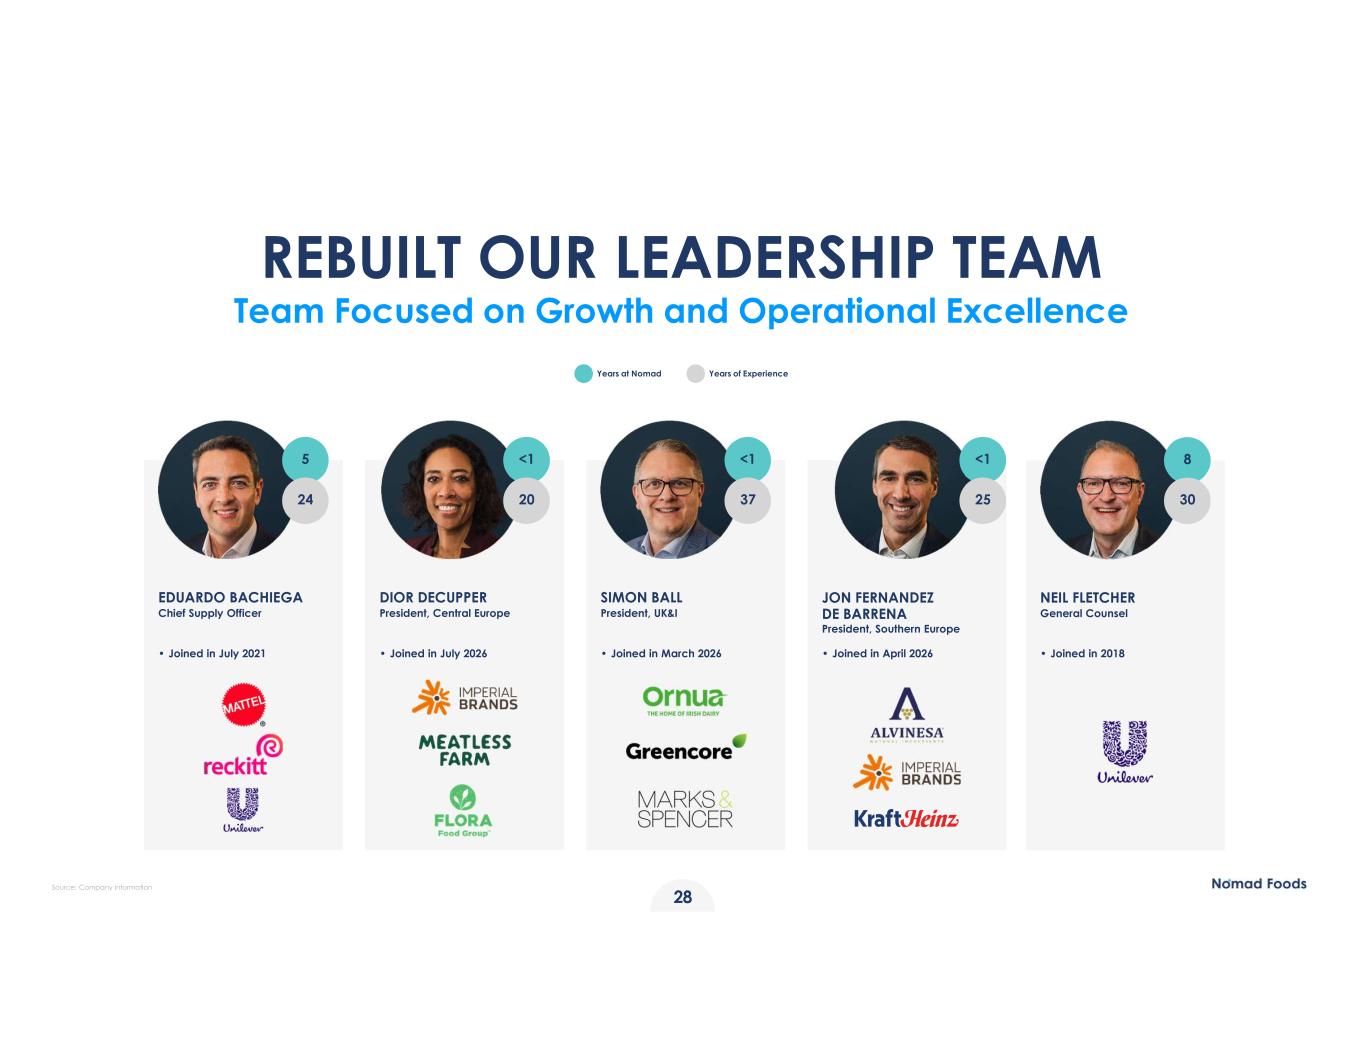
28 Years at Nomad Years of Experience NEIL FLETCHER General Counsel • Joined in 2018 EDUARDO BACHIEGA Chief Supply Officer • Joined in July 2021 DIOR DECUPPER President, Central Europe • Joined in July 2026 SIMON BALL President, UK&I • Joined in March 2026 JON FERNANDEZ DE BARRENA President, Southern Europe • Joined in April 2026 REBUILT OUR LEADERSHIP TEAM Team Focused on Growth and Operational Excellence <1 37 8 30 <1 25 5 24 <1 20 Source: Company information
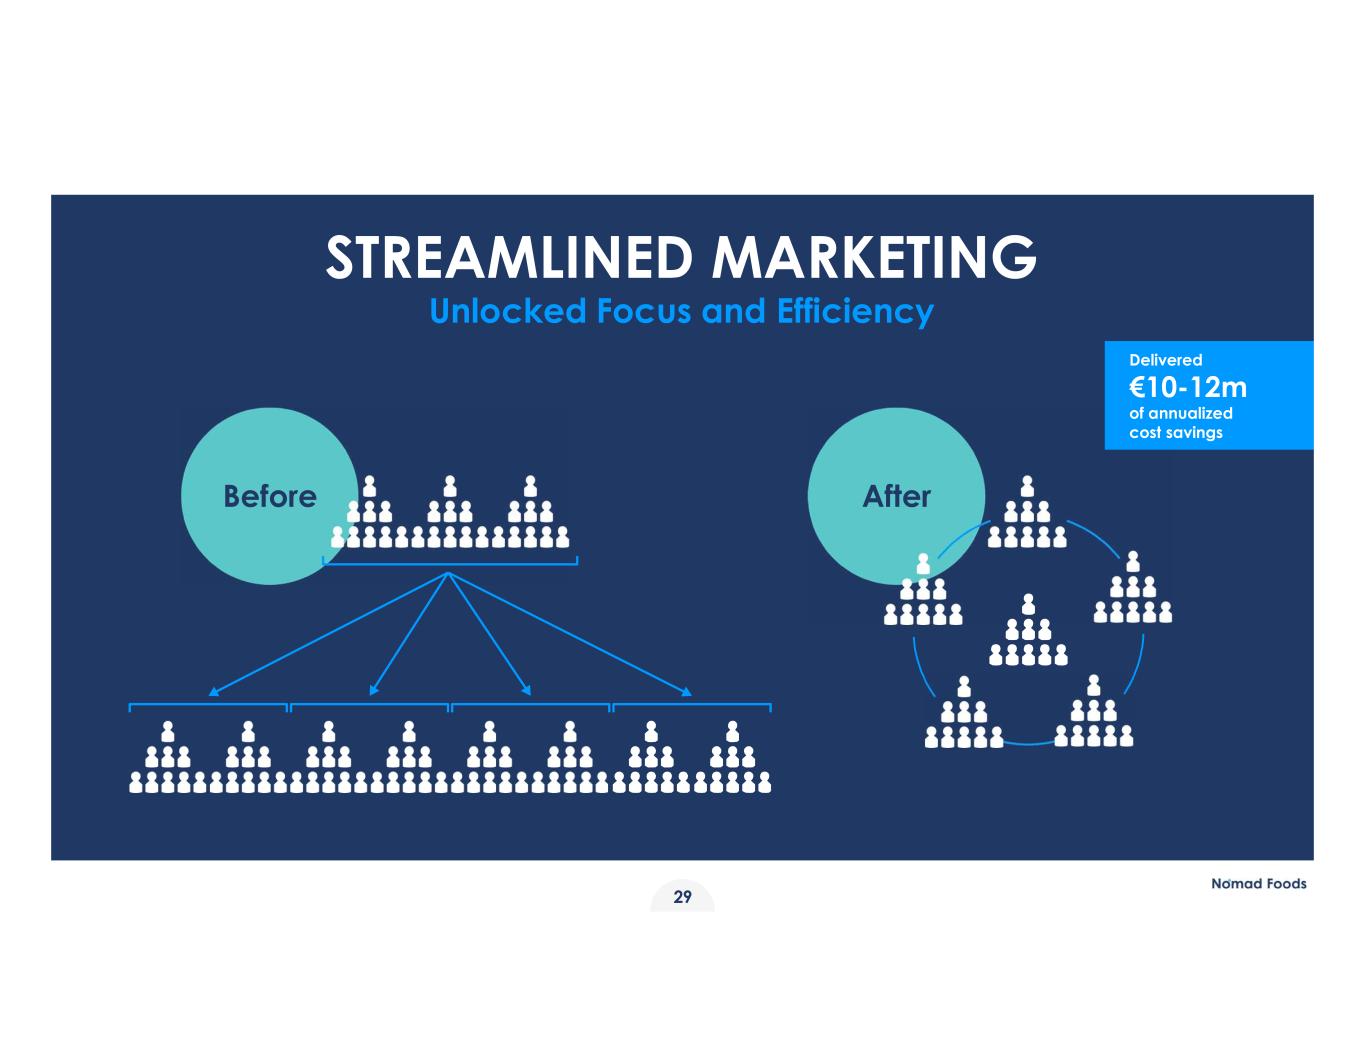
STREAMLINED MARKETING Unlocked Focus and Efficiency Before After 29 Delivered €10-12m of annualized cost savings
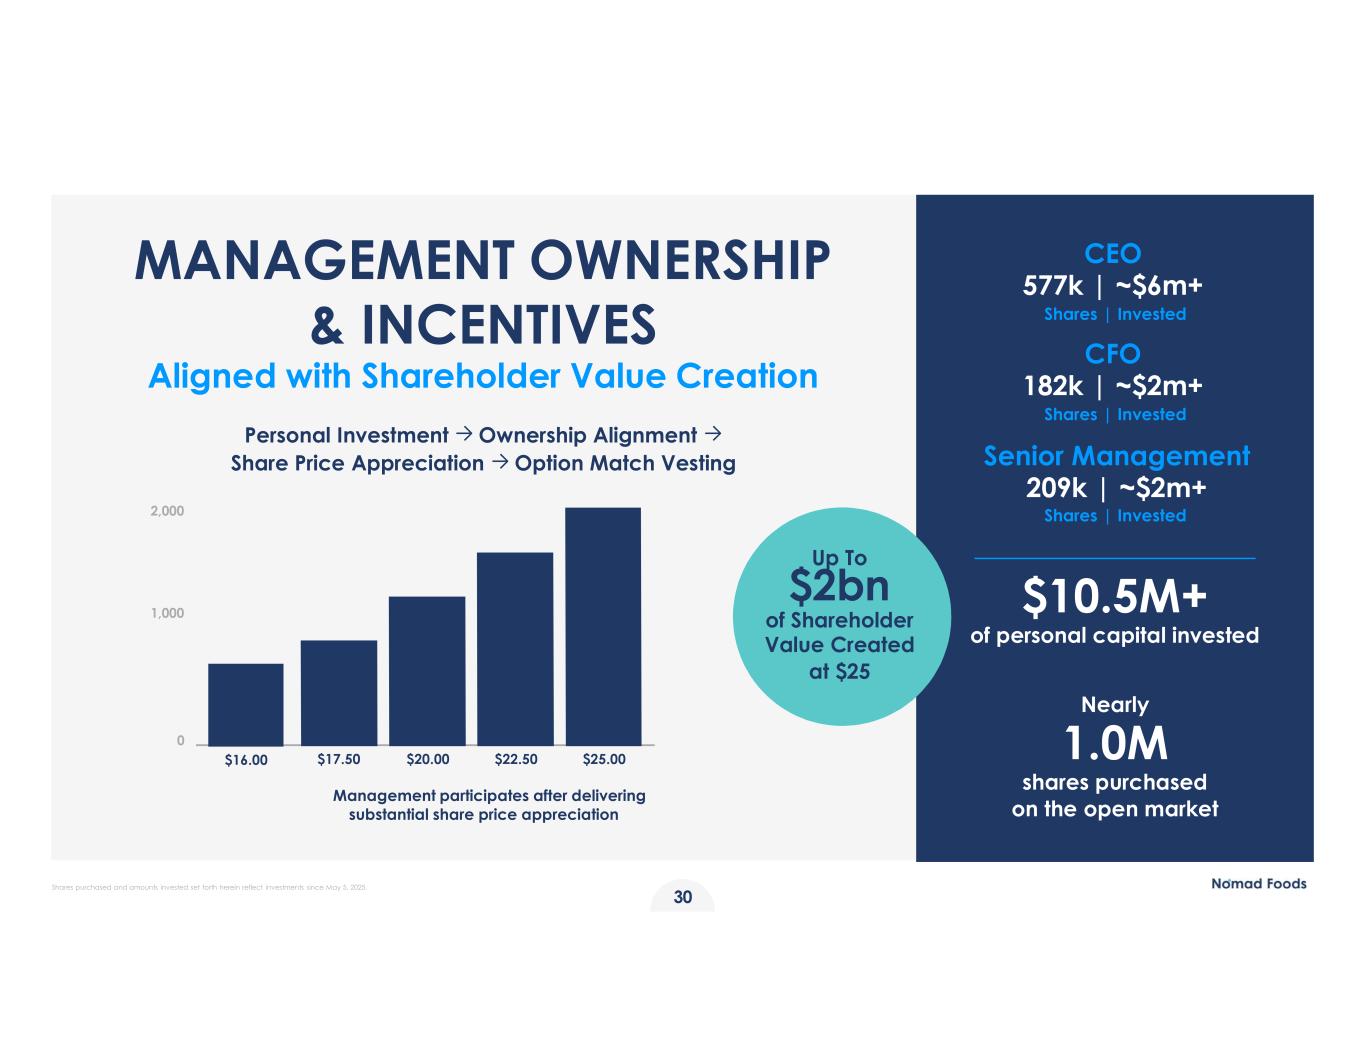
MANAGEMENT OWNERSHIP & INCENTIVES Aligned with Shareholder Value Creation Management participates after delivering substantial share price appreciation Personal Investment → Ownership Alignment → Share Price Appreciation → Option Match Vesting Up To $2bn of Shareholder Value Created at $25 CEO 577k | ~$6m+ Shares | Invested CFO 182k | ~$2m+ Shares | Invested Senior Management 209k | ~$2m+ Shares | Invested $10.5M+ of personal capital invested Nearly 1.0M shares purchased on the open market 30 $20.00 $22.50 $25.00$17.50$16.00 2,000 1,000 0 Shares purchased and amounts invested set forth herein reflect investments since May 5, 2025.
31 FULL STEAM AHEAD
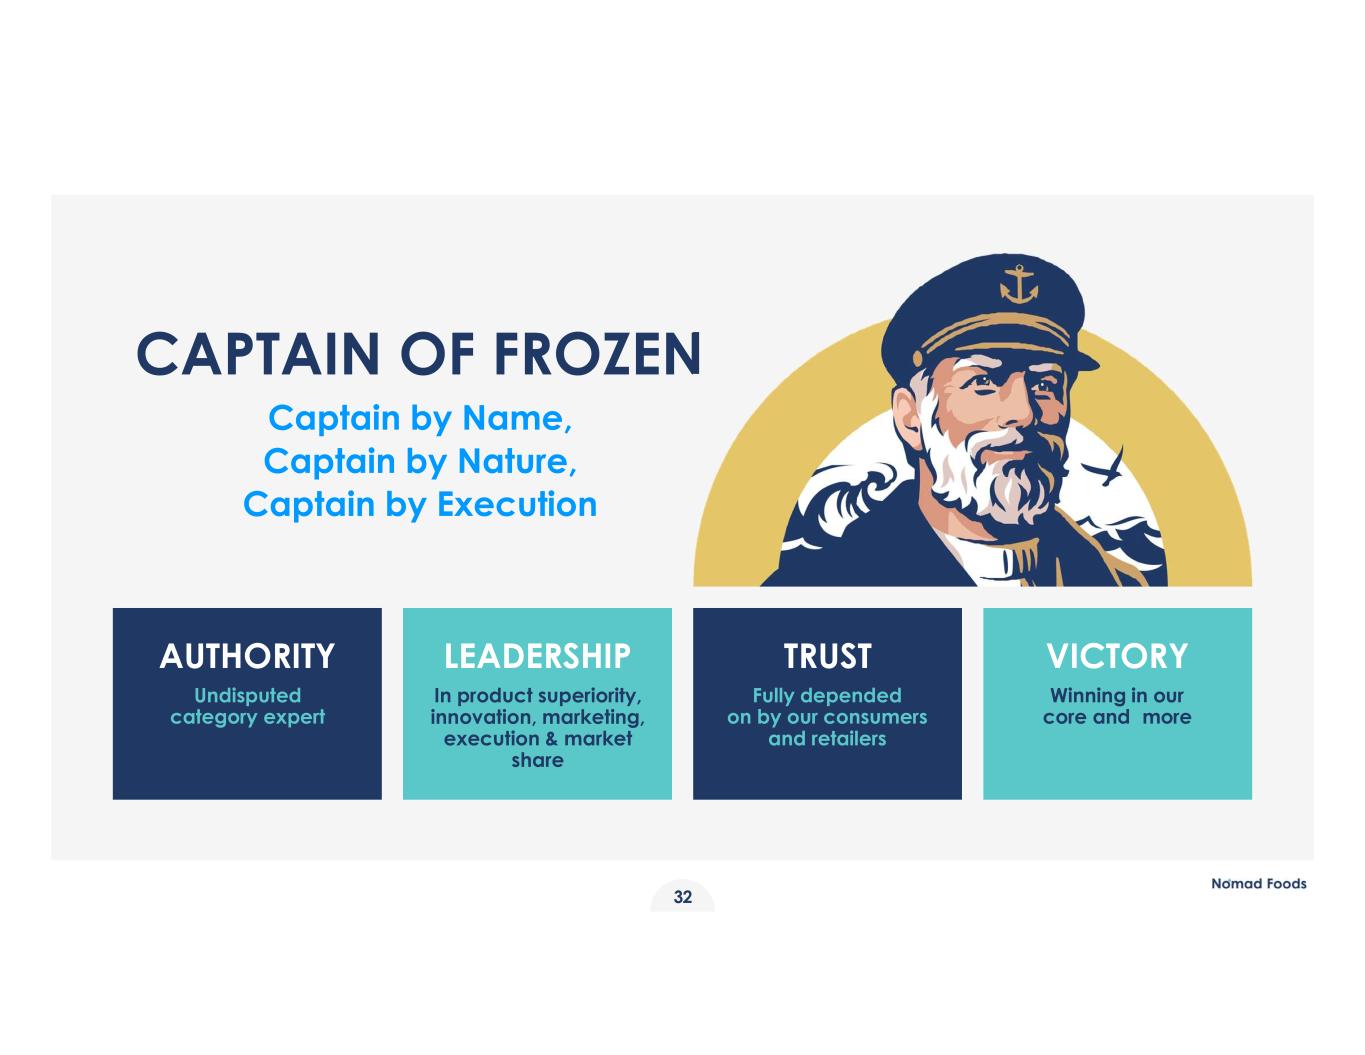
32 CAPTAIN OF FROZEN Captain by Name, Captain by Nature, Captain by Execution AUTHORITY Undisputed category expert LEADERSHIP In product superiority, innovation, marketing, execution & market share VICTORY Winning in our core and more TRUST Fully depended on by our consumers and retailers
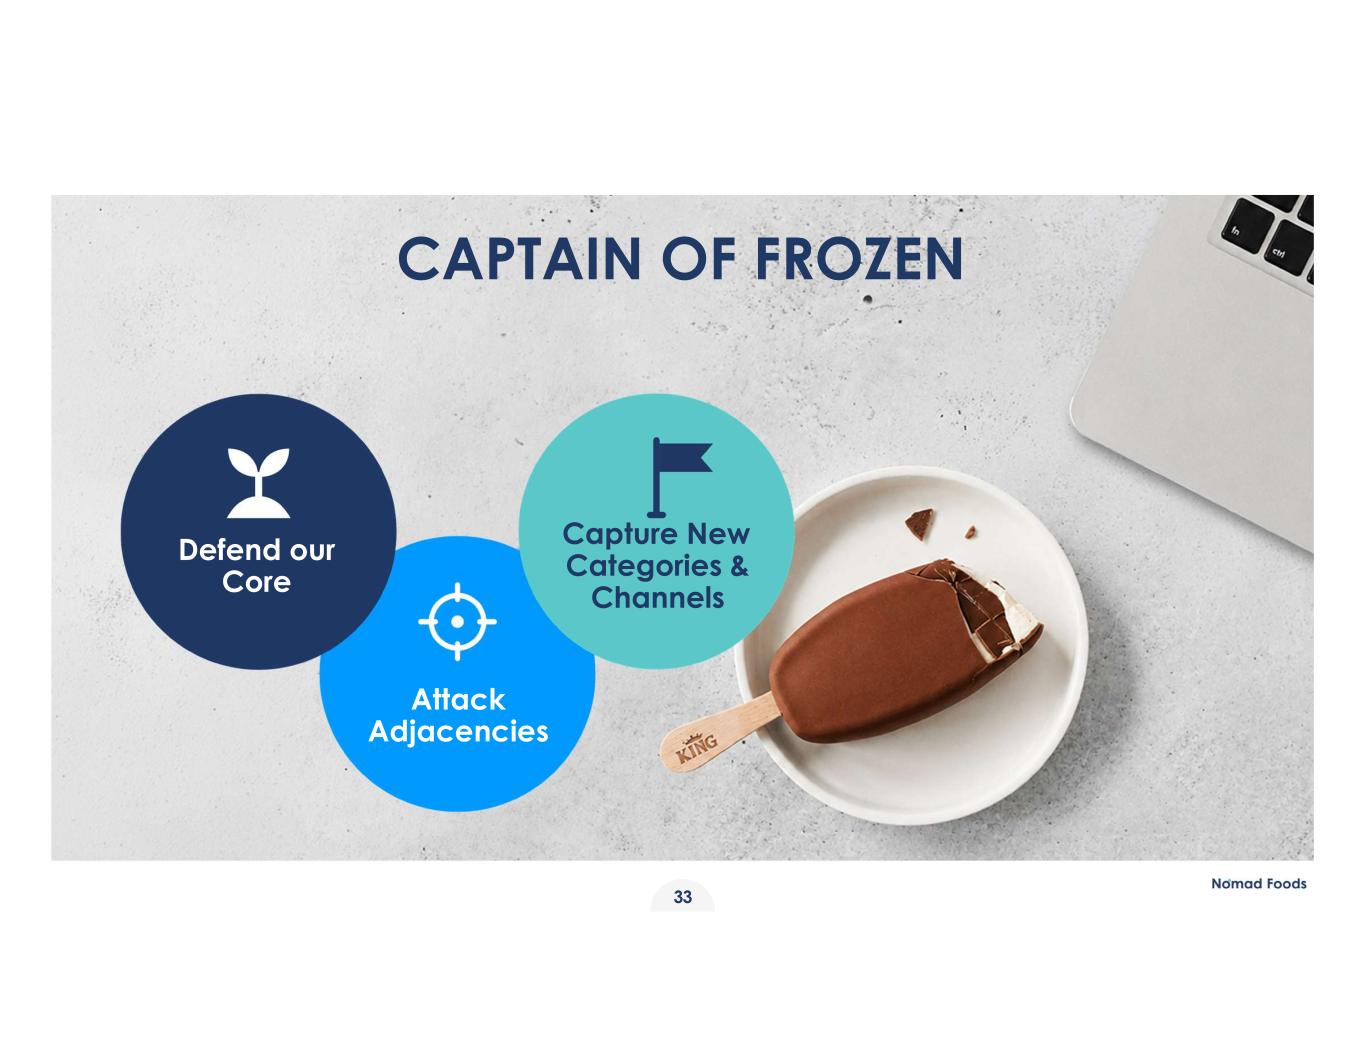
CAPTAIN OF FROZEN Attack Adjacencies Capture New Categories & Channels Defend our Core 33
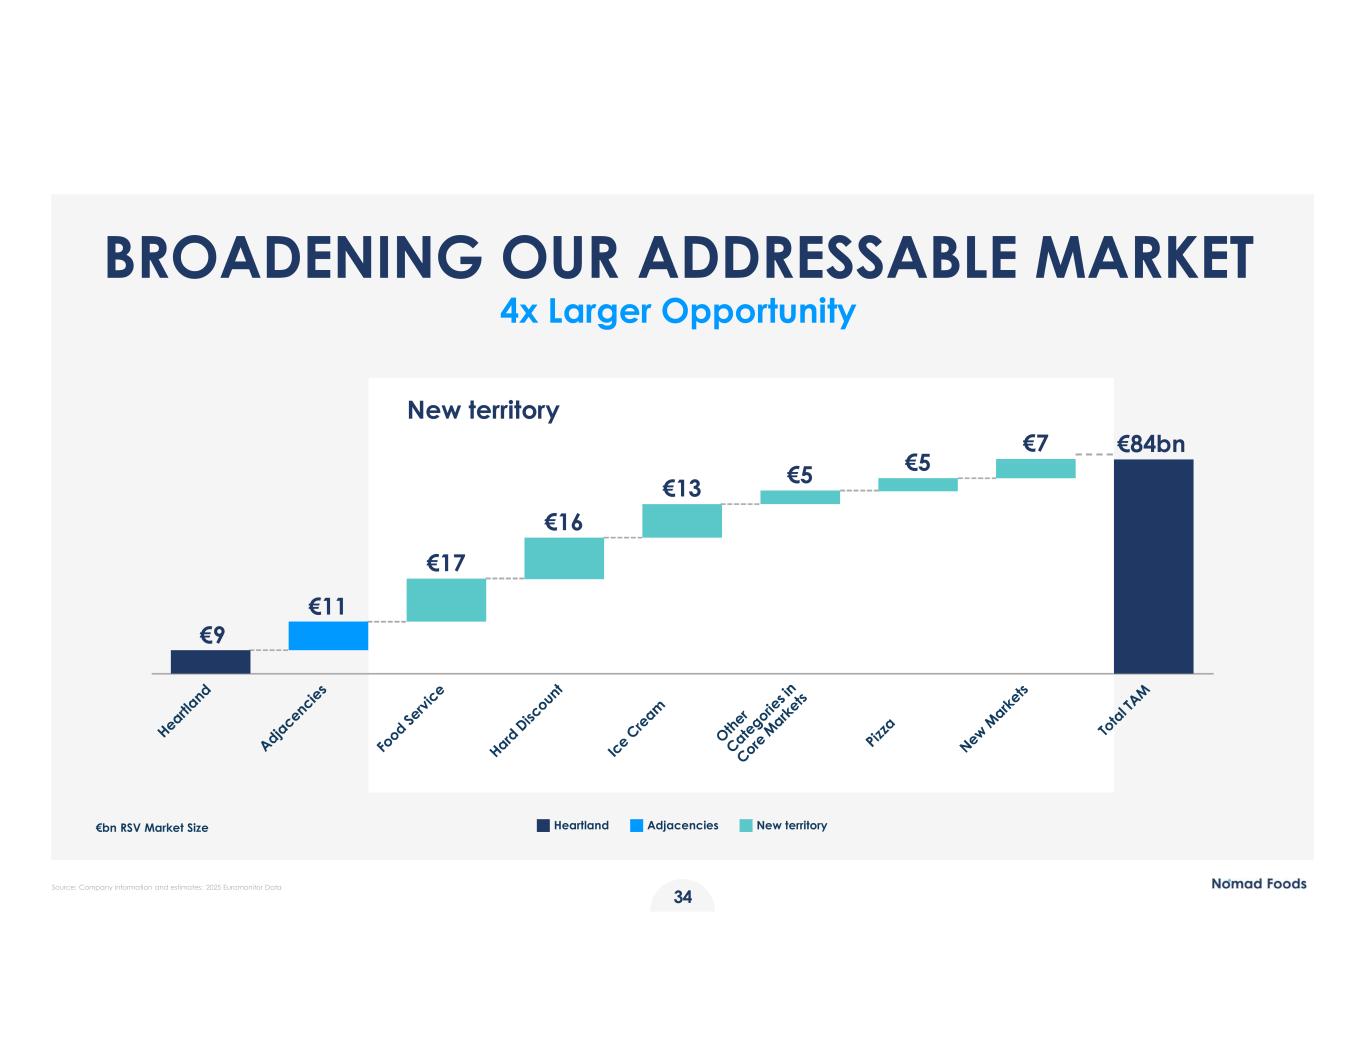
Heartland Adjacencies New territory€bn RSV Market Size €13 €16 €17 €11 €9 €84bn New territory €5€5 €7 BROADENING OUR ADDRESSABLE MARKET 4x Larger Opportunity 34 Source: Company information and estimates; 2025 Euromonitor Data
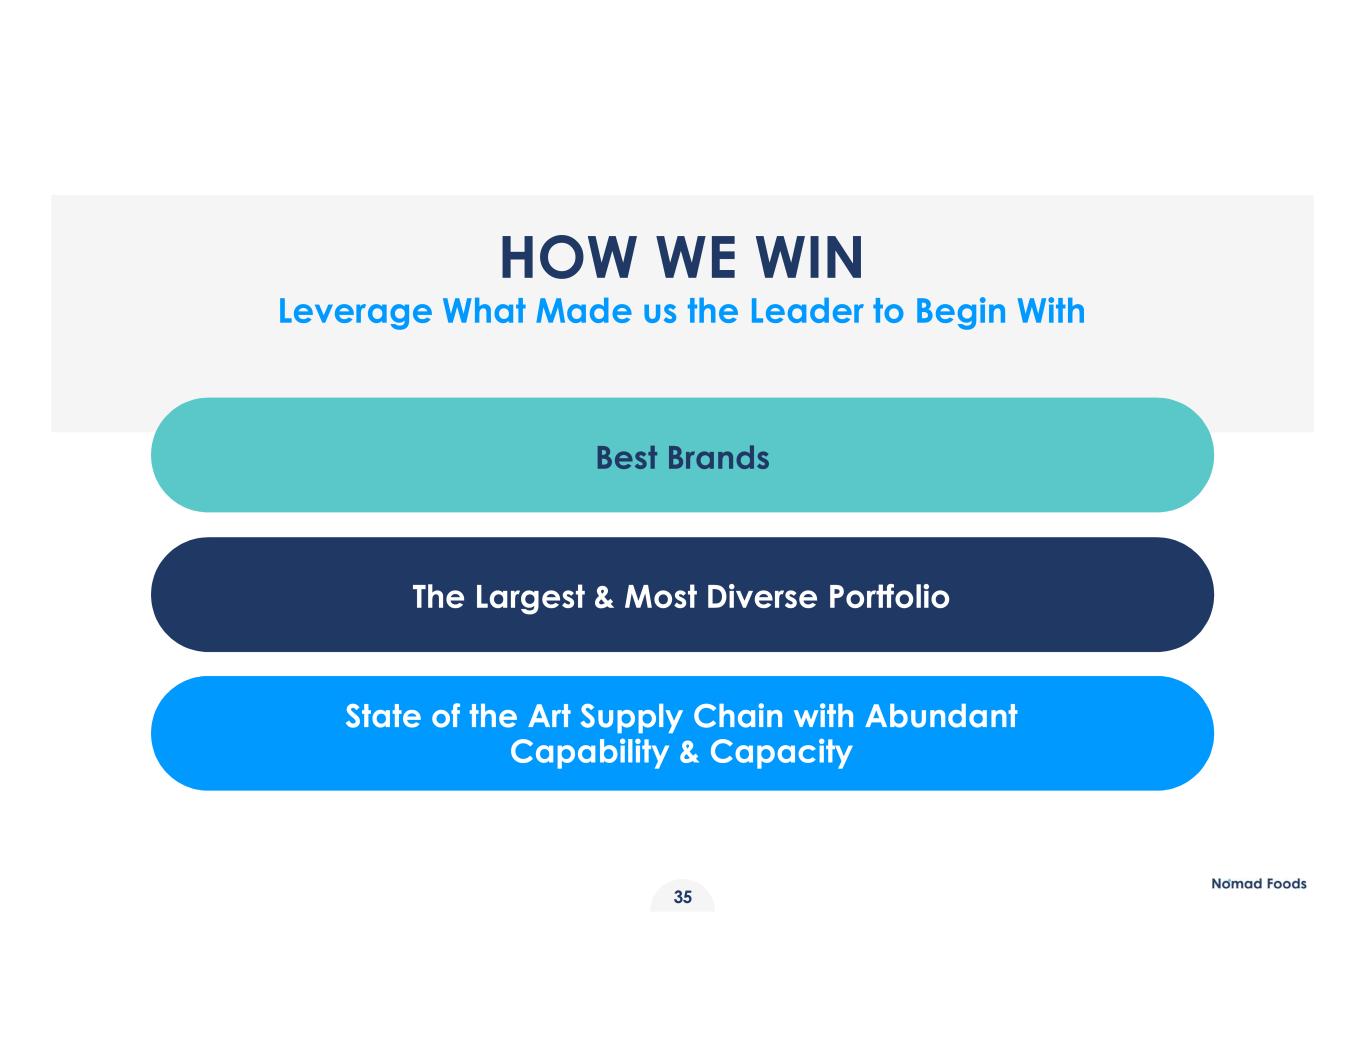
HOW WE WIN Leverage What Made us the Leader to Begin With Best Brands The Largest & Most Diverse Portfolio State of the Art Supply Chain with Abundant Capability & Capacity 35
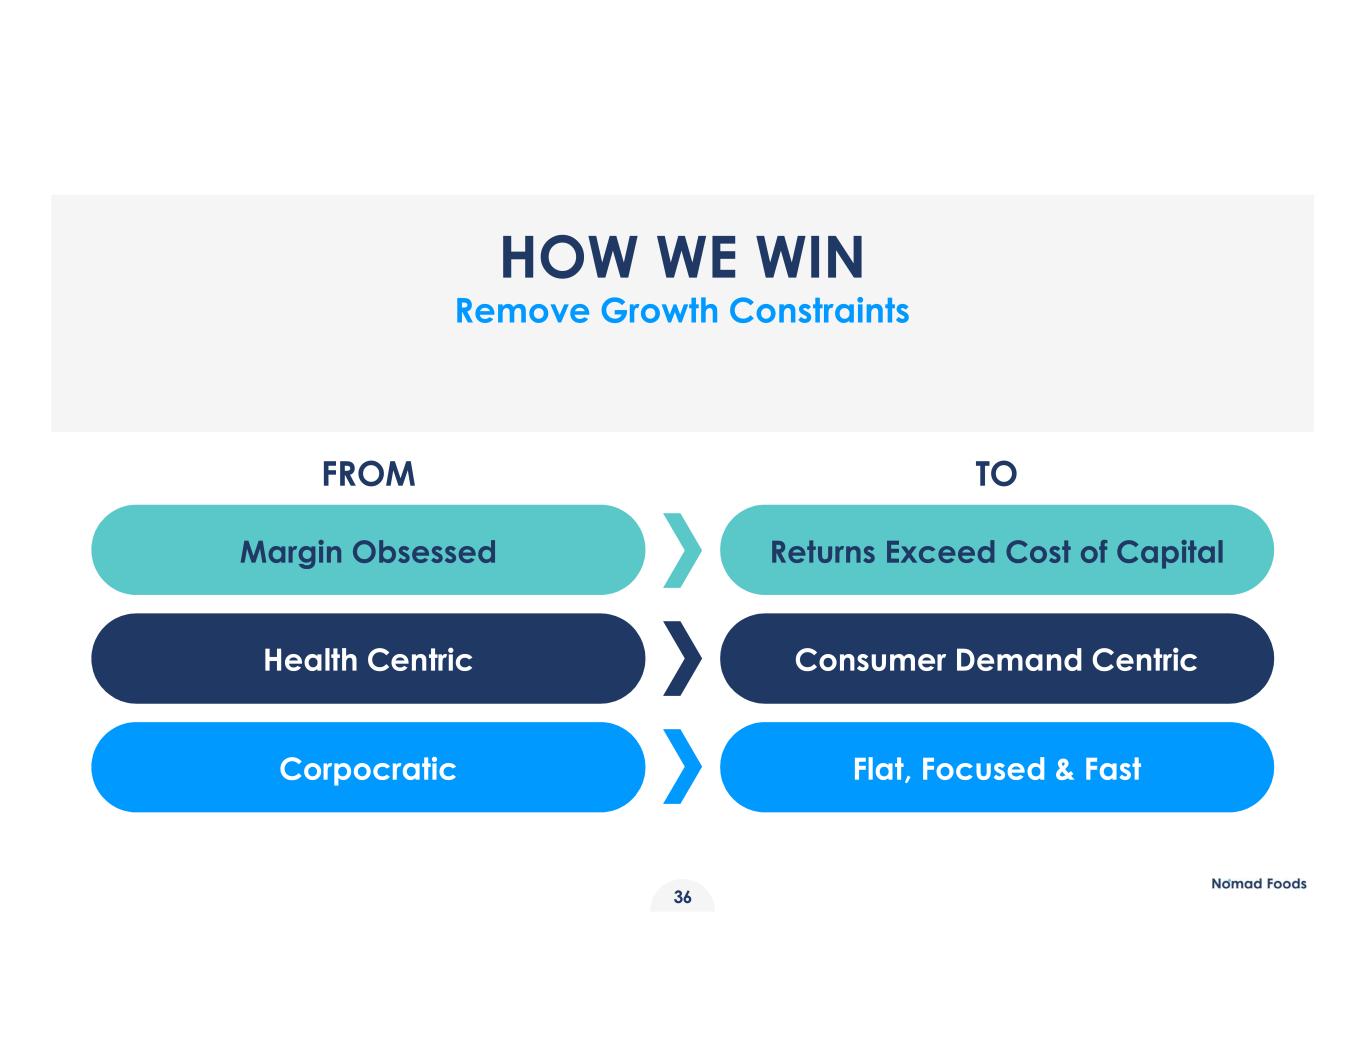
HOW WE WIN Remove Growth Constraints Health Centric FROM Corpocratic Margin Obsessed Consumer Demand Centric Flat, Focused & Fast Returns Exceed Cost of Capital TO 36
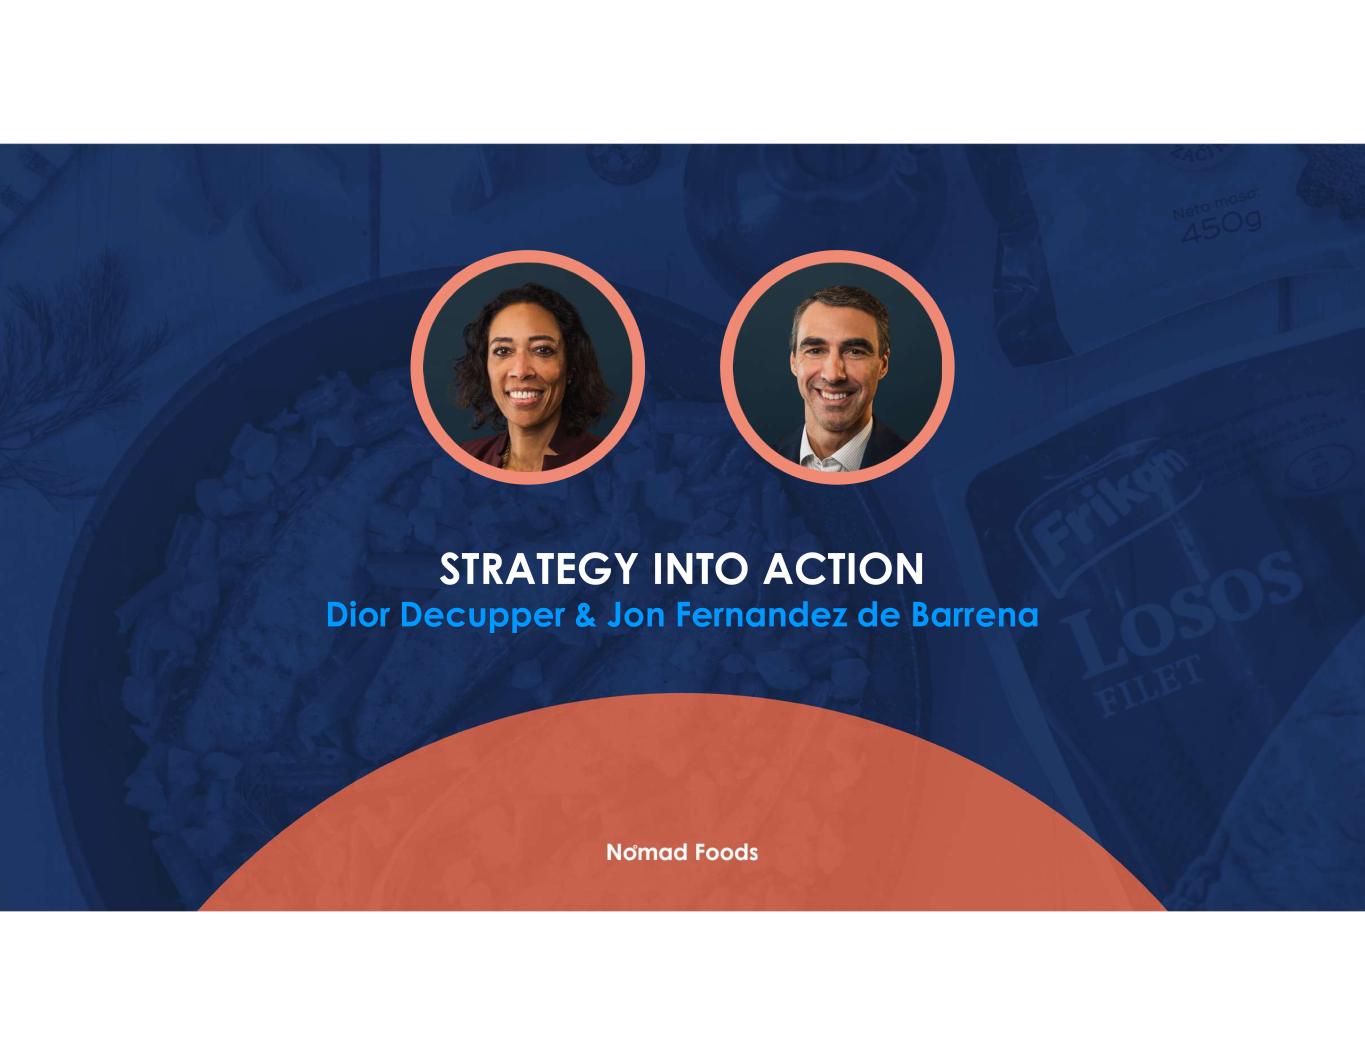
37 STRATEGY INTO ACTION Dior Decupper & Jon Fernandez de Barrena
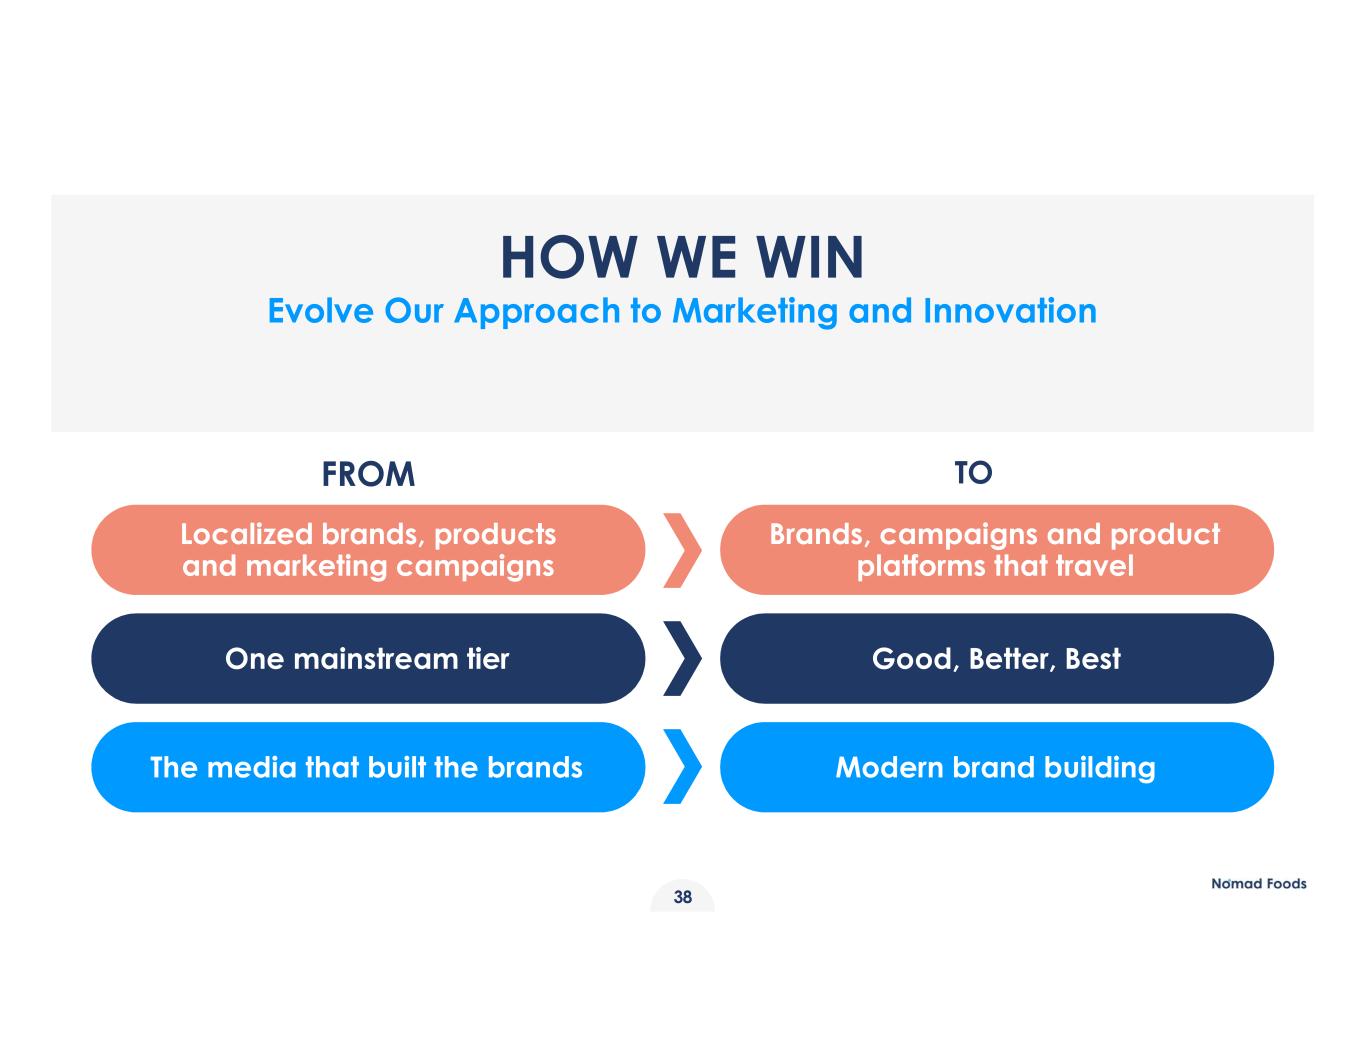
HOW WE WIN Evolve Our Approach to Marketing and Innovation One mainstream tier The media that built the brands Localized brands, products and marketing campaigns FROM Good, Better, Best Modern brand building Brands, campaigns and product platforms that travel TO 38
DEFENDING OUR CORE Captain: Fish Category 39
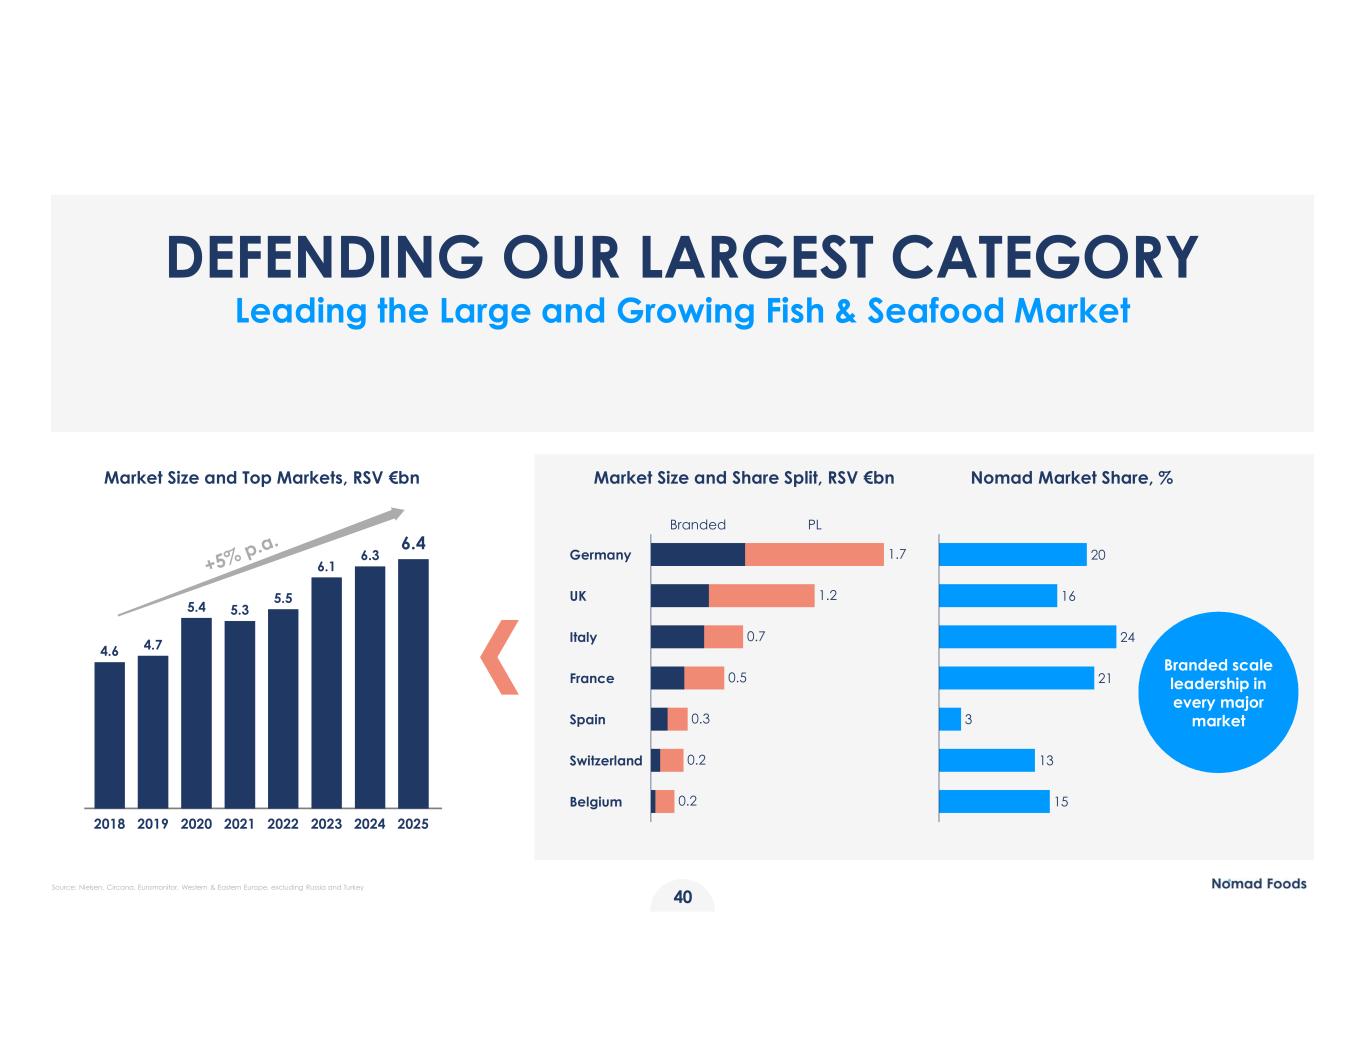
SMALLEST TITLE 40 Market Size and Top Markets, RSV €bn Market Size and Share Split, RSV €bn Nomad Market Share, % DEFENDING OUR LARGEST CATEGORY Leading the Large and Growing Fish & Seafood Market 2018 2019 2020 2021 2022 2023 2024 2025 4.6 4.7 5.4 5.3 5.5 6.1 6.3 6.4 Branded scale leadership in every major market Germany UK Italy France Spain Switzerland Belgium PLBranded 1.7 1.2 0.7 0.5 0.3 0.2 0.2 20 16 24 21 3 13 15 Source: Nielsen, Circana, Euromonitor, Western & Eastern Europe, excluding Russia and Turkey
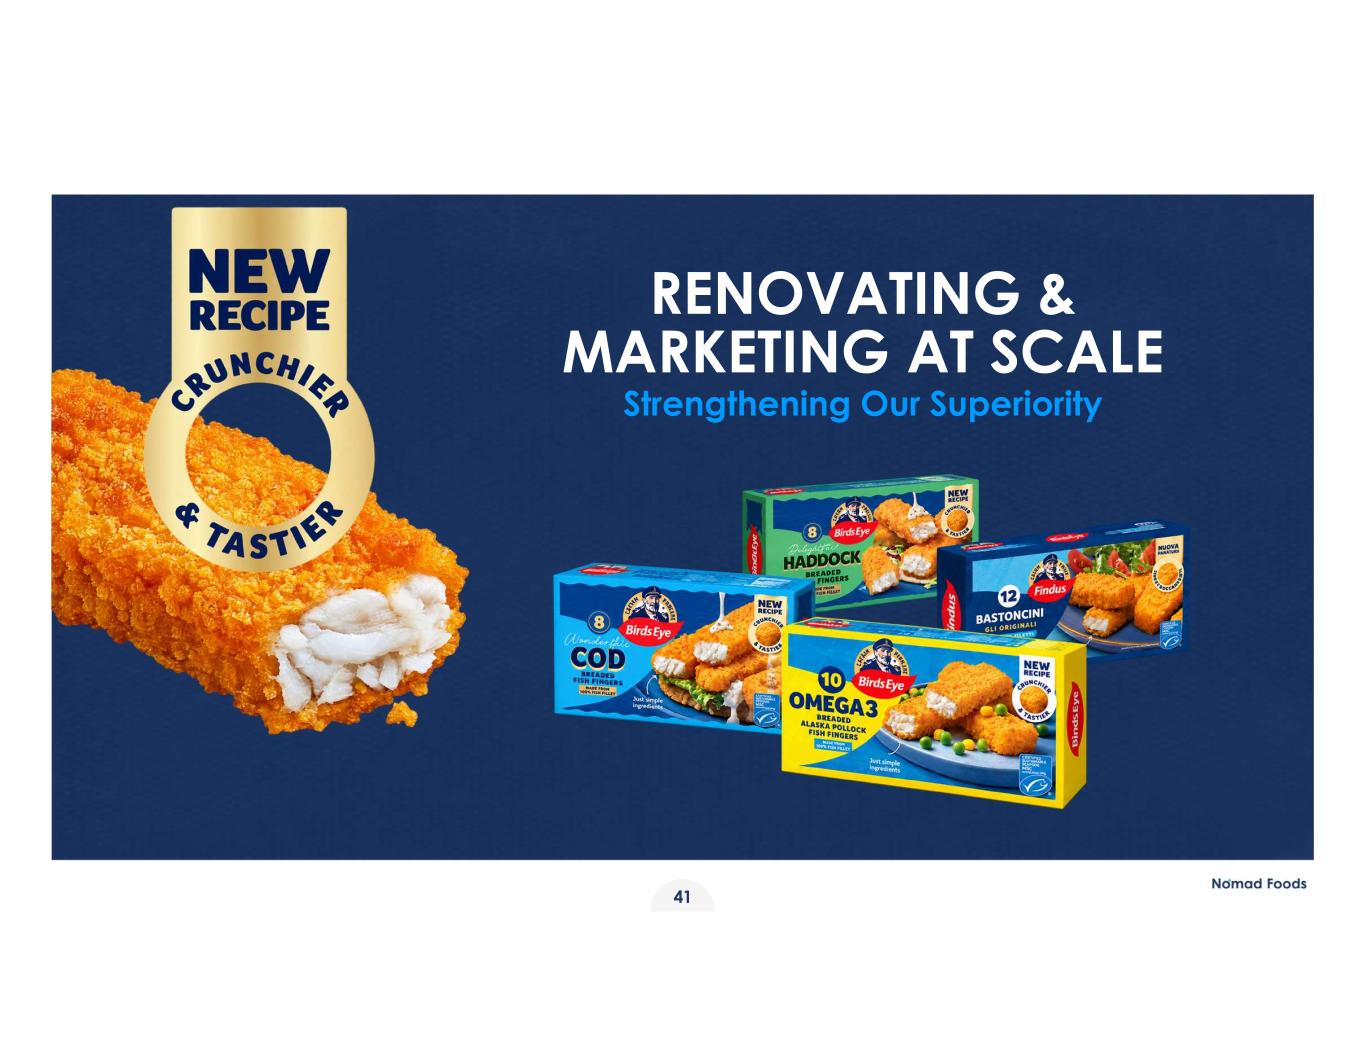
RENOVATING & MARKETING AT SCALE Strengthening Our Superiority 41
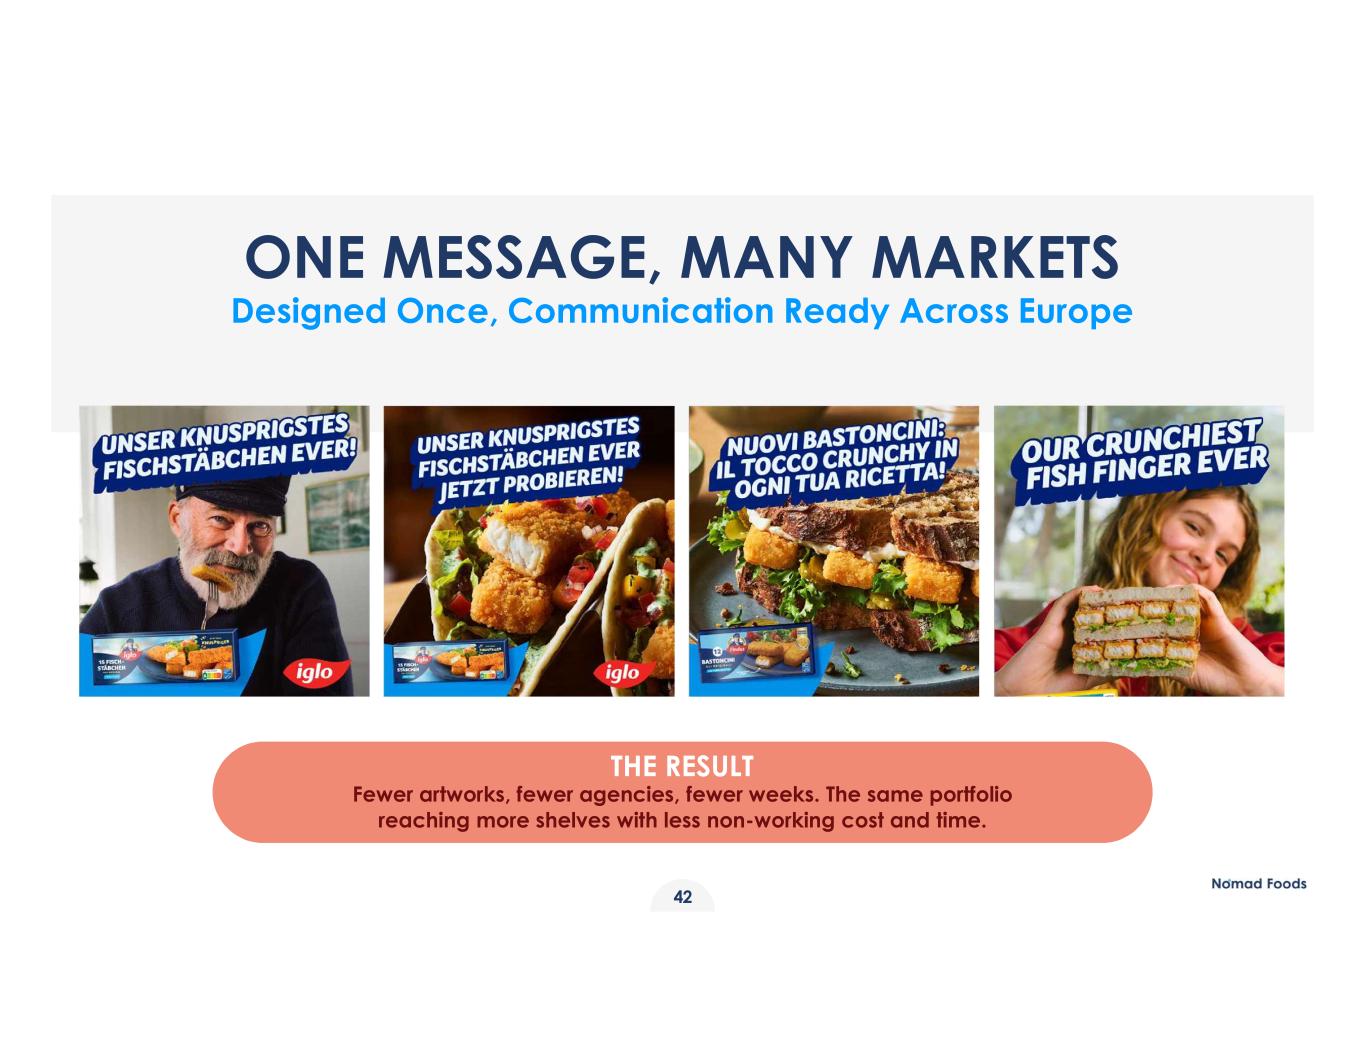
ONE MESSAGE, MANY MARKETS Designed Once, Communication Ready Across Europe THE RESULT Fewer artworks, fewer agencies, fewer weeks. The same portfolio reaching more shelves with less non-working cost and time. 42
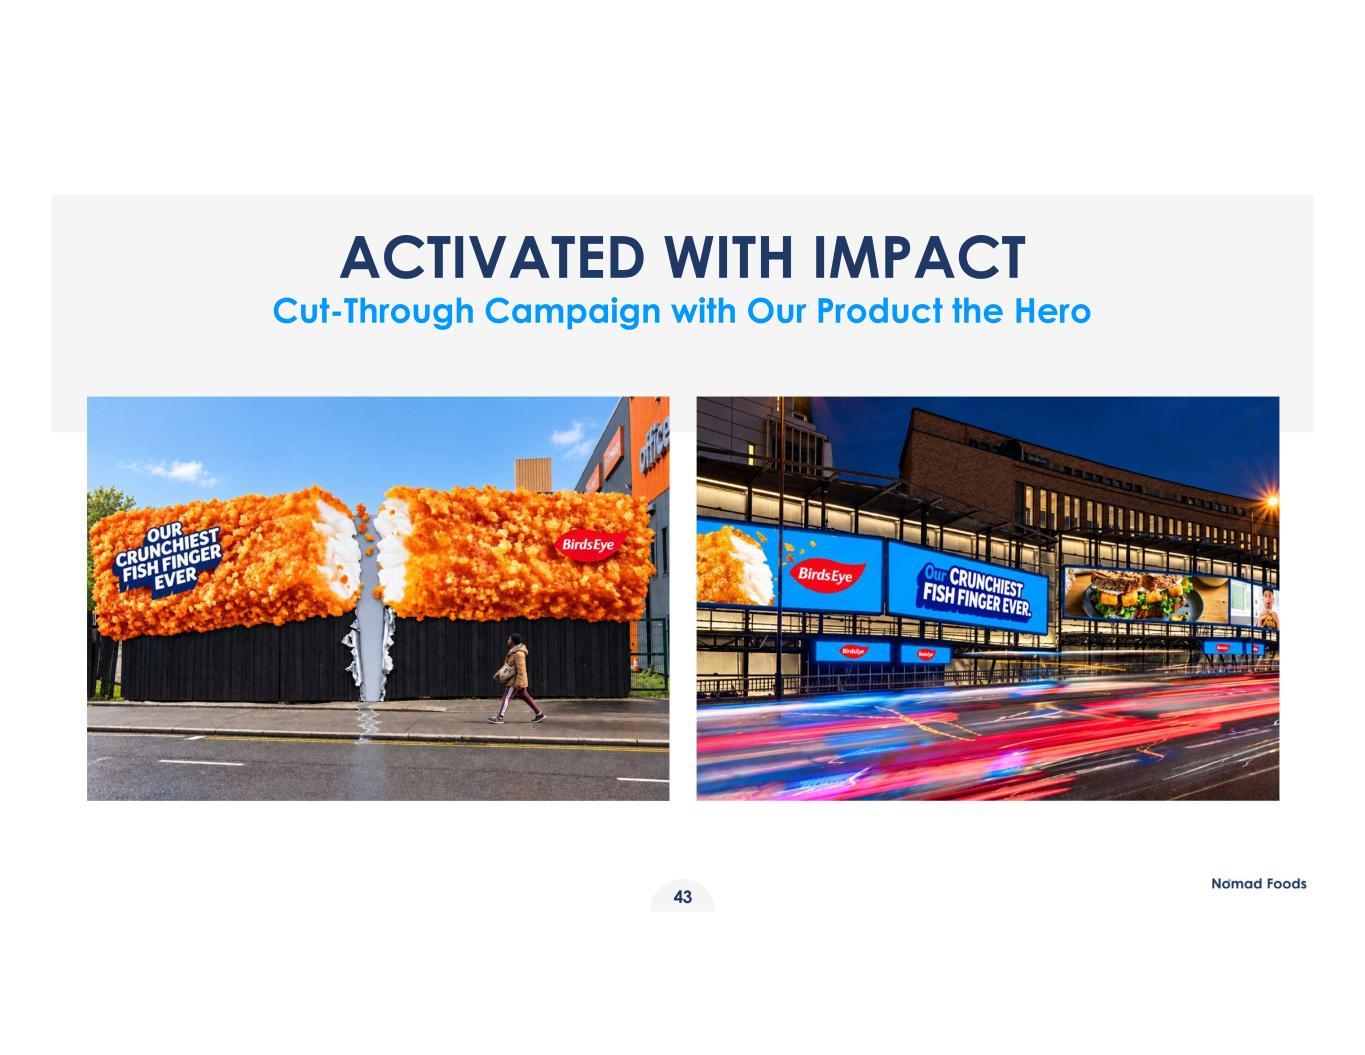
ACTIVATED WITH IMPACT Cut-Through Campaign with Our Product the Hero 43
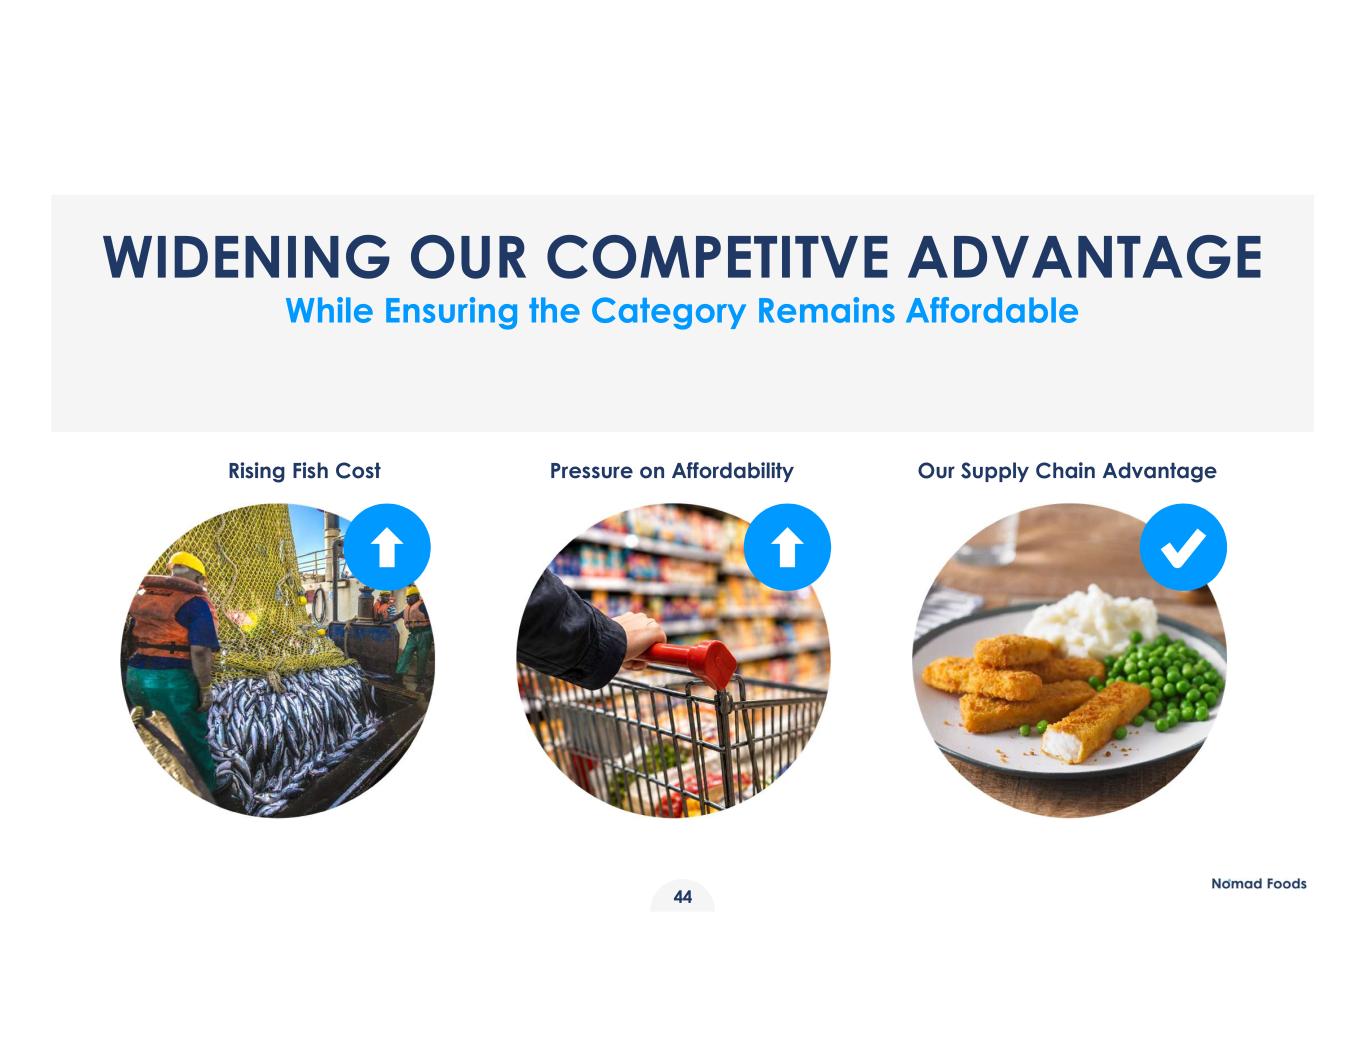
Rising Fish Cost Pressure on Affordability Our Supply Chain Advantage WIDENING OUR COMPETITVE ADVANTAGE While Ensuring the Category Remains Affordable 44
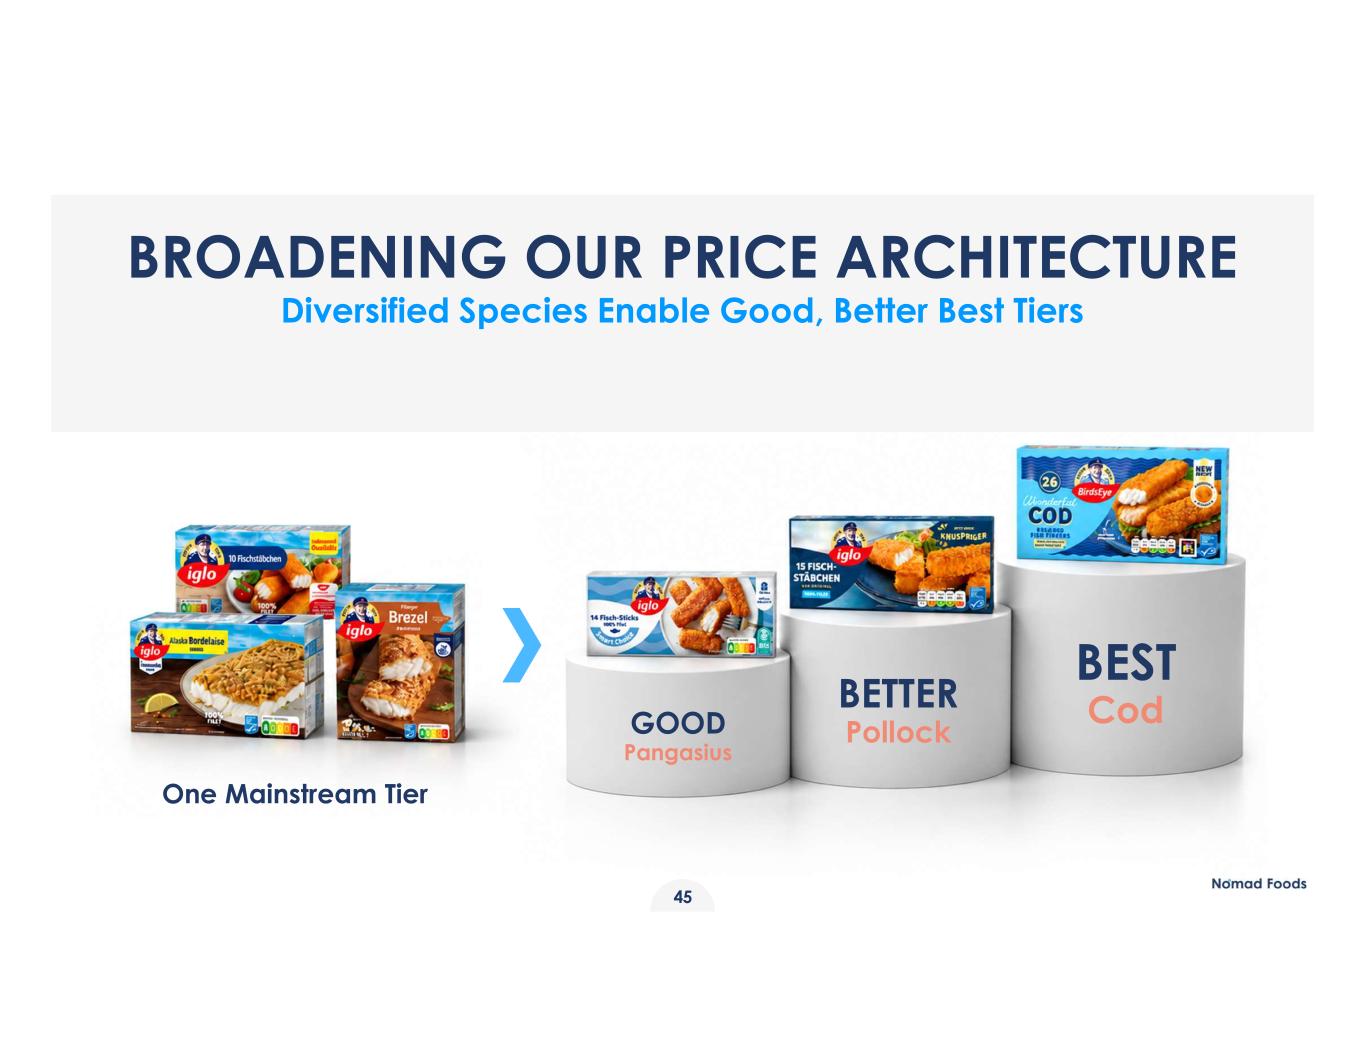
BROADENING OUR PRICE ARCHITECTURE Diversified Species Enable Good, Better Best Tiers GOOD Pangasius BETTER Pollock BEST Cod One Mainstream Tier 45

DEFENDING OUR CORE Captain: Vegetable Category 46
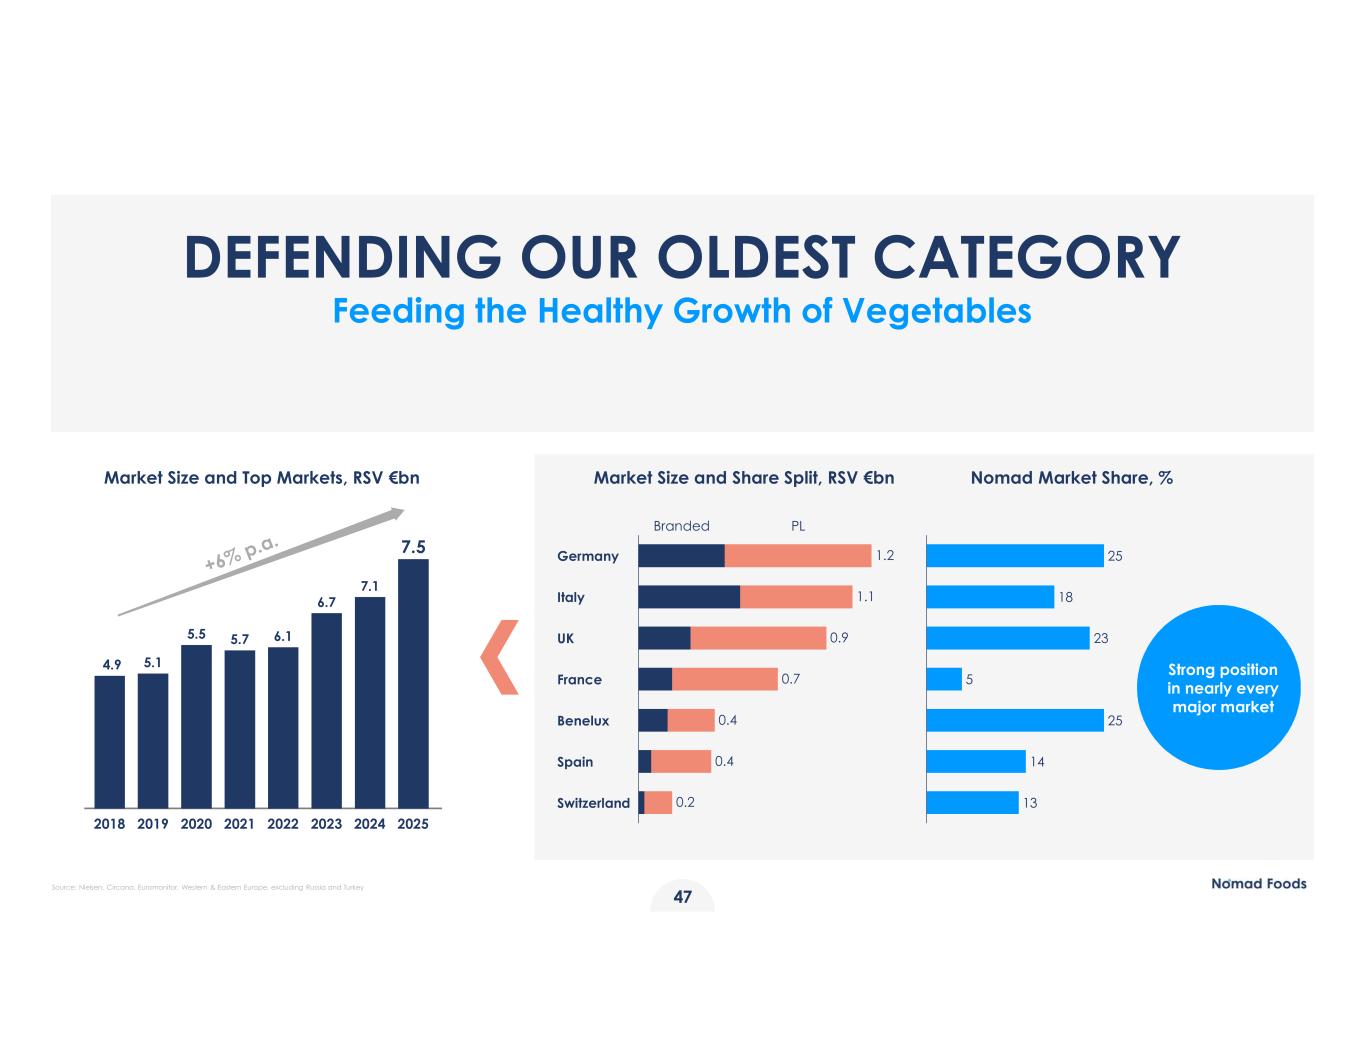
SMALLEST TITLE 47 DEFENDING OUR OLDEST CATEGORY Feeding the Healthy Growth of Vegetables 2018 2019 2020 2021 2022 2023 2024 2025 4.9 5.1 5.5 5.7 6.1 6.7 7.1 7.5 Strong position in nearly every major market Germany Italy UK France Benelux Spain Switzerland PLBranded 1.2 1.1 0.9 0.7 0.4 0.4 0.2 25 18 23 5 25 14 13 Market Size and Top Markets, RSV €bn Market Size and Share Split, RSV €bn Nomad Market Share, % Source: Nielsen, Circana, Euromonitor, Western & Eastern Europe, excluding Russia and Turkey
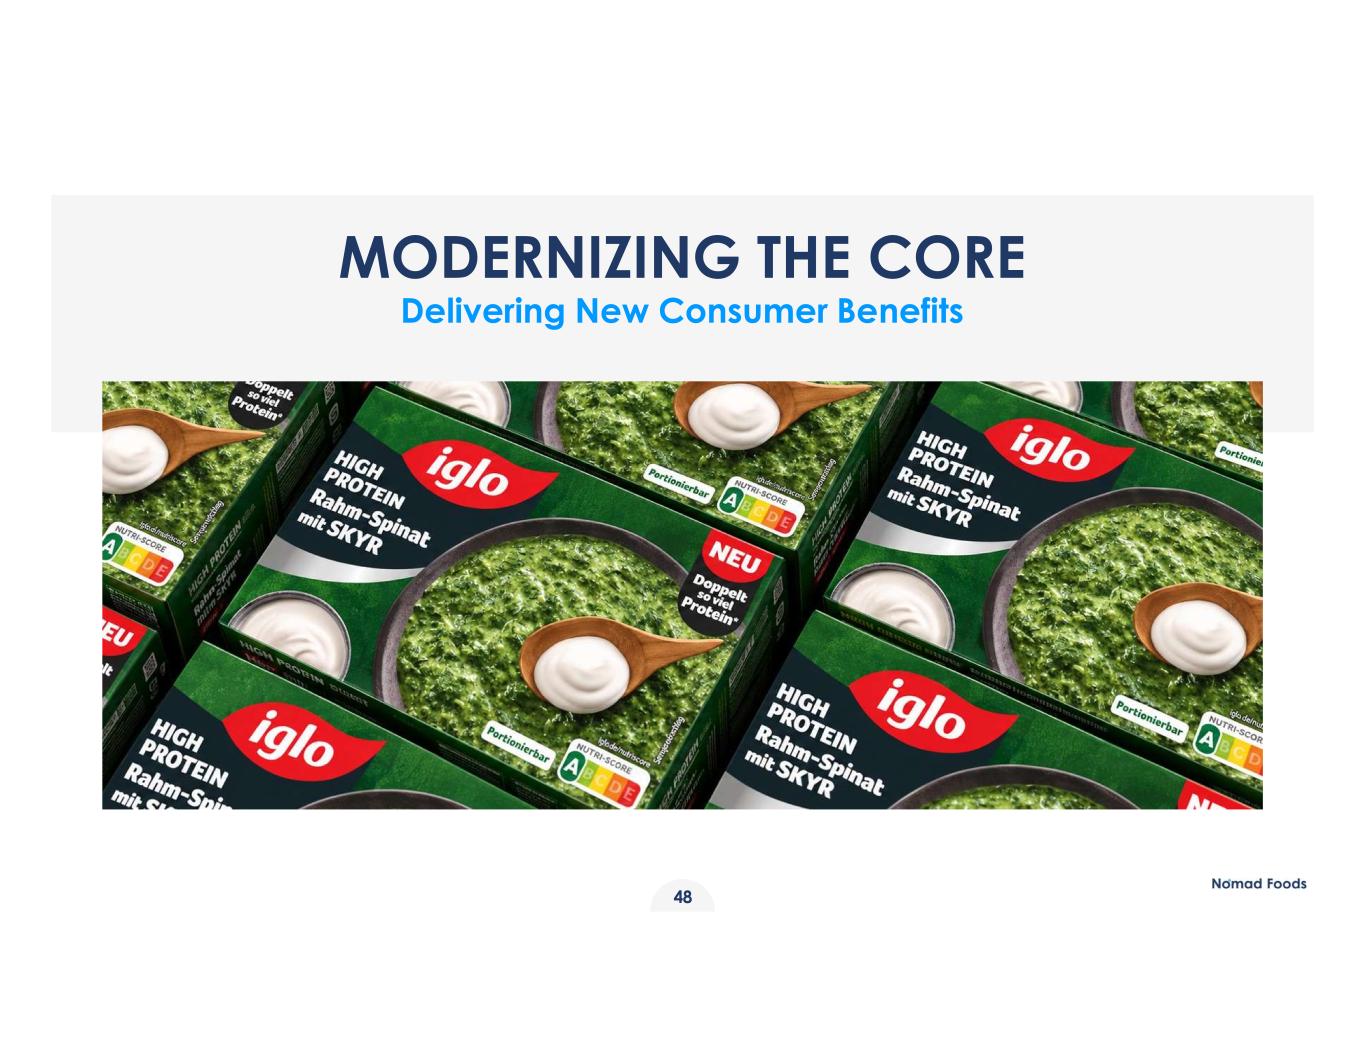
MODERNIZING THE CORE Delivering New Consumer Benefits 48
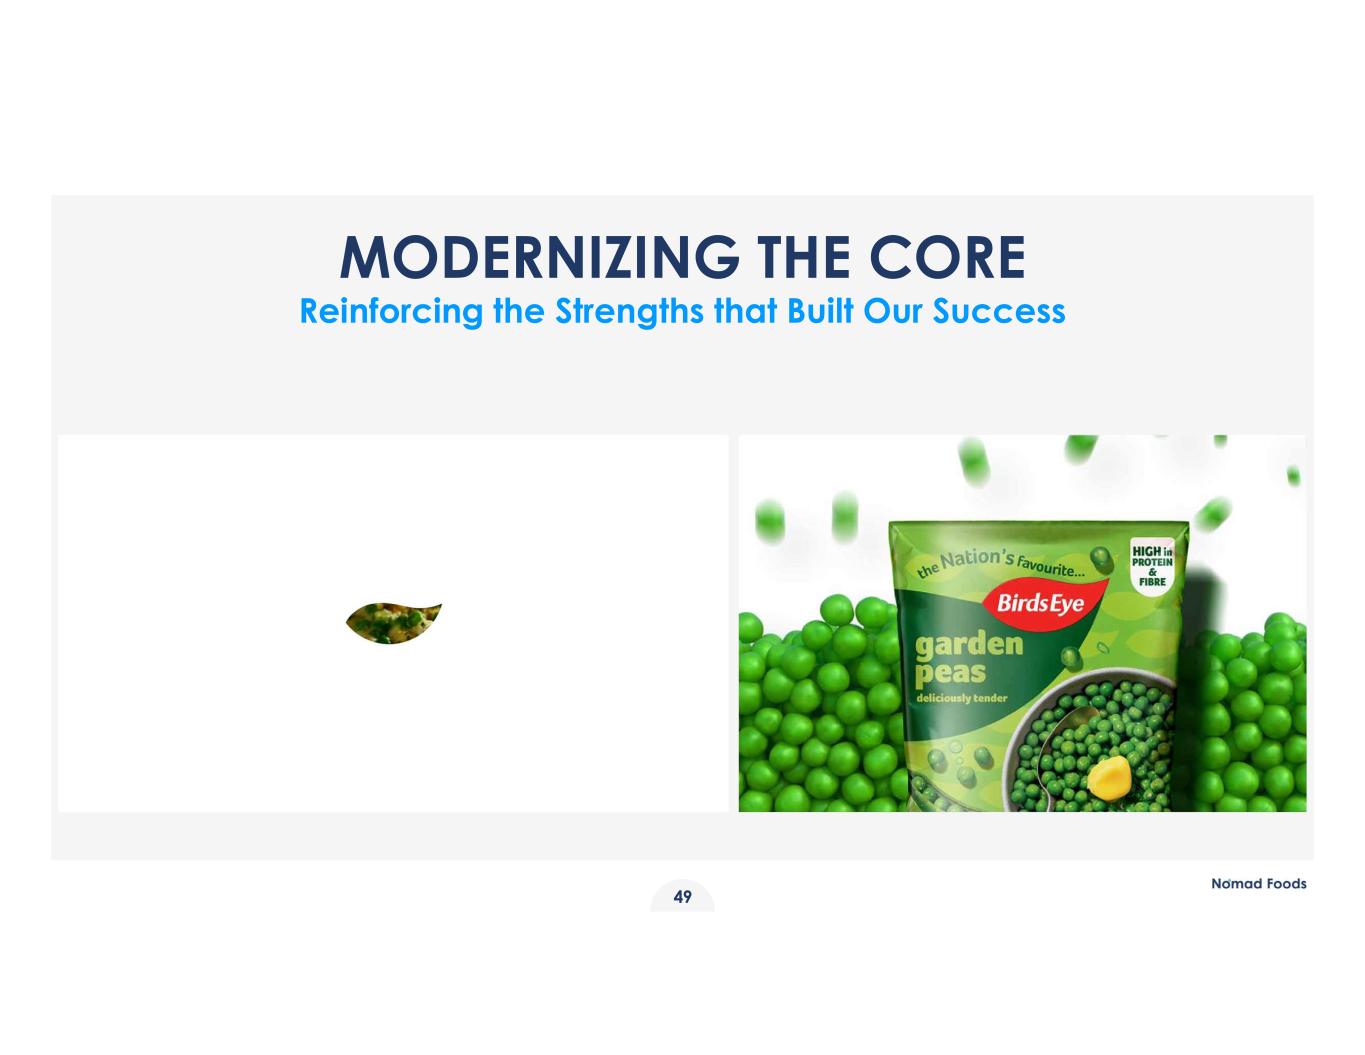
MODERNIZING THE CORE Reinforcing the Strengths that Built Our Success 49
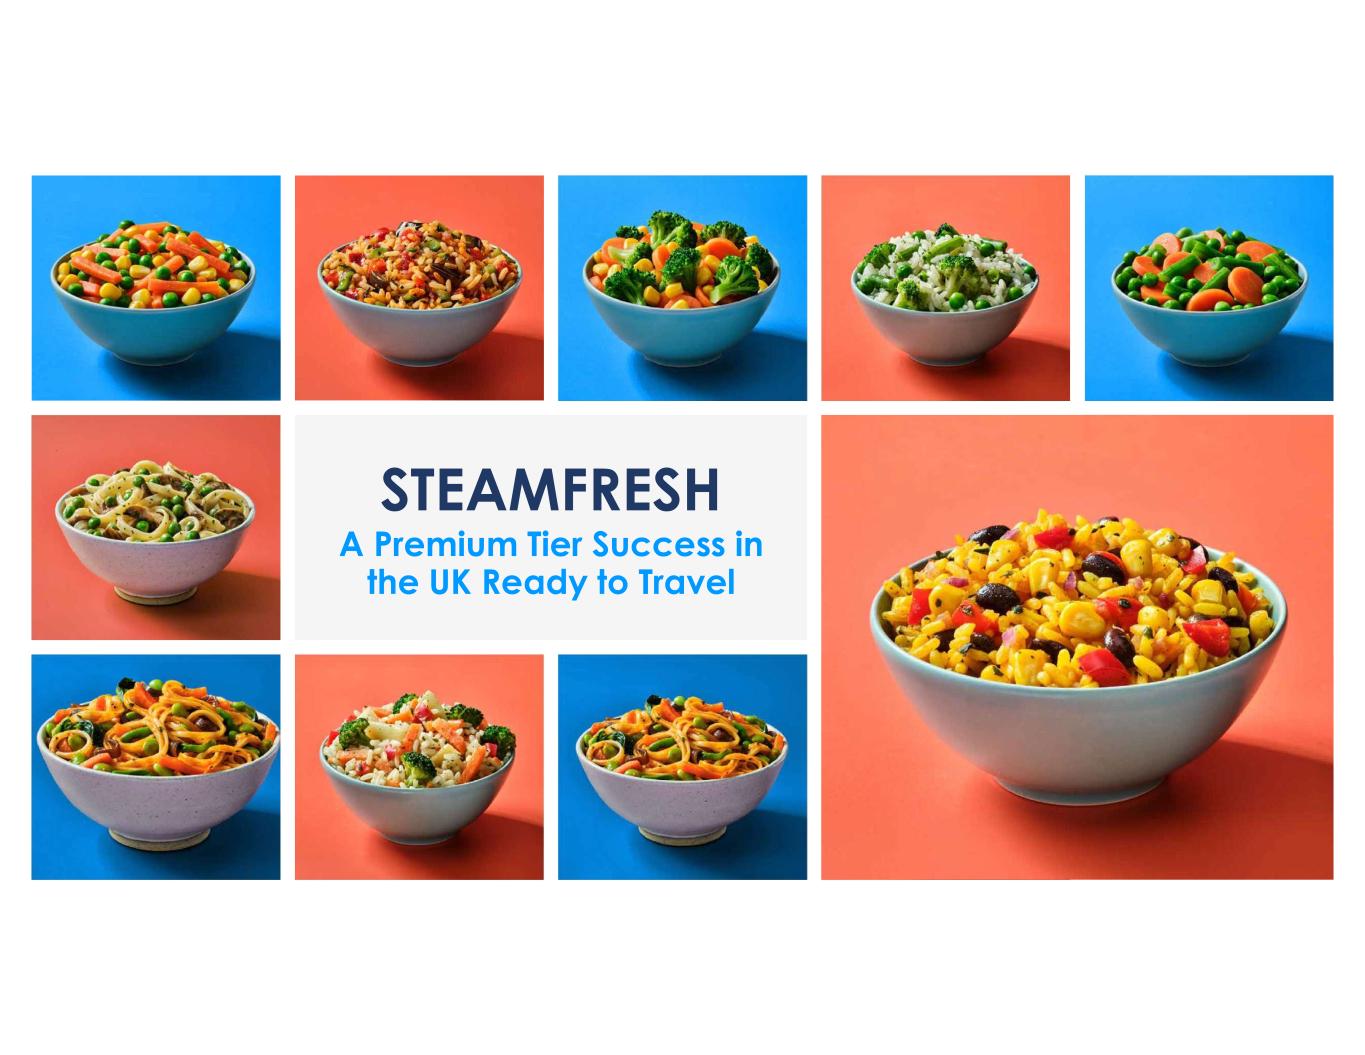
STEAMFRESH A Premium Tier Success in the UK Ready to Travel
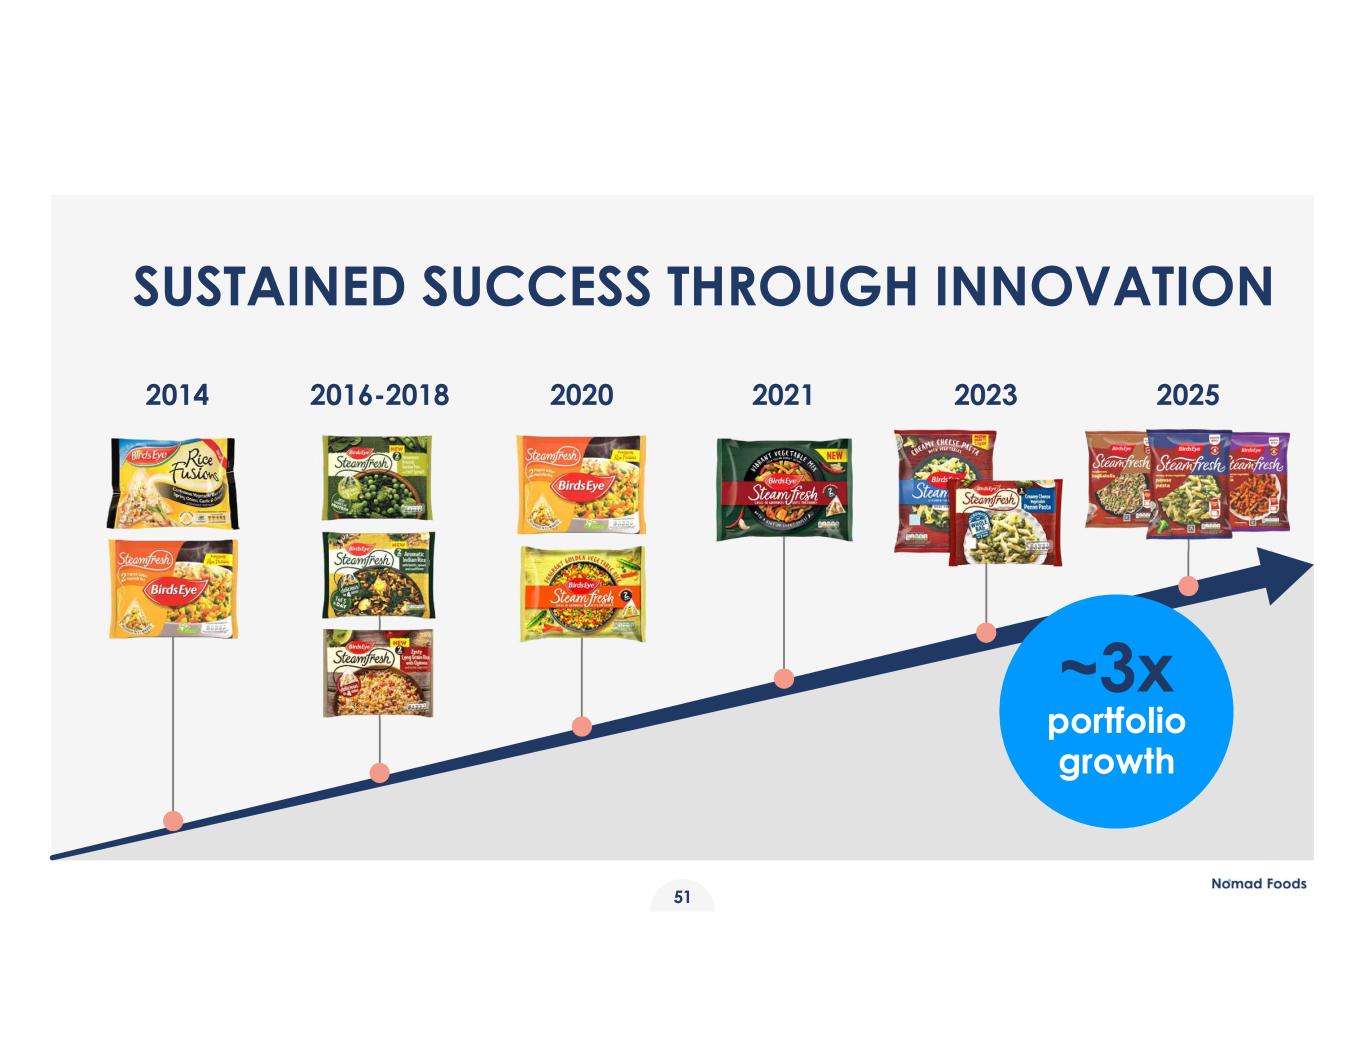
SUSTAINED SUCCESS THROUGH INNOVATION 2014 2016-2018 2020 2021 2023 2025 ~3x portfolio growth 51
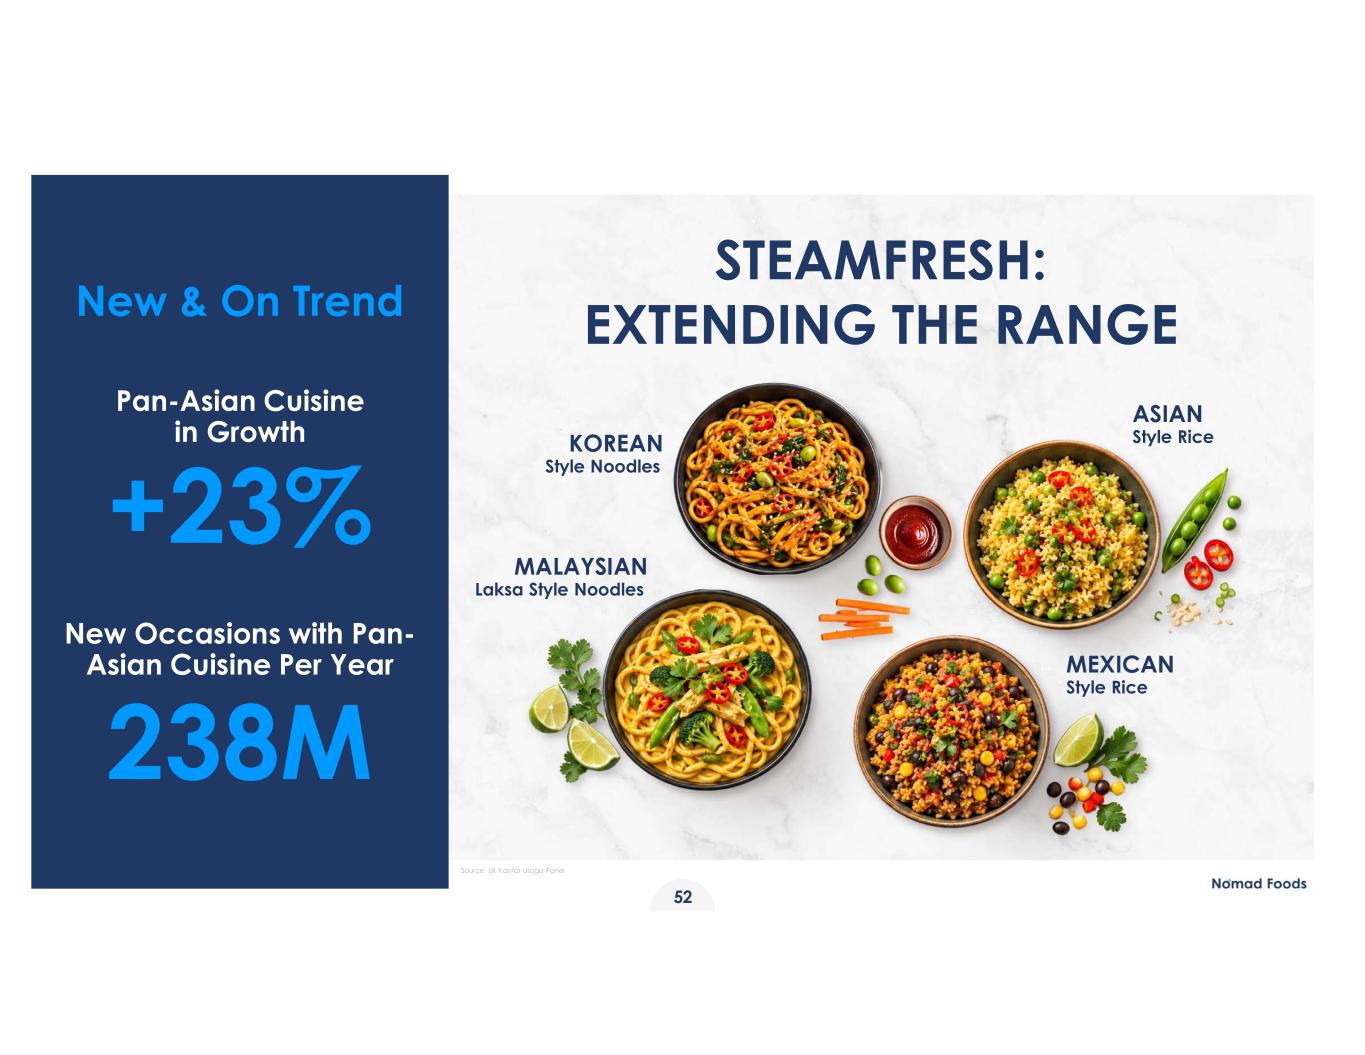
New & On Trend Pan-Asian Cuisine in Growth +23% New Occasions with Pan- Asian Cuisine Per Year 238M Source: UK Kantar Usage Panel STEAMFRESH: EXTENDING THE RANGE KOREAN Style Noodles MEXICAN Style Rice ASIAN Style Rice MALAYSIAN Laksa Style Noodles 52
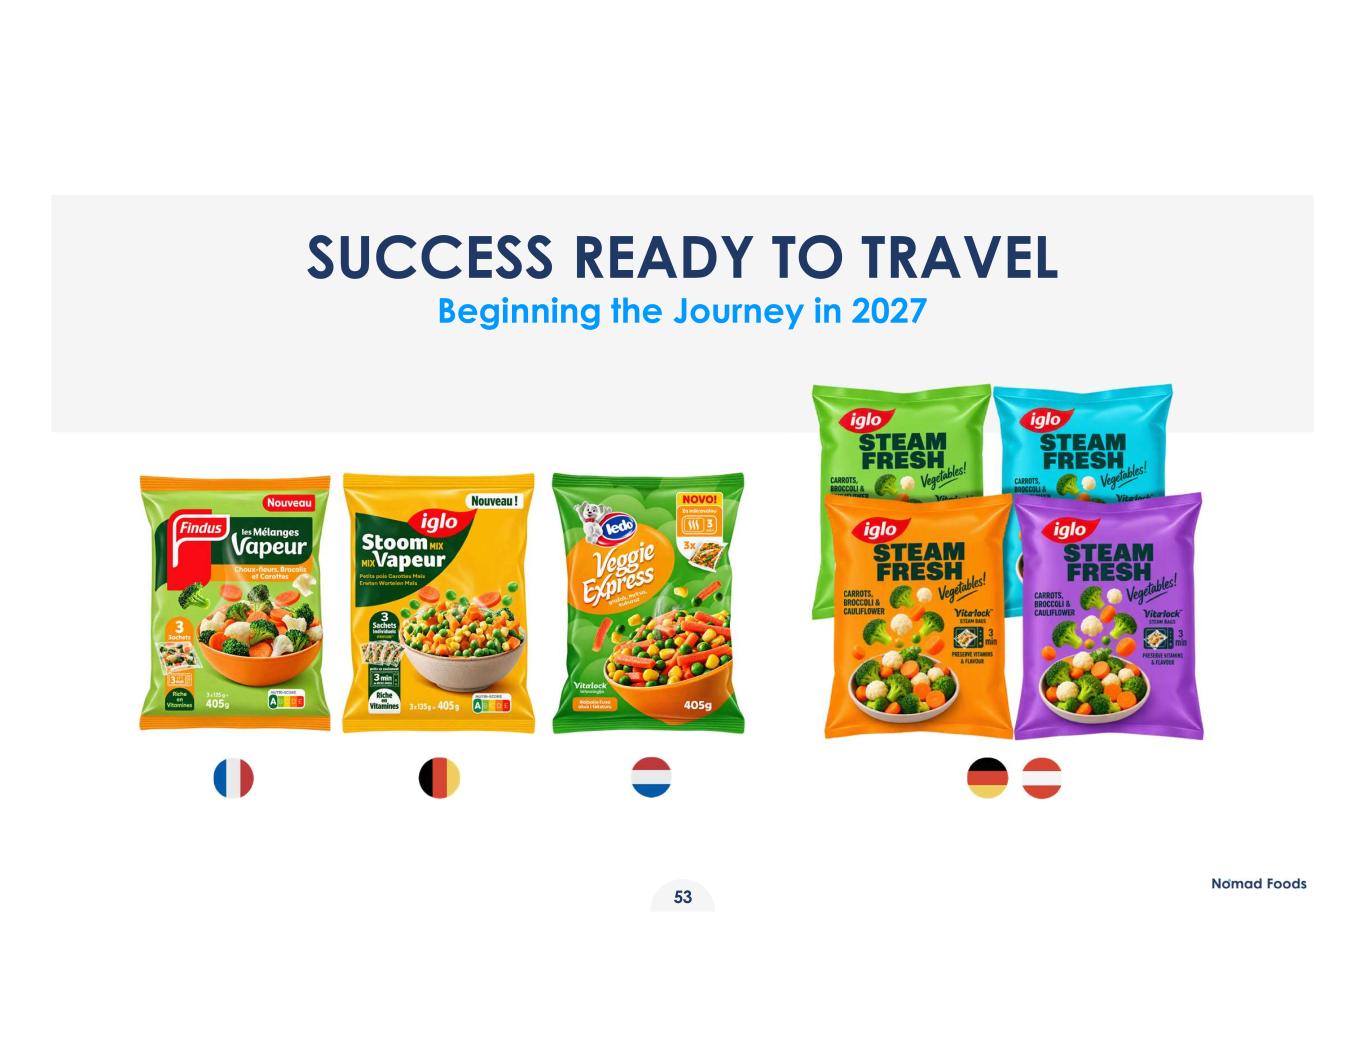
SUCCESS READY TO TRAVEL Beginning the Journey in 2027 53
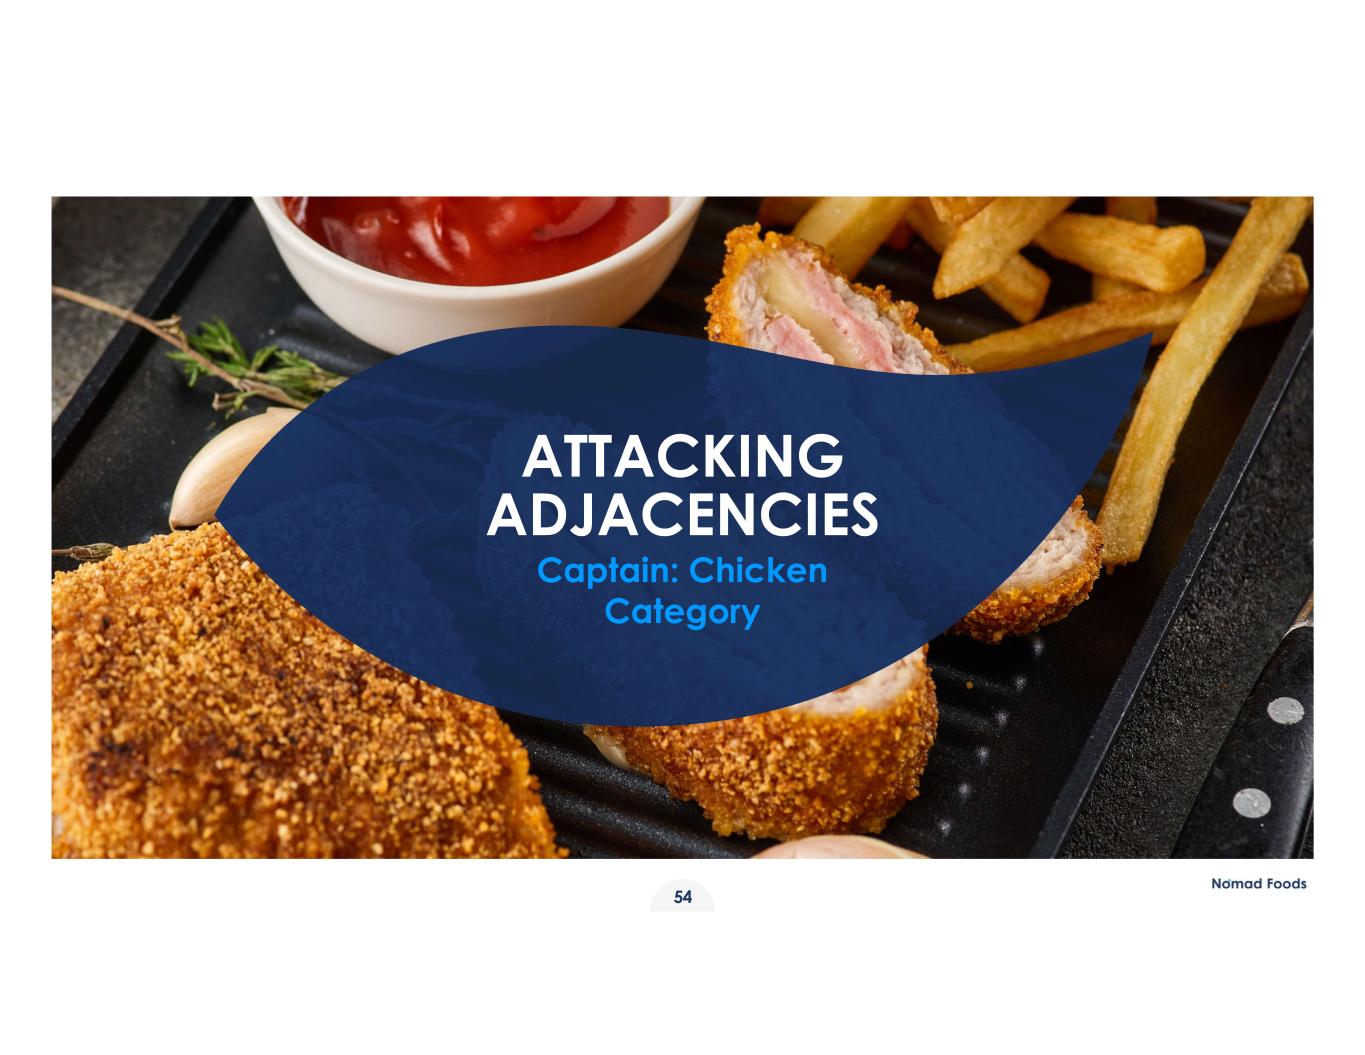
ATTACKING ADJACENCIES Captain: Chicken Category 54
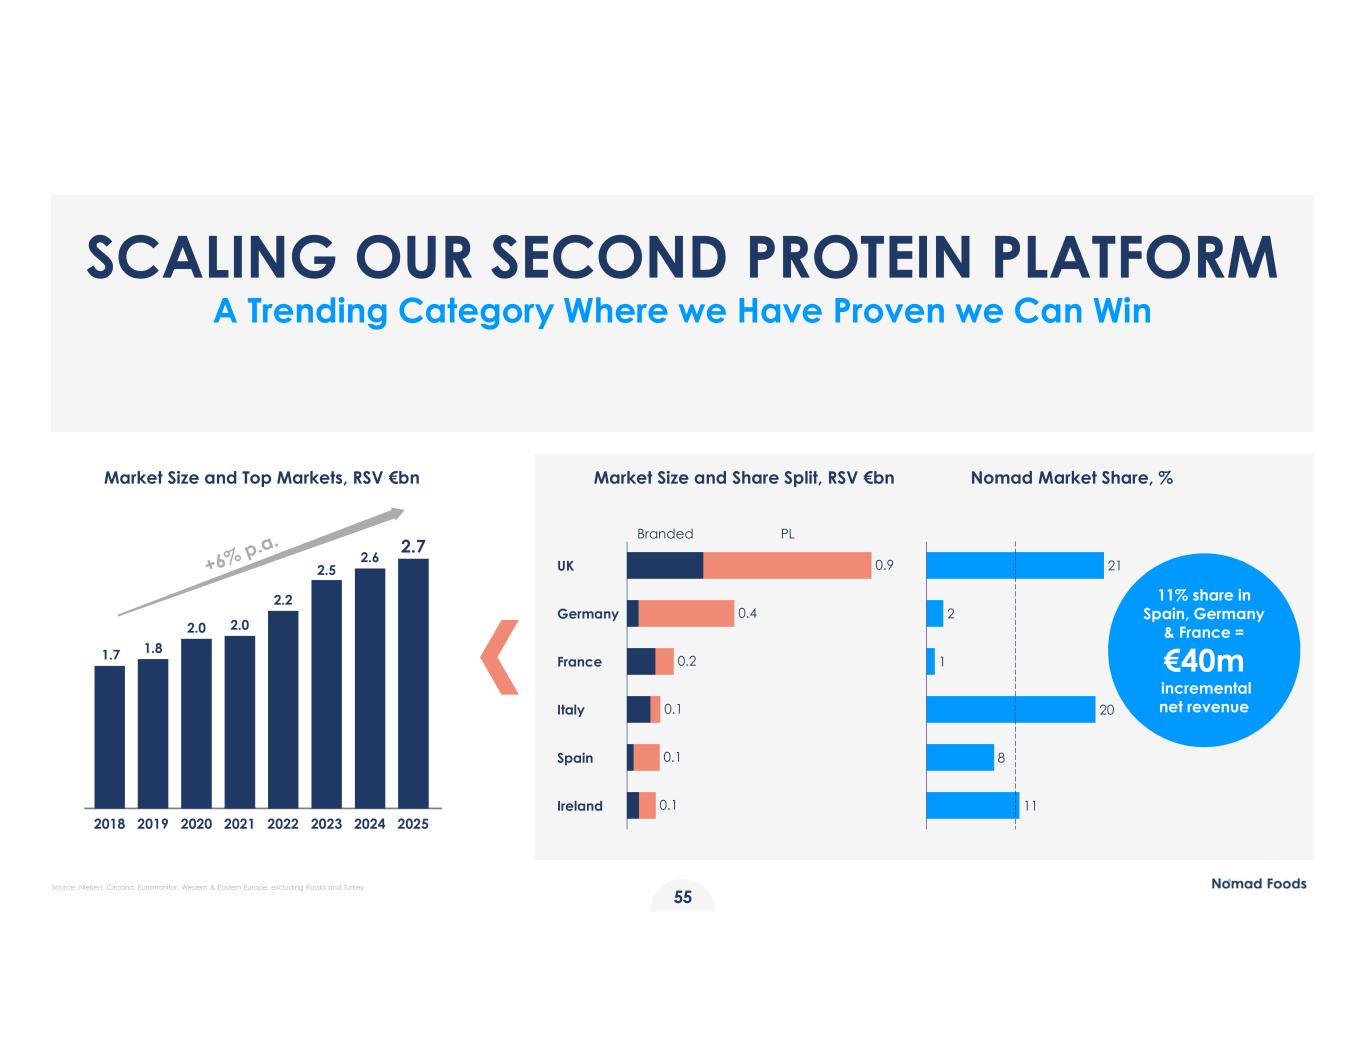
SMALLEST TITLE 55 UK Germany France Italy Spain Ireland PLBranded 0.9 0.4 0.2 0.1 0.1 0.1 Market Size and Top Markets, RSV €bn Market Size and Share Split, RSV €bn Nomad Market Share, % SCALING OUR SECOND PROTEIN PLATFORM A Trending Category Where we Have Proven we Can Win 2018 2019 2020 2021 2022 2023 2024 2025 1.7 1.8 2.0 2.0 2.2 2.5 2.6 2.7 21 2 1 20 8 11 11% share in Spain, Germany & France = €40m incremental net revenue Source: Nielsen, Circana, Euromonitor, Western & Eastern Europe, excluding Russia and Turkey
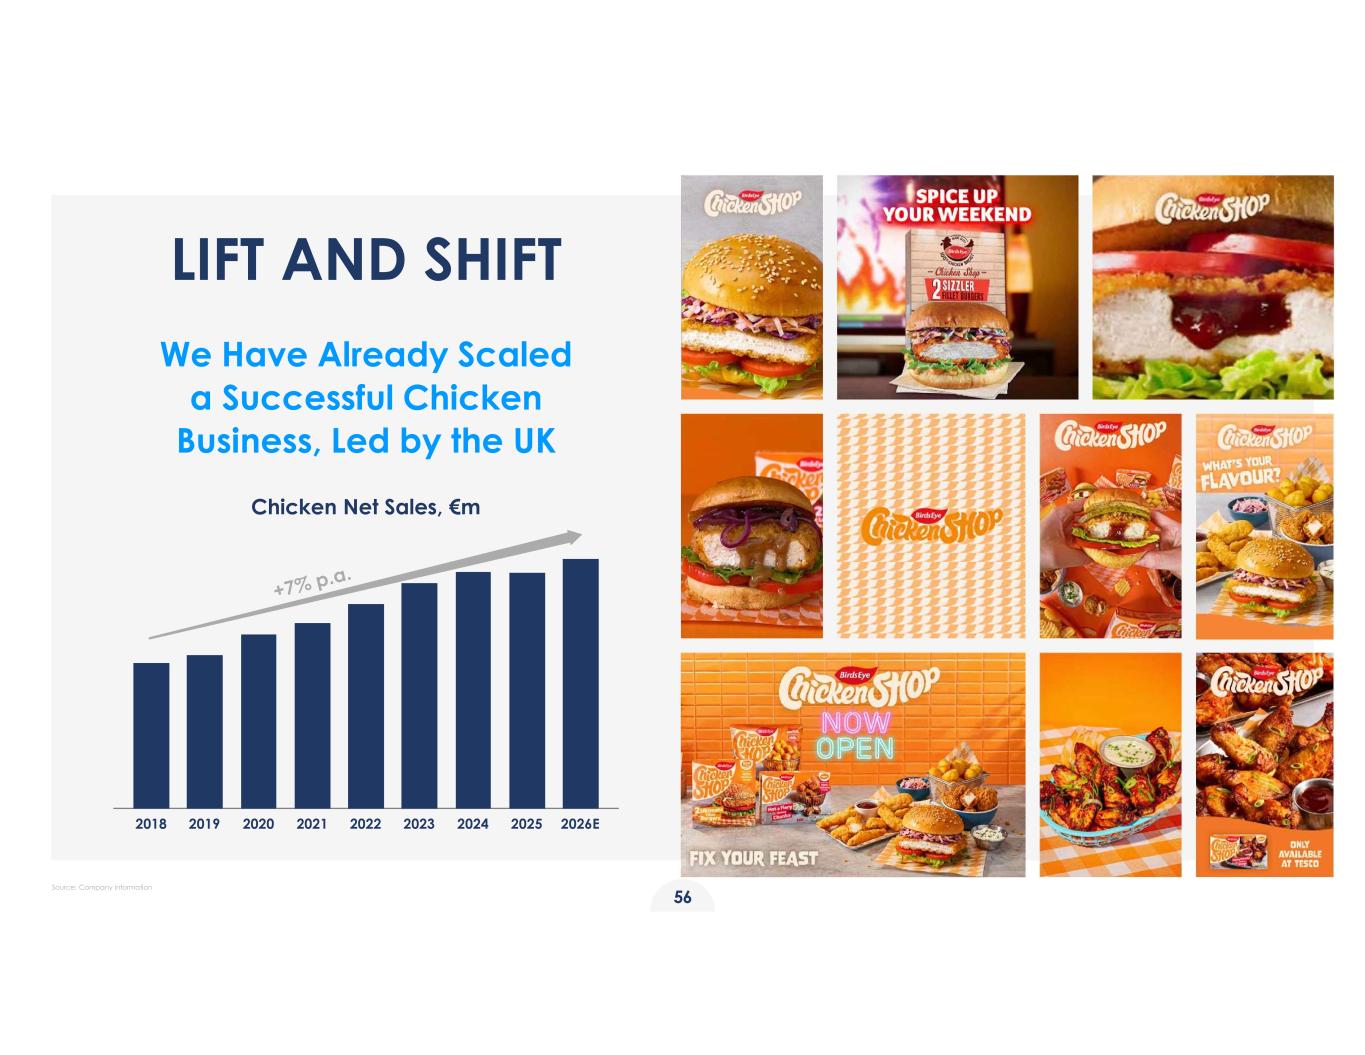
LIFT AND SHIFT 2018 2019 2020 2021 2022 2023 2024 2025 2026E We Have Already Scaled a Successful Chicken Business, Led by the UK Chicken Net Sales, €m 56 Source: Company information

video 57
58
ATTACKING ADJACENCIES Captain: Meals Category 59
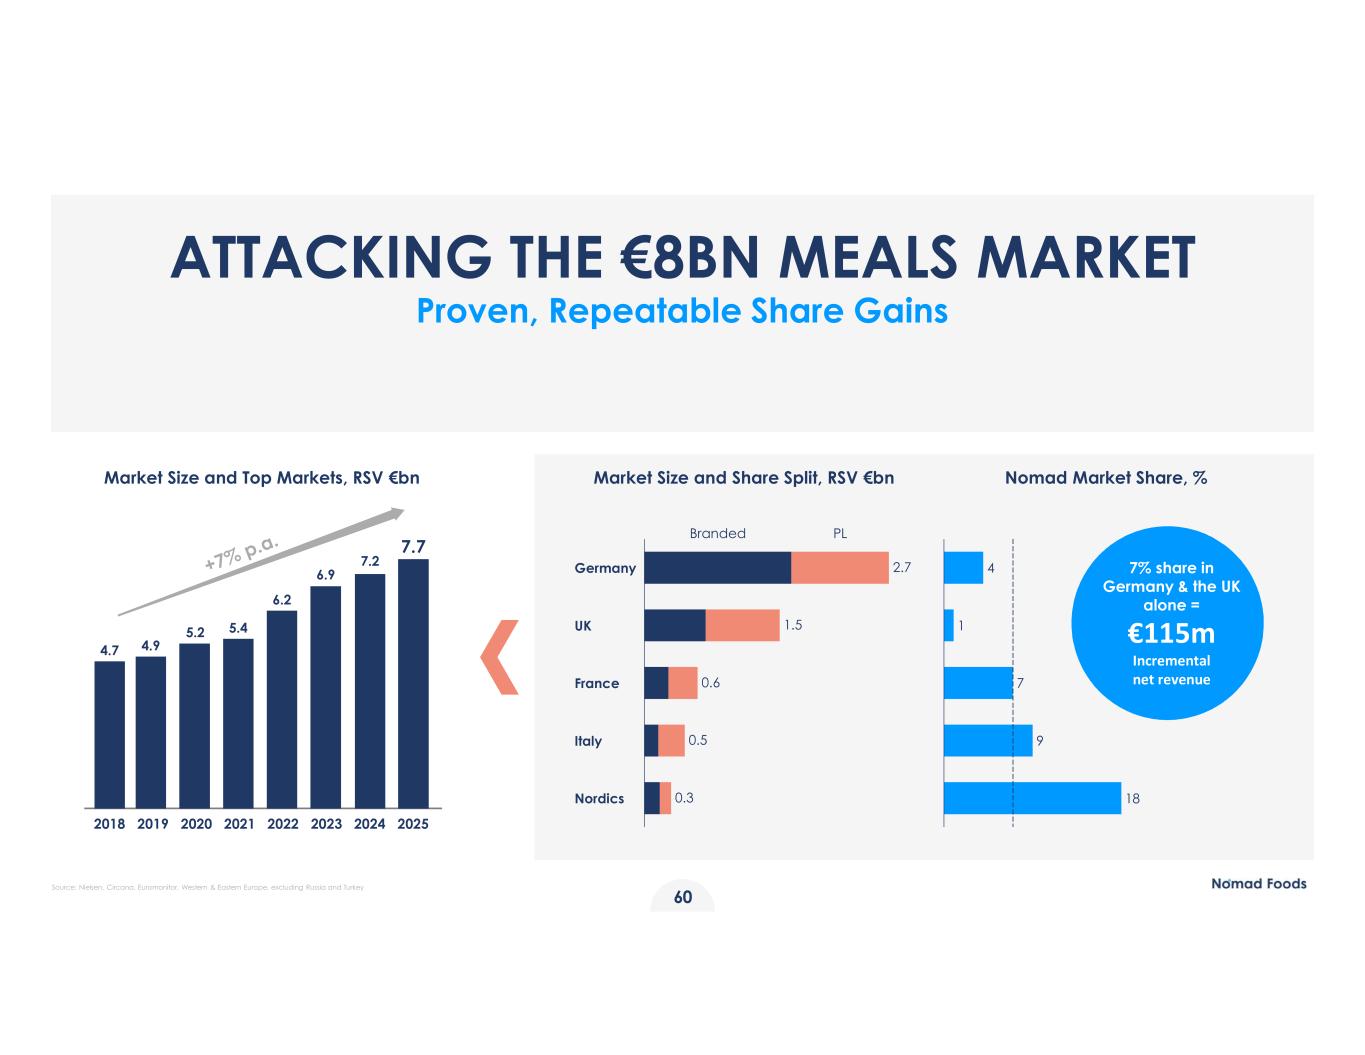
SMALLEST TITLE 60 Germany UK France Italy Nordics PLBranded 2.7 1.5 0.6 0.5 0.3 Market Size and Top Markets, RSV €bn Market Size and Share Split, RSV €bn Nomad Market Share, % 4 1 7 9 18 ATTACKING THE €8BN MEALS MARKET Proven, Repeatable Share Gains 2018 2019 2020 2021 2022 2023 2024 2025 4.7 4.9 5.2 5.4 6.2 7.2 6.9 7.7 7% share in Germany & the UK alone = €115m Incremental net revenue Source: Nielsen, Circana, Euromonitor, Western & Eastern Europe, excluding Russia and Turkey
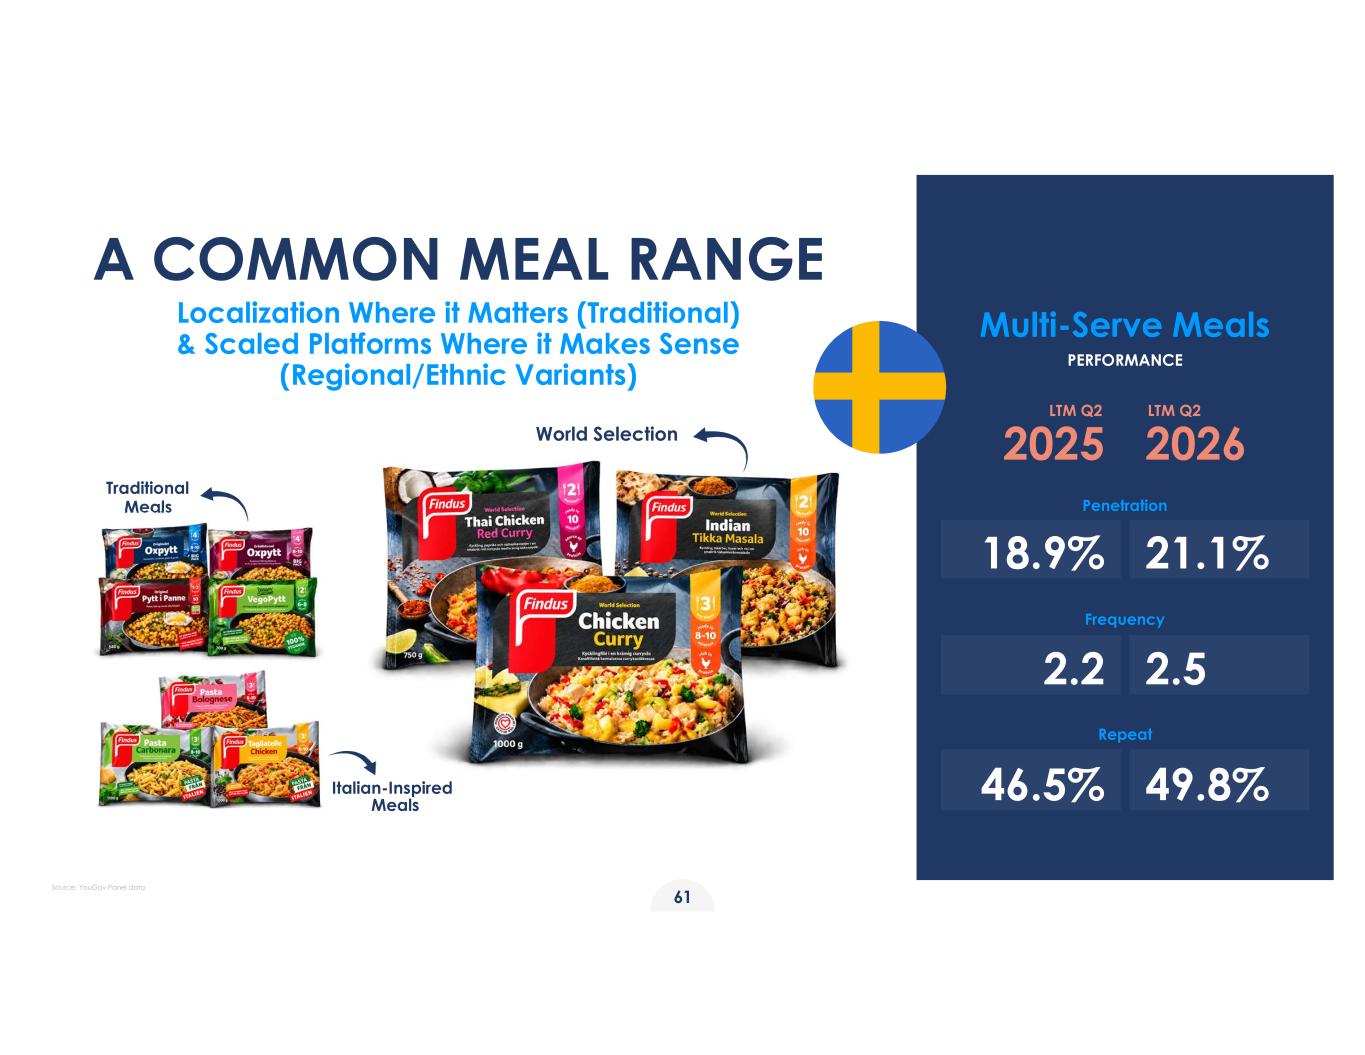
A COMMON MEAL RANGE Localization Where it Matters (Traditional) & Scaled Platforms Where it Makes Sense (Regional/Ethnic Variants) 18.9% 2.2 46.5% LTM Q2 LTM Q2 2025 2026 21.1% 2.5 49.8% Frequency Repeat Penetration World Selection Traditional Meals Italian-Inspired Meals Multi-Serve Meals PERFORMANCE 61 Source: YouGov Panel data
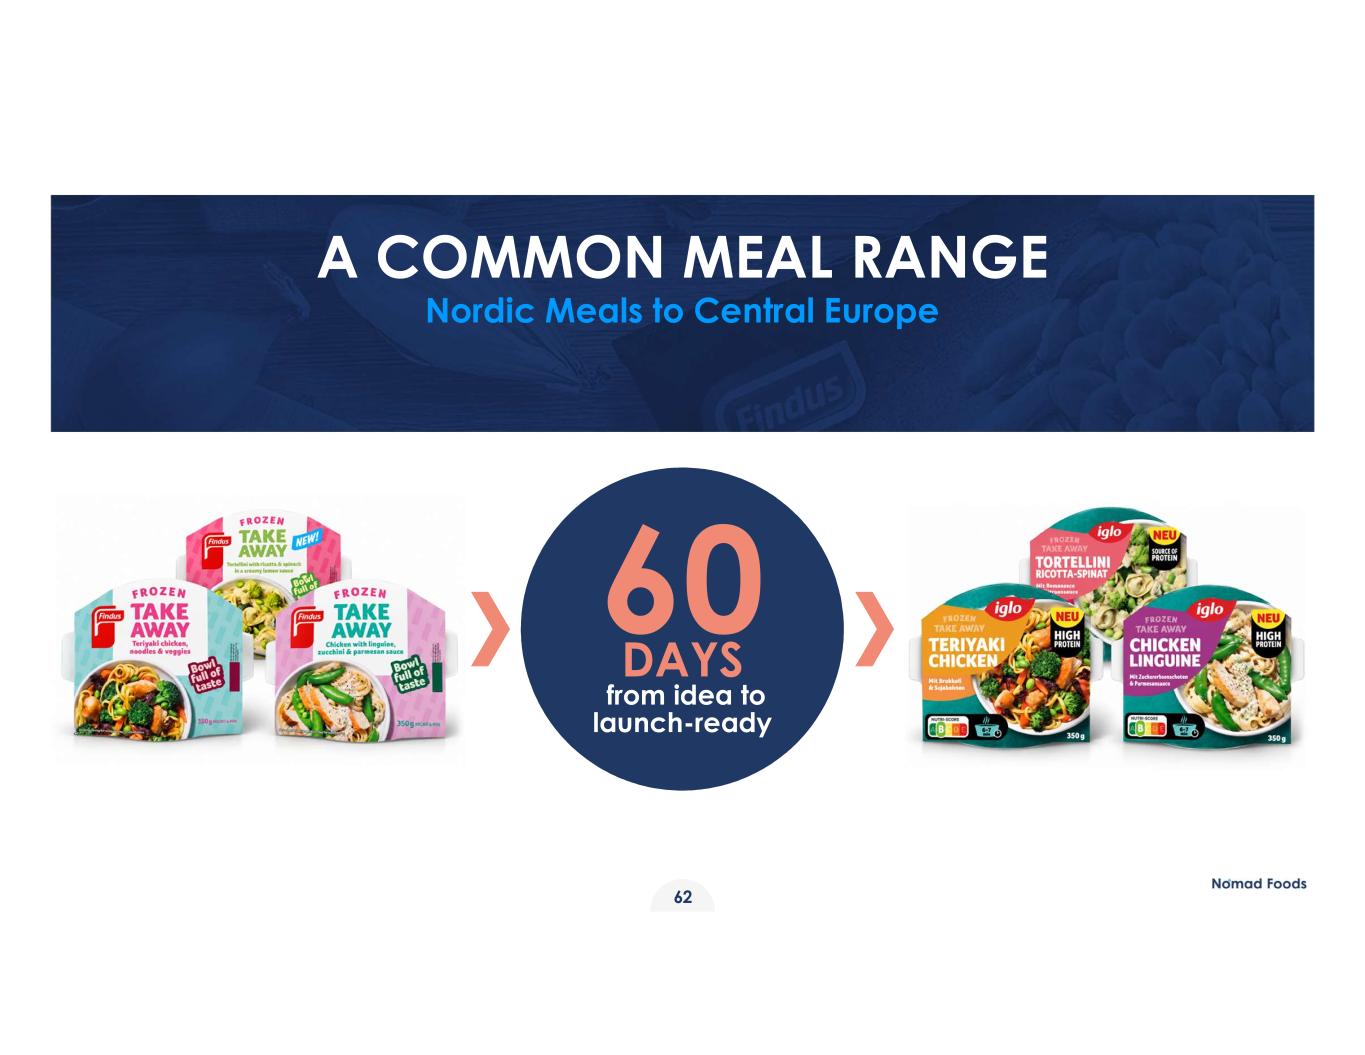
A COMMON MEAL RANGE Nordic Meals to Central Europe DAYS from idea to launch-ready 62
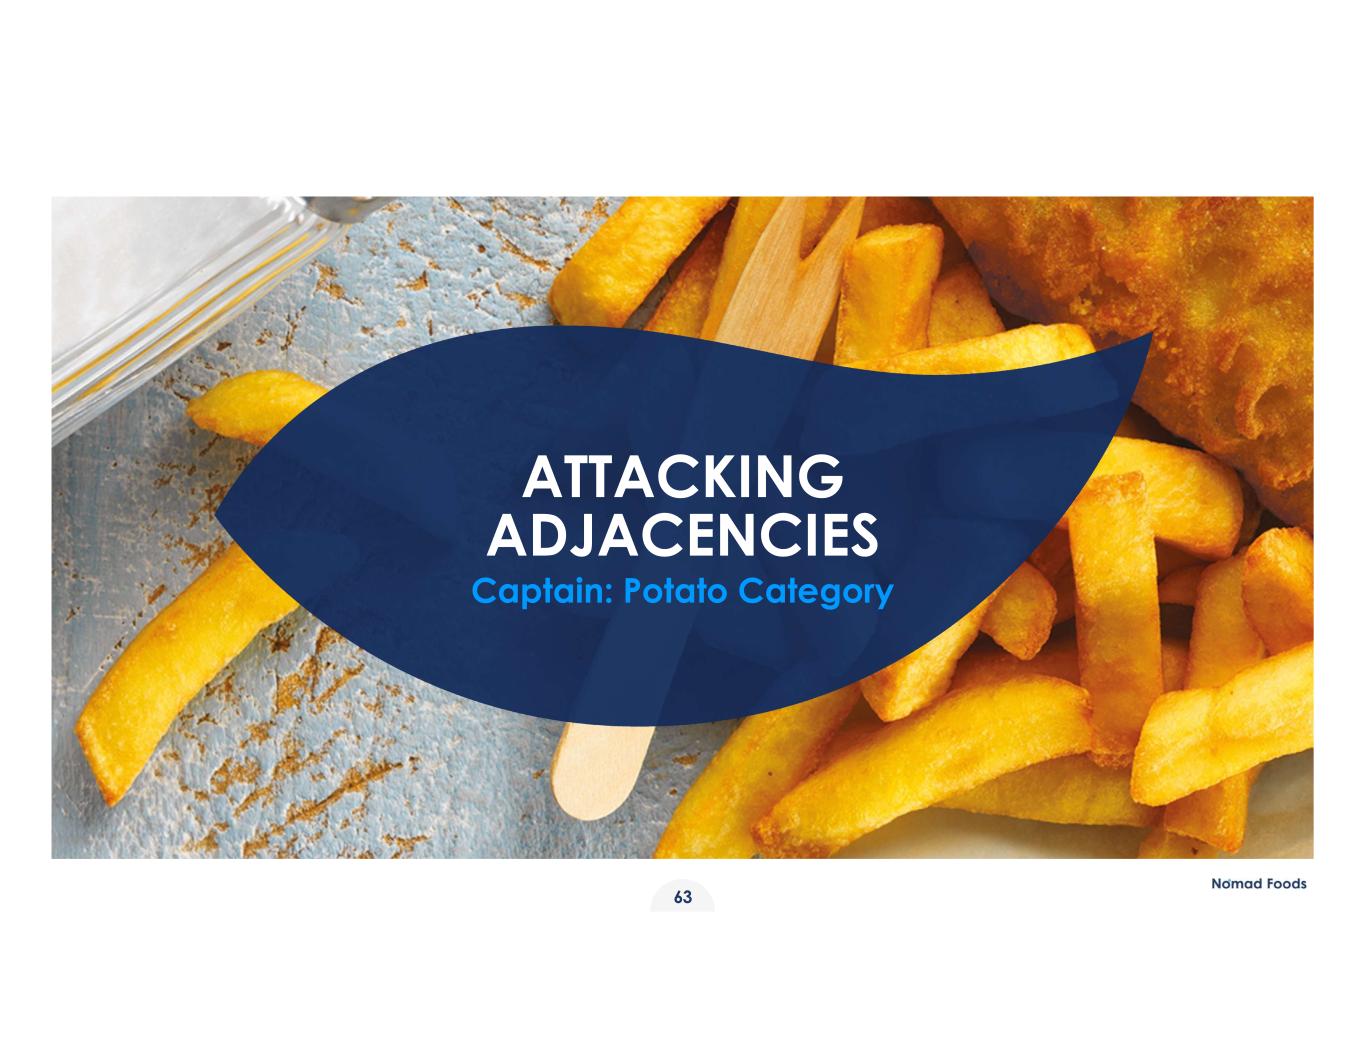
ATTACKING ADJACENCIES Captain: Potato Category 63
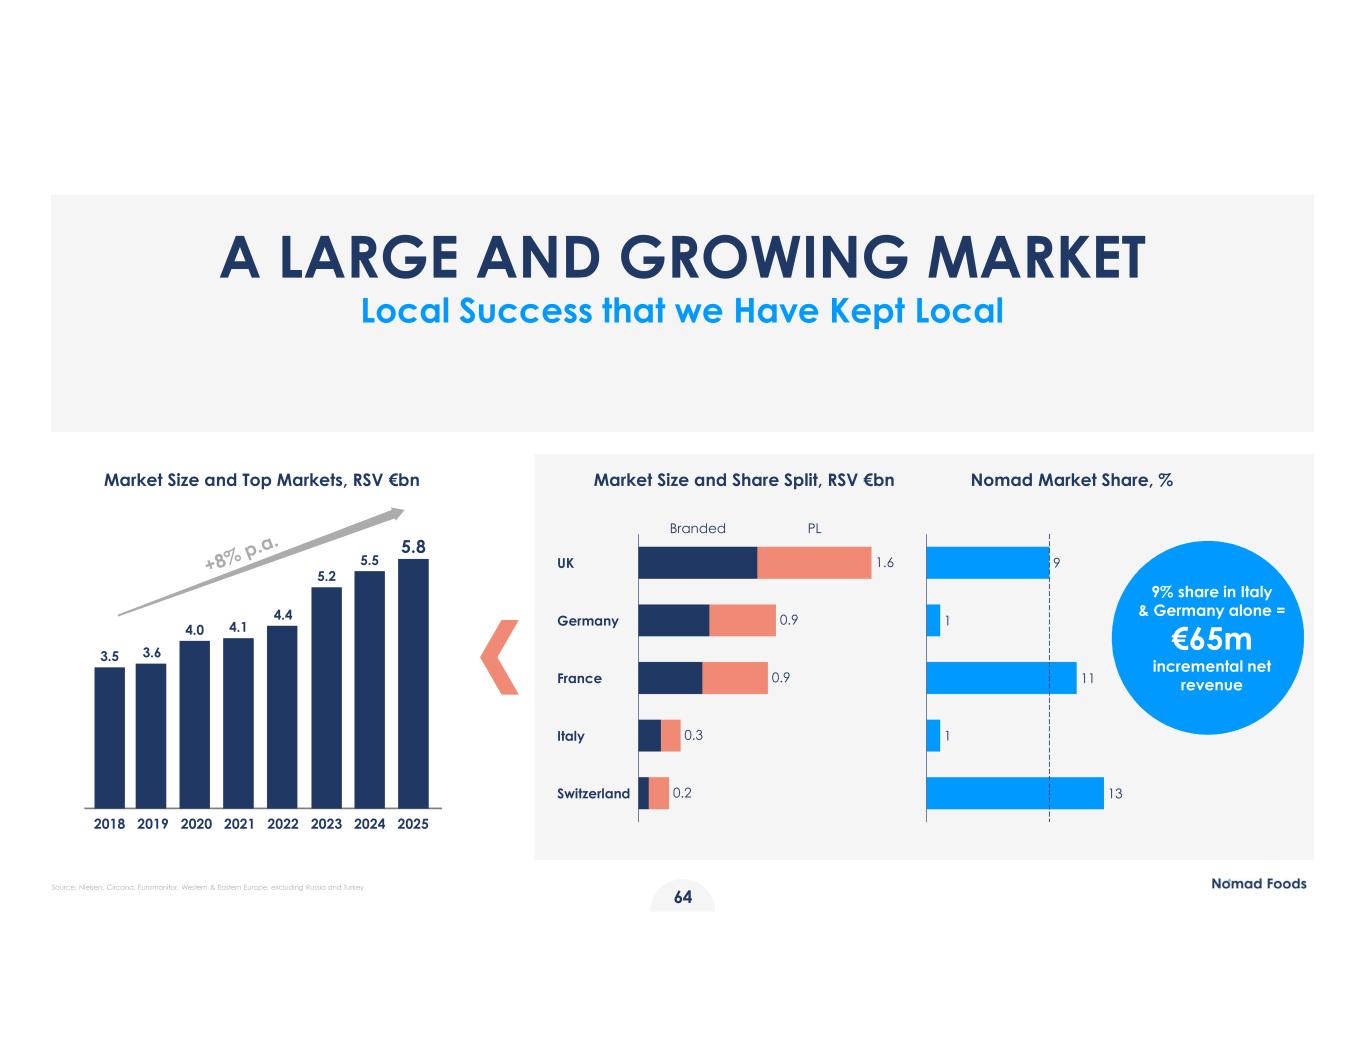
SMALLEST TITLE 64 Market Size and Top Markets, RSV €bn Market Size and Share Split, RSV €bn Nomad Market Share, % A LARGE AND GROWING MARKET Local Success that we Have Kept Local 2018 2019 2020 2021 2022 2023 2024 2025 3.5 3.6 4.0 4.1 4.4 5.2 5.5 5.8 UK Germany France Italy Switzerland PLBranded 1.6 0.9 0.9 0.3 0.2 9 1 11 1 13 9% share in Italy & Germany alone = €65m incremental net revenue Source: Nielsen, Circana, Euromonitor, Western & Eastern Europe, excluding Russia and Turkey
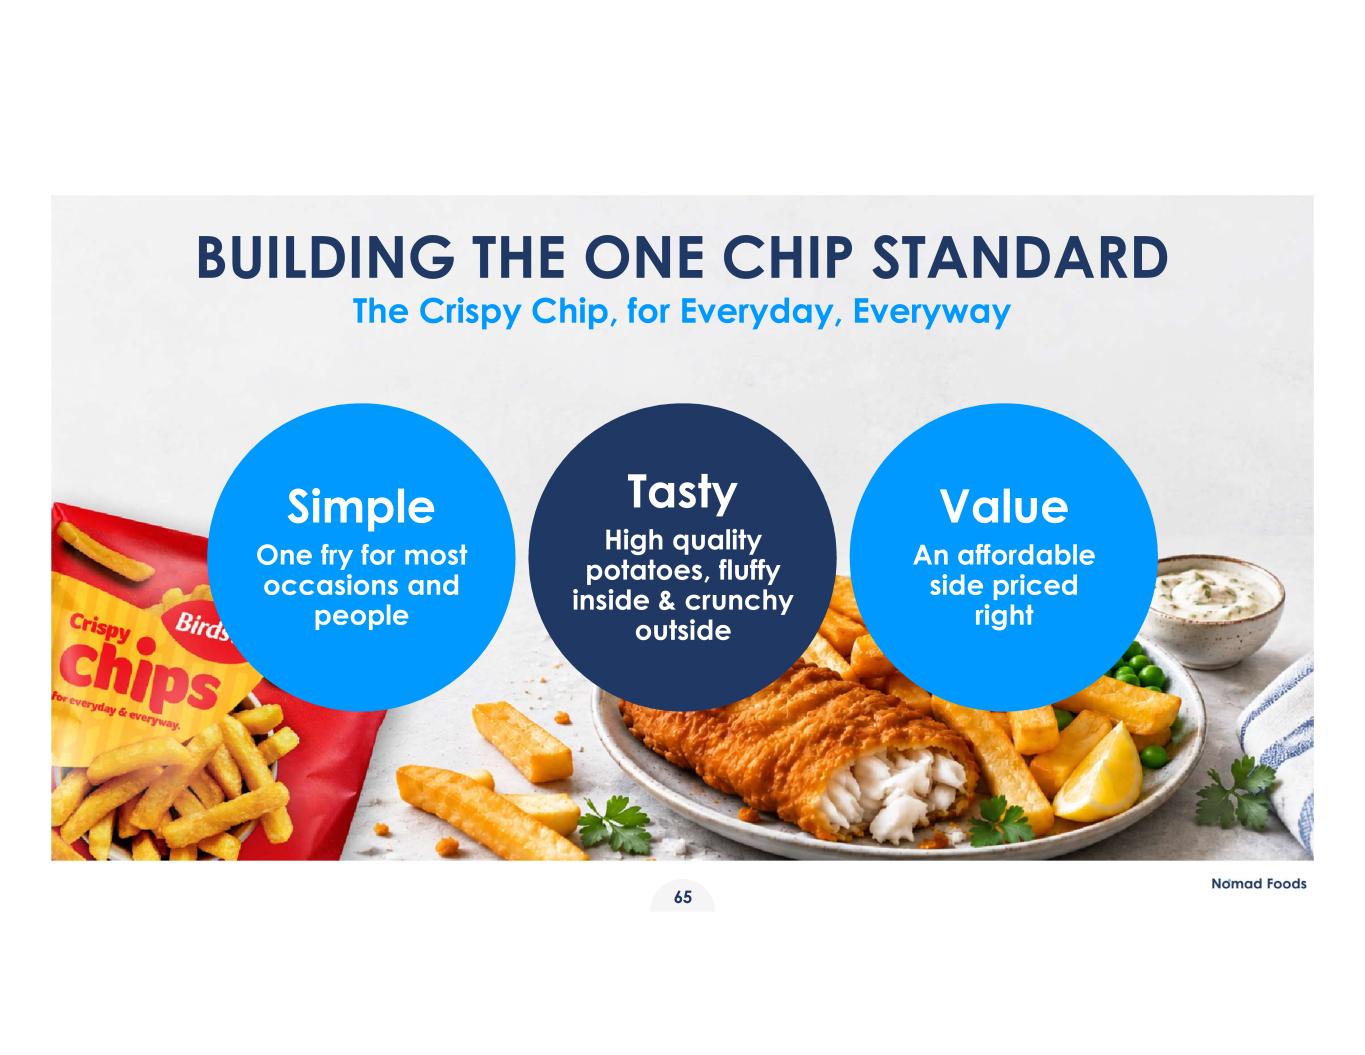
Tasty High quality potatoes, fluffy inside & crunchy outside Simple One fry for most occasions and people Value An affordable side priced right BUILDING THE ONE CHIP STANDARD The Crispy Chip, for Everyday, Everyway 65
CAPTURING NEW CATEGORIES Captain: Pizza Category 66
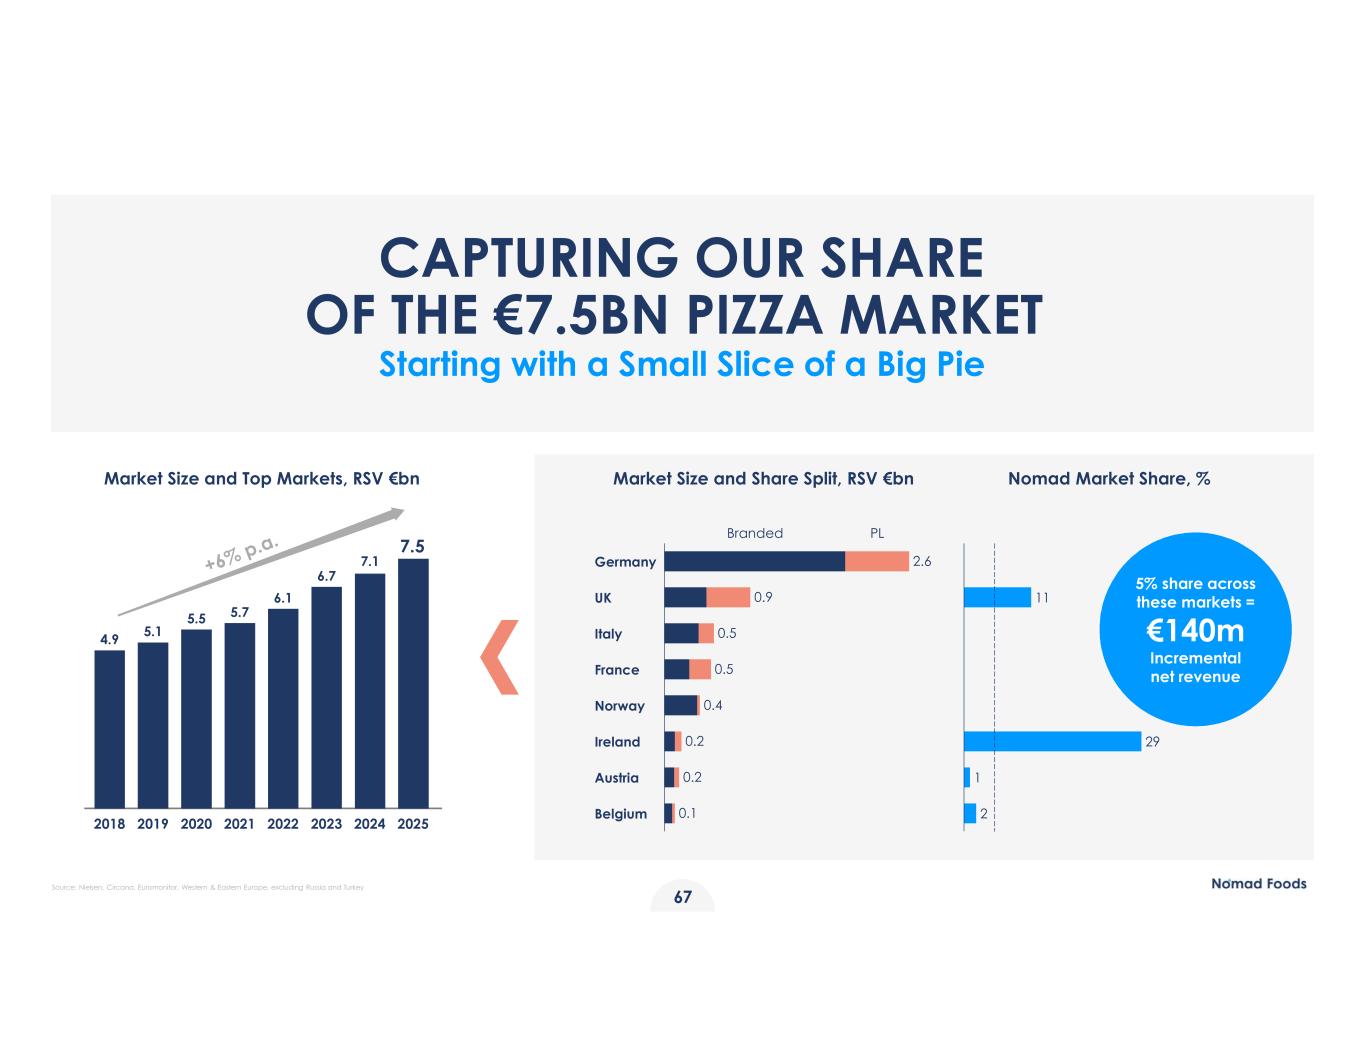
SMALLEST TITLE 67 Market Size and Top Markets, RSV €bn Market Size and Share Split, RSV €bn Nomad Market Share, % CAPTURING OUR SHARE OF THE €7.5BN PIZZA MARKET Starting with a Small Slice of a Big Pie 2018 2019 2020 2021 2022 2023 2024 2025 4.9 5.1 5.5 5.7 7.1 6.7 6.1 7.5 Germany UK Italy France Norway Ireland Austria Belgium PLBranded 2.6 0.9 0.5 0.5 0.4 0.2 0.2 0.1 11 29 1 2 5% share across these markets = €140m Incremental net revenue Source: Nielsen, Circana, Euromonitor, Western & Eastern Europe, excluding Russia and Turkey
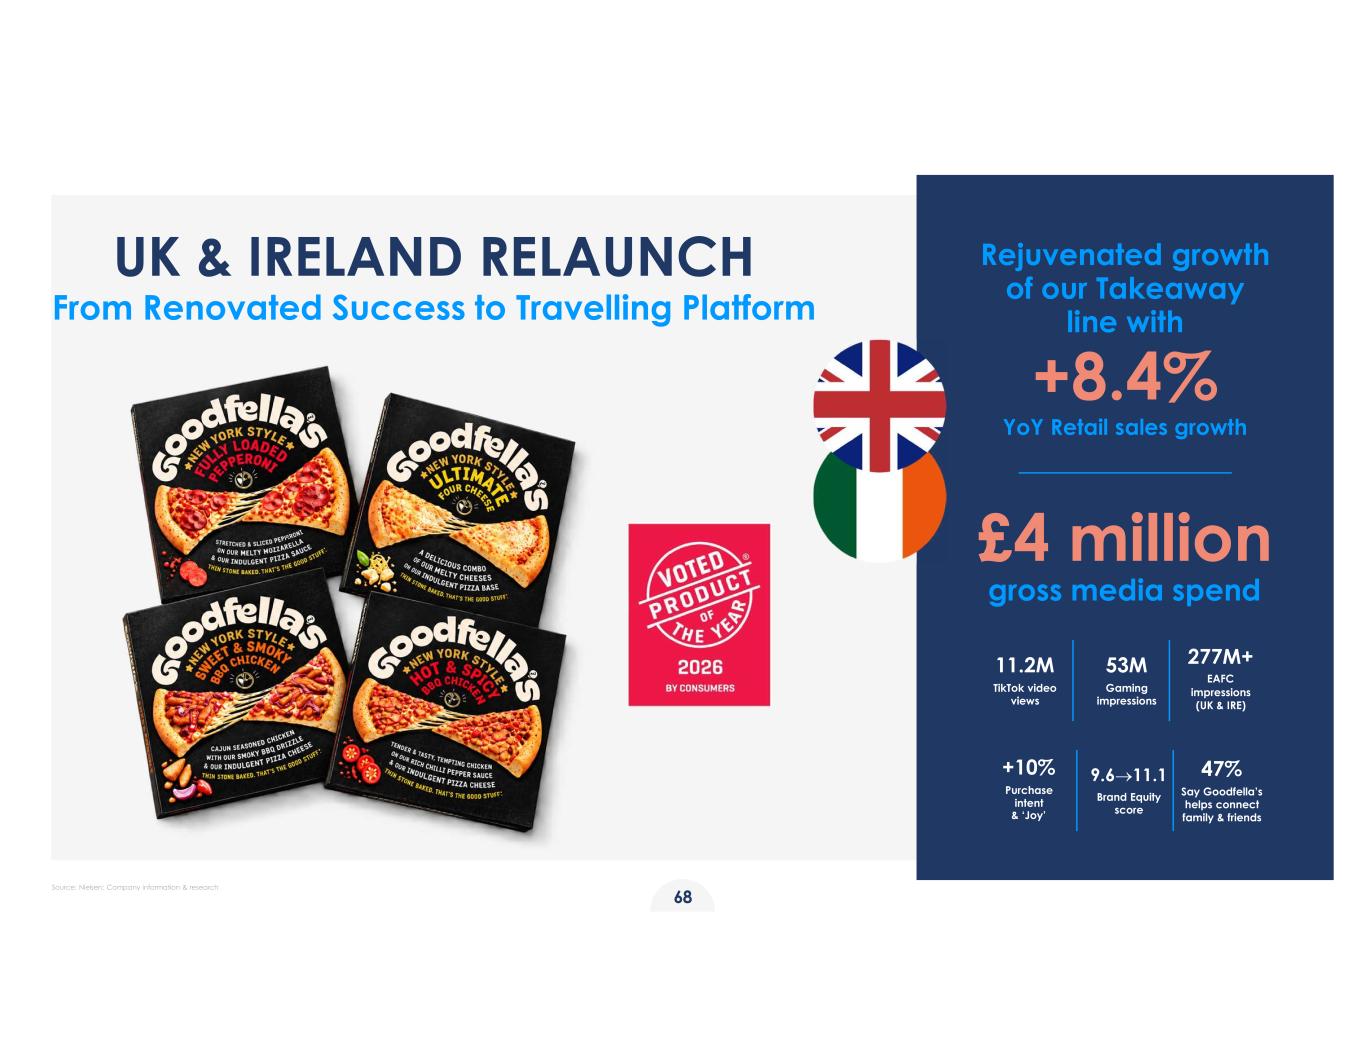
UK & IRELAND RELAUNCH From Renovated Success to Travelling Platform Rejuvenated growth of our Takeaway line with +8.4% YoY Retail sales growth £4 million gross media spend 11.2M TikTok video views 9.611.1 Brand Equity score +10% Purchase intent & ‘Joy’ 277M+ EAFC impressions (UK & IRE) 53M Gaming impressions 47% Say Goodfella’s helps connect family & friends 68 Source: Nielsen; Company information & research
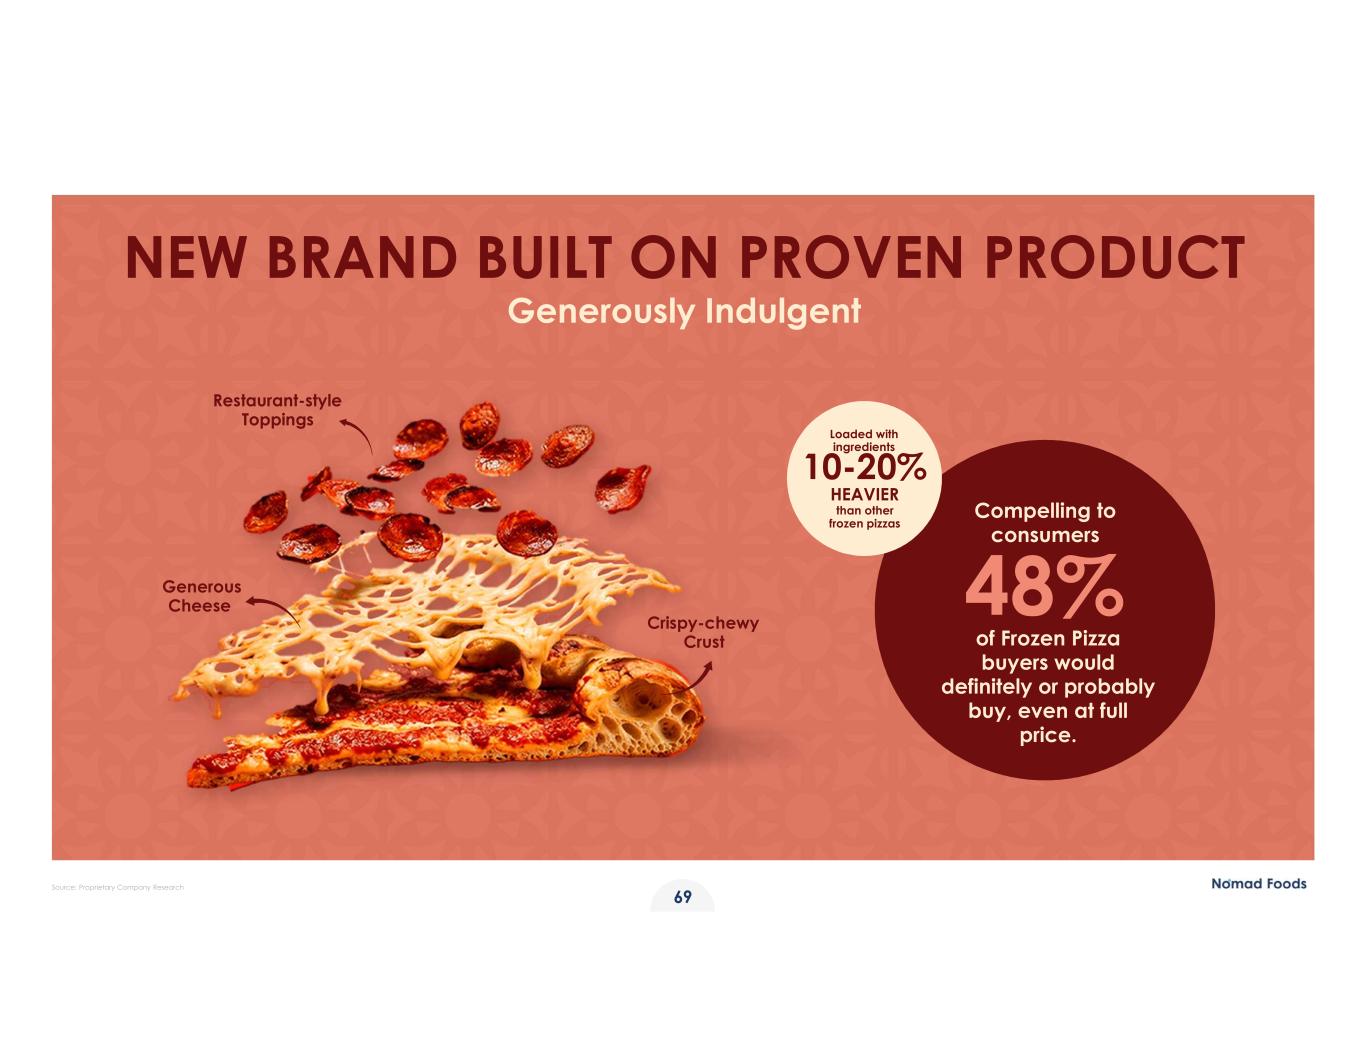
Generous Cheese Crispy-chewy Crust Restaurant-style Toppings NEW BRAND BUILT ON PROVEN PRODUCT Generously Indulgent Compelling to consumers 48% of Frozen Pizza buyers would definitely or probably buy, even at full price. Loaded with ingredients 10-20% HEAVIER than other frozen pizzas 69 Source: Proprietary Company Research
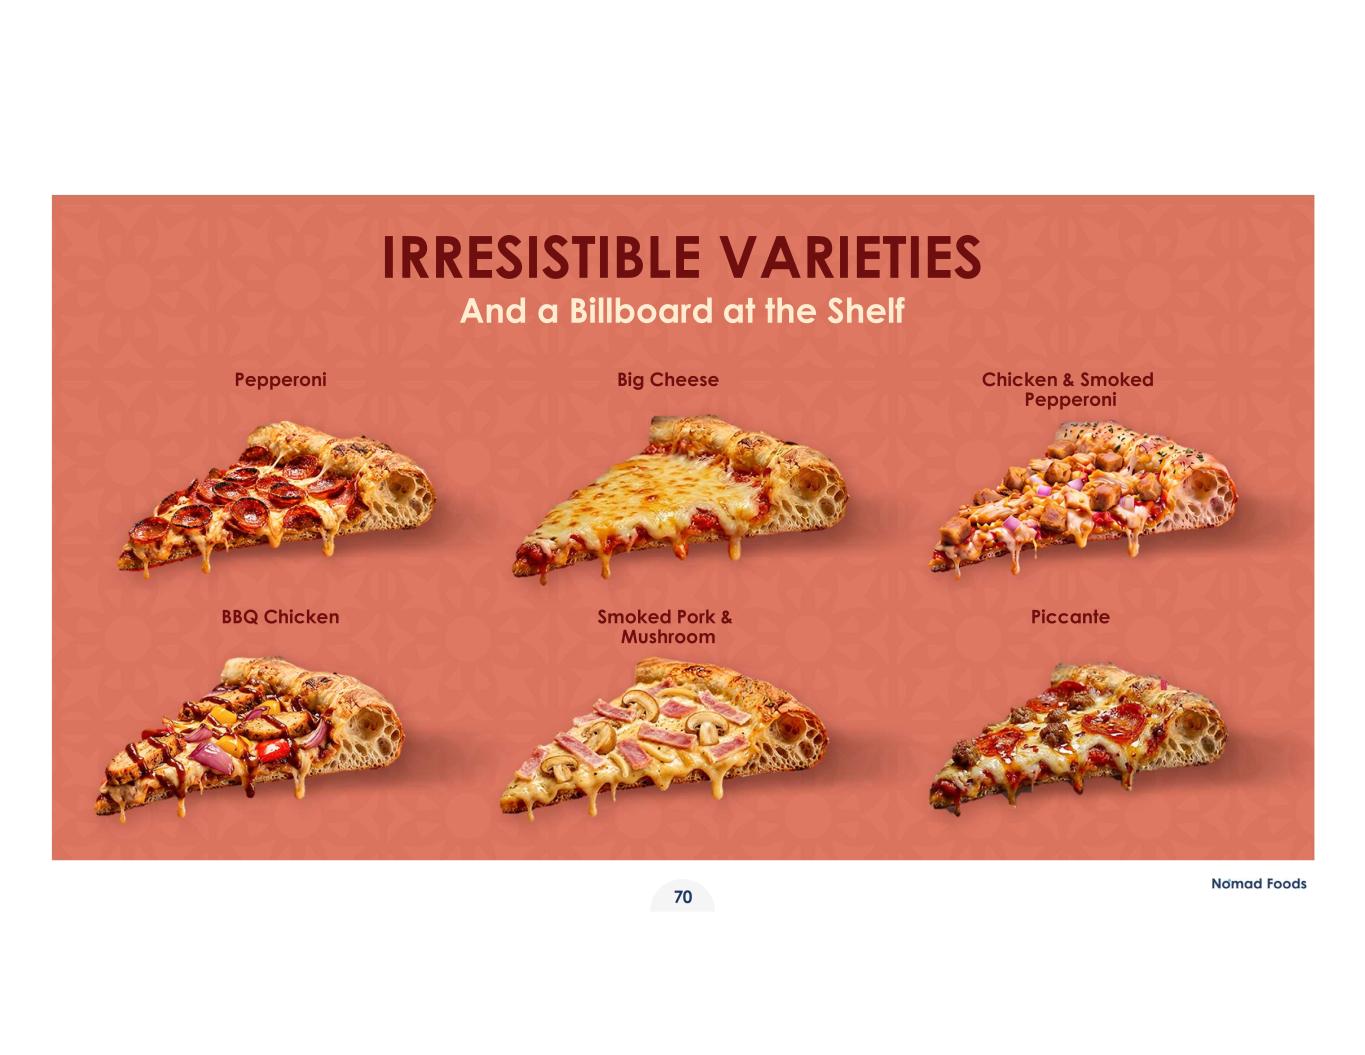
Pepperoni Big Cheese BBQ Chicken Smoked Pork & Mushroom Chicken & Smoked Pepperoni Piccante IRRESISTIBLE VARIETIES And a Billboard at the Shelf 70
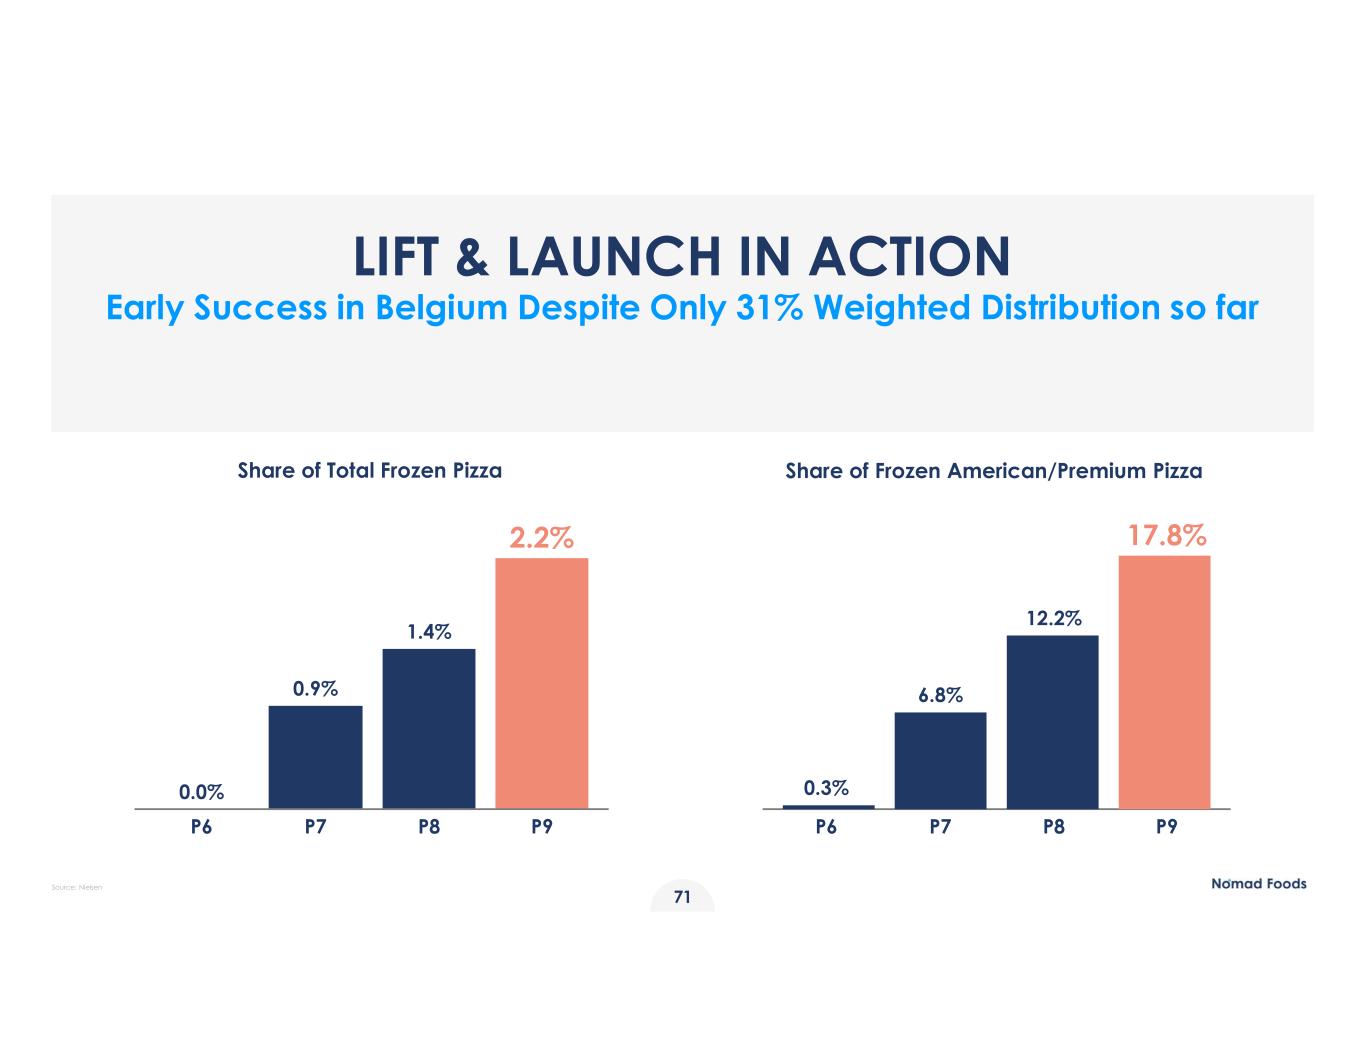
LIFT & LAUNCH IN ACTION Early Success in Belgium Despite Only 31% Weighted Distribution so far Share of Total Frozen Pizza Share of Frozen American/Premium Pizza 0.9% 0.0% 1.4% 2.2% P6 P7 P8 P9 0.3% 6.8% 12.2% 17.8% P6 P7 P8 P9 71 Source: Nielsen

CAPTURING NEW CATEGORIES Captain: Ice Cream Category 72
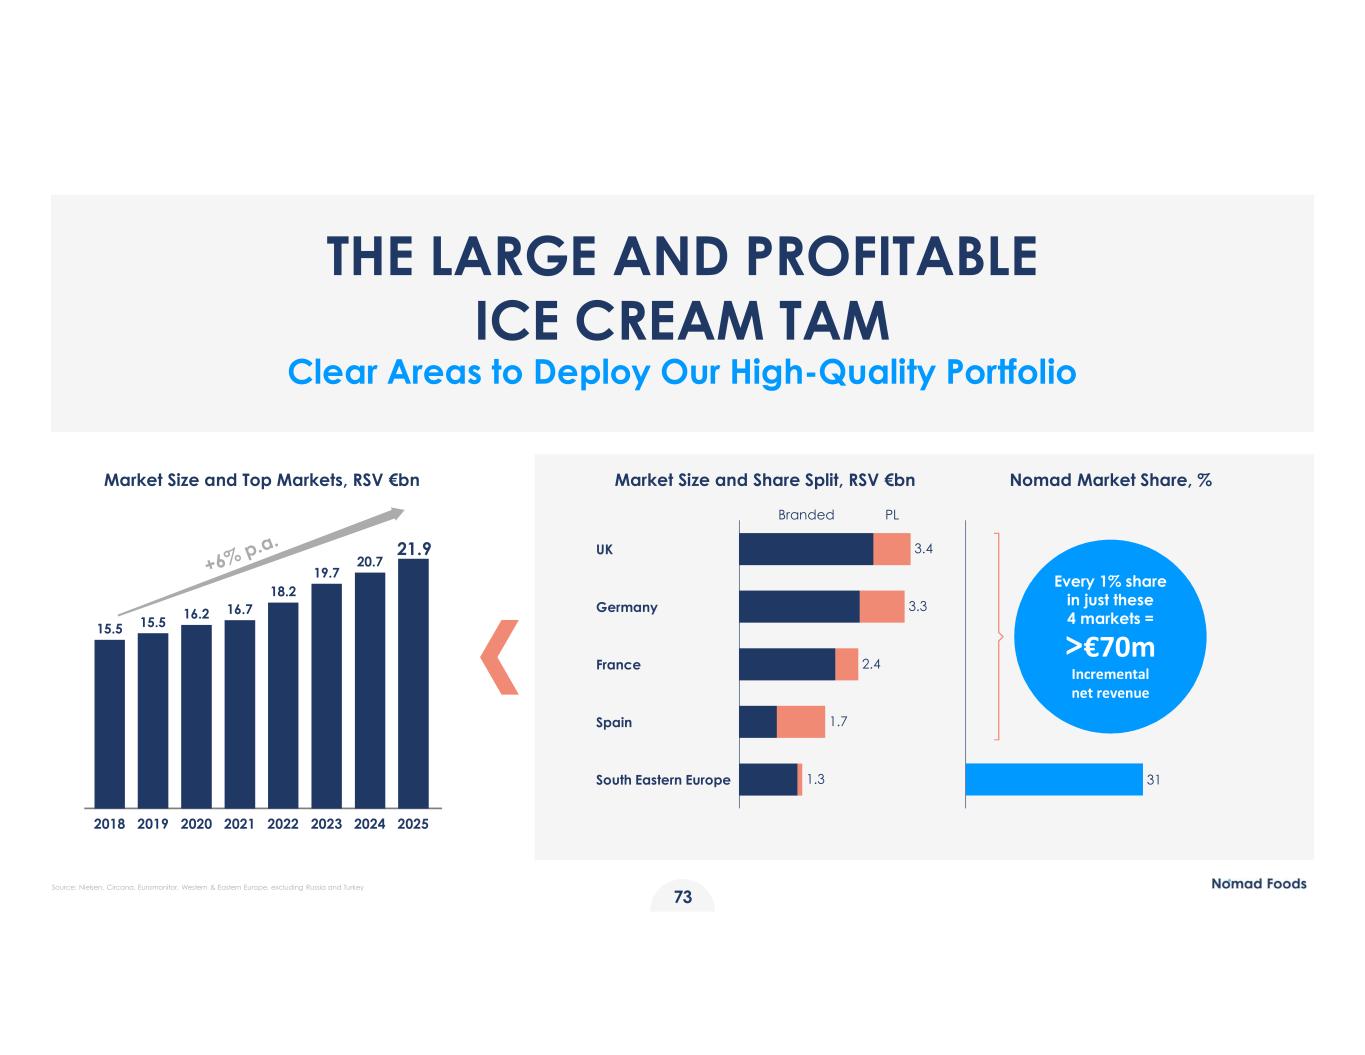
SMALLEST TITLE 73 Market Size and Top Markets, RSV €bn Market Size and Share Split, RSV €bn Nomad Market Share, % 31 THE LARGE AND PROFITABLE ICE CREAM TAM Clear Areas to Deploy Our High-Quality Portfolio Every 1% share in just these 4 markets = >€70m Incremental net revenue 2018 2019 2020 2021 2022 2023 2024 2025 15.5 15.5 16.2 16.7 18.2 19.7 20.7 21.9 UK Germany France Spain South Eastern Europe PLBranded 3.4 3.3 2.4 1.7 1.3 Source: Nielsen, Circana, Euromonitor, Western & Eastern Europe, excluding Russia and Turkey
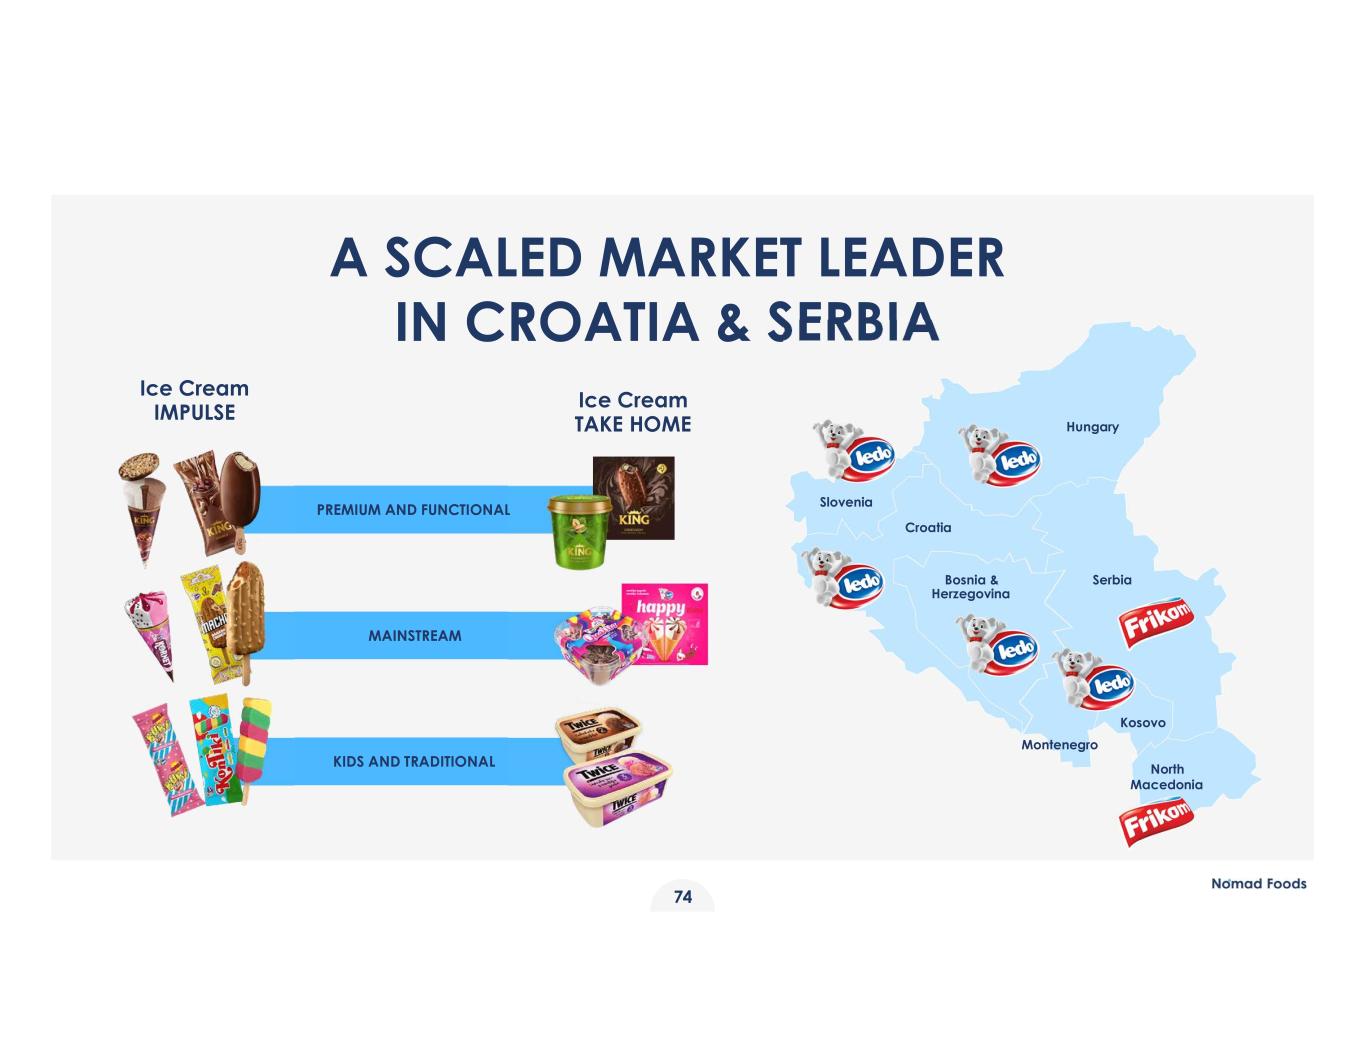
A SCALED MARKET LEADER IN CROATIA & SERBIA Ice Cream IMPULSE Ice Cream TAKE HOME PREMIUM AND FUNCTIONAL MAINSTREAM KIDS AND TRADITIONAL Kosovo Bosnia & Herzegovina Serbia Hungary Croatia Montenegro Slovenia North Macedonia 74
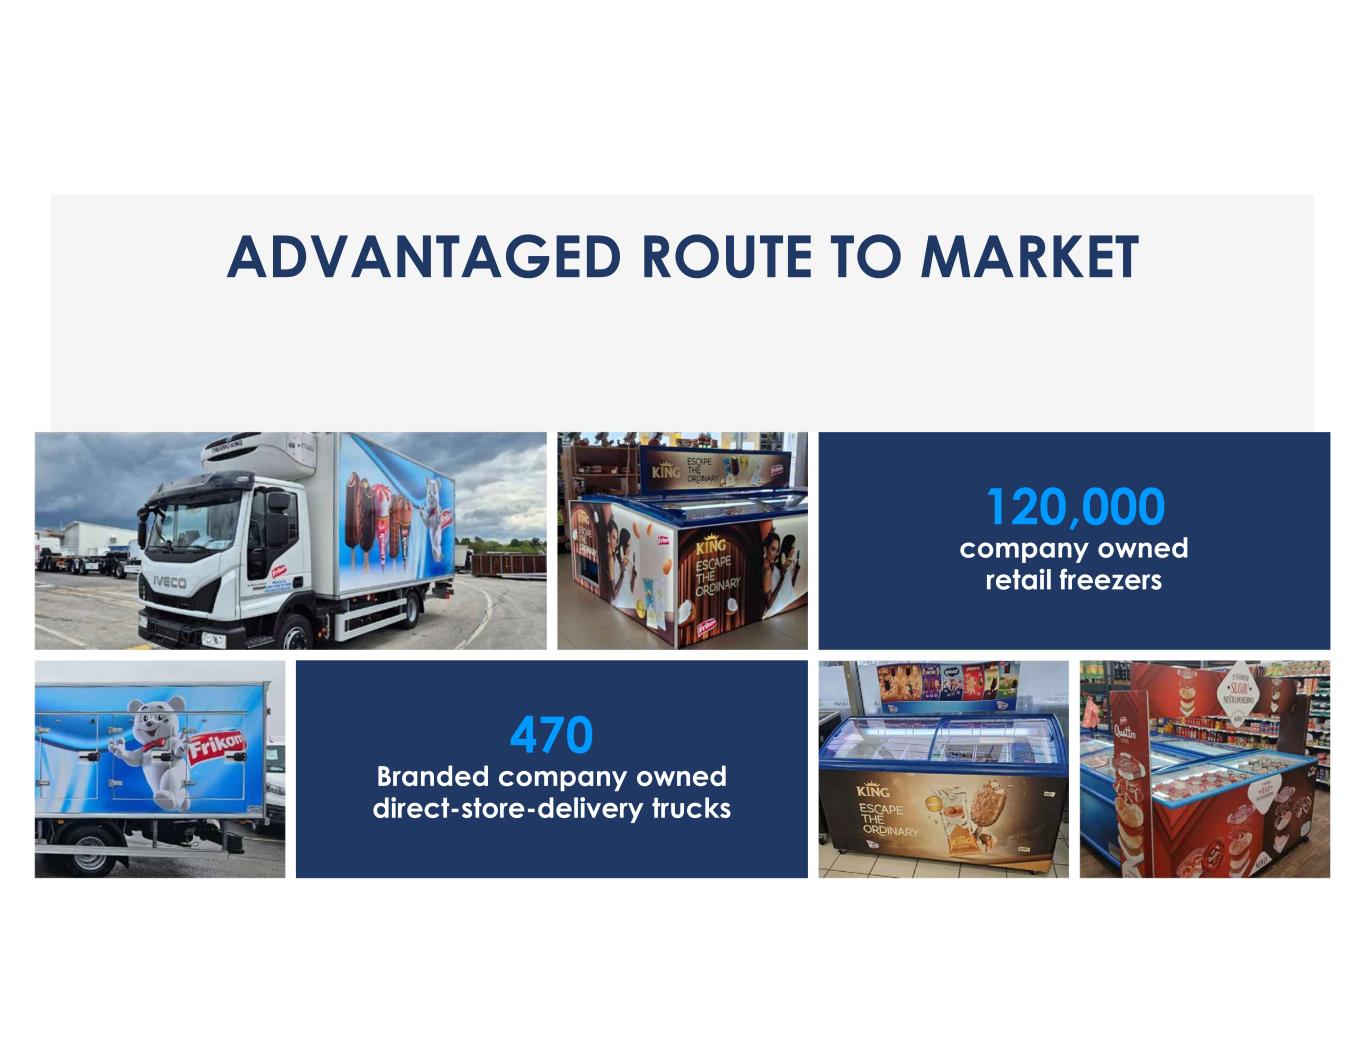
ADVANTAGED ROUTE TO MARKET 120,000 company owned retail freezers 470 Branded company owned direct-store-delivery trucks
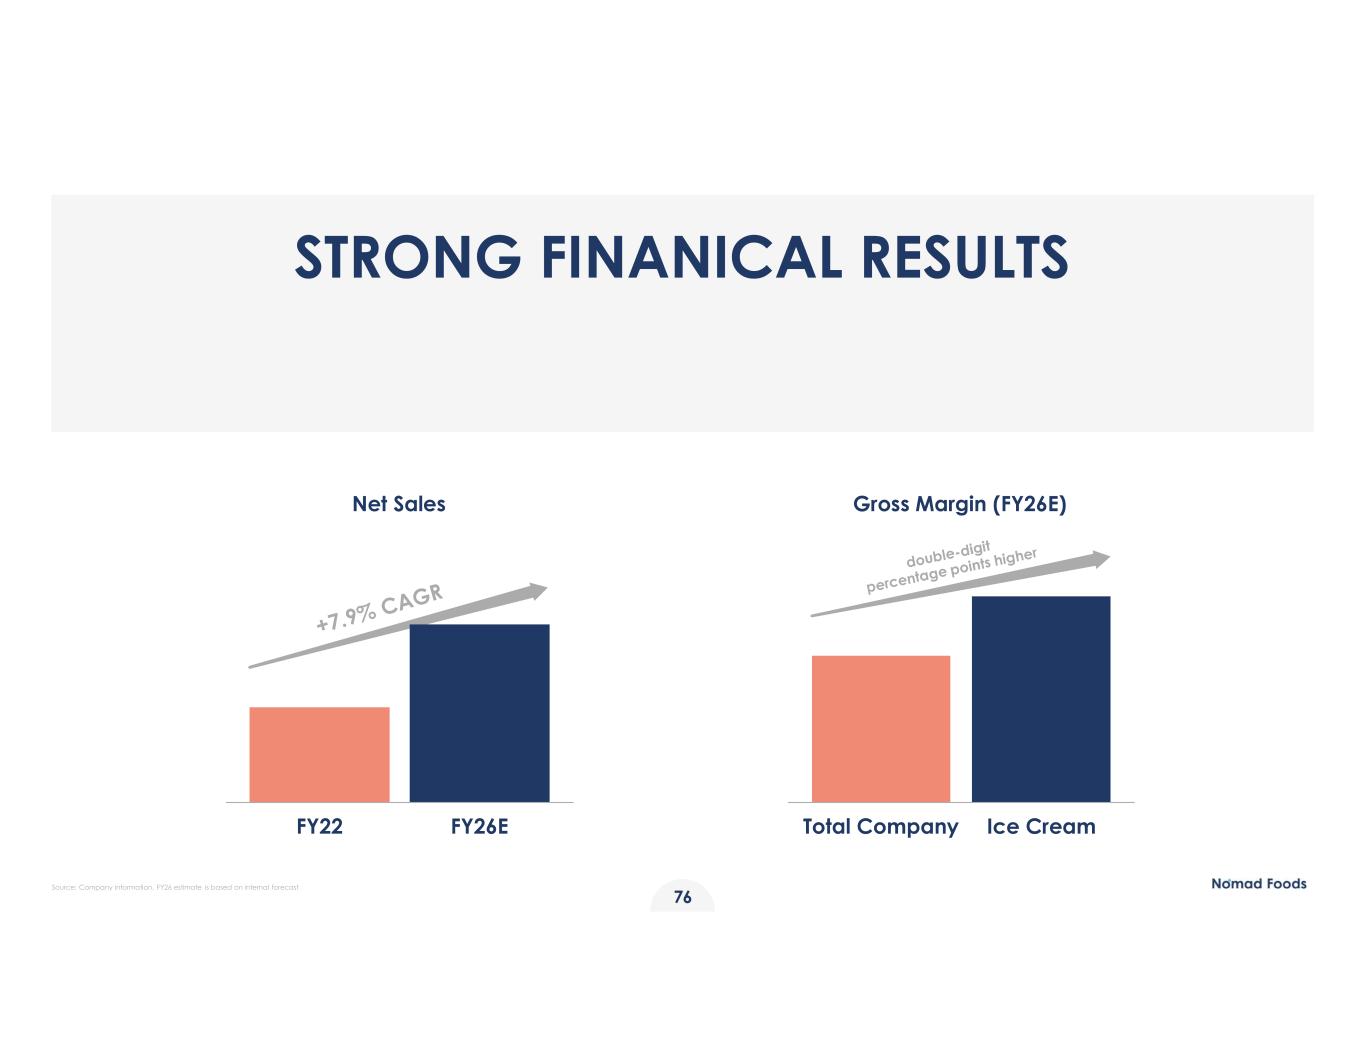
STRONG FINANICAL RESULTS Gross Margin (FY26E) Total Company Ice Cream Net Sales FY22 FY26E 76 Source: Company information, FY26 estimate is based on internal forecast
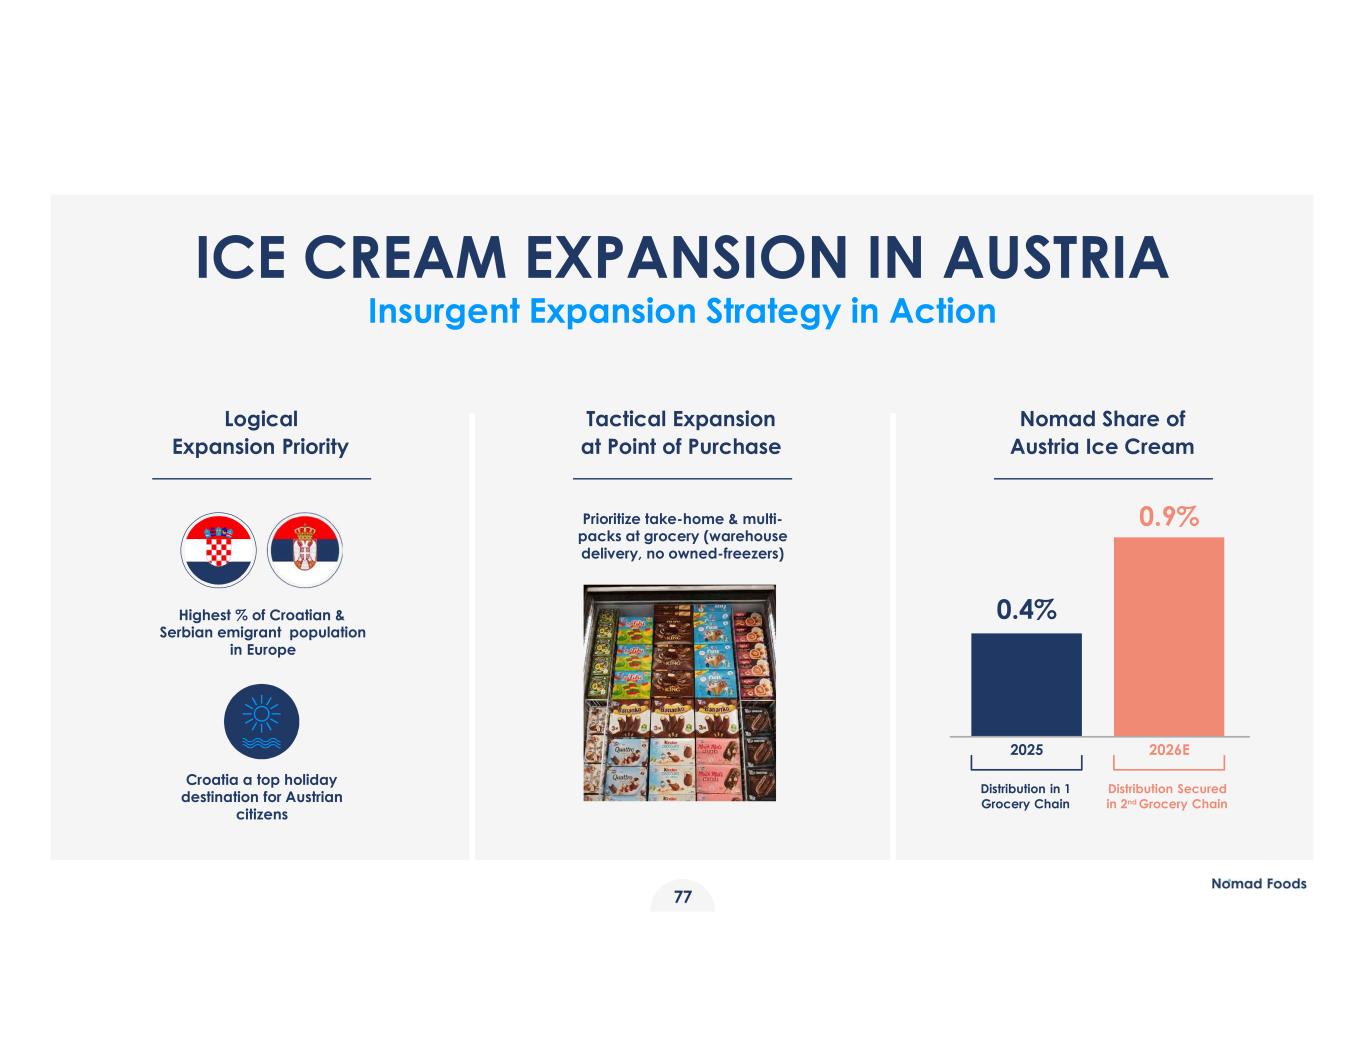
ICE CREAM EXPANSION IN AUSTRIA Insurgent Expansion Strategy in Action Prioritize take-home & multi- packs at grocery (warehouse delivery, no owned-freezers) Tactical Expansion at Point of Purchase Nomad Share of Austria Ice Cream 2025 2026E 0.4% 0.9% Distribution in 1 Grocery Chain Distribution Secured in 2nd Grocery Chain Logical Expansion Priority Croatia a top holiday destination for Austrian citizens Highest % of Croatian & Serbian emigrant population in Europe 77
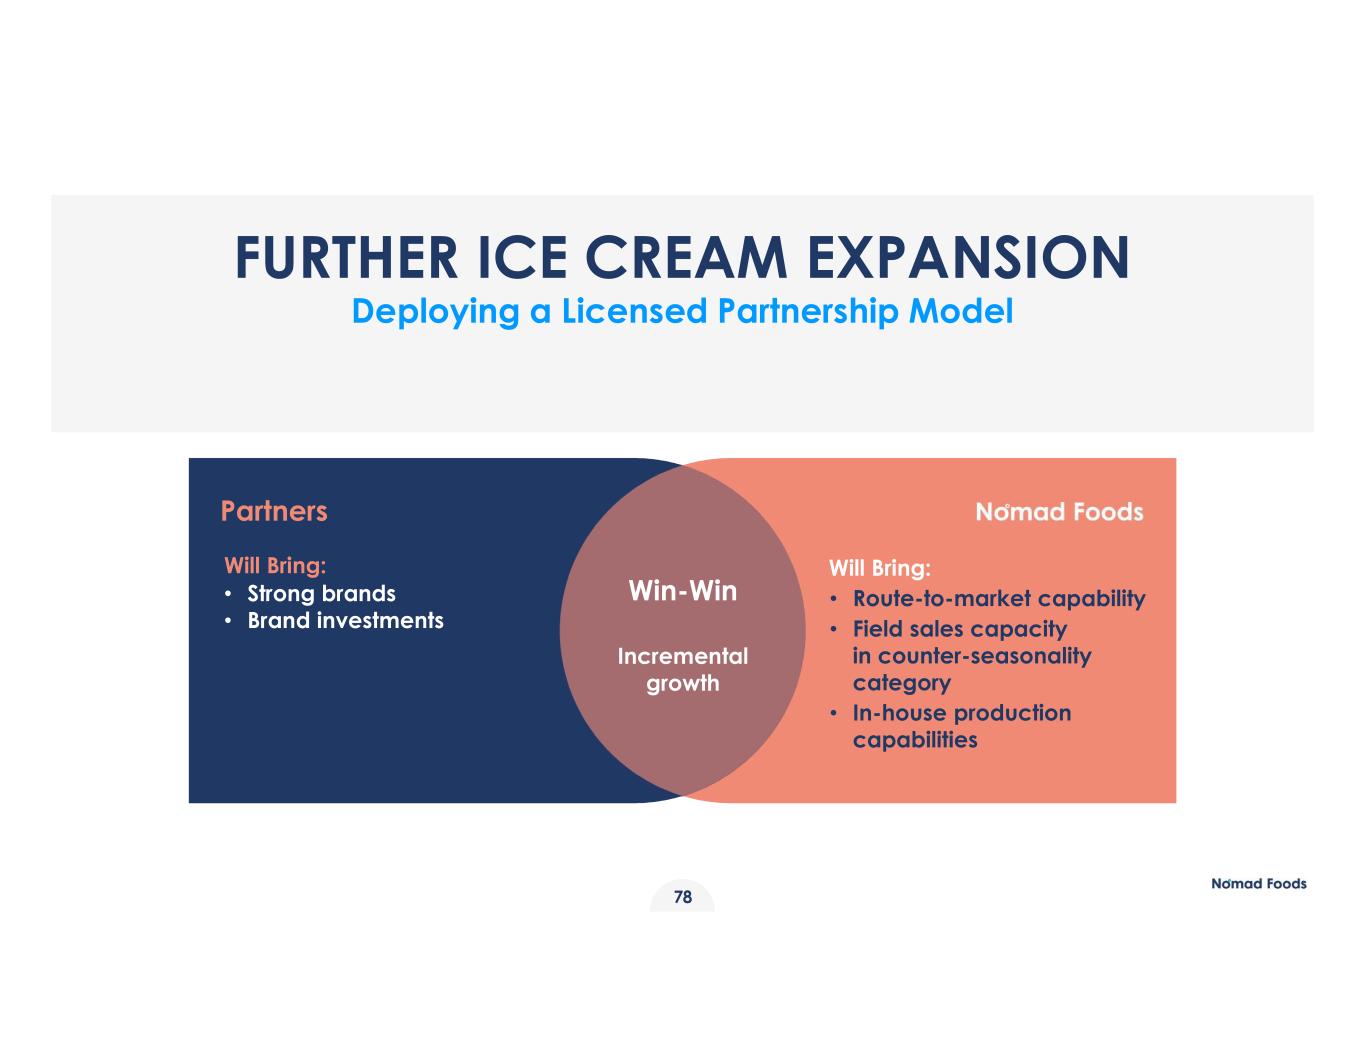
78 FURTHER ICE CREAM EXPANSION Deploying a Licensed Partnership Model Win-Win Incremental growth Will Bring: • Strong brands • Brand investments Will Bring: • Route-to-market capability • Field sales capacity in counter-seasonality category • In-house production capabilities Partners

WINNING AT RETAIL Captain from Customer Headquarters to Store 79
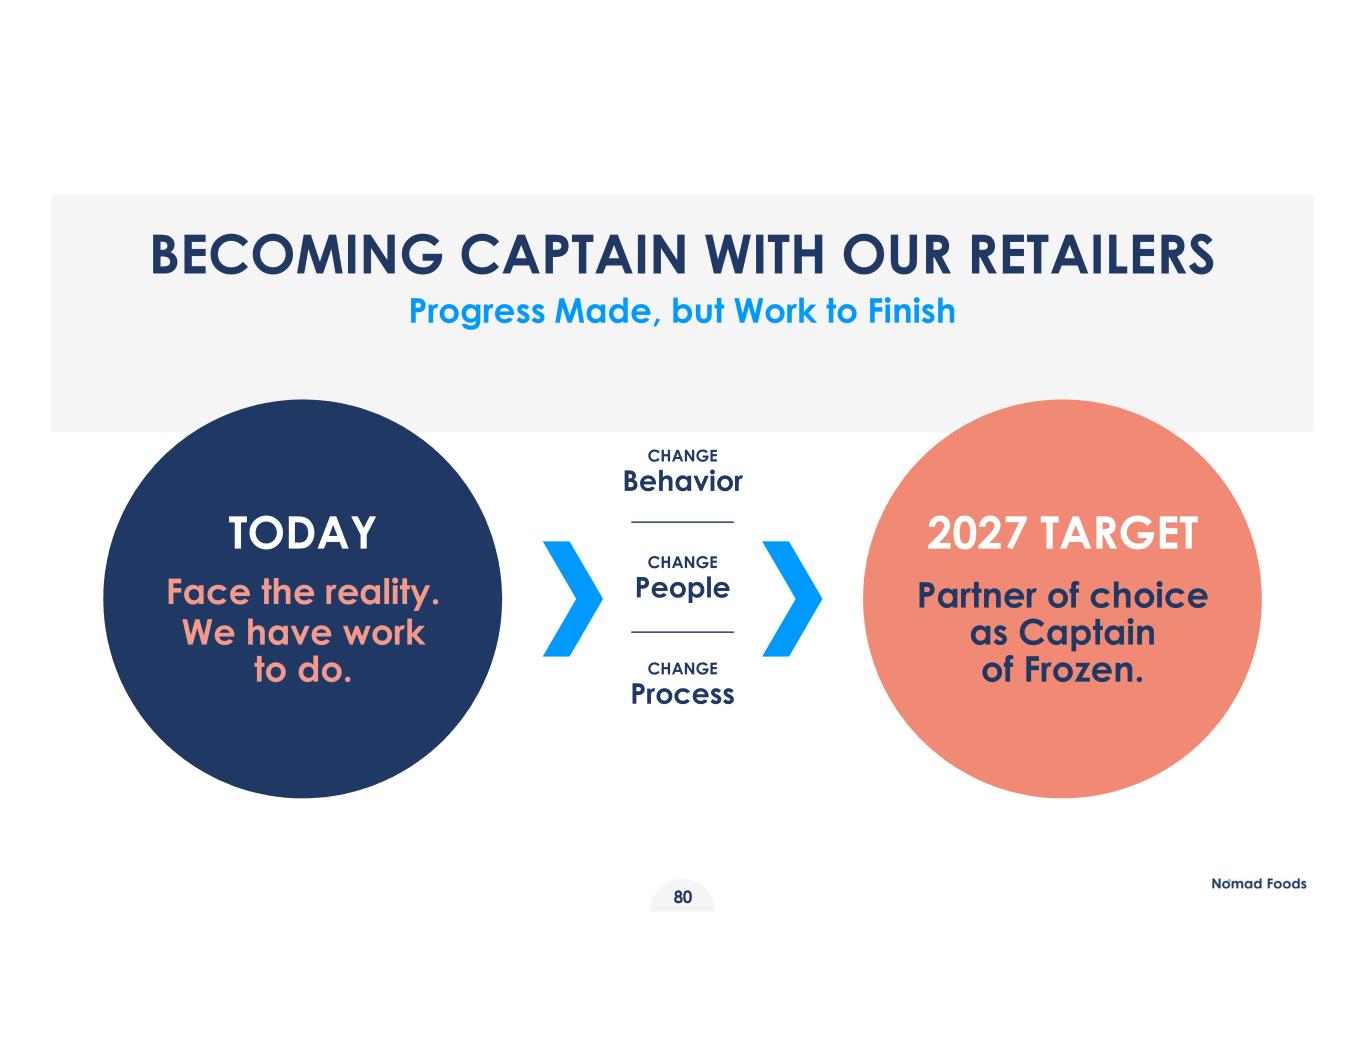
BECOMING CAPTAIN WITH OUR RETAILERS Progress Made, but Work to Finish TODAY Face the reality. We have work to do. 2027 TARGET Partner of choice as Captain of Frozen. CHANGE Behavior CHANGE People CHANGE Process 80
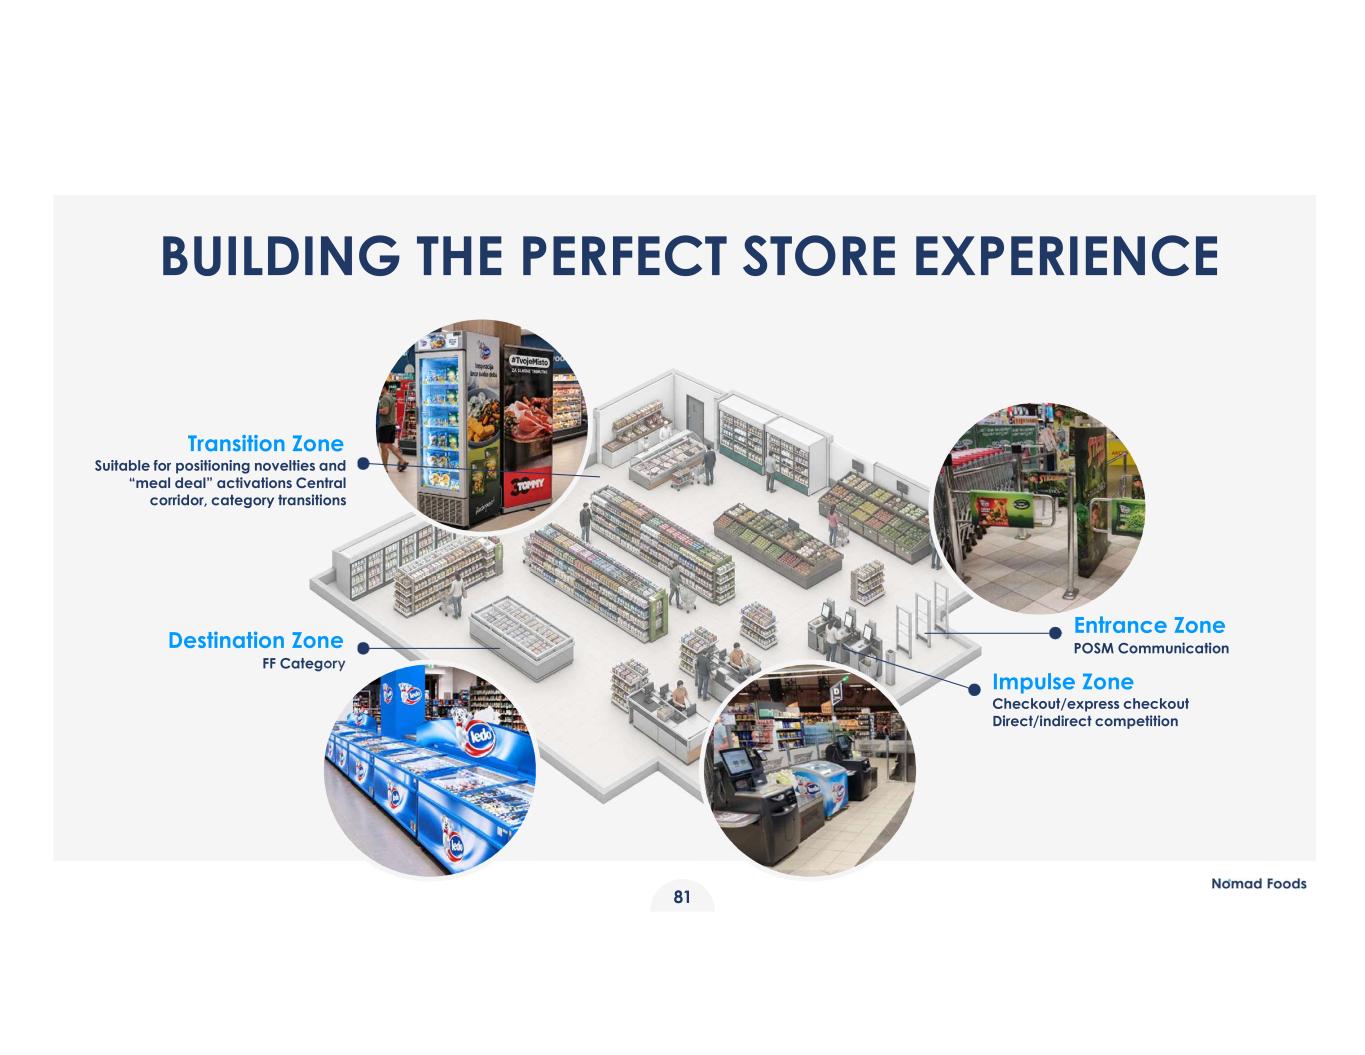
Entrance Zone POSM Communication Impulse Zone Checkout/express checkout Direct/indirect competition Destination Zone FF Category Transition Zone Suitable for positioning novelties and “meal deal” activations Central corridor, category transitions BUILDING THE PERFECT STORE EXPERIENCE 81
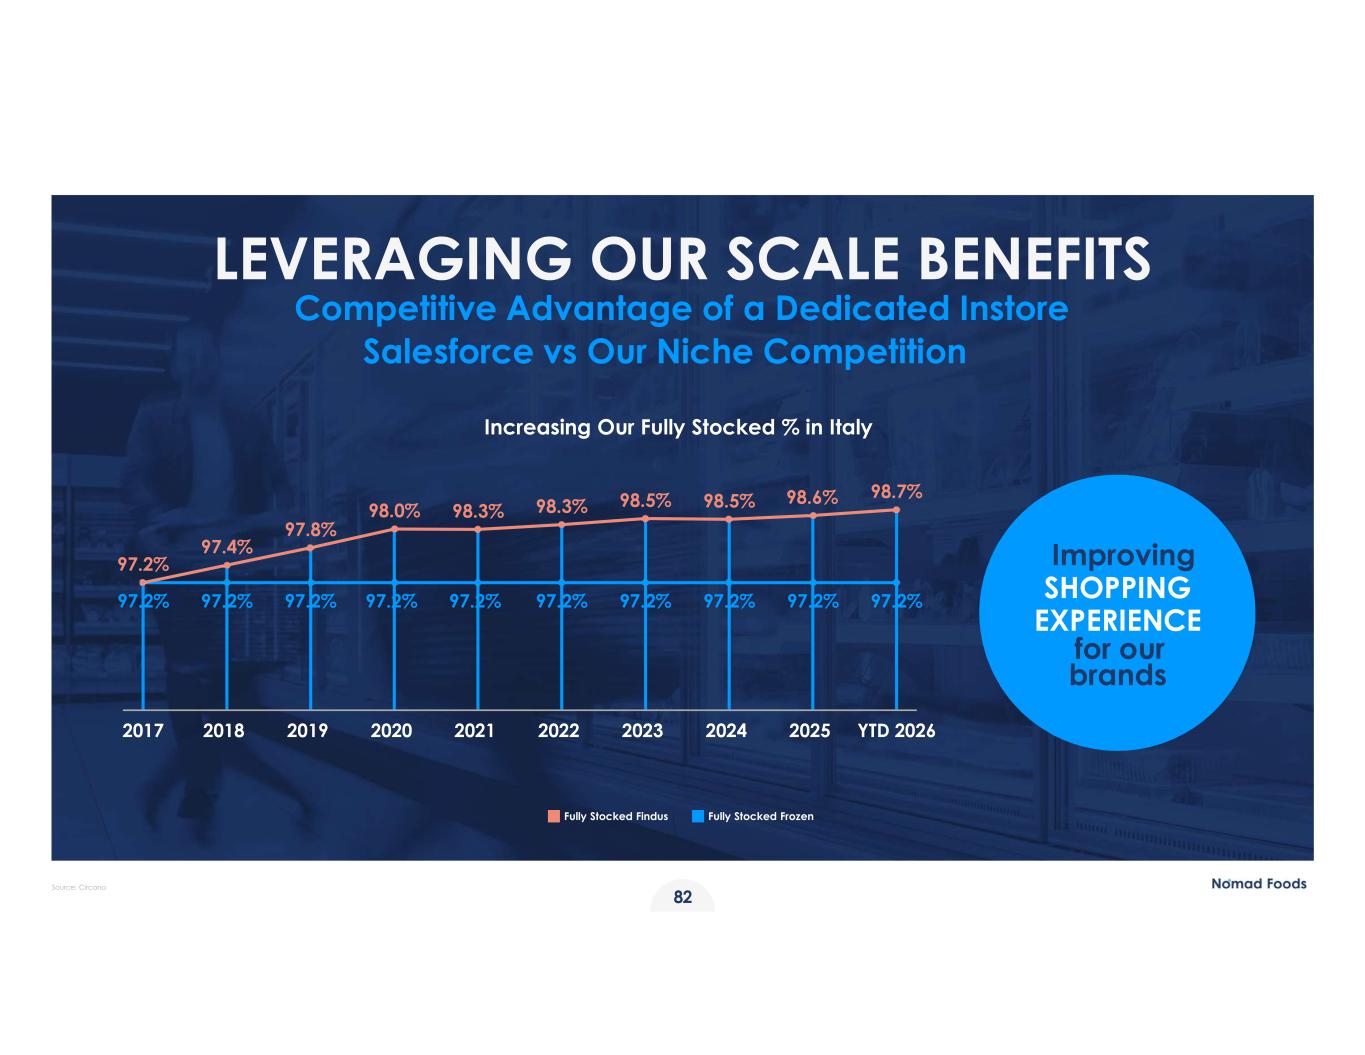
LEVERAGING OUR SCALE BENEFITS Competitive Advantage of a Dedicated Instore Salesforce vs Our Niche Competition Improving SHOPPING EXPERIENCE for our brands Increasing Our Fully Stocked % in Italy 97.2%97.2% 97.2% 97.2% 97.2% 97.2% 97.2% 97.2% 97.2% 97.2% 2017 2018 2019 2020 2021 2022 2023 2024 2025 YTD 2026 98.0% 98.3% 98.3% 98.5% 98.5% 98.6% 98.7% 97.4% 97.2% 97.8% Fully Stocked Findus Fully Stocked Frozen 82 Source: Circana
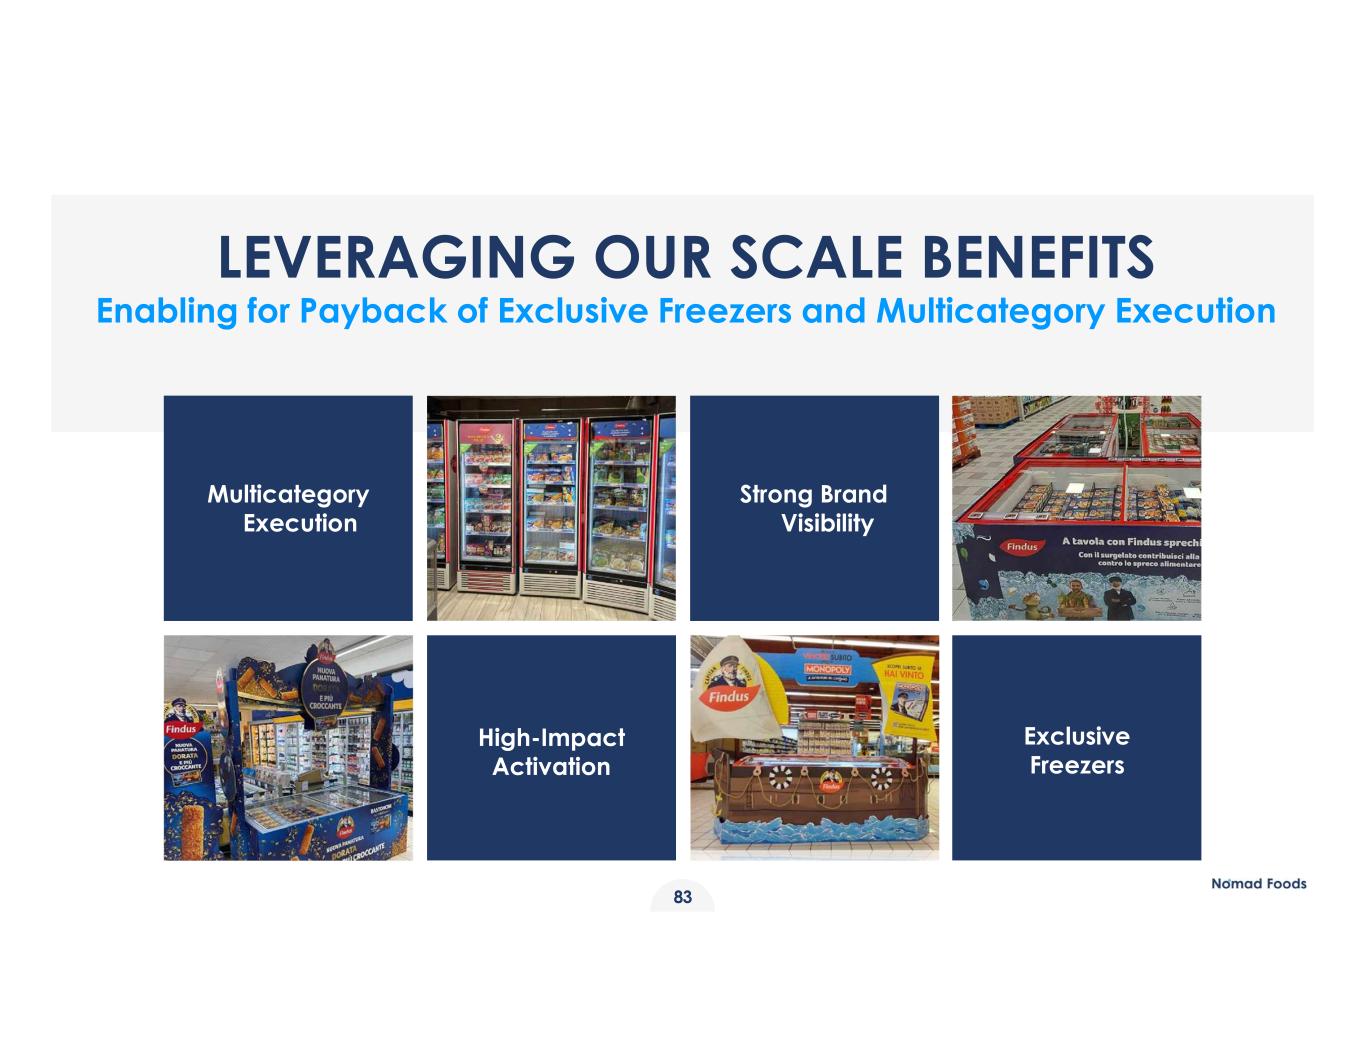
LEVERAGING OUR SCALE BENEFITS Enabling for Payback of Exclusive Freezers and Multicategory Execution Exclusive Freezers Multicategory Execution High-Impact Activation Strong Brand Visibility 83
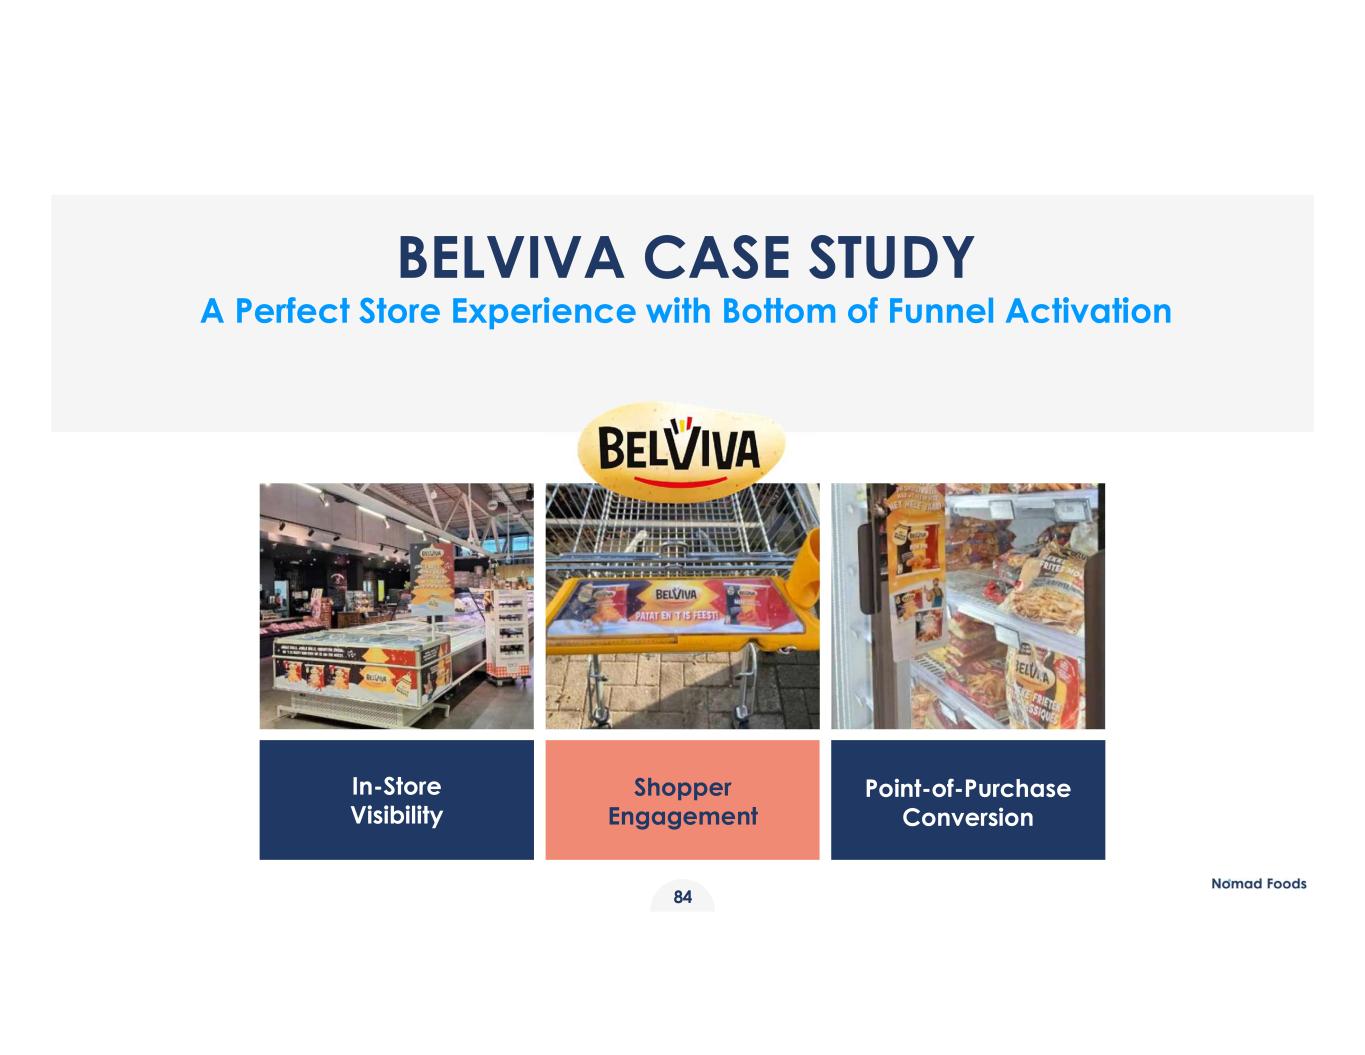
BELVIVA CASE STUDY A Perfect Store Experience with Bottom of Funnel Activation Shopper Engagement In-Store Visibility Point-of-Purchase Conversion 84
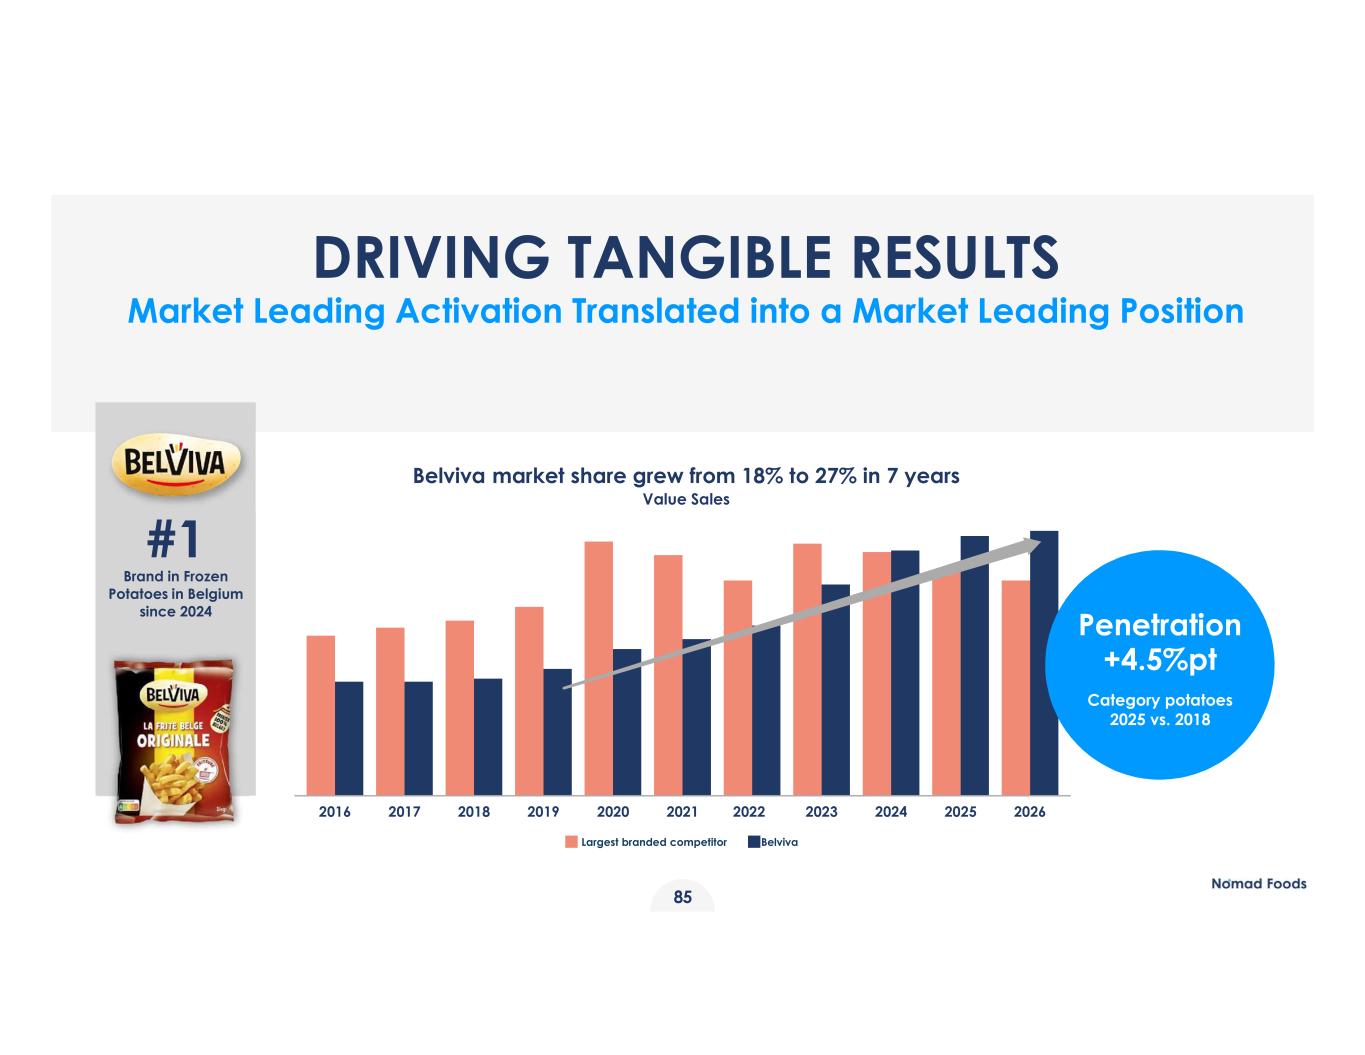
2016 2017 2018 2019 2020 2021 Largest branded competitor 2022 Belviva 2023 2024 2025 2026 #1 Brand in Frozen Potatoes in Belgium since 2024 Penetration +4.5%pt Category potatoes 2025 vs. 2018 DRIVING TANGIBLE RESULTS Market Leading Activation Translated into a Market Leading Position Belviva market share grew from 18% to 27% in 7 years Value Sales 85

WINNING AT RETAIL Pricing & Promoting with Precision 86
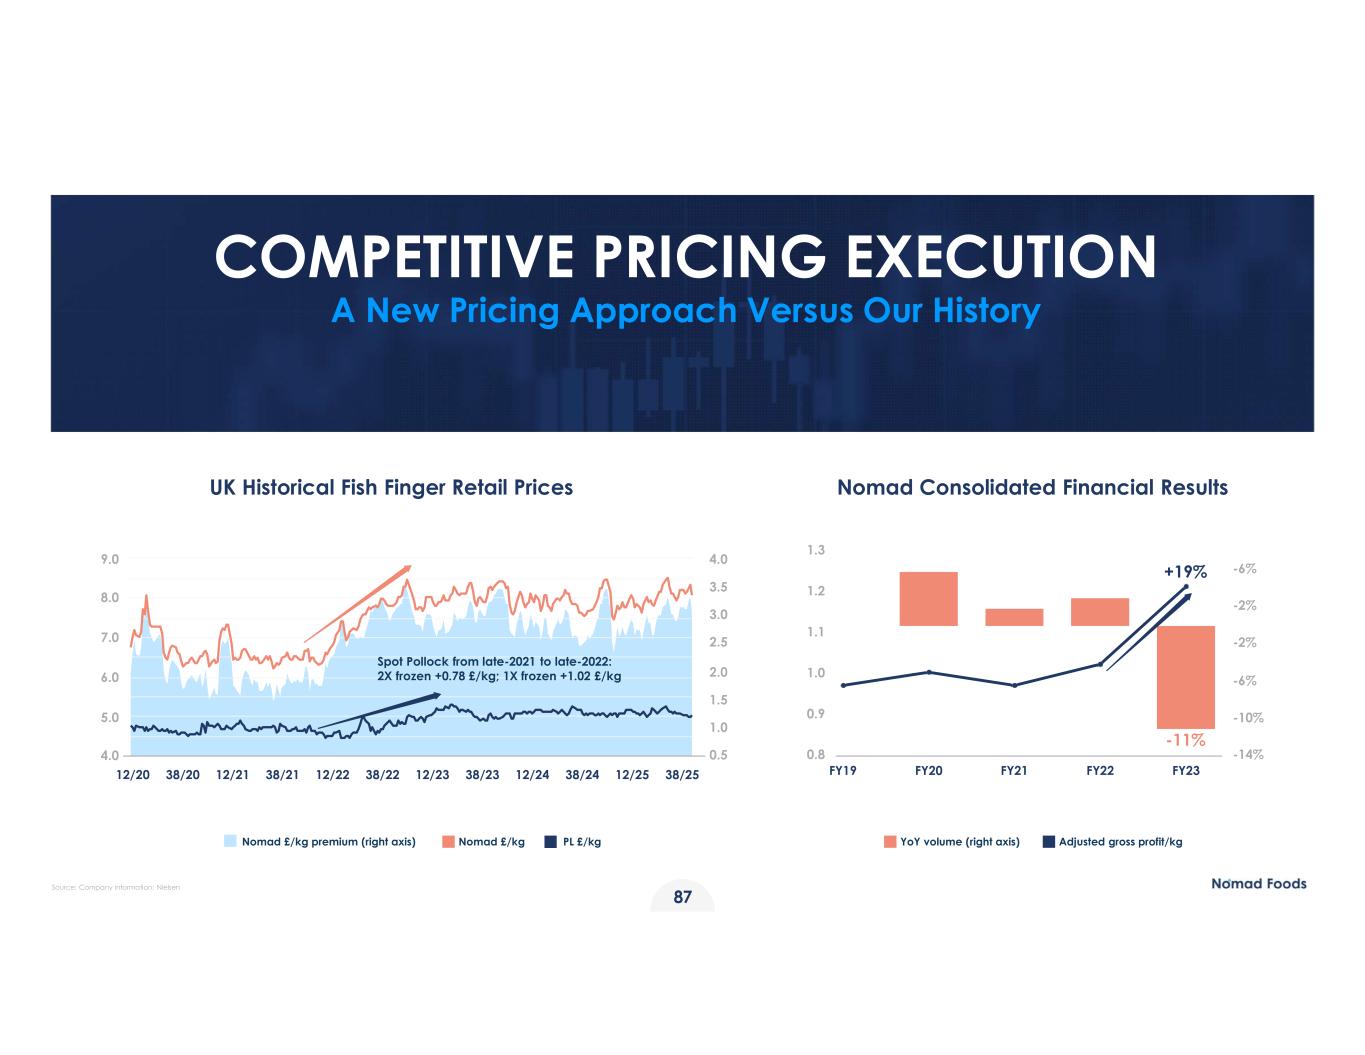
Nomad £/kg premium (right axis) Nomad £/kg PL £/kg YoY volume (right axis) Adjusted gross profit/kg UK Historical Fish Finger Retail Prices Nomad Consolidated Financial Results 2.0 1.5 1.0 0.5 4.0 3.5 3.0 2.5 4.0 5.0 6.0 7.0 8.0 9.0 12/20 38/20 12/21 38/21 12/22 38/22 12/23 38/23 12/24 38/24 12/25 38/25 Spot Pollock from late-2021 to late-2022: 2X frozen +0.78 £/kg; 1X frozen +1.02 £/kg -14% -10% -6% -2% -2% -6% 0.8 0.9 1.0 1.1 1.2 1.3 FY19 FY20 FY21 FY22 FY23 +19% -11% COMPETITIVE PRICING EXECUTION A New Pricing Approach Versus Our History 87 Source: Company information; Nielsen
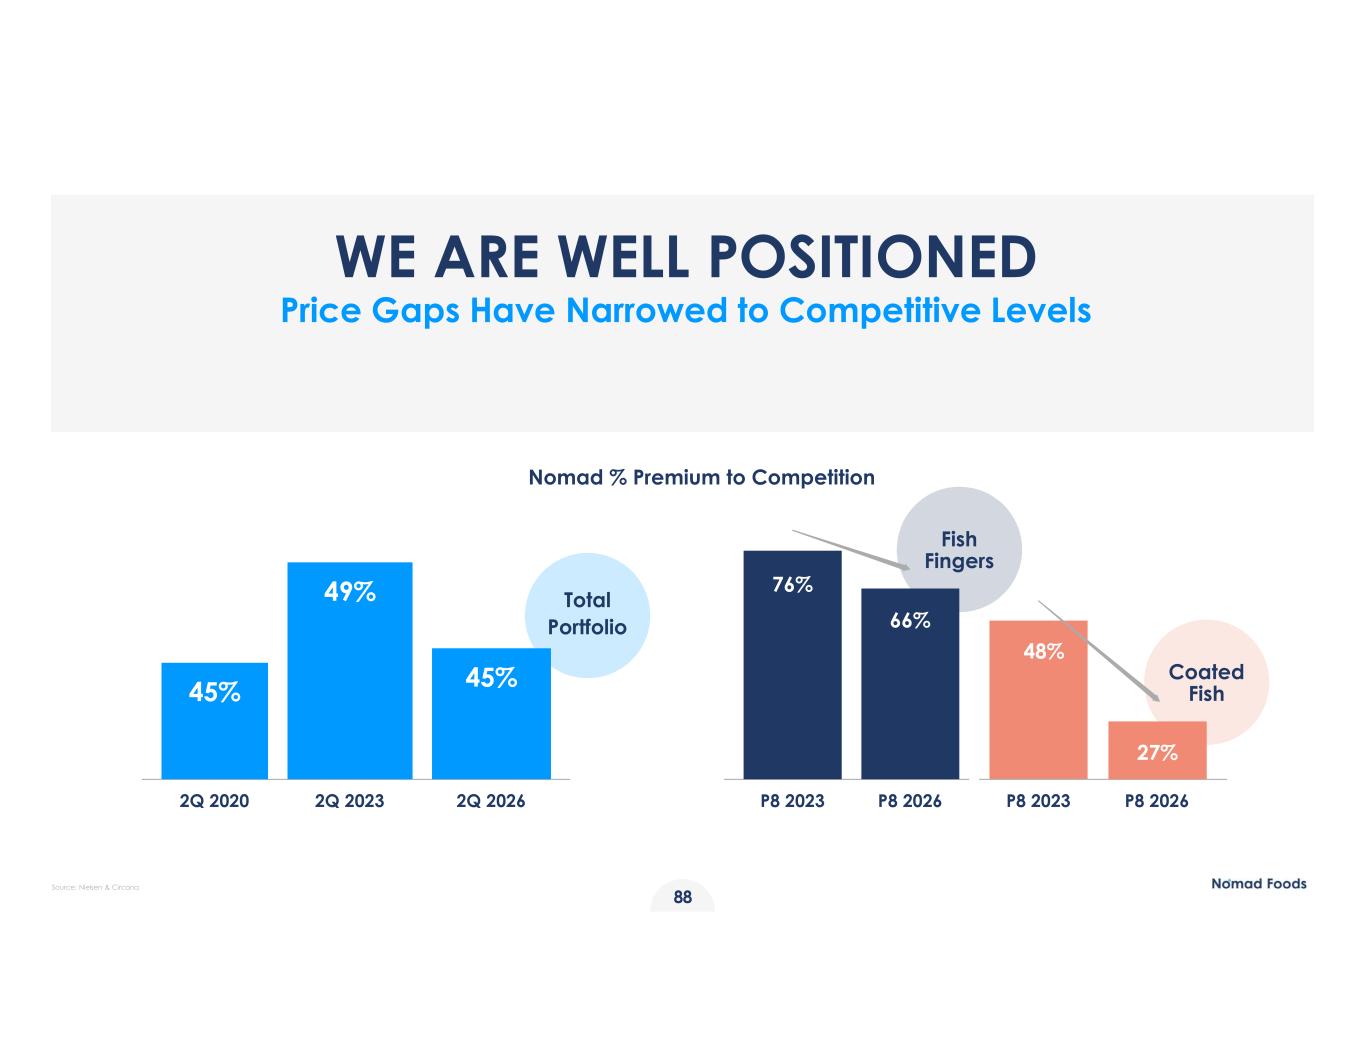
88 Nomad % Premium to Competition Total Portfolio 2Q 2020 45% 49% 45% 2Q 2023 2Q 2026 Coated Fish Fish Fingers P8 2023 P8 2026 P8 2023 P8 2026 76% 66% 48% 27% WE ARE WELL POSITIONED Price Gaps Have Narrowed to Competitive Levels Source: Nielsen & Circana
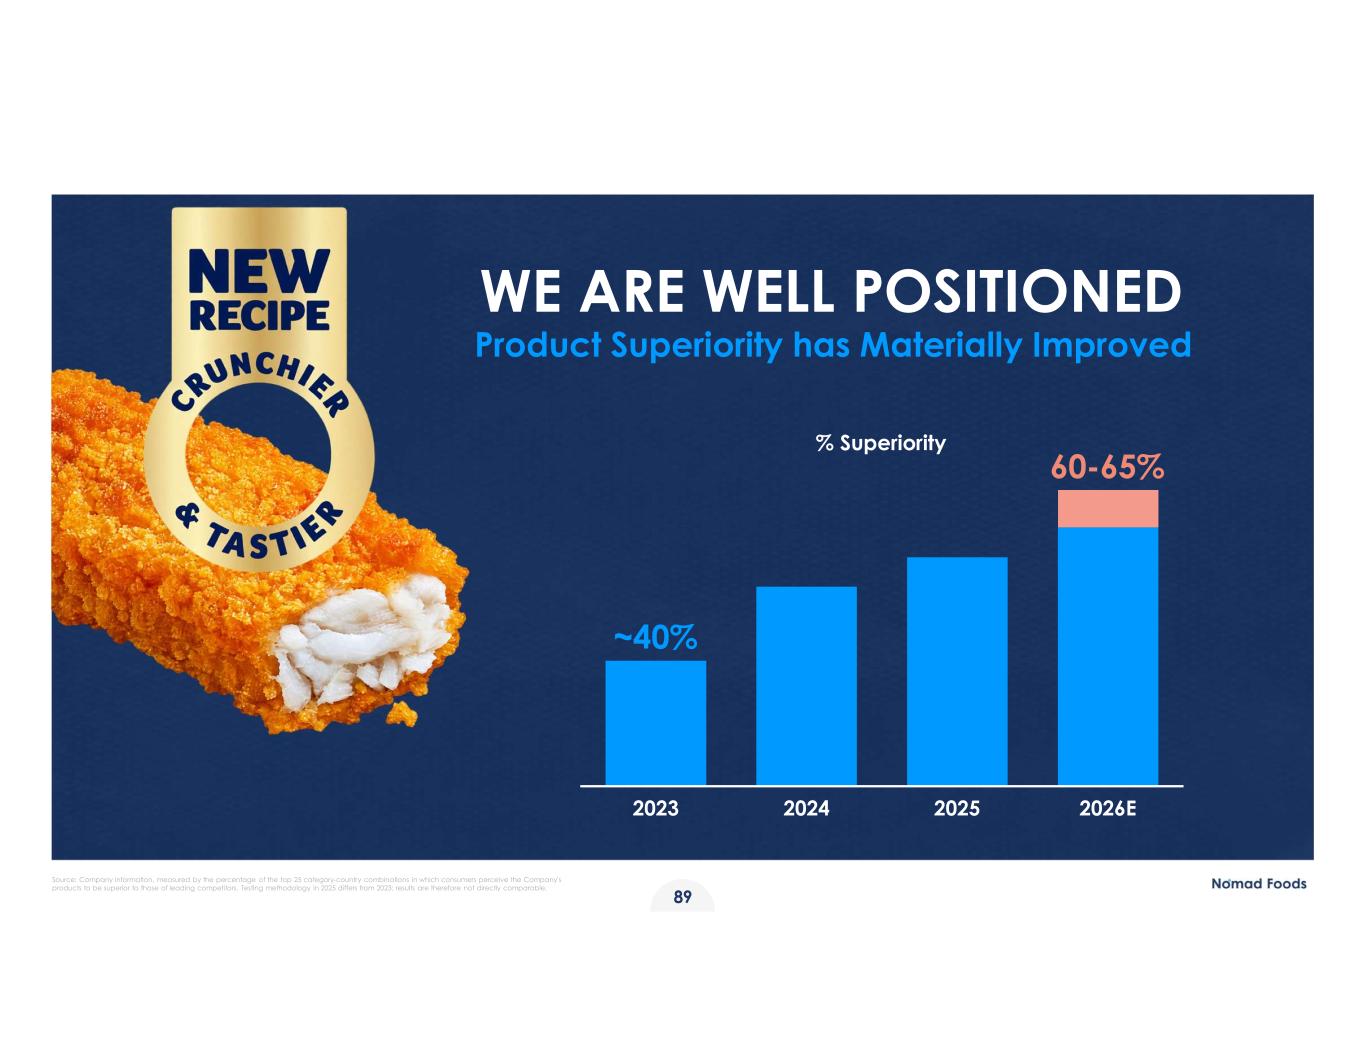
WE ARE WELL POSITIONED Product Superiority has Materially Improved % Superiority 2023 2024 2025 2026E ~40% 60-65% 89 Source: Company information, measured by the percentage of the top 25 category-country combinations in which consumers perceive the Company's products to be superior to those of leading competitors. Testing methodology in 2025 differs from 2023; results are therefore not directly comparable.
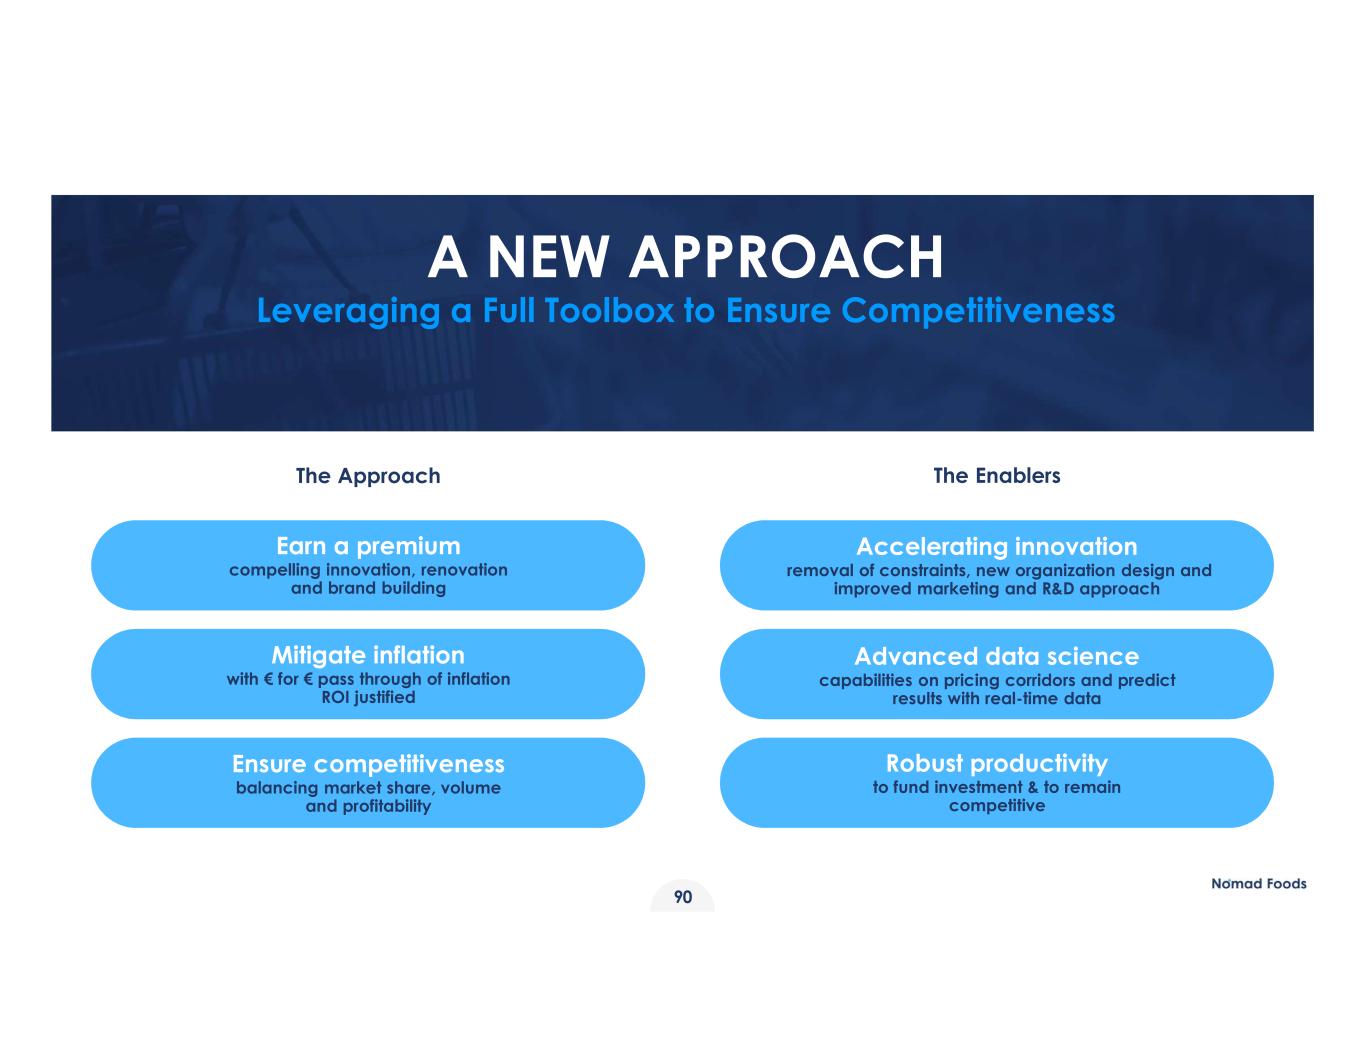
A NEW APPROACH Leveraging a Full Toolbox to Ensure Competitiveness Earn a premium compelling innovation, renovation and brand building Mitigate inflation with € for € pass through of inflation ROI justified Ensure competitiveness balancing market share, volume and profitability Accelerating innovation removal of constraints, new organization design and improved marketing and R&D approach Advanced data science capabilities on pricing corridors and predict results with real-time data Robust productivity to fund investment & to remain competitive The EnablersThe Approach 90
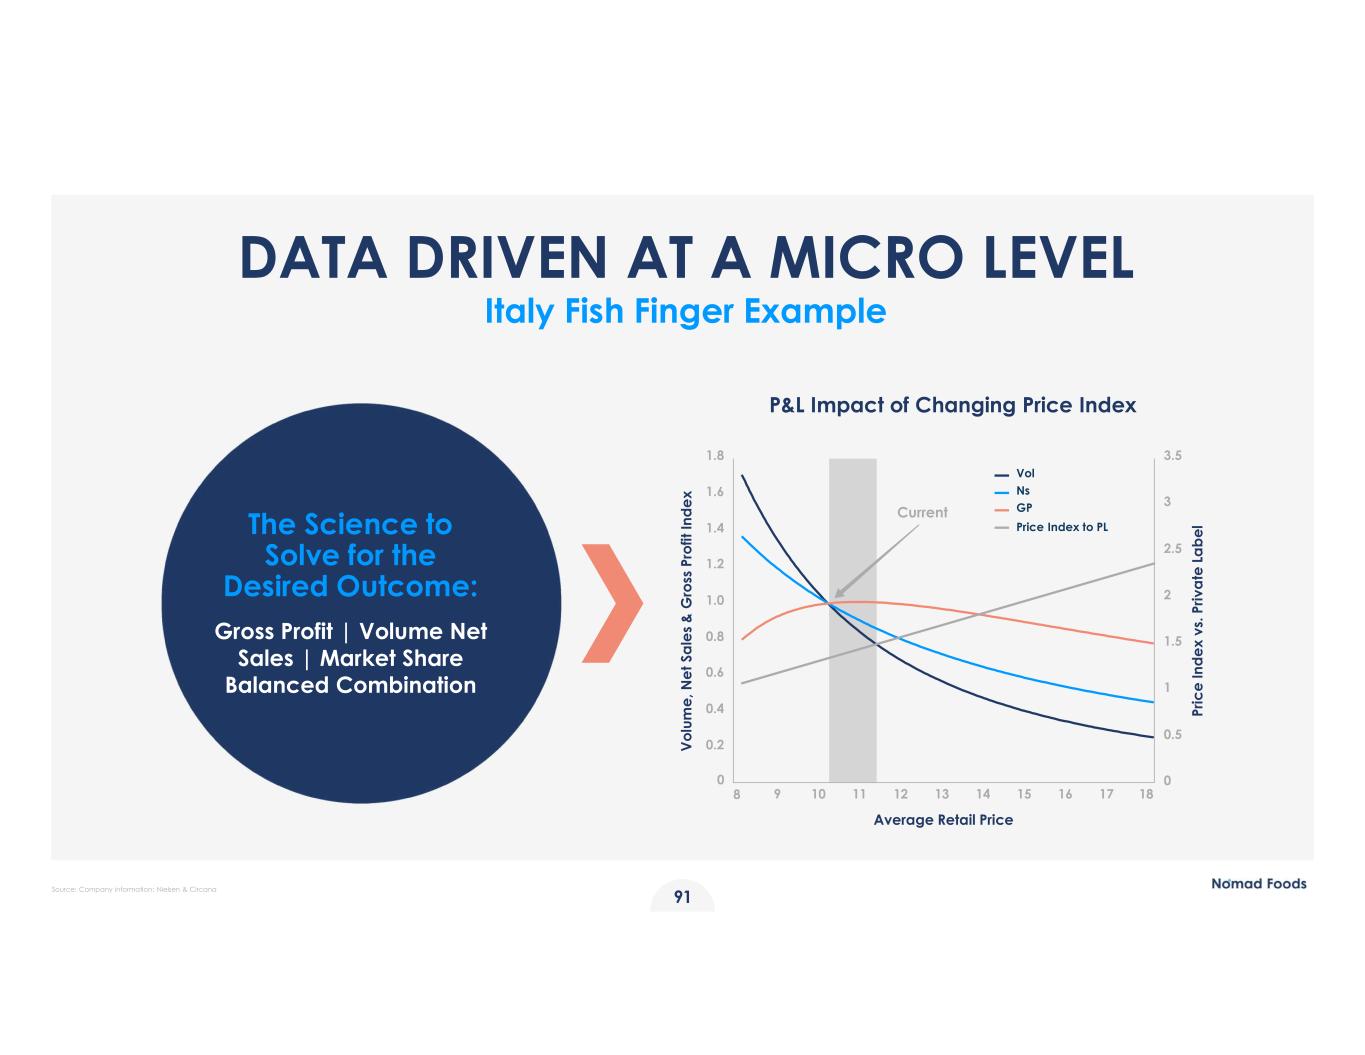
DATA DRIVEN AT A MICRO LEVEL Italy Fish Finger Example The Science to Solve for the Desired Outcome: Gross Profit | Volume Net Sales | Market Share Balanced Combination P&L Impact of Changing Price Index 0 0.5 1 1.5 2 3 3.5 0.2 0.4 0.6 0.8 1.0 1.2 1.4 1.6 1.8 0 8 9 Current 10 11 12 13 14 15 16 17 18 Average Retail Price V o lu m e , N e t S a le s & G ro ss P ro fit In d e x Pr ic e In d e x vs . P riv a te L a b e l 2.5 Vol Ns GP Price Index to PL 91 Source: Company information; Nielsen & Circana
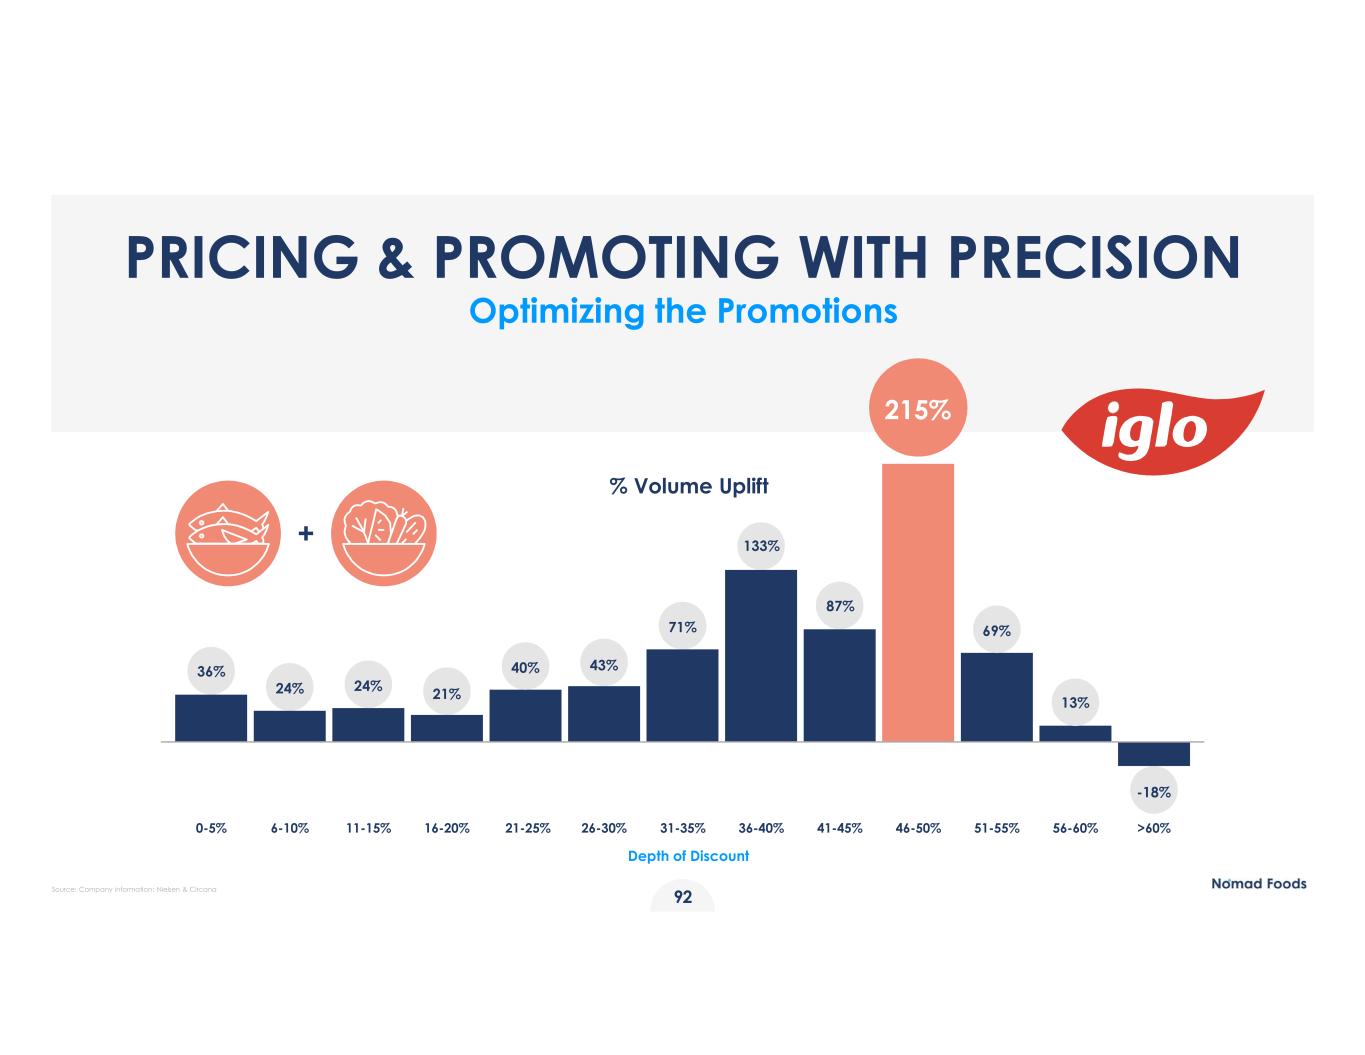
36% 24% 24% 21% 40% 43% 71% 215% 69% 13% % Volume Uplift -18% 0-5% 6-10% 11-15% 16-20% 21-25% 26-30% 31-35% 36-40% 41-45% 46-50% 51-55% 56-60% >60% PRICING & PROMOTING WITH PRECISION Optimizing the Promotions Depth of Discount 92 133% 87% Source: Company information; Nielsen & Circana
CAPTURING NEW CHANNELS Captain: Hard Discounters & Food Service 93
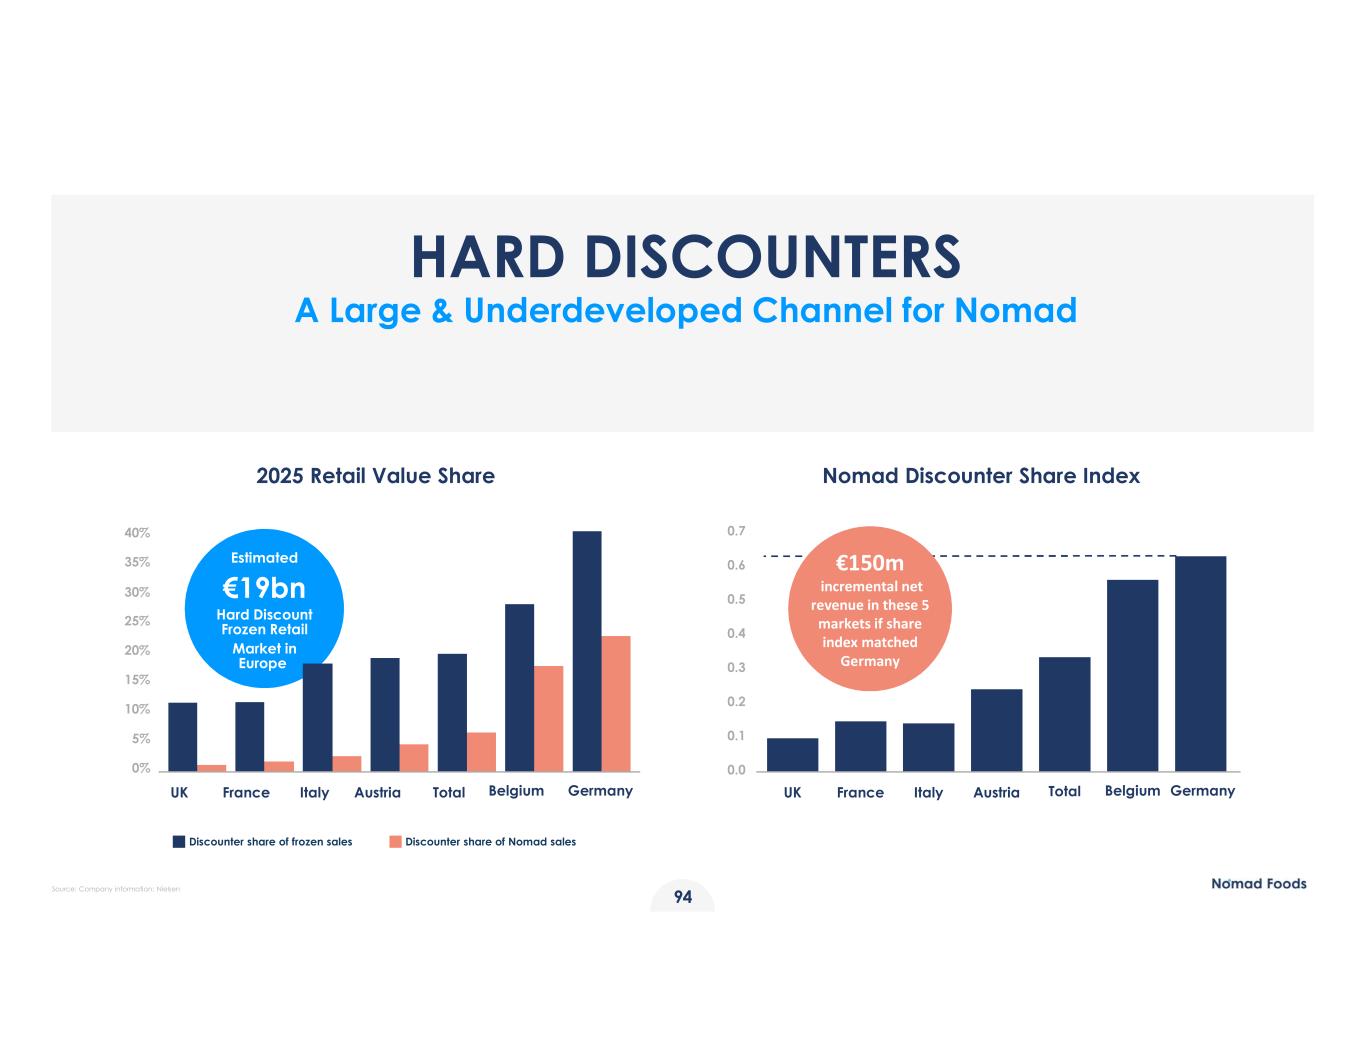
2025 Retail Value Share Nomad Discounter Share Index Discounter share of frozen sales Discounter share of Nomad sales Estimated €19bn Hard Discount Frozen Retail Market in Europe 5% 0% 15% 10% 25% 20% 35% 30% 40% Discounters are 18% of frozen, but <2% of NOMAD branded retail sales in the UK 0.1 0.2 0.0 0.3 0.4 0.5 0.6 0.7 UK France Italy Austria Total Belgium Germany Source: Company information; Nielsen HARD DISCOUNTERS A Large & Underdeveloped Channel for Nomad UK France Italy Austria Total Belgium Germany €150m incremental net revenue in these 5 markets if share index matched Germany 94
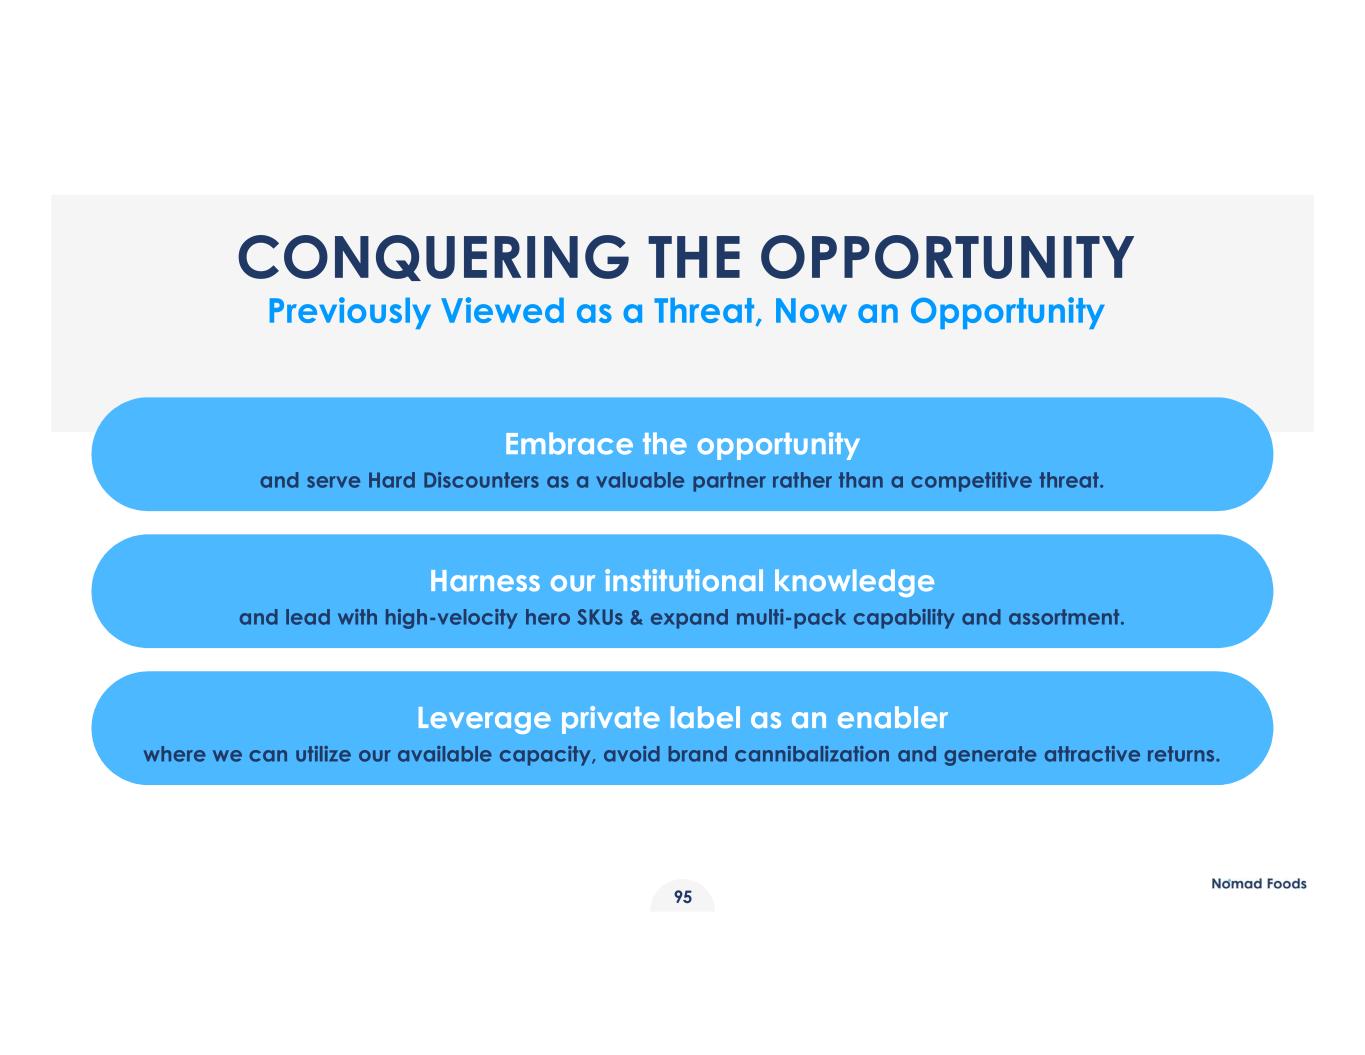
CONQUERING THE OPPORTUNITY Previously Viewed as a Threat, Now an Opportunity Leverage private label as an enabler where we can utilize our available capacity, avoid brand cannibalization and generate attractive returns. Embrace the opportunity and serve Hard Discounters as a valuable partner rather than a competitive threat. Harness our institutional knowledge and lead with high-velocity hero SKUs & expand multi-pack capability and assortment. 95
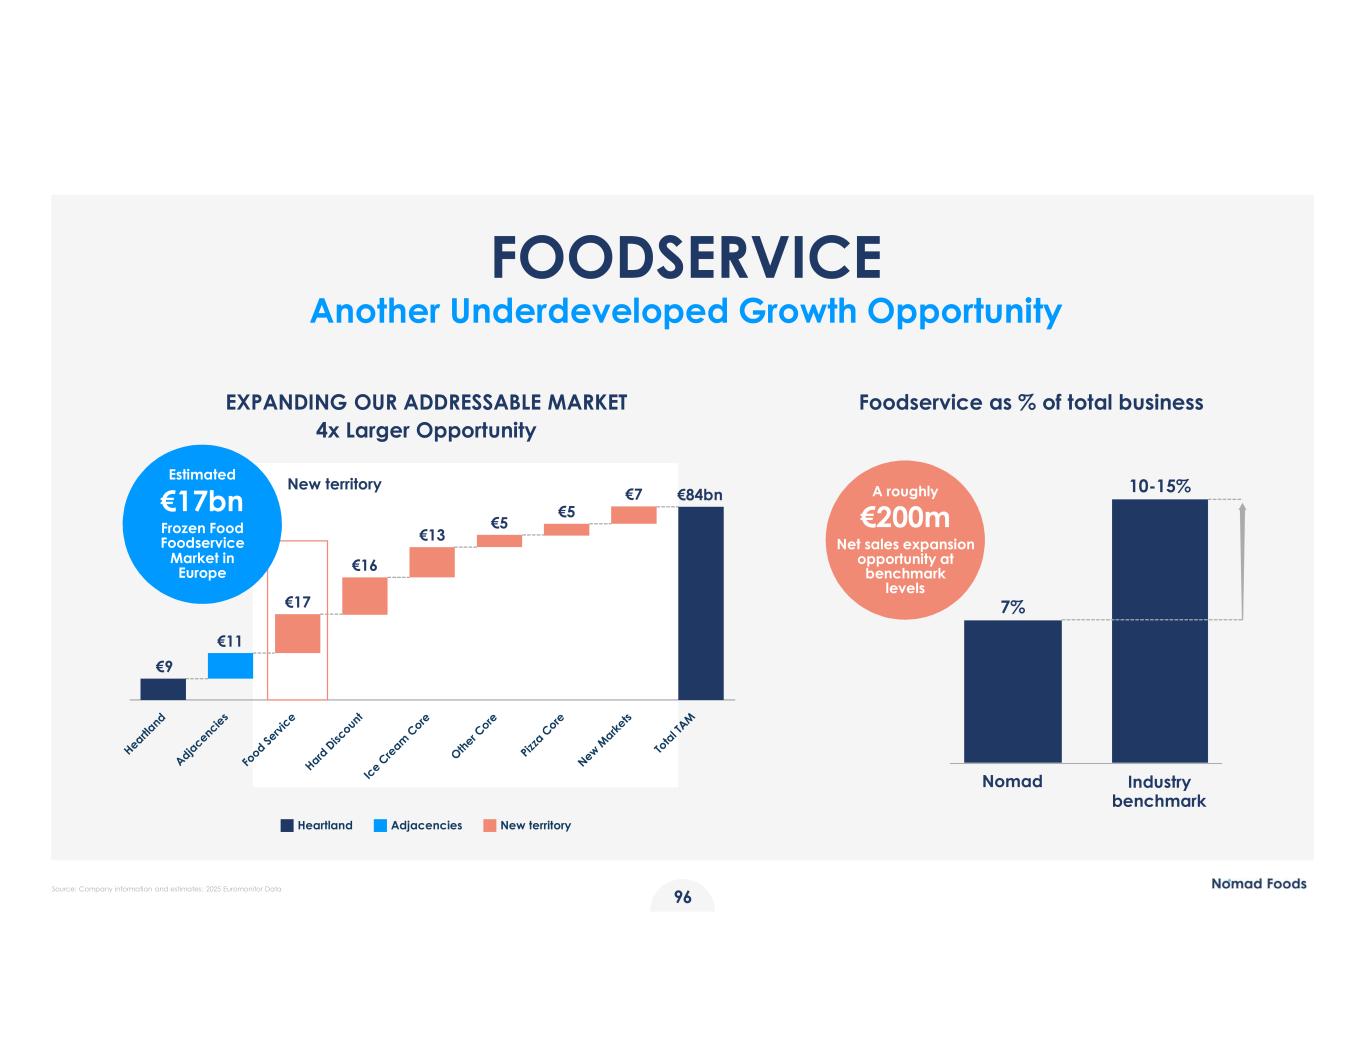
Source: Company information and estimates; 2025 Euromonitor Data Foodservice as % of total business Heartland Adjacencies New territory EXPANDING OUR ADDRESSABLE MARKET 4x Larger Opportunity A roughly €200m Net sales expansion opportunity at benchmark levels Nomad Industry benchmark 7% 10-15% FOODSERVICE Another Underdeveloped Growth Opportunity €17 €16 €13 €11 €9 €84bn New territory €5 €5 €7 Estimated €17bn Frozen Food Foodservice Market in Europe 96
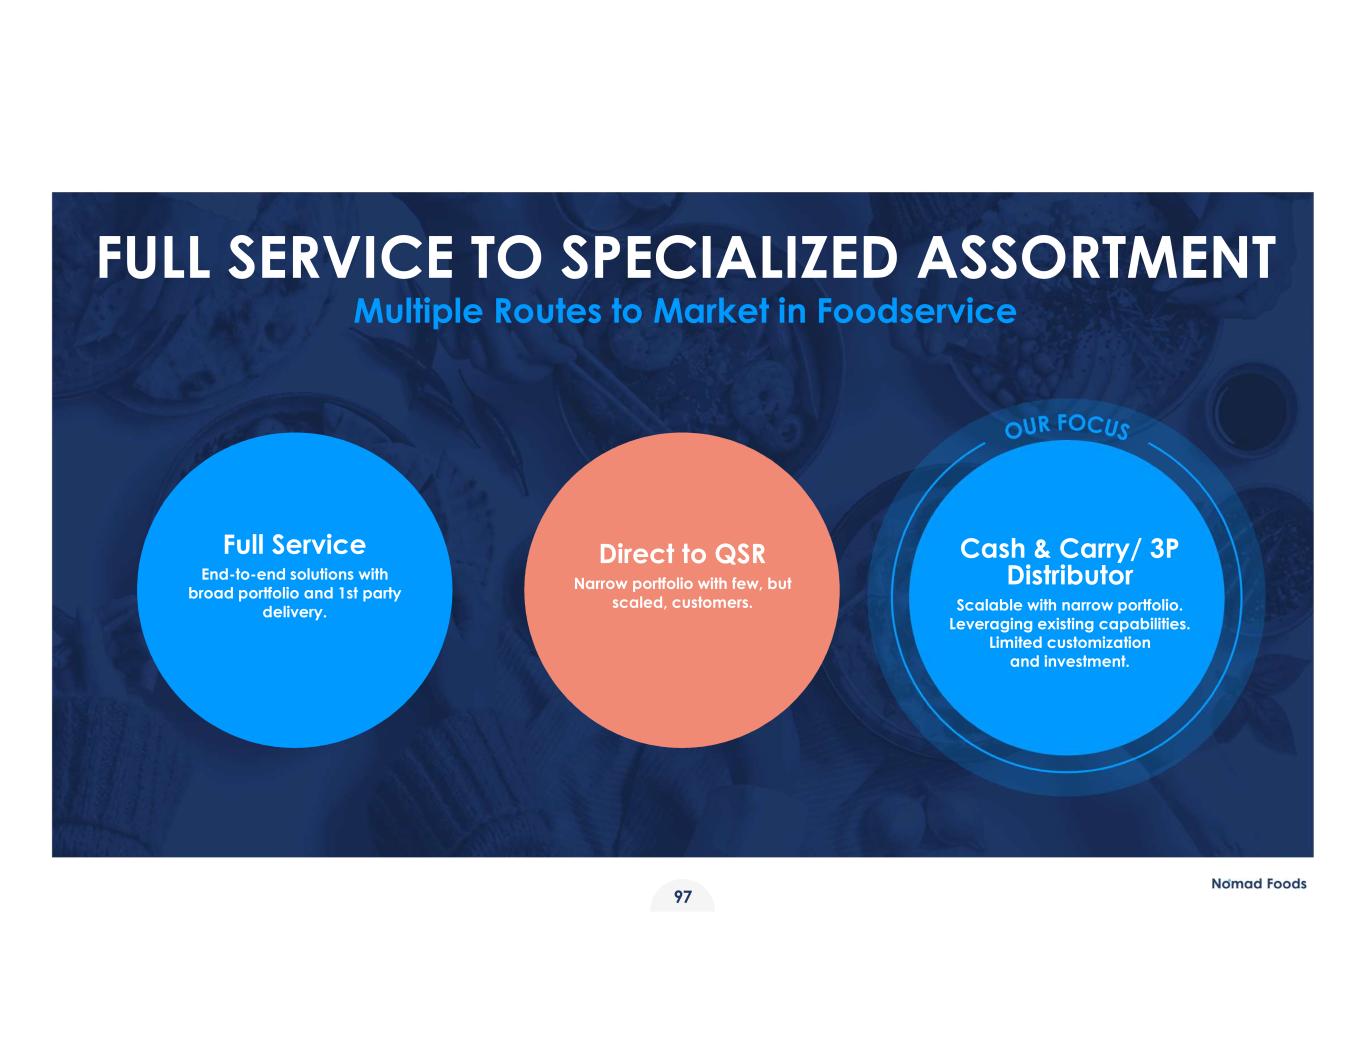
Direct to QSR Narrow portfolio with few, but scaled, customers. Full Service End-to-end solutions with broad portfolio and 1st party delivery. Cash & Carry/ 3P Distributor Scalable with narrow portfolio. Leveraging existing capabilities. Limited customization and investment. FULL SERVICE TO SPECIALIZED ASSORTMENT Multiple Routes to Market in Foodservice 97
98 LEVERAGING OUR COMPETITIVE SUPPLY CHAIN ADVANTAGE Eduardo Bachiega
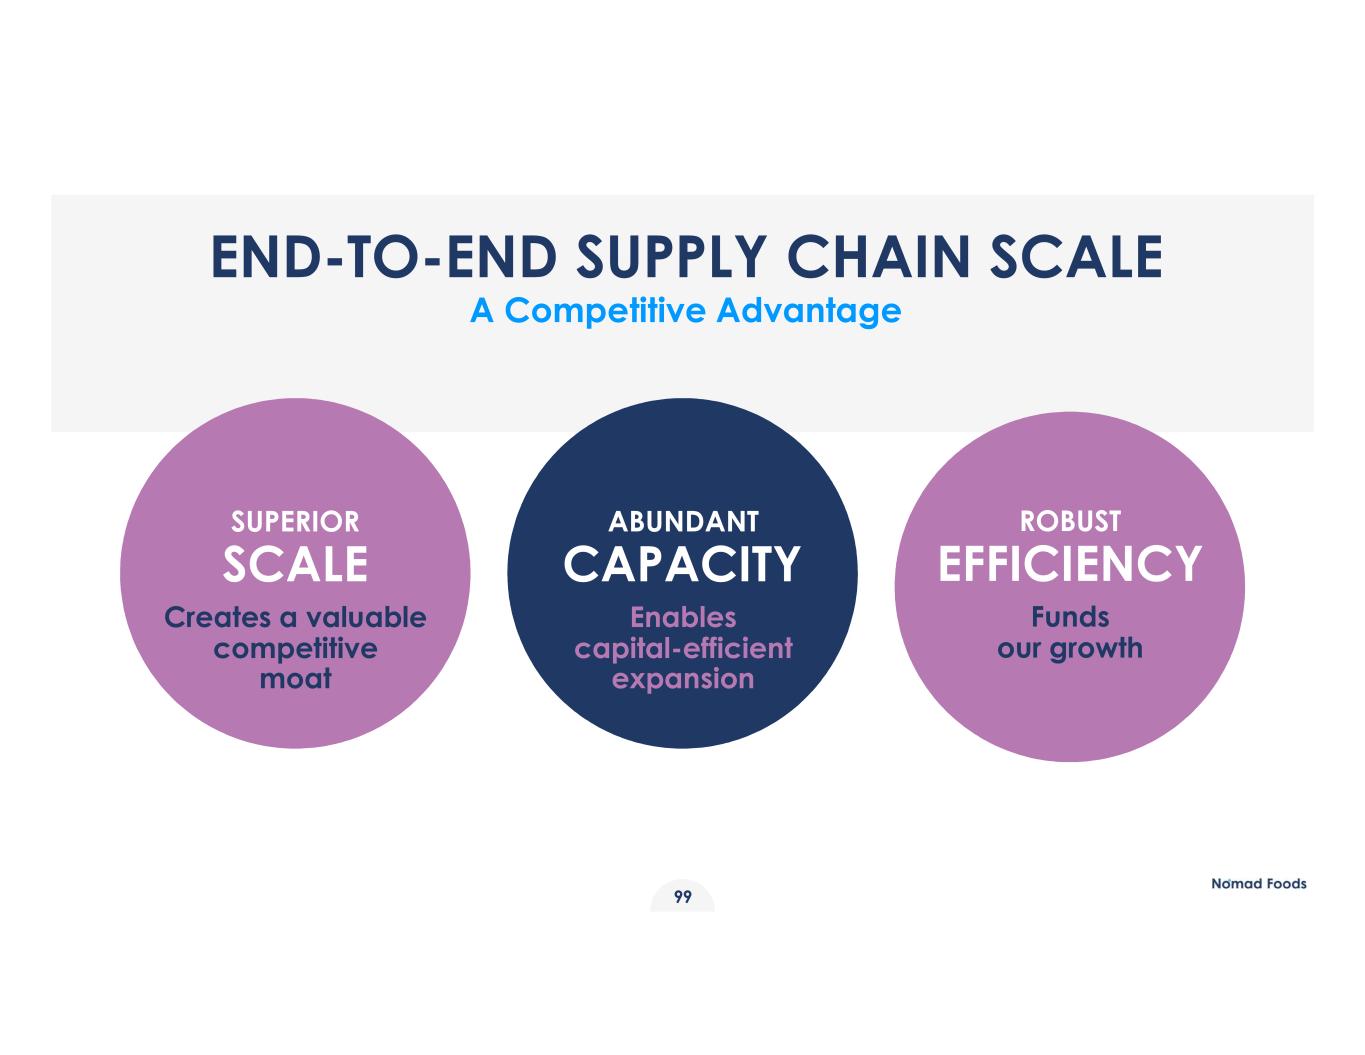
ABUNDANT CAPACITY Enables capital-efficient expansion SUPERIOR SCALE Creates a valuable competitive moat ROBUST EFFICIENCY Funds our growth 99 END-TO-END SUPPLY CHAIN SCALE A Competitive Advantage
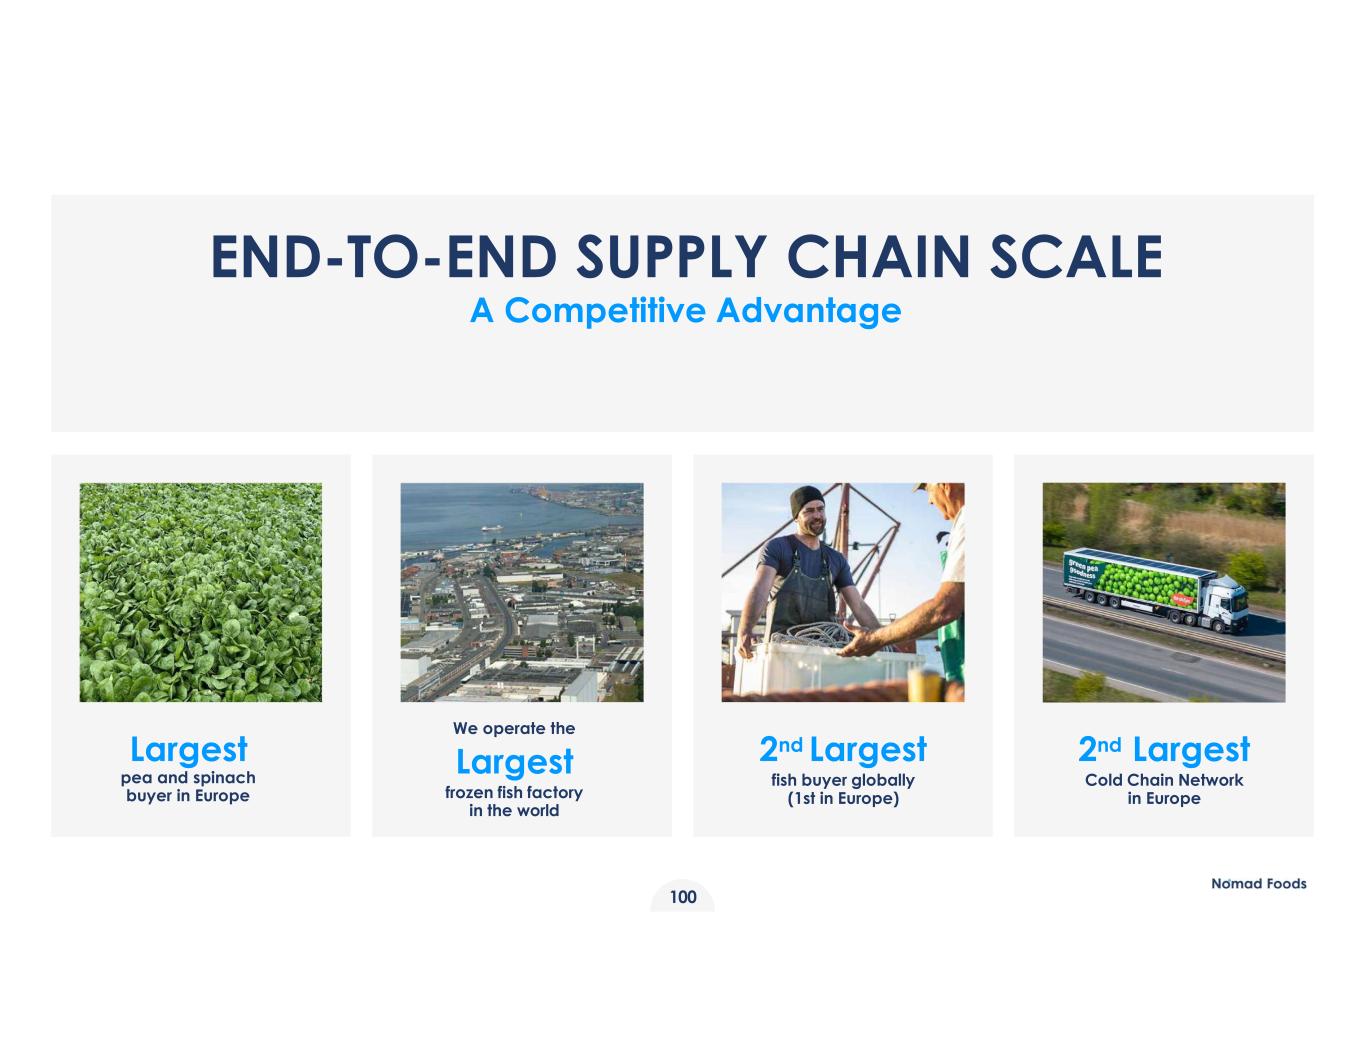
END-TO-END SUPPLY CHAIN SCALE A Competitive Advantage We operate the Largest frozen fish factory in the world 2nd Largest fish buyer globally (1st in Europe) 2nd Largest Cold Chain Network in Europe Largest pea and spinach buyer in Europe 100
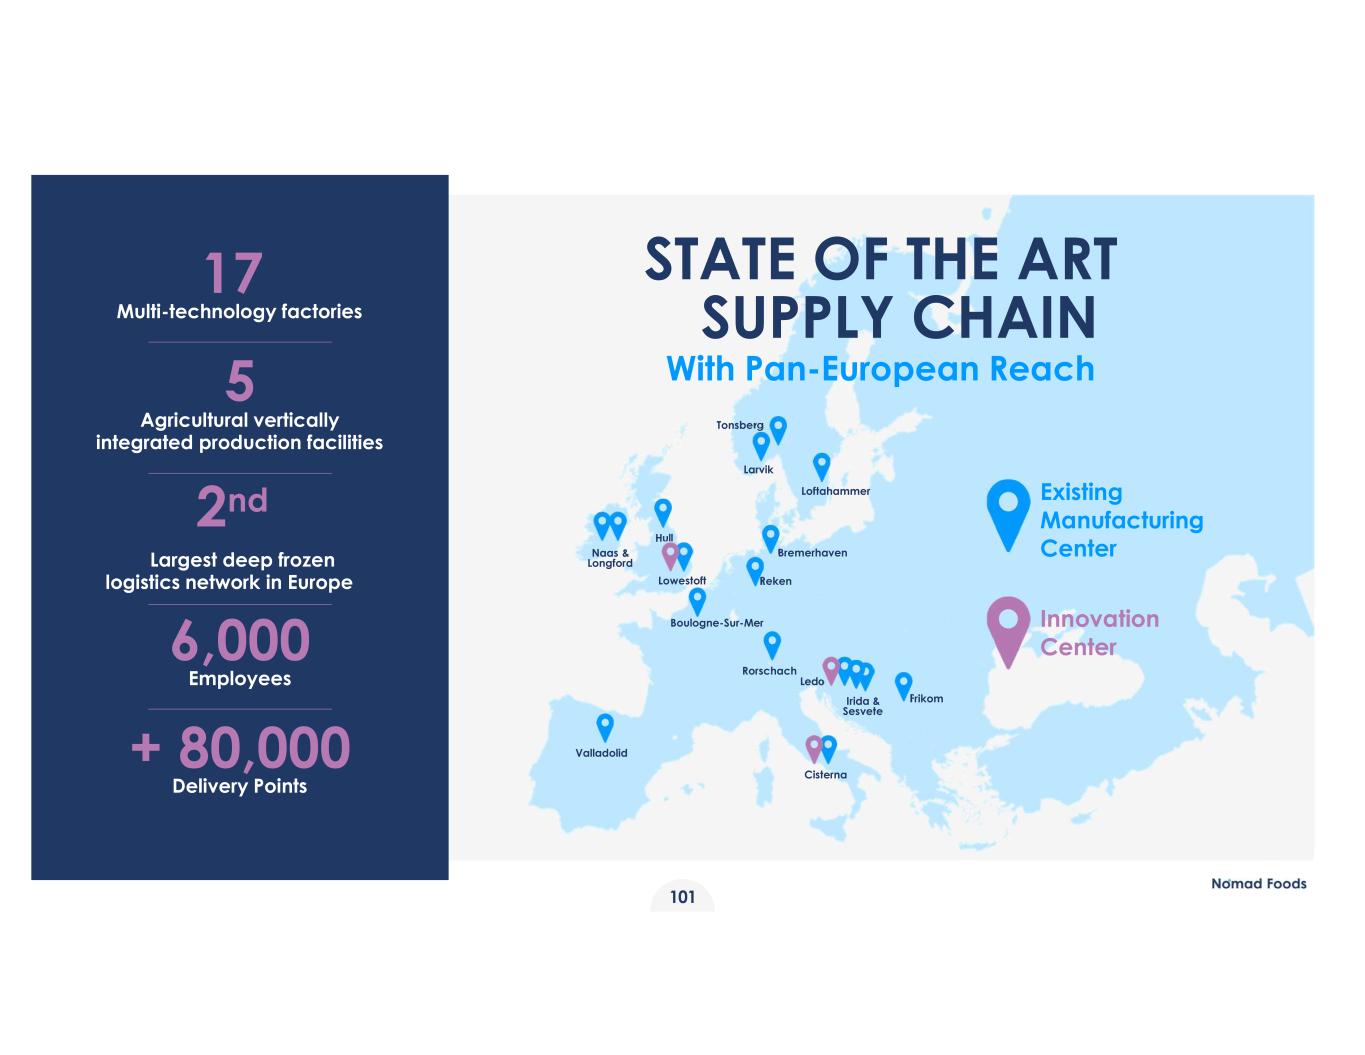
Existing Manufacturing Center STATE OF THE ART SUPPLY CHAIN With Pan-European Reach 17 Multi-technology factories 5 Agricultural vertically integrated production facilities 2nd Largest deep frozen logistics network in Europe 6,000 Employees + 80,000 Delivery Points 101 Innovation Center Valladolid Rorschach Boulogne-Sur-Mer RekenLowestoft Hull Naas & Longford Bremerhaven Loftahammer Larvik Tonsberg Cisterna Frikom Ledo Irida & Sesvete
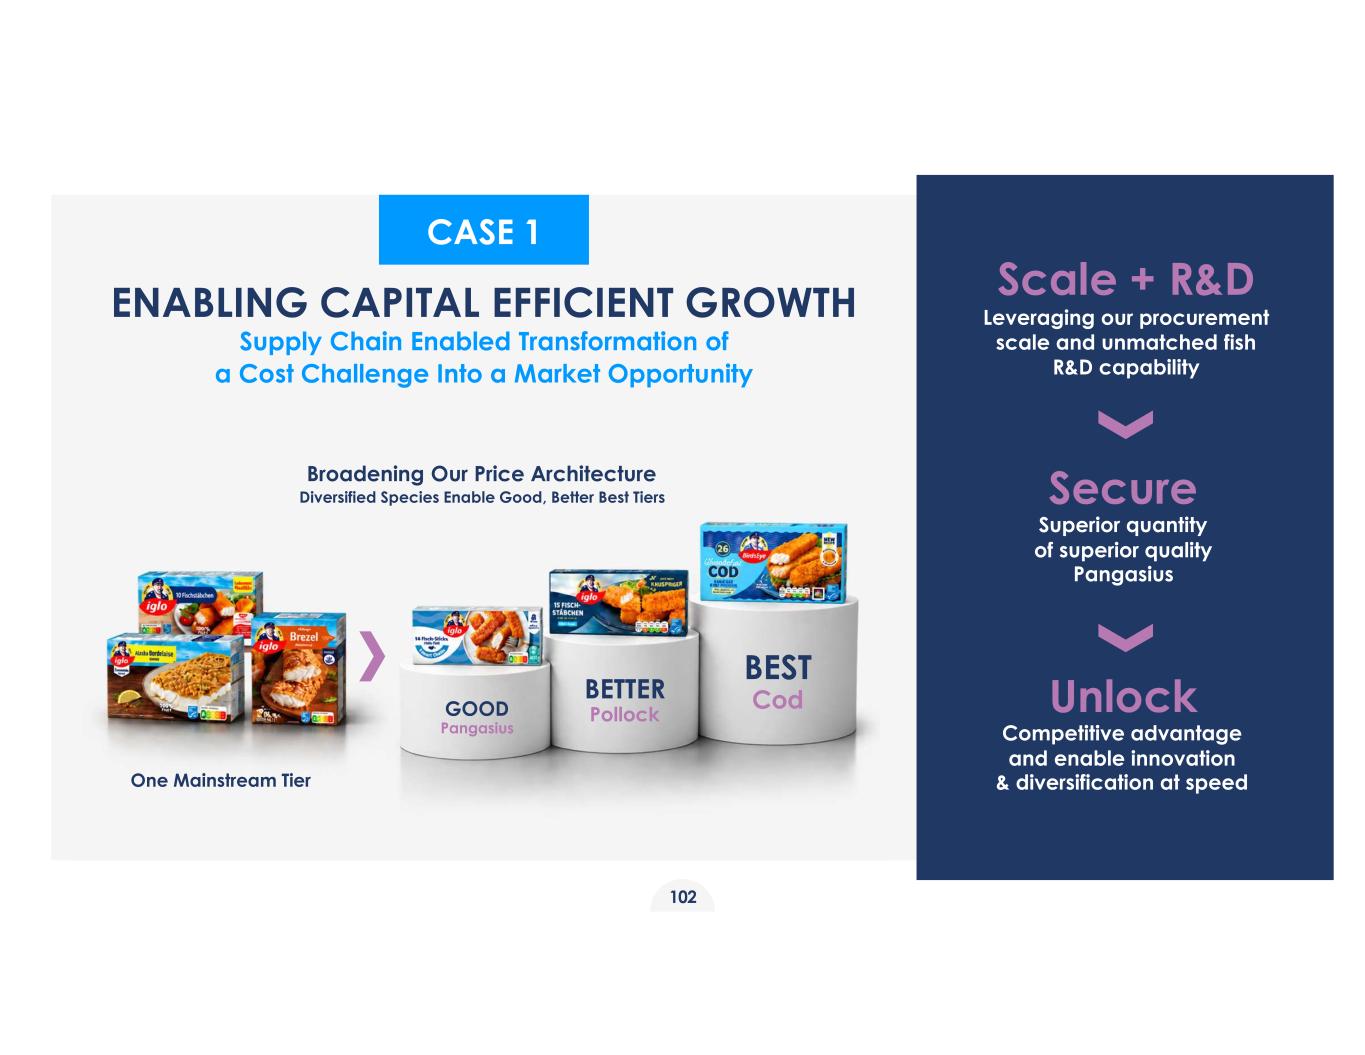
GOOD Pangasius BETTER Pollock BEST Cod One Mainstream Tier Broadening Our Price Architecture Diversified Species Enable Good, Better Best Tiers ENABLING CAPITAL EFFICIENT GROWTH Supply Chain Enabled Transformation of a Cost Challenge Into a Market Opportunity CASE 1 Secure Superior quantity of superior quality Pangasius Unlock Competitive advantage and enable innovation & diversification at speed Scale + R&D Leveraging our procurement scale and unmatched fish R&D capability 102
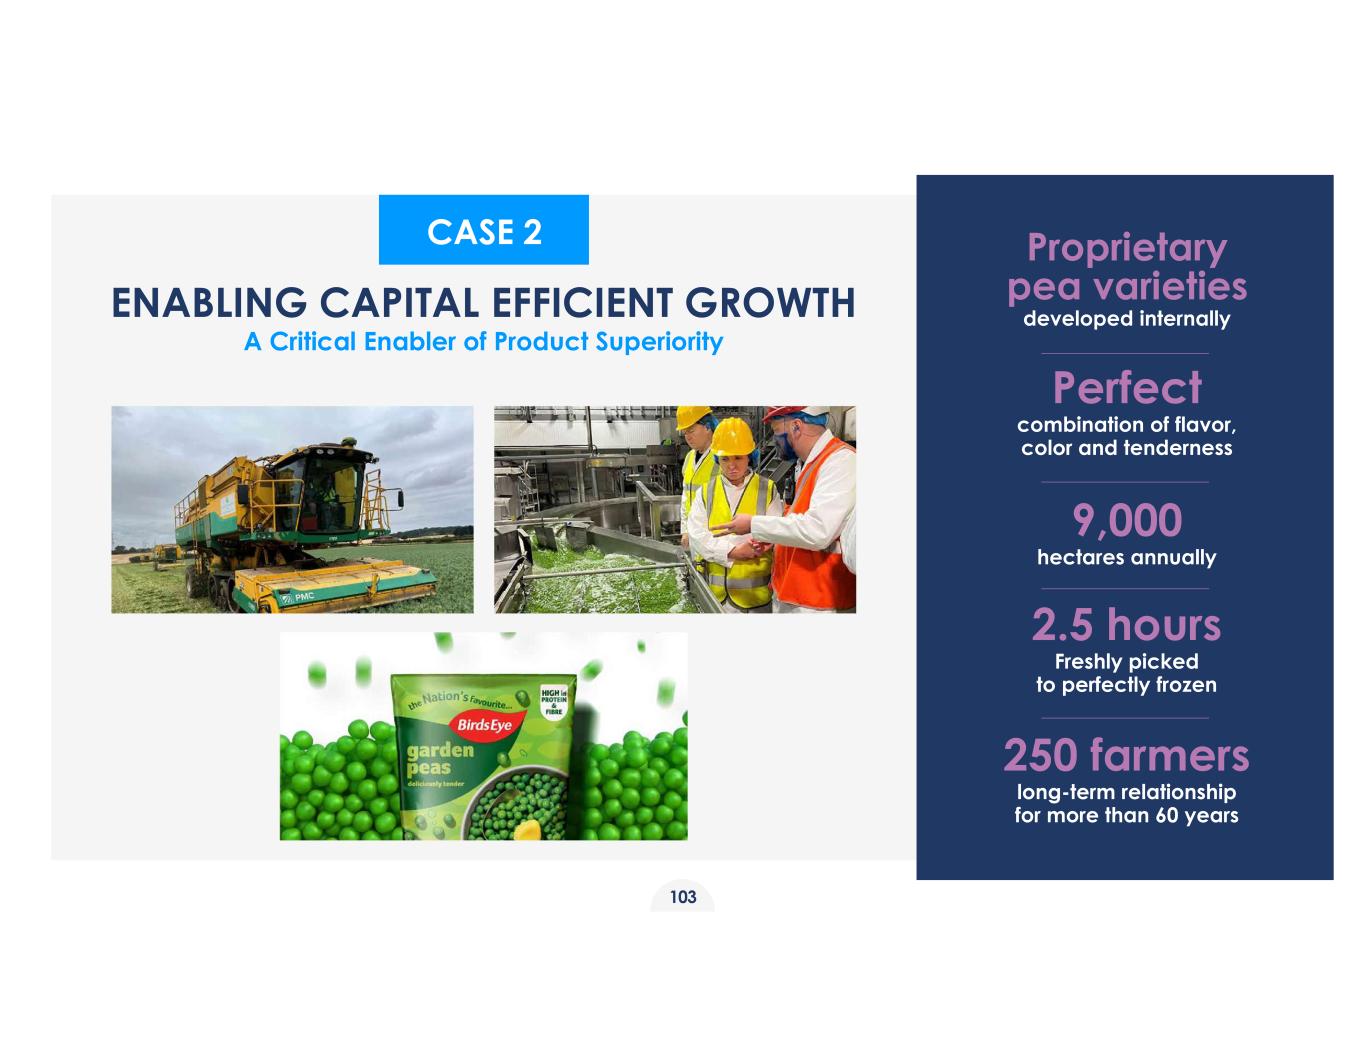
ENABLING CAPITAL EFFICIENT GROWTH A Critical Enabler of Product Superiority Proprietary pea varieties developed internally Perfect combination of flavor, color and tenderness 9,000 hectares annually 2.5 hours Freshly picked to perfectly frozen 250 farmers long-term relationship for more than 60 years CASE 2 103
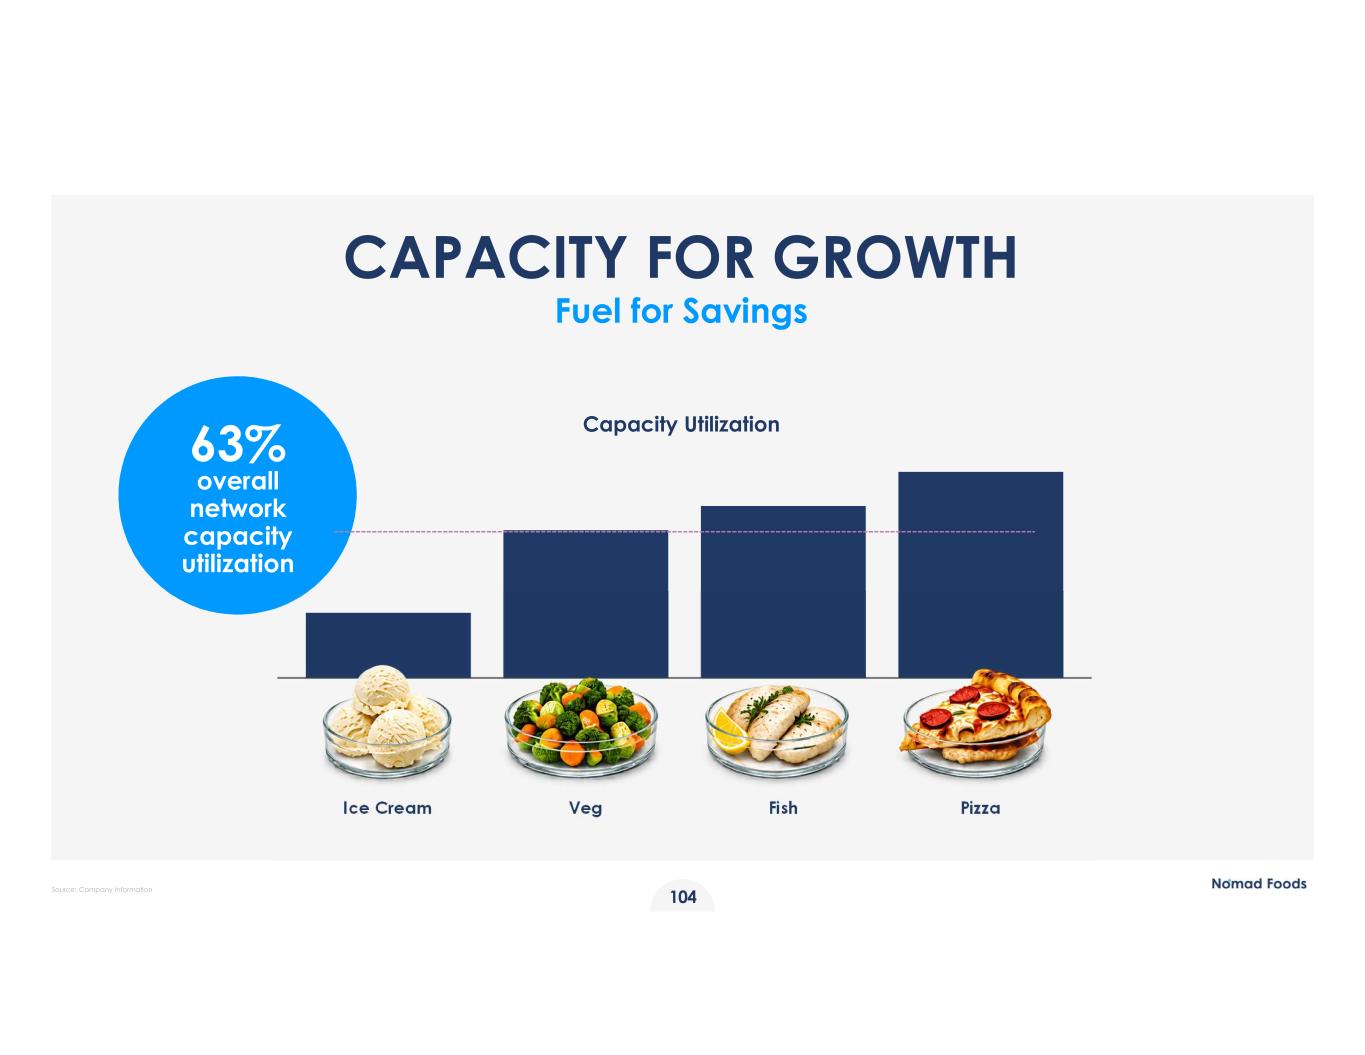
104 63% overall network capacity utilization CAPACITY FOR GROWTH Fuel for Savings Ice Cream Veg PizzaFish Capacity Utilization Corrigir imagem pizza Source: Company Information
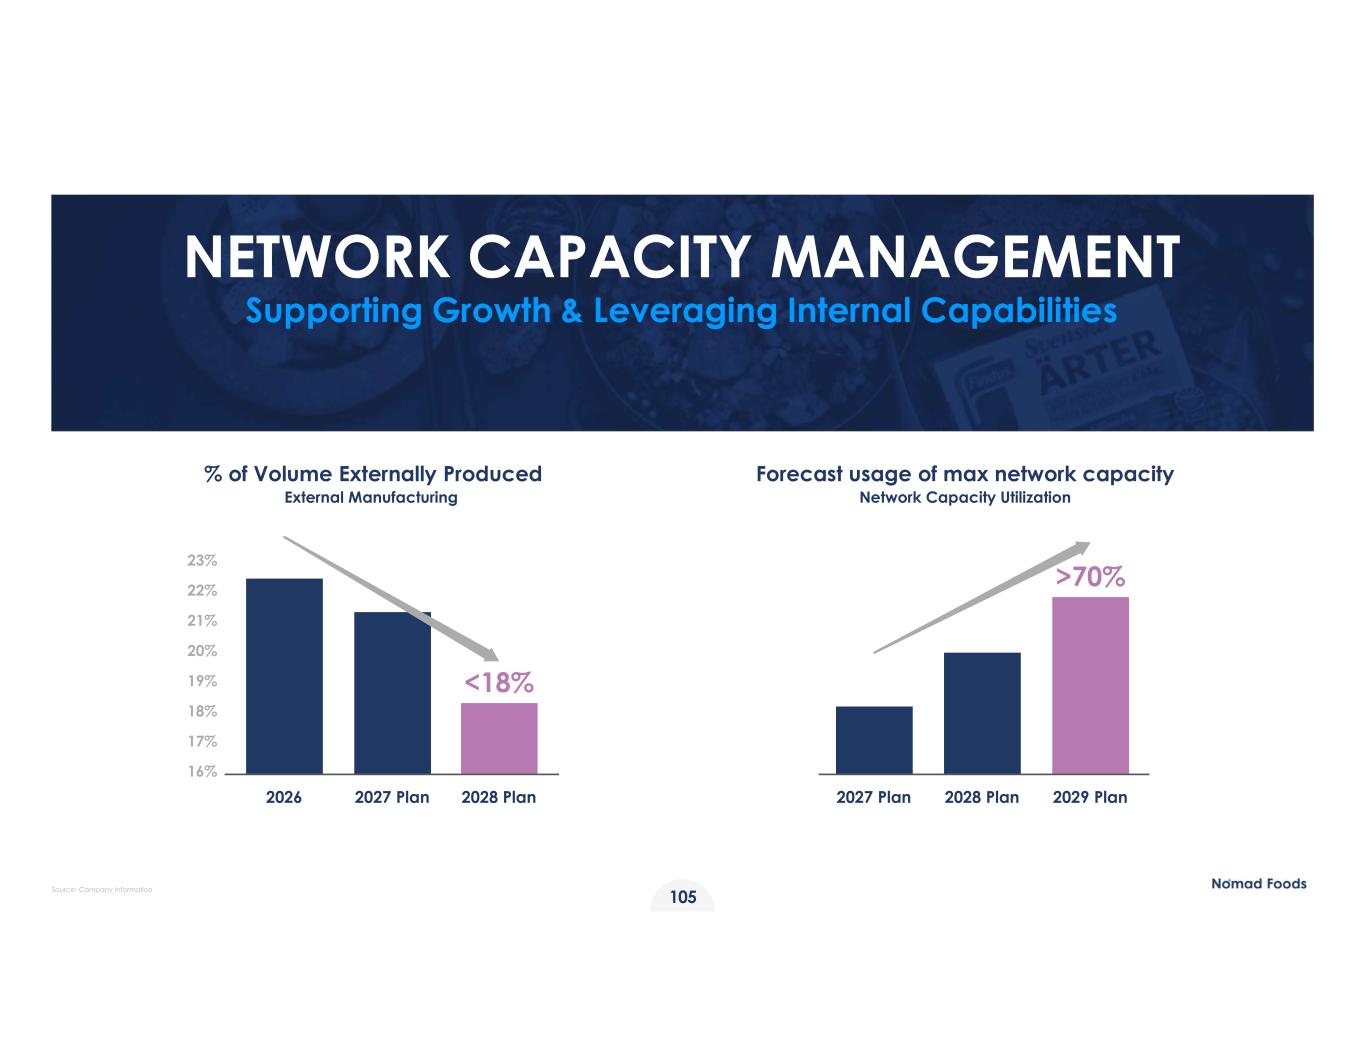
NETWORK CAPACITY MANAGEMENT Supporting Growth & Leveraging Internal Capabilities % of Volume Externally Produced External Manufacturing Forecast usage of max network capacity Network Capacity Utilization 23% 22% 21% 20% 19% 18% 17% 16% 2026 2027 Plan 2028 Plan 2027 Plan 2028 Plan 2029 Plan <18% >70% 105 Source: Company Information
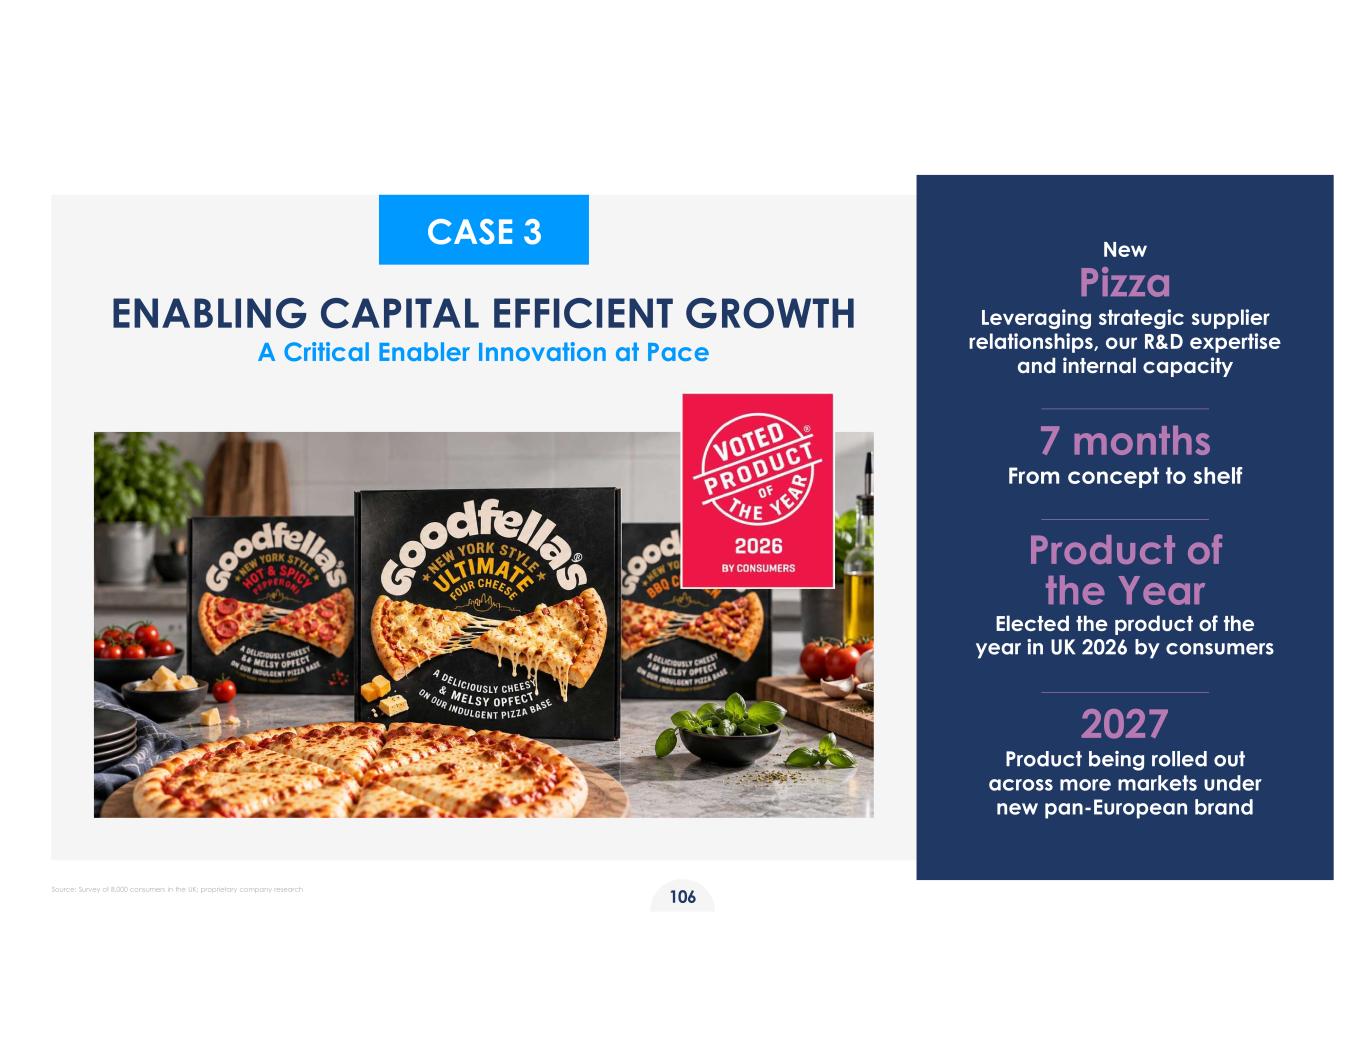
ENABLING CAPITAL EFFICIENT GROWTH A Critical Enabler Innovation at Pace New Pizza Leveraging strategic supplier relationships, our R&D expertise and internal capacity 7 months From concept to shelf Product of the Year Elected the product of the year in UK 2026 by consumers 2027 Product being rolled out across more markets under new pan-European brand CASE 3 106 Source: Survey of 8,000 consumers in the UK; proprietary company research
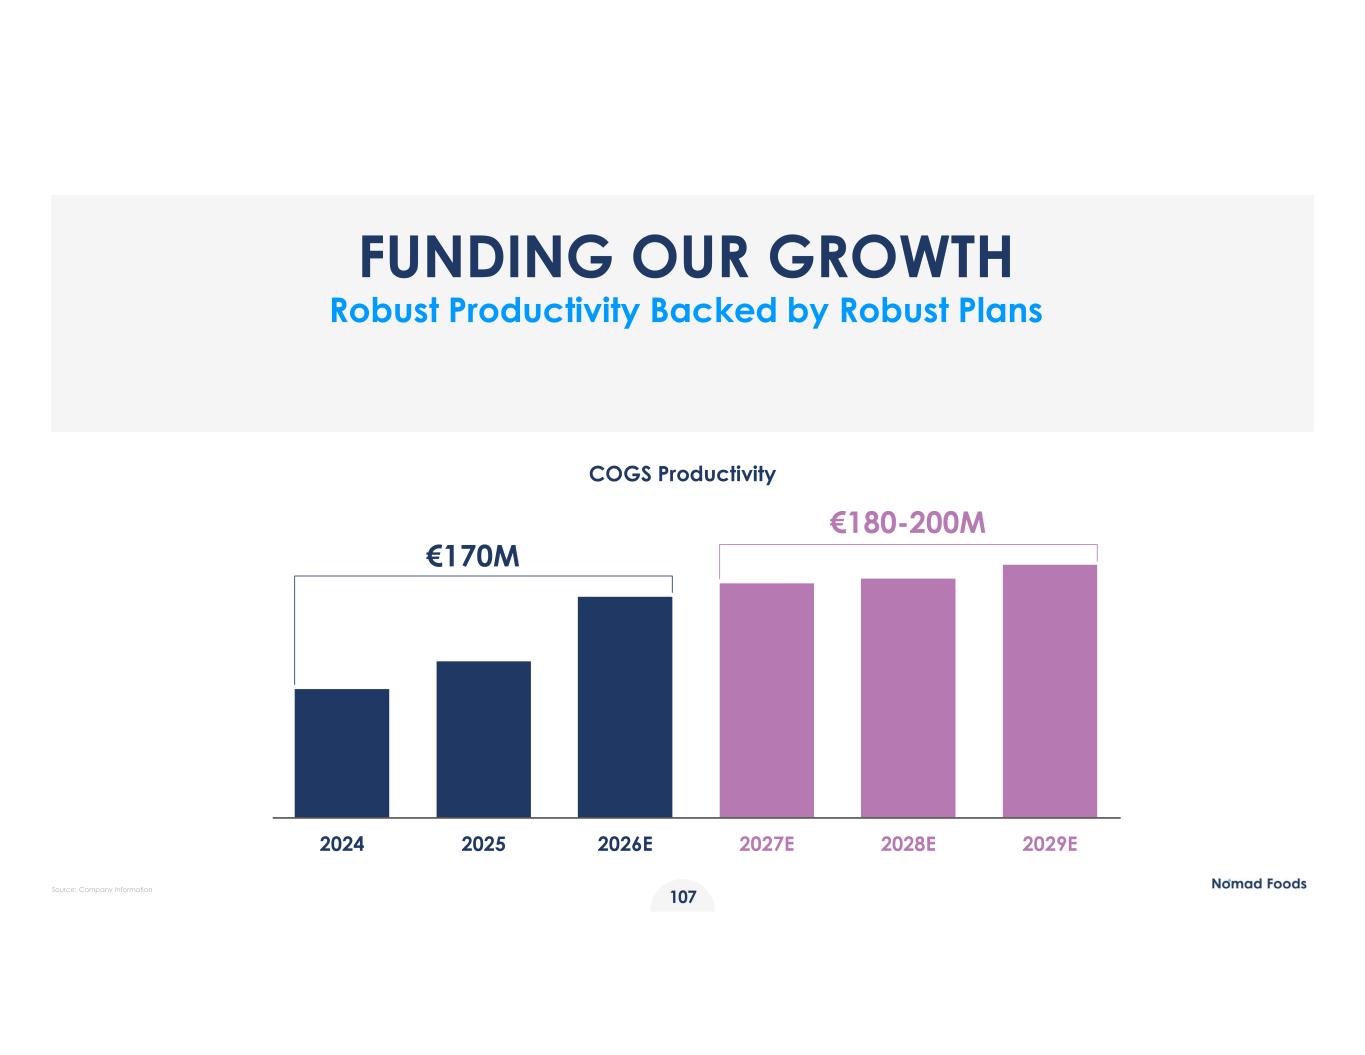
FUNDING OUR GROWTH Robust Productivity Backed by Robust Plans COGS Productivity €180-200M €170M 2024 2025 2026E 2027E 2028E 2029E 107 Source: Company Information
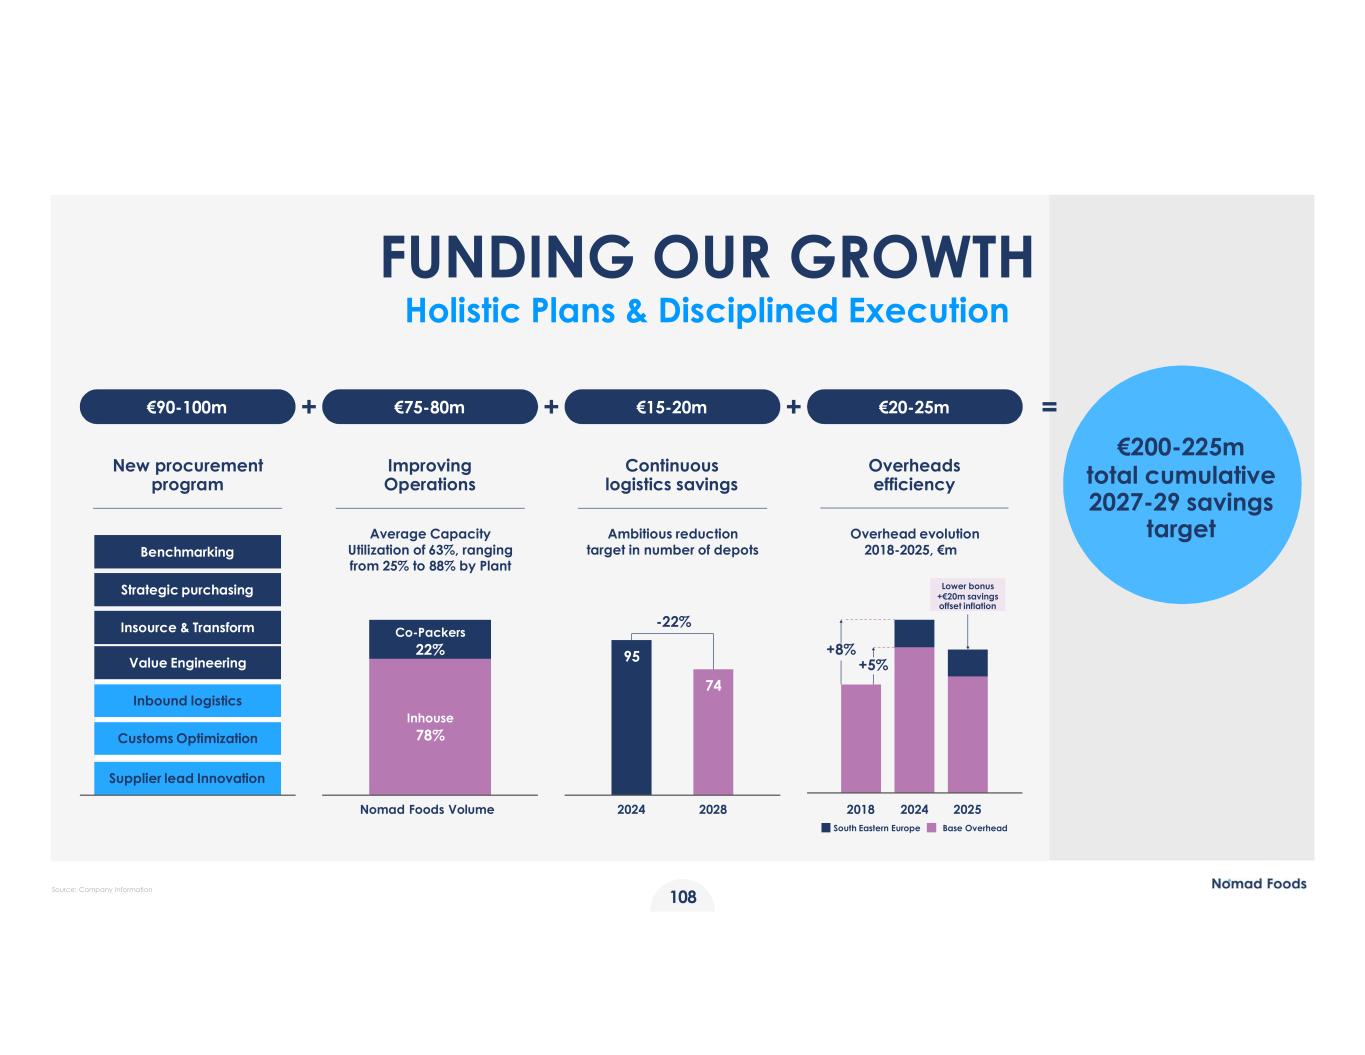
FUNDING OUR GROWTH Holistic Plans & Disciplined Execution €90-100m €75-80m €15-20m €20-25m 2024 95 2028 -22% +8% +5% Lower bonus +€20m savings offset inflation Improving Operations New procurement program Continuous logistics savings Ambitious reduction target in number of depots Average Capacity Utilization of 63%, ranging from 25% to 88% by Plant Overhead evolution 2018-2025, €m Overheads efficiency 74 Nomad Foods Volume Co-Packers 22% Inhouse 78% 2018 2024 2025 South Eastern Europe Base Overhead 108 Benchmarking Strategic purchasing Insource & Transform Value Engineering Inbound logistics Customs Optimization Supplier lead Innovation Source: Company Information €200-225m total cumulative 2027-29 savings target
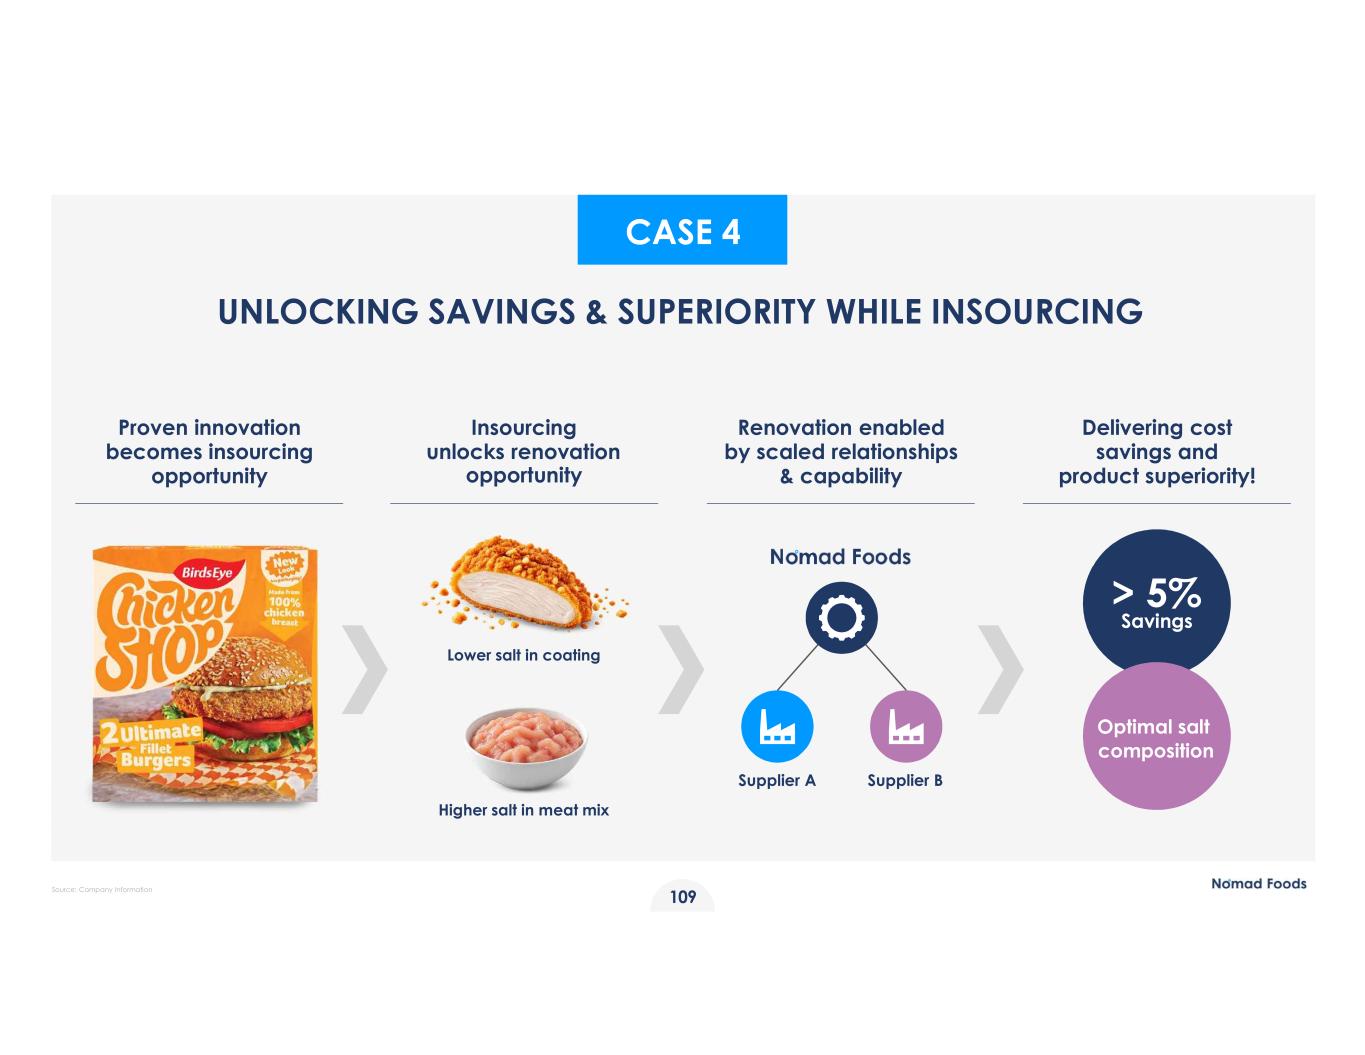
UNLOCKING SAVINGS & SUPERIORITY WHILE INSOURCING Renovation enabled by scaled relationships & capability Proven innovation becomes insourcing opportunity Insourcing unlocks renovation opportunity Delivering cost savings and product superiority! > 5% Savings Optimal salt composition Lower salt in coating Higher salt in meat mix Supplier BSupplier A CASE 4 109 Source: Company Information
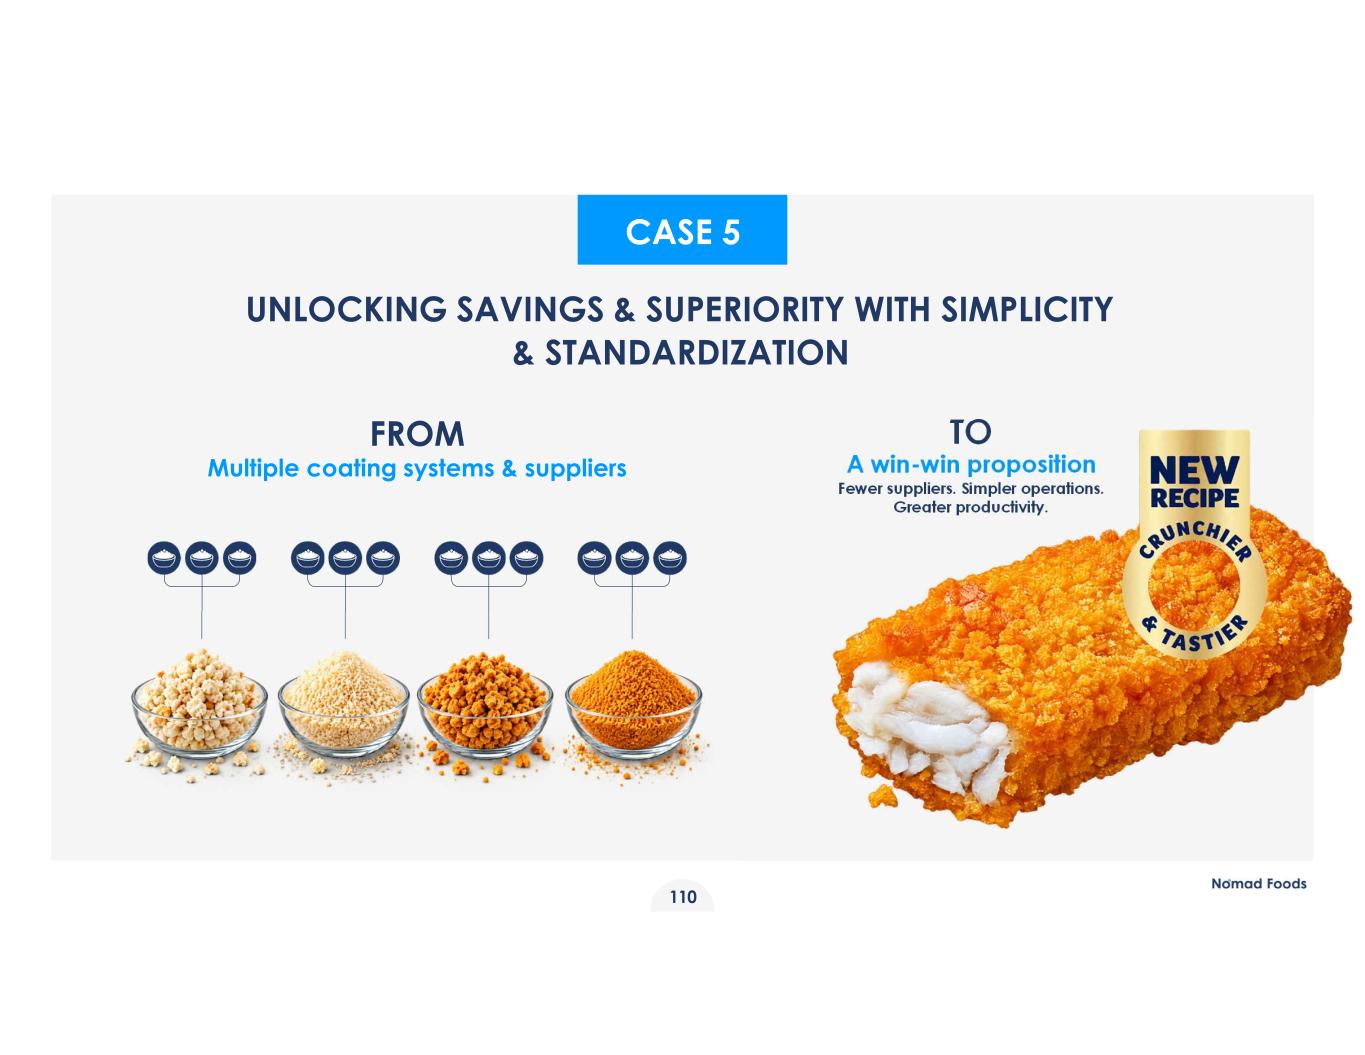
UNLOCKING SAVINGS & SUPERIORITY WITH SIMPLICITY & STANDARDIZATION TO A win-win proposition Fewer suppliers. Simpler operations. Greater productivity. CASE 5 110 FROM Multiple coating systems & suppliers
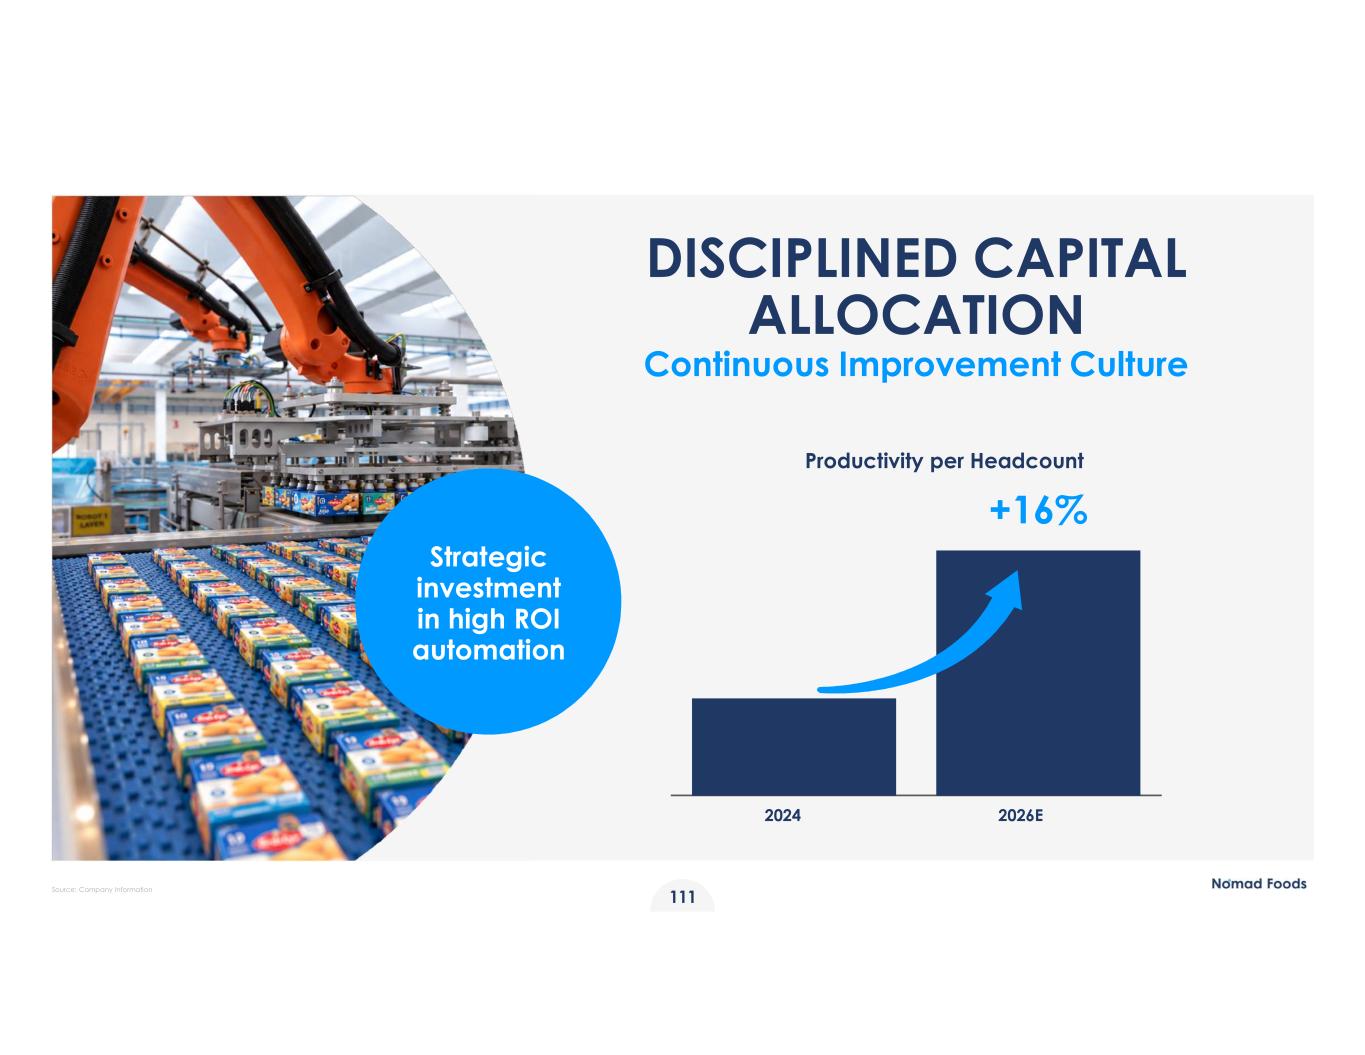
DISCIPLINED CAPITAL ALLOCATION Continuous Improvement Culture 2024 2026E Productivity per Headcount +16% Strategic investment in high ROI automation 111 Source: Company Information
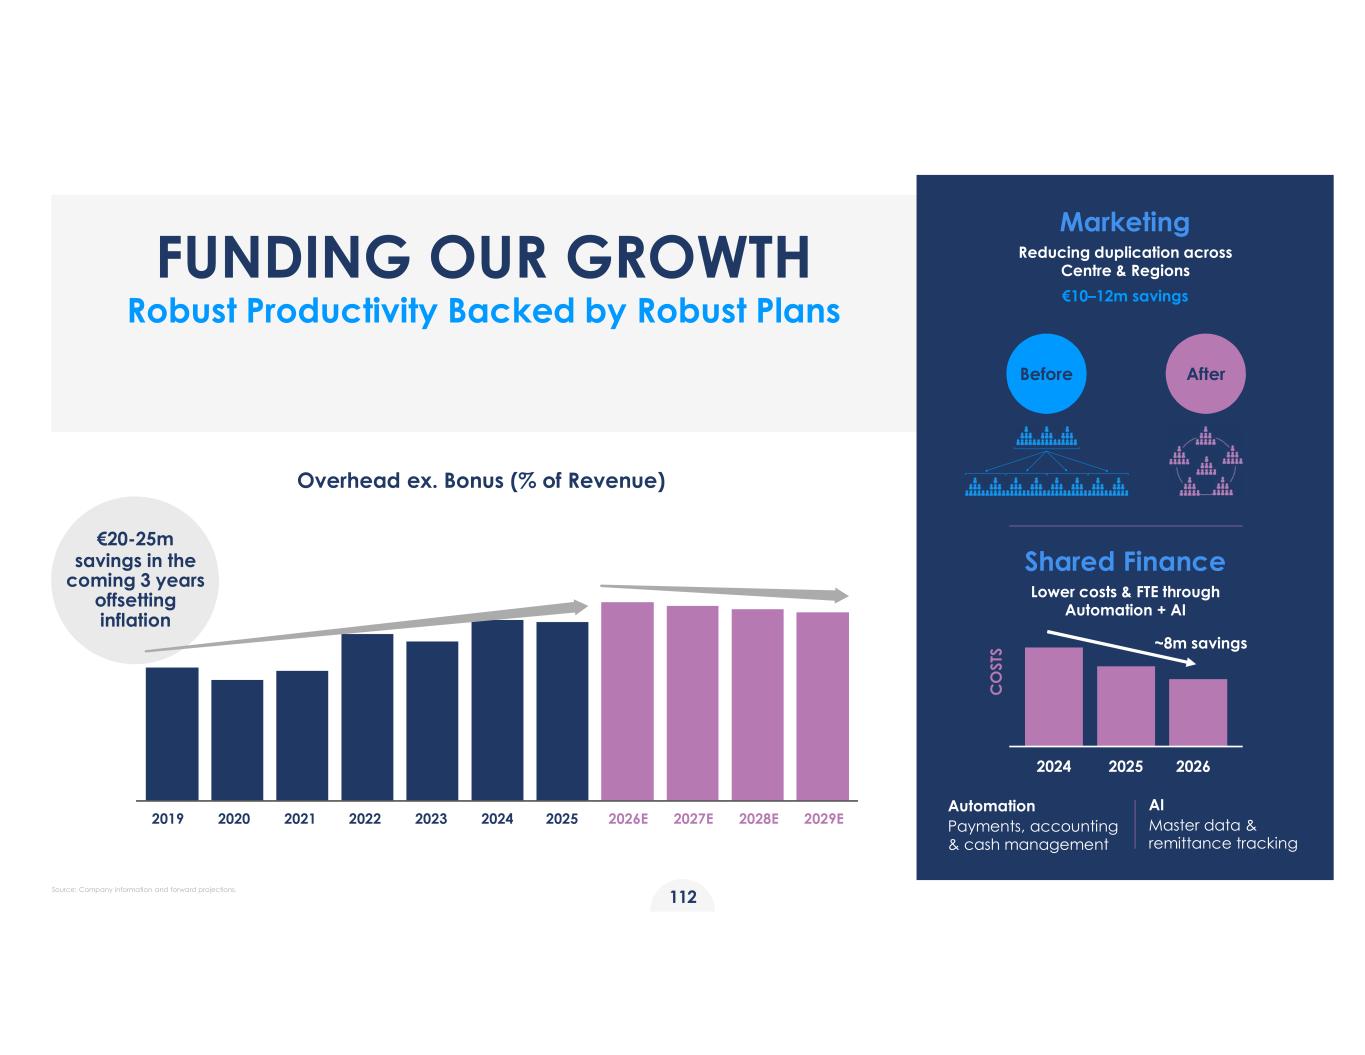
€20-25m savings in the coming 3 years offsetting inflation FUNDING OUR GROWTH Robust Productivity Backed by Robust Plans Overhead ex. Bonus (% of Revenue) 2019 2020 2021 2022 2023 2024 2025 2026E 2027E 2028E 2029E Before After Marketing Reducing duplication across Centre & Regions €10–12m savings Shared Finance Lower costs & FTE through Automation + AI C O ST S 2024 2025 2026 Automation Payments, accounting & cash management AI Master data & remittance tracking 112 Source: Company information and forward projections. ~8m savings
FINANCIAL OUTLOOK Ruben Baldew
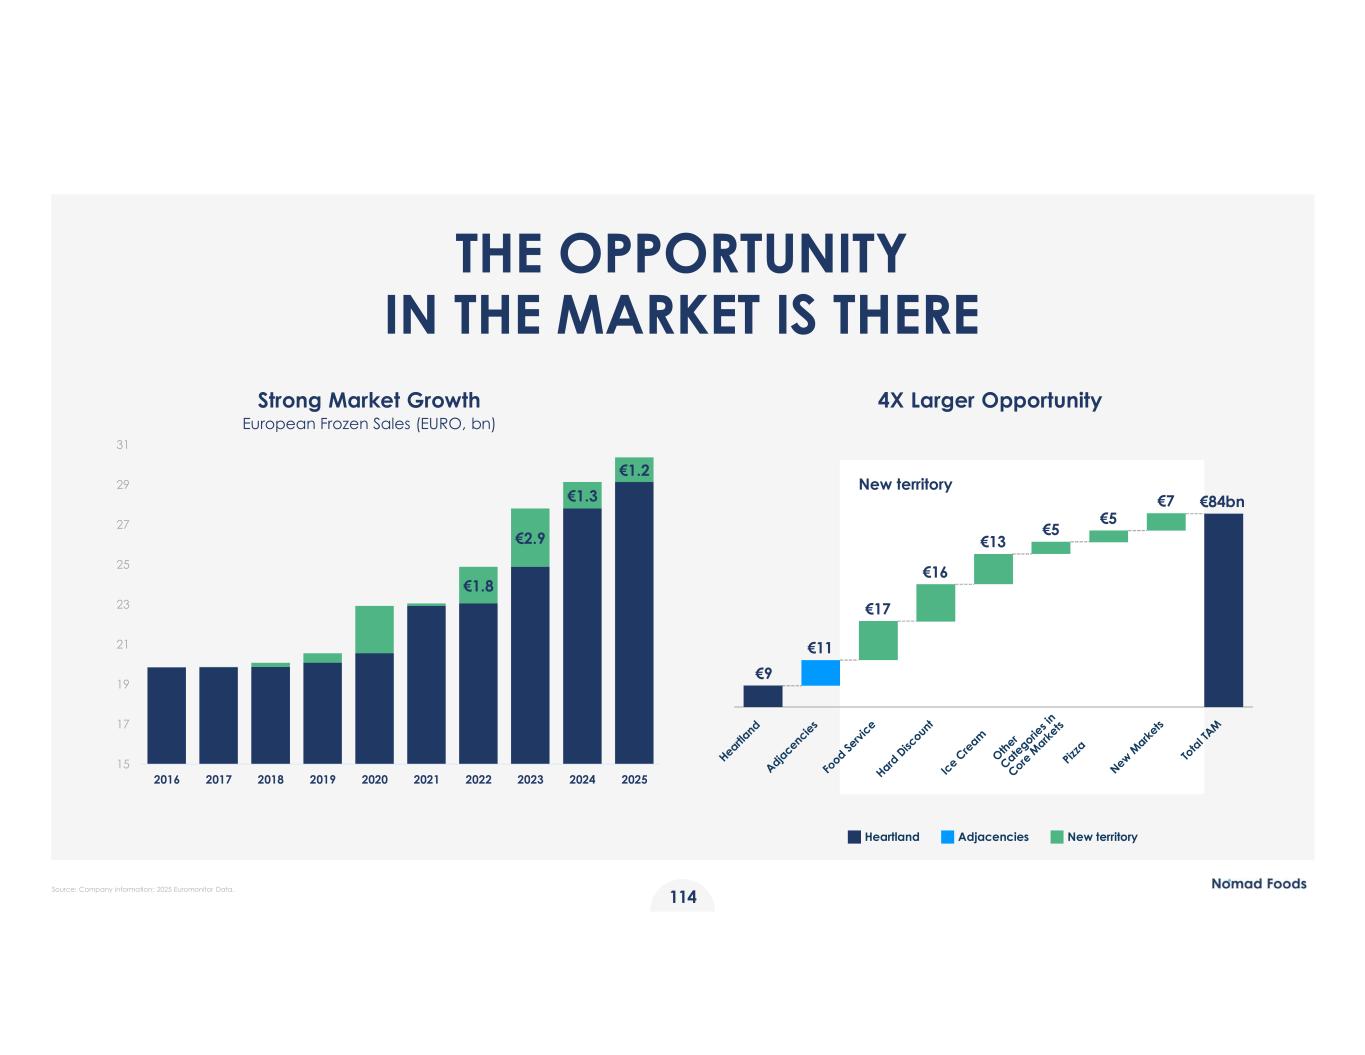
114 THE OPPORTUNITY IN THE MARKET IS THERE Heartland Adjacencies New territory €17 €16 €13 €9 €11 New territory €5 €5 €7 €84bn Strong Market Growth European Frozen Sales (EURO, bn) 4X Larger Opportunity €1.8 €2.9 €1.3 €1.2 15 17 19 21 23 25 27 29 31 2016 2017 2018 2019 2020 2021 2022 2023 2024 2025 Source: Company information; 2025 Euromonitor Data.
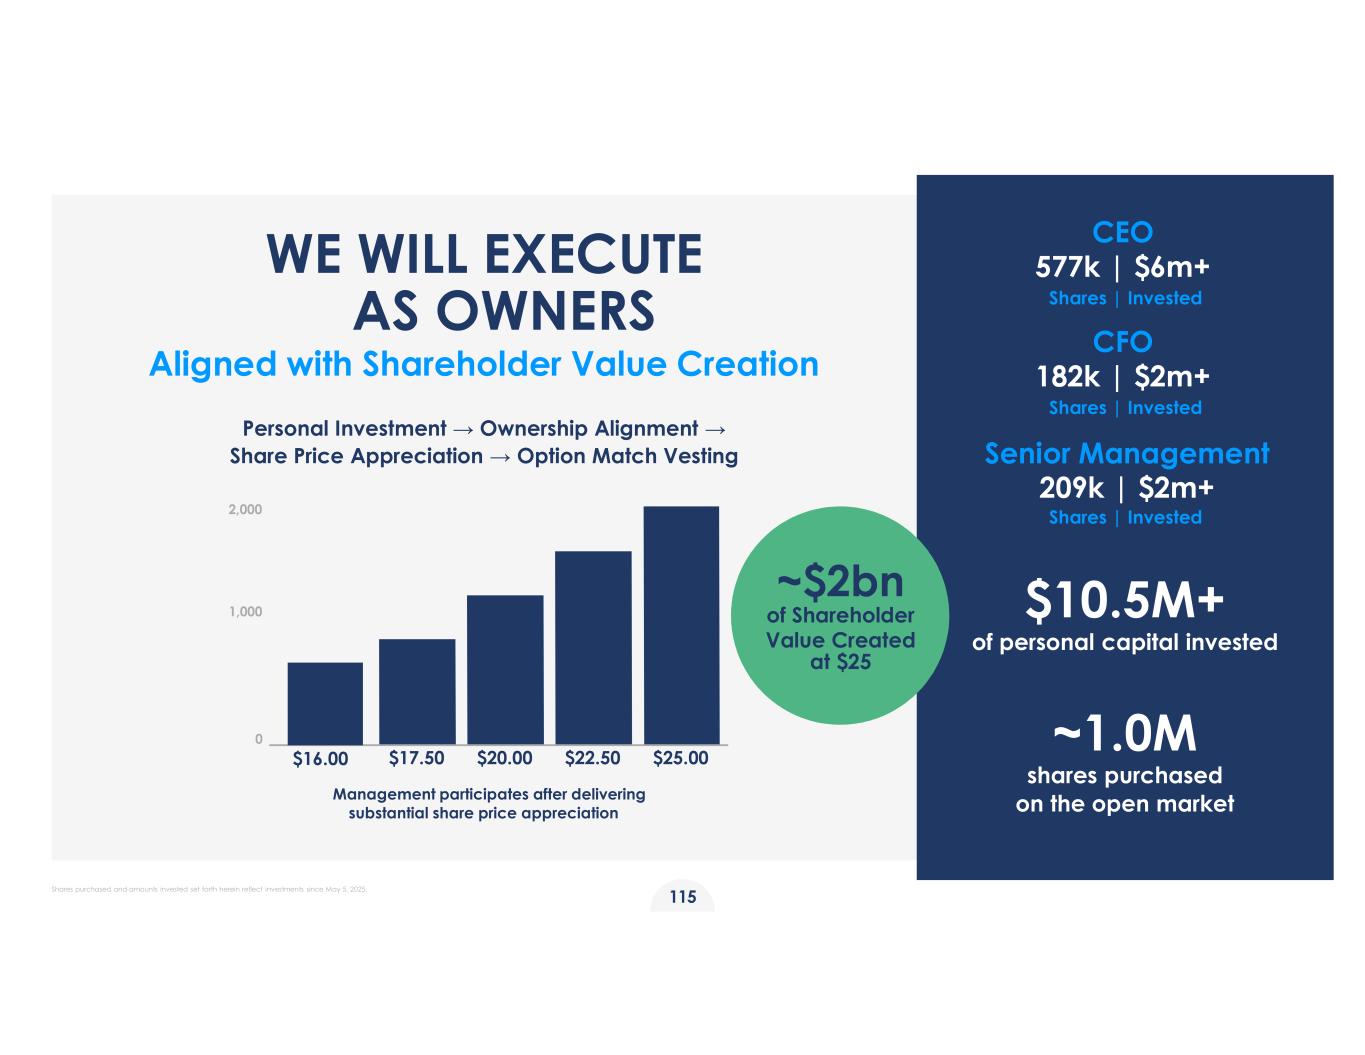
WE WILL EXECUTE AS OWNERS Aligned with Shareholder Value Creation Personal Investment → Ownership Alignment → Share Price Appreciation → Option Match Vesting ~$2bn of Shareholder Value Created at $25 CEO 577k | $6m+ Shares | Invested CFO 182k | $2m+ Shares | Invested Senior Management 209k | $2m+ Shares | Invested $10.5M+ of personal capital invested ~1.0M shares purchased on the open marketManagement participates after delivering substantial share price appreciation 2,000 1,000 0 $20.00 $22.50 $25.00$17.50$16.00 115 Shares purchased and amounts invested set forth herein reflect investments since May 5, 2025.
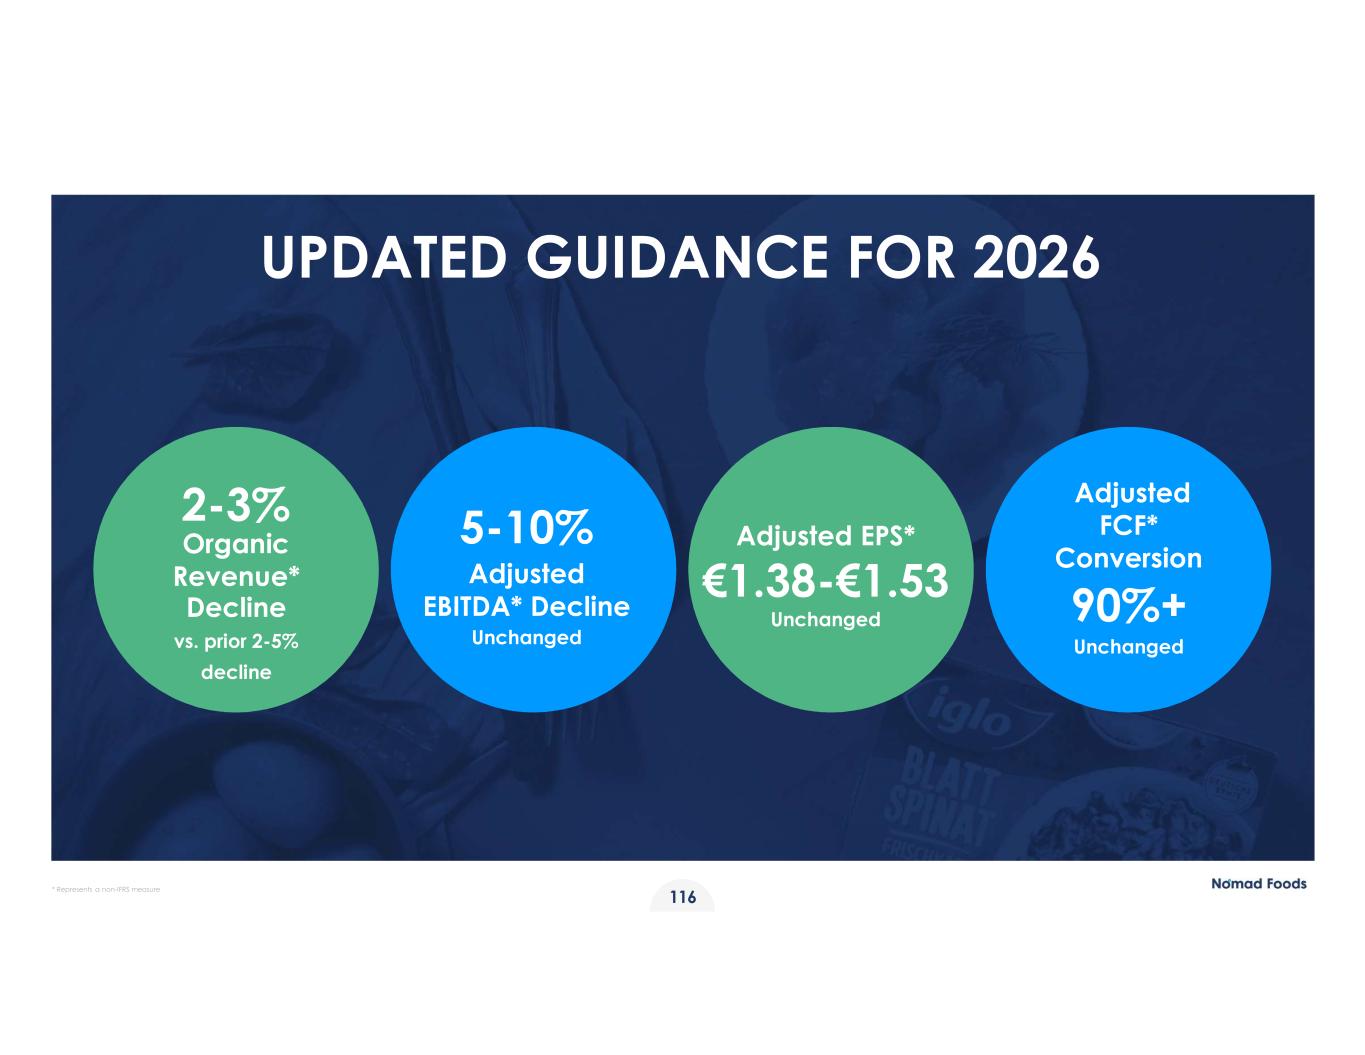
116 UPDATED GUIDANCE FOR 2026 * Represents a non-IFRS measure 5-10% Adjusted EBITDA* Decline Unchanged 2-3% Organic Revenue* Decline vs. prior 2-5% decline Adjusted EPS* €1.38-€1.53 Unchanged Adjusted FCF* Conversion 90%+ Unchanged
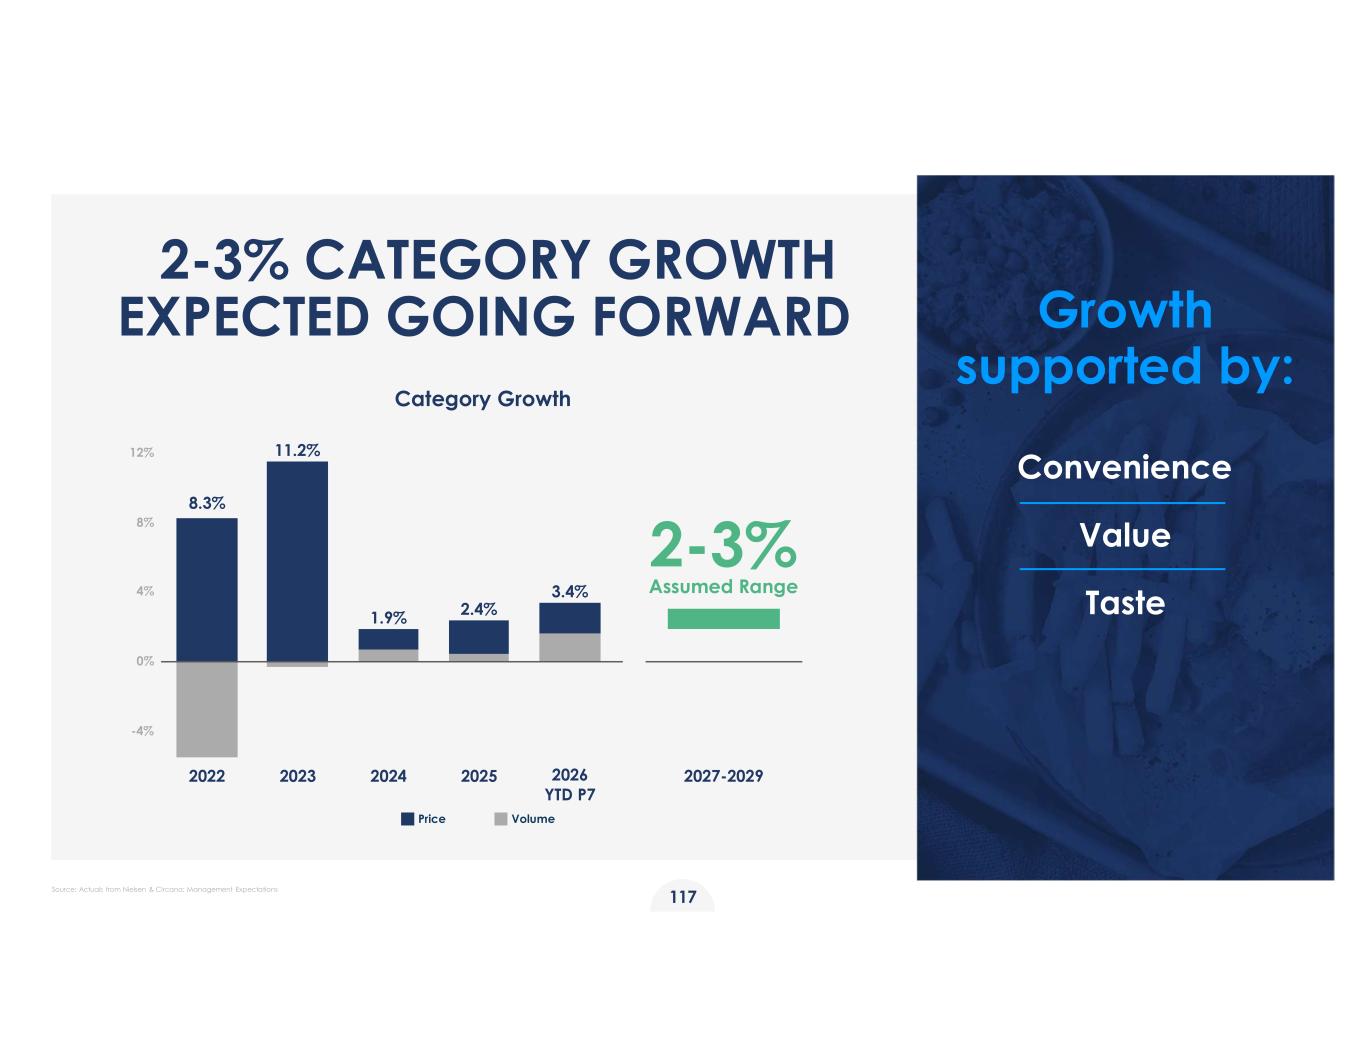
2-3% CATEGORY GROWTH EXPECTED GOING FORWARD 11.2% 8.3% 1.9% 2.4% 3.4% -4% 0% 4% 8% 12% 2022 2023 2024 2025 2026 YTD P7 2027-2029 2-3% Assumed Range Category Growth Growth supported by: Convenience Value Taste 117 Source: Actuals from Nielsen & Circana; Management Expectations Price Volume
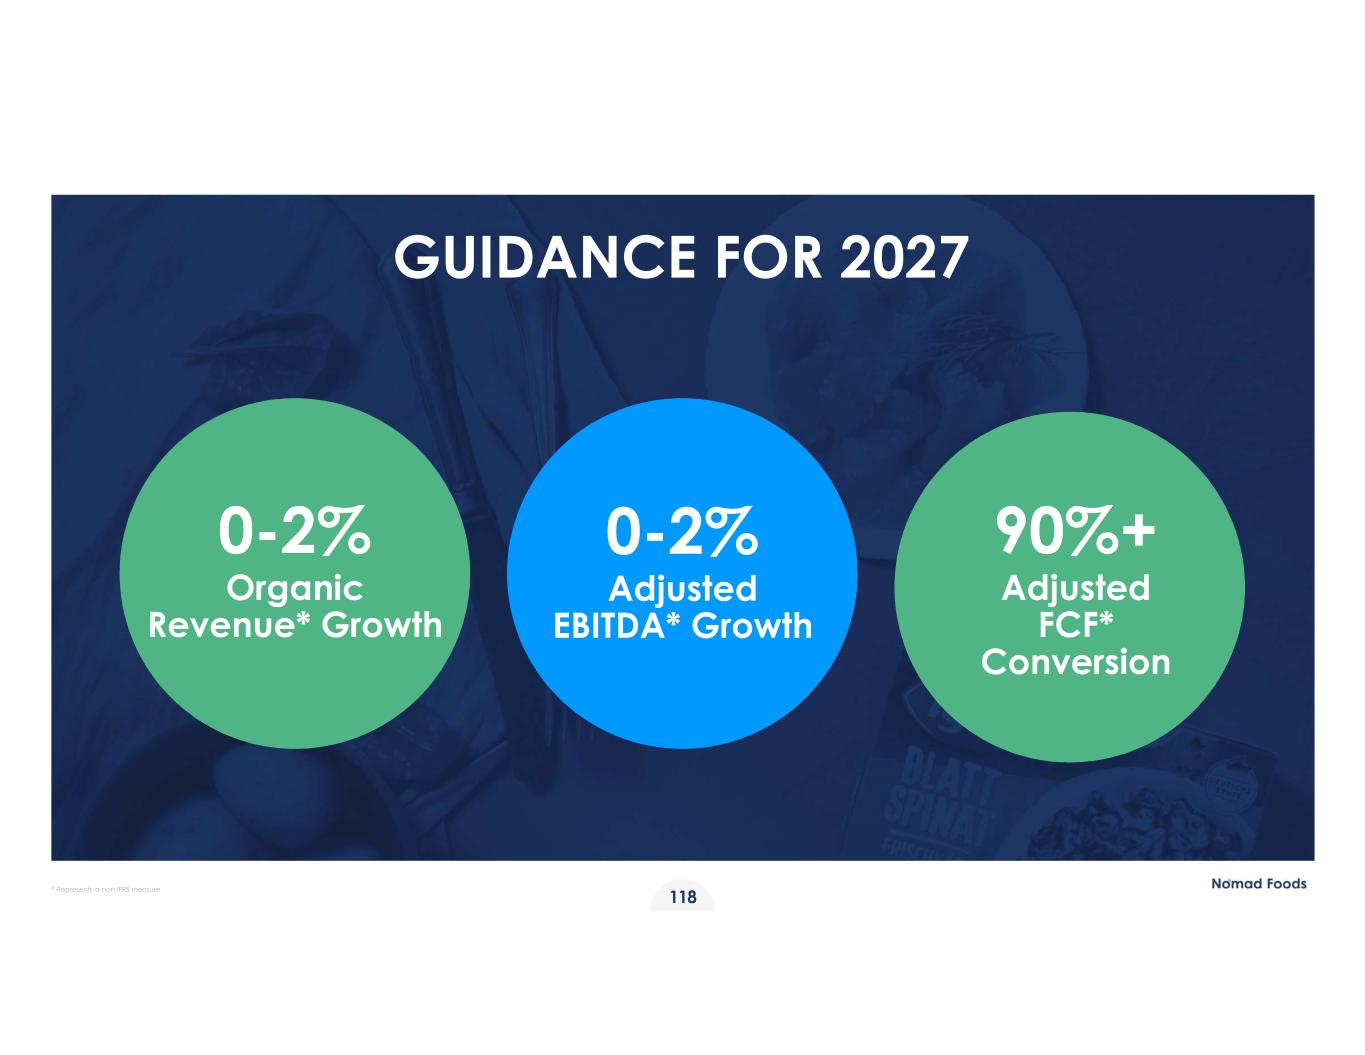
0-2% Adjusted EBITDA* Growth 0-2% Organic Revenue* Growth 90%+ Adjusted FCF* Conversion GUIDANCE FOR 2027 * Represents a non-IFRS measure 118
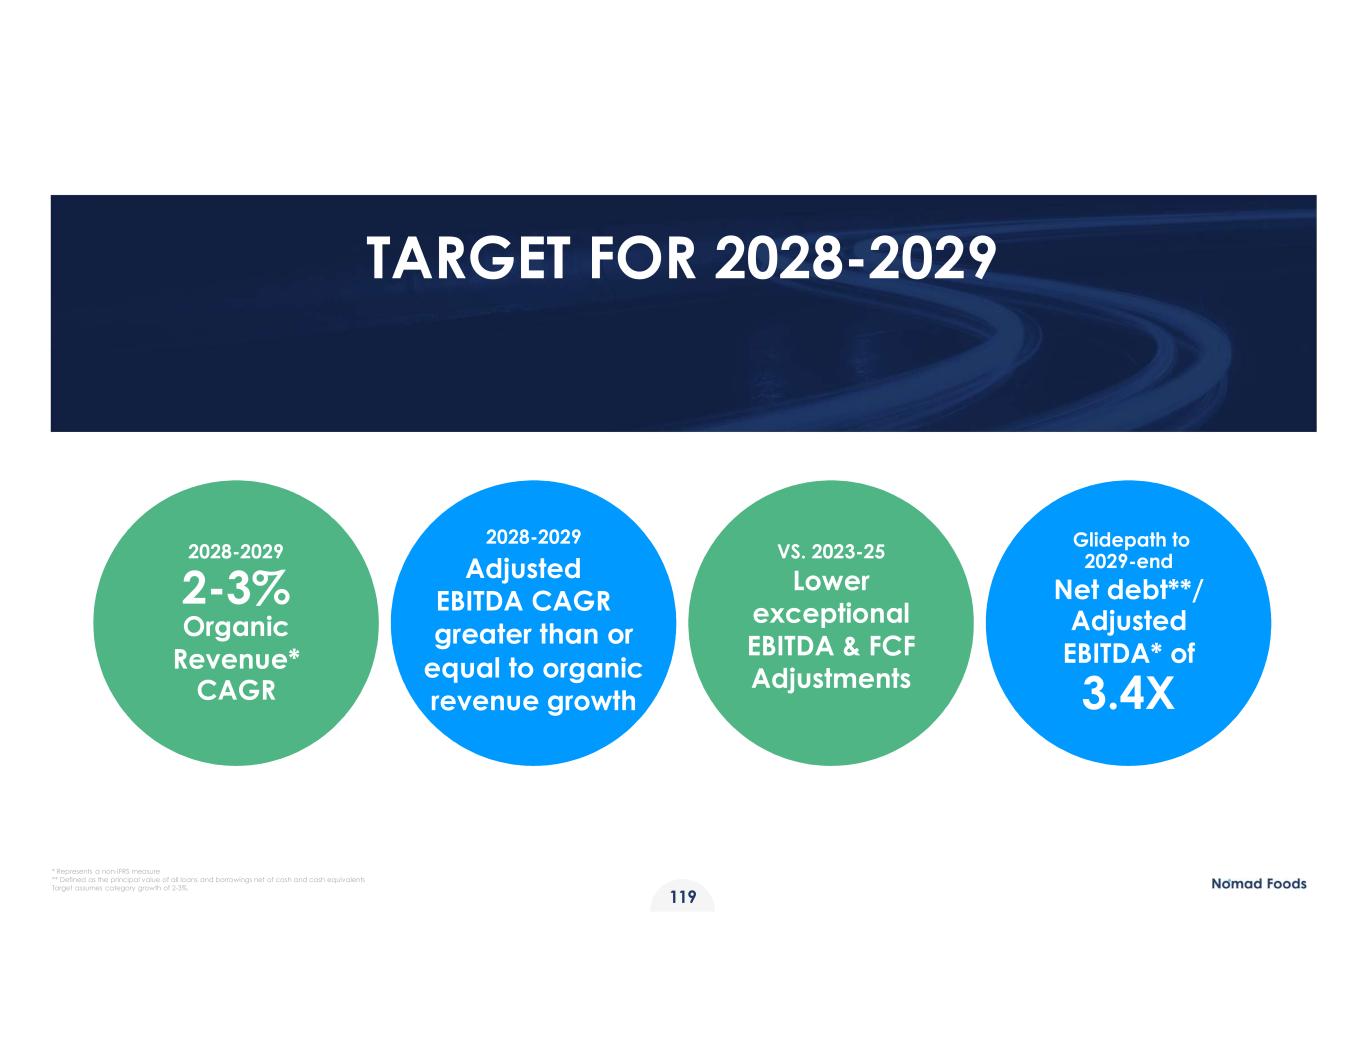
119 TARGET FOR 2028-2029 2028-2029 Adjusted EBITDA CAGR greater than or equal to organic revenue growth 2028-2029 2-3% Organic Revenue* CAGR VS. 2023-25 Lower exceptional EBITDA & FCF Adjustments Glidepath to 2029-end Net debt**/ Adjusted EBITDA* of 3.4X * Represents a non-IFRS measure ** Defined as the principal value of all loans and borrowings net of cash and cash equivalents Target assumes category growth of 2-3%.
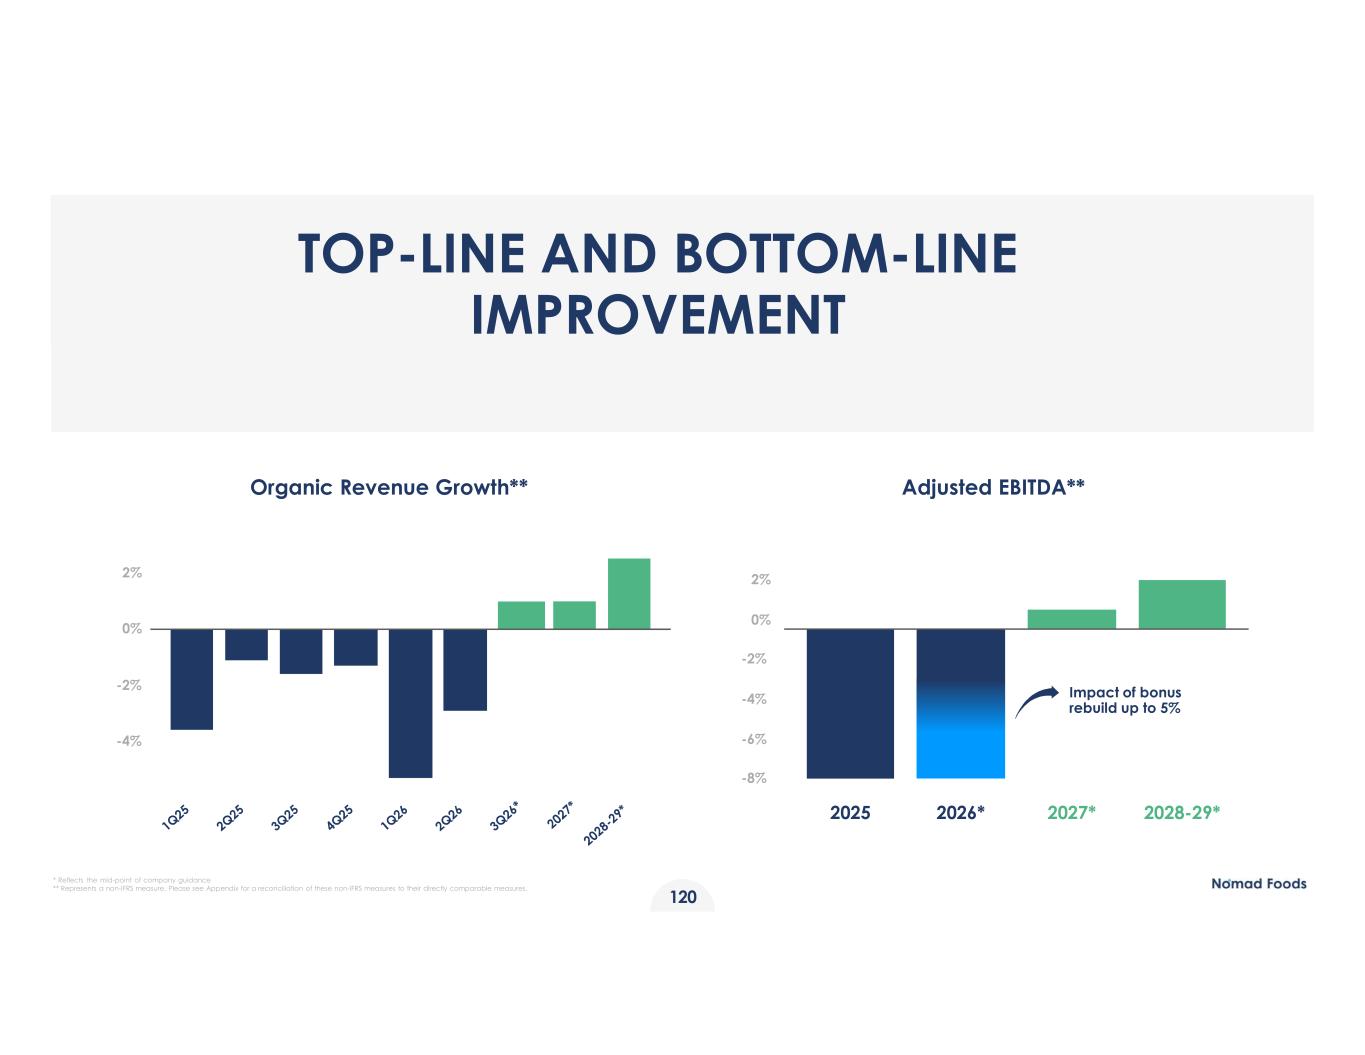
TOP-LINE AND BOTTOM-LINE IMPROVEMENT Organic Revenue Growth** -4% -2% 0% 2% Adjusted EBITDA** -8% -6% -4% -2% 0% 2% 2025 2026* 2027* 2028-29* Impact of bonus rebuild up to 5% 120 * Reflects the mid-point of company guidance ** Represents a non-IFRS measure. Please see Appendix for a reconciliation of these non-IFRS measures to their directly comparable measures.
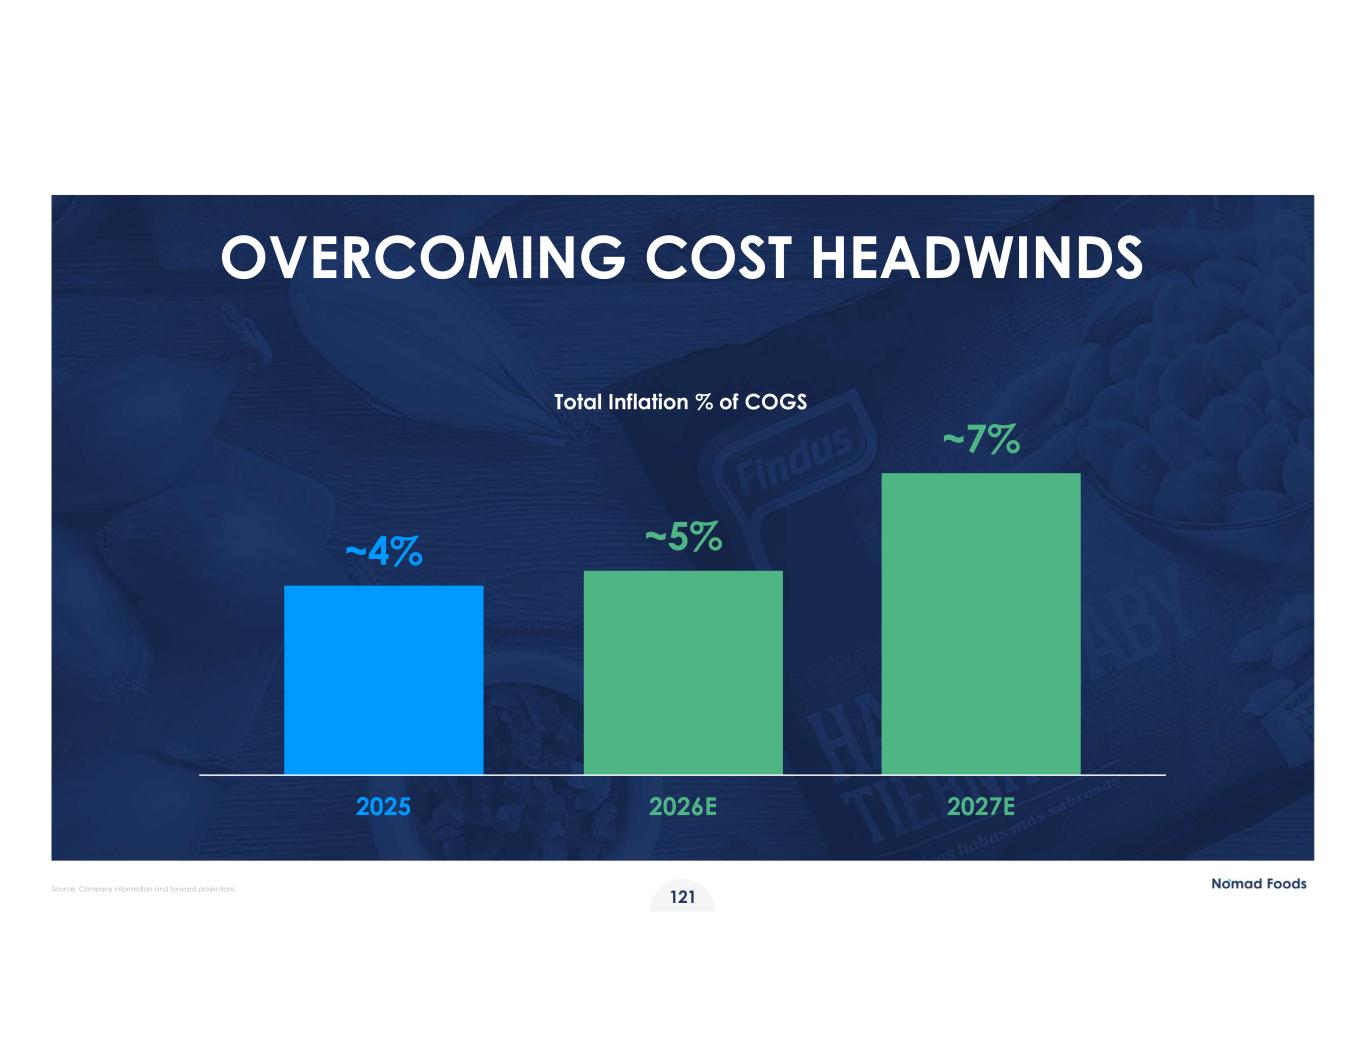
OVERCOMING COST HEADWINDS Total Inflation % of COGS 2025 2026E 2027E ~4% ~5% ~7% 121 Source: Company information and forward projections.
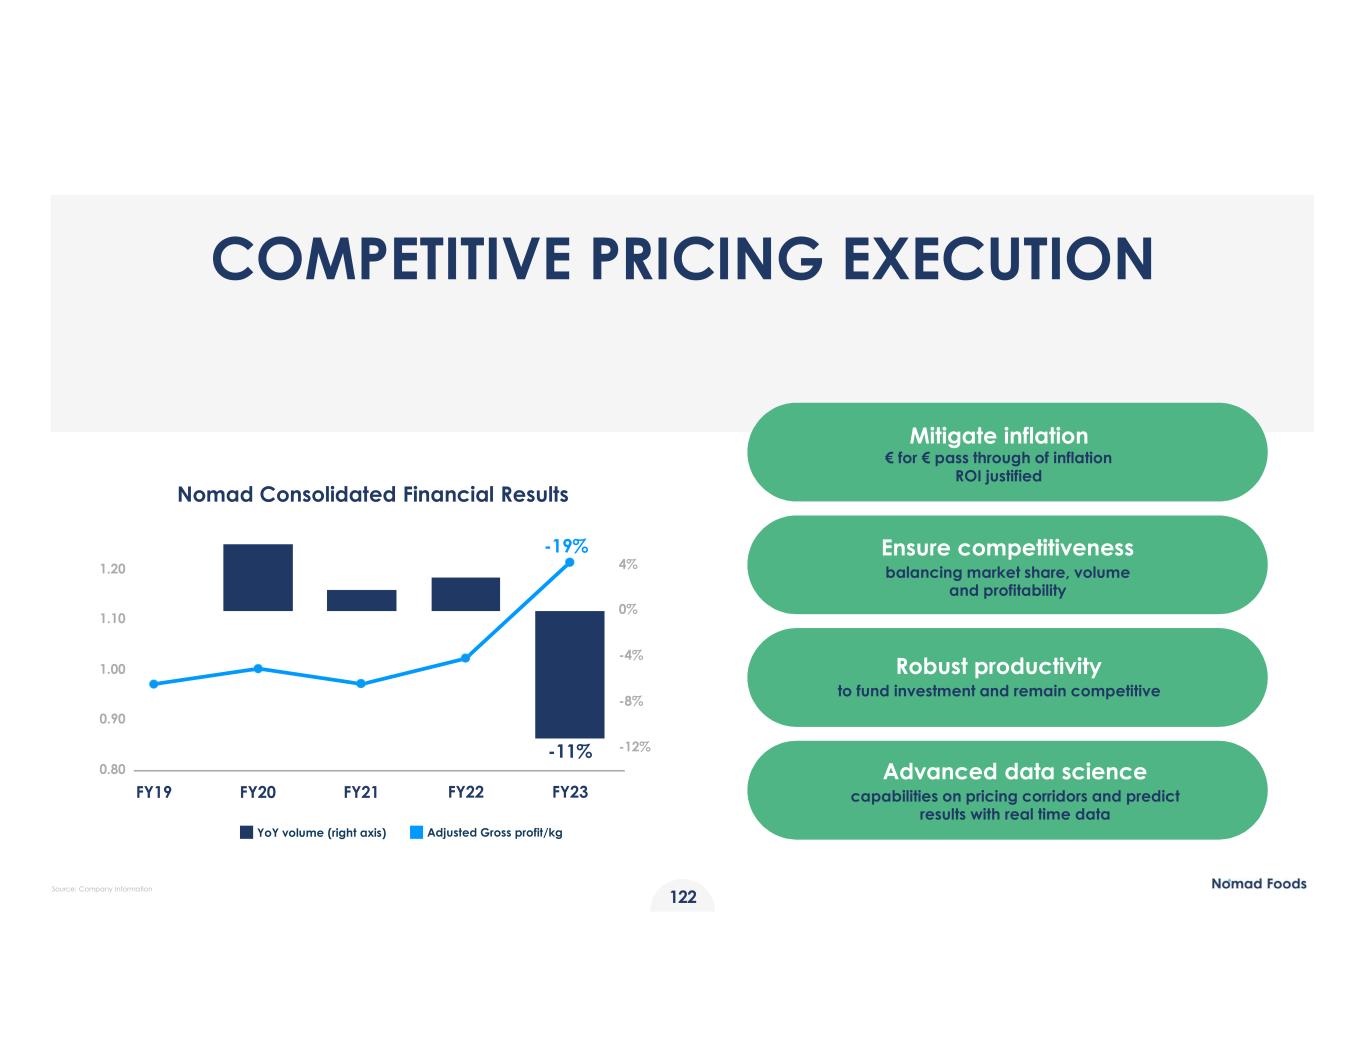
COMPETITIVE PRICING EXECUTION Ensure competitiveness balancing market share, volume and profitability Advanced data science capabilities on pricing corridors and predict results with real time data Robust productivity to fund investment and remain competitive -12% -8% -4% 0% 4% 0.80 0.90 1.00 1.10 1.20 FY19 FY20 FY21 YoY volume (right axis) -11% FY22 FY23 Adjusted Gross profit/kg Nomad Consolidated Financial Results -19% Mitigate inflation € for € pass through of inflation ROI justified 122 Source: Company Information
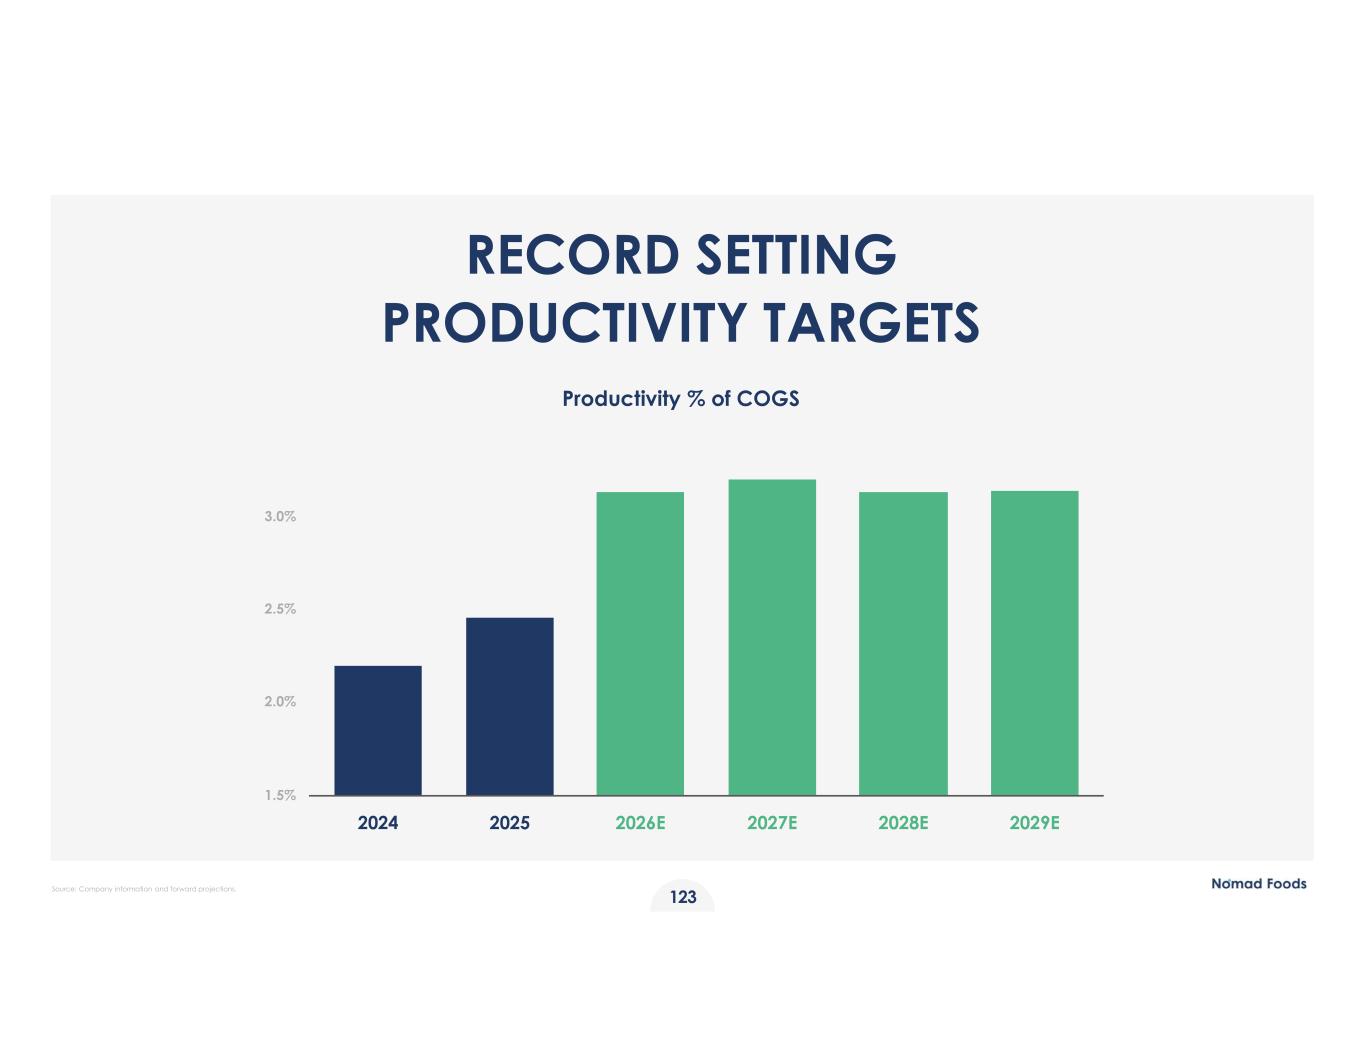
RECORD SETTING PRODUCTIVITY TARGETS Productivity % of COGS 1.5% 2.0% 2.5% 3.0% 2024 2025 2026E 2027E 2028E 2029E 123 Source: Company information and forward projections.
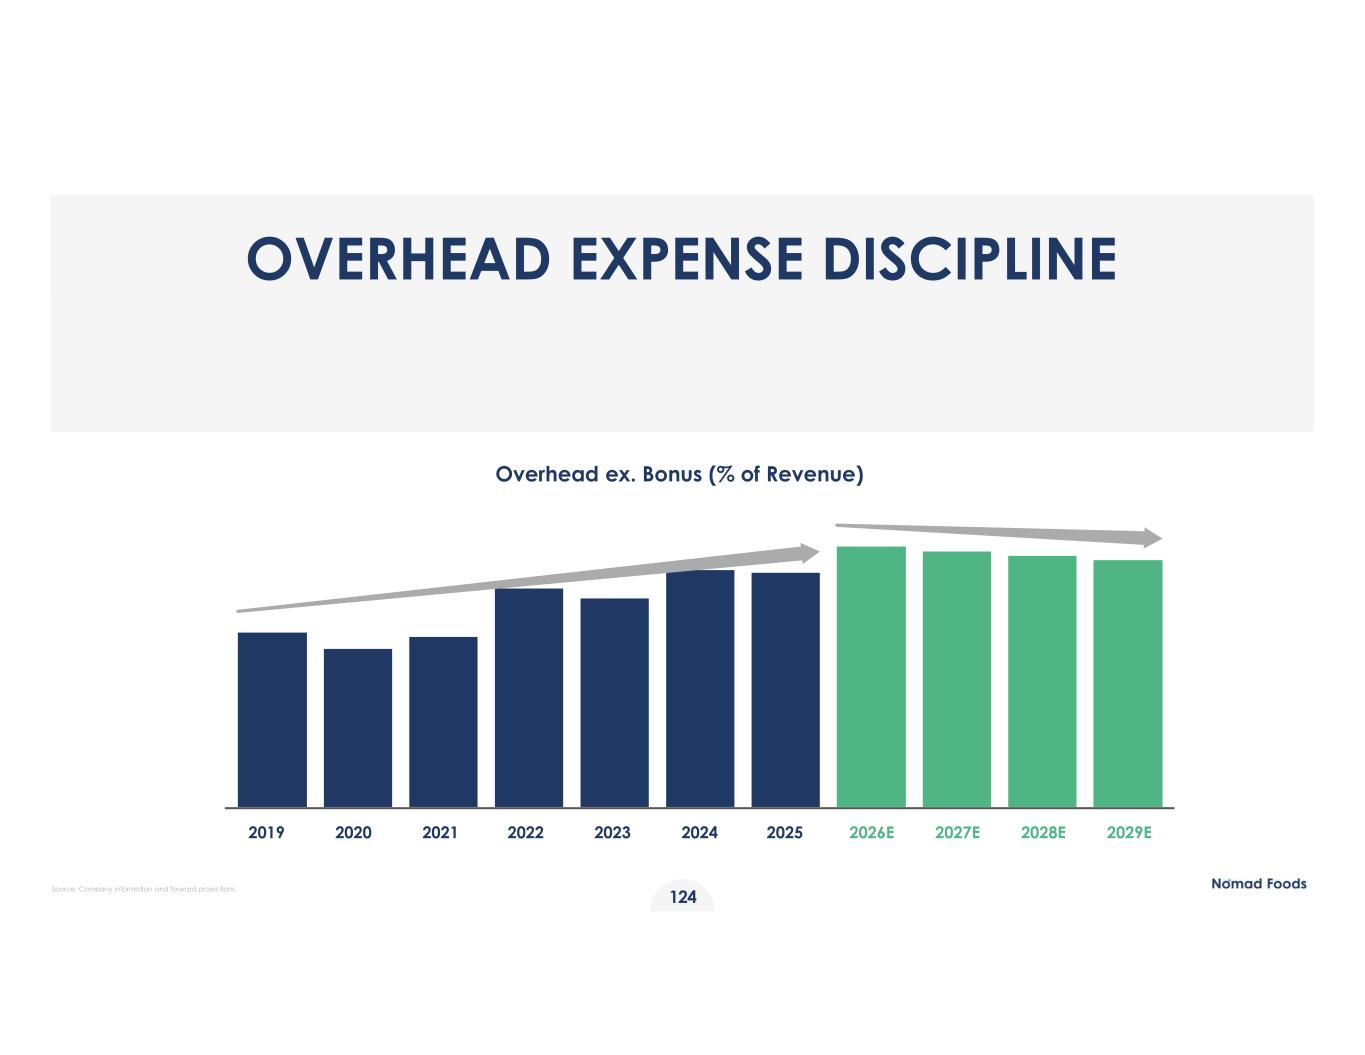
OVERHEAD EXPENSE DISCIPLINE Overhead ex. Bonus (% of Revenue) 2019 2020 2021 2022 2023 2024 2025 2026E 2027E 2028E 2029E 124 Source: Company information and forward projections.
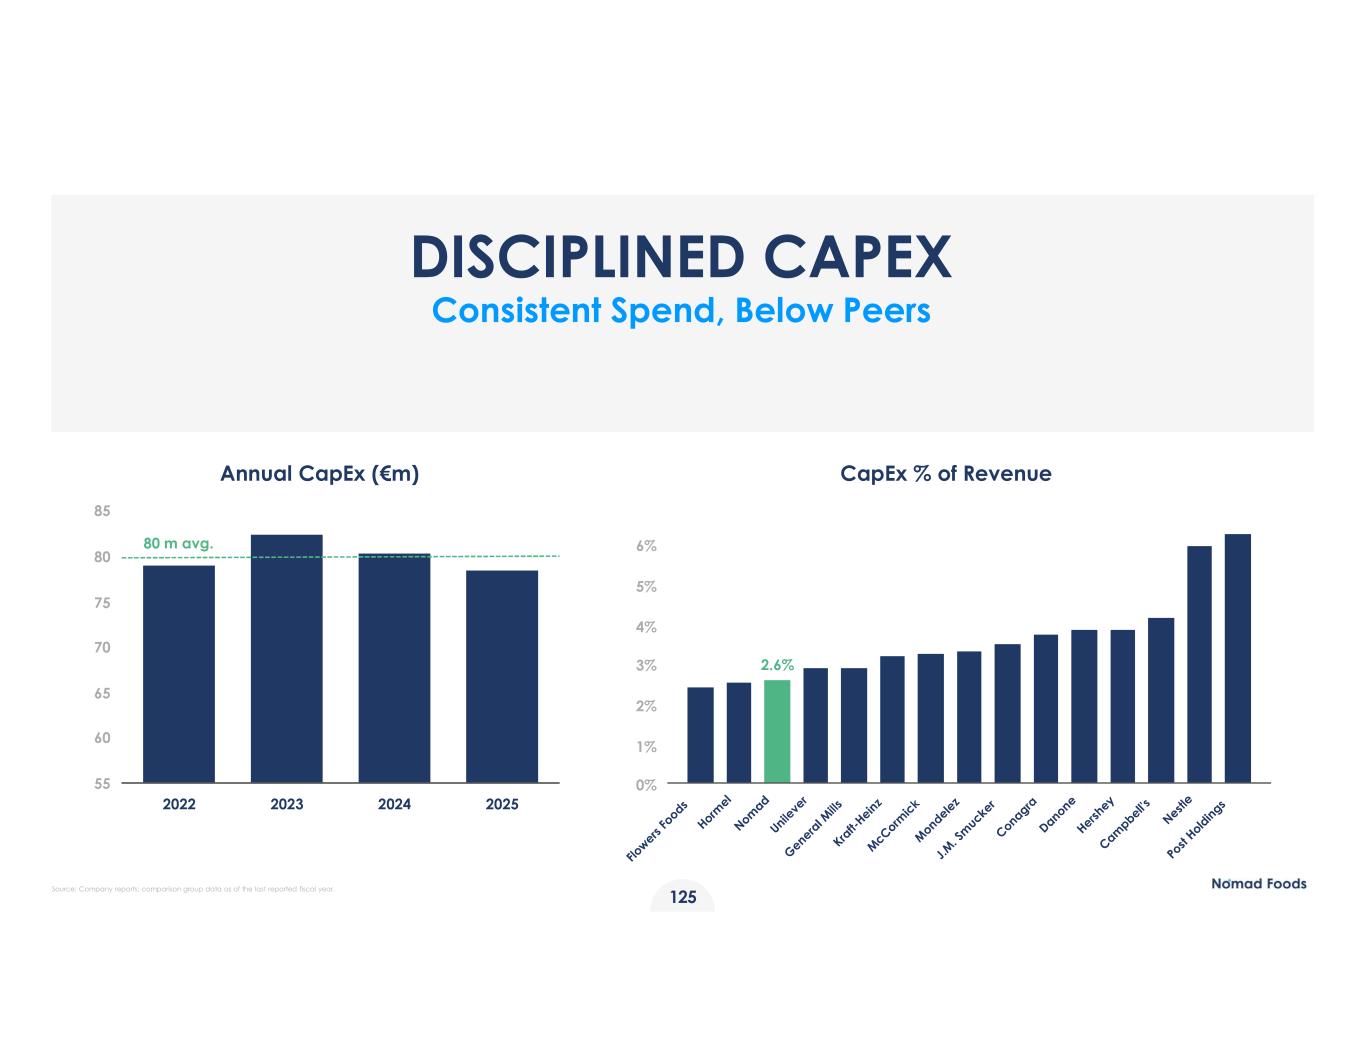
DISCIPLINED CAPEX Consistent Spend, Below Peers Annual CapEx (€m) CapEx % of Revenue 55 60 65 70 75 80 85 2022 2023 2024 2025 80 m avg. 2.6% 0% 1% 2% 3% 4% 5% 6% Source: Company reports; comparison group data as of the last reported fiscal year. 125
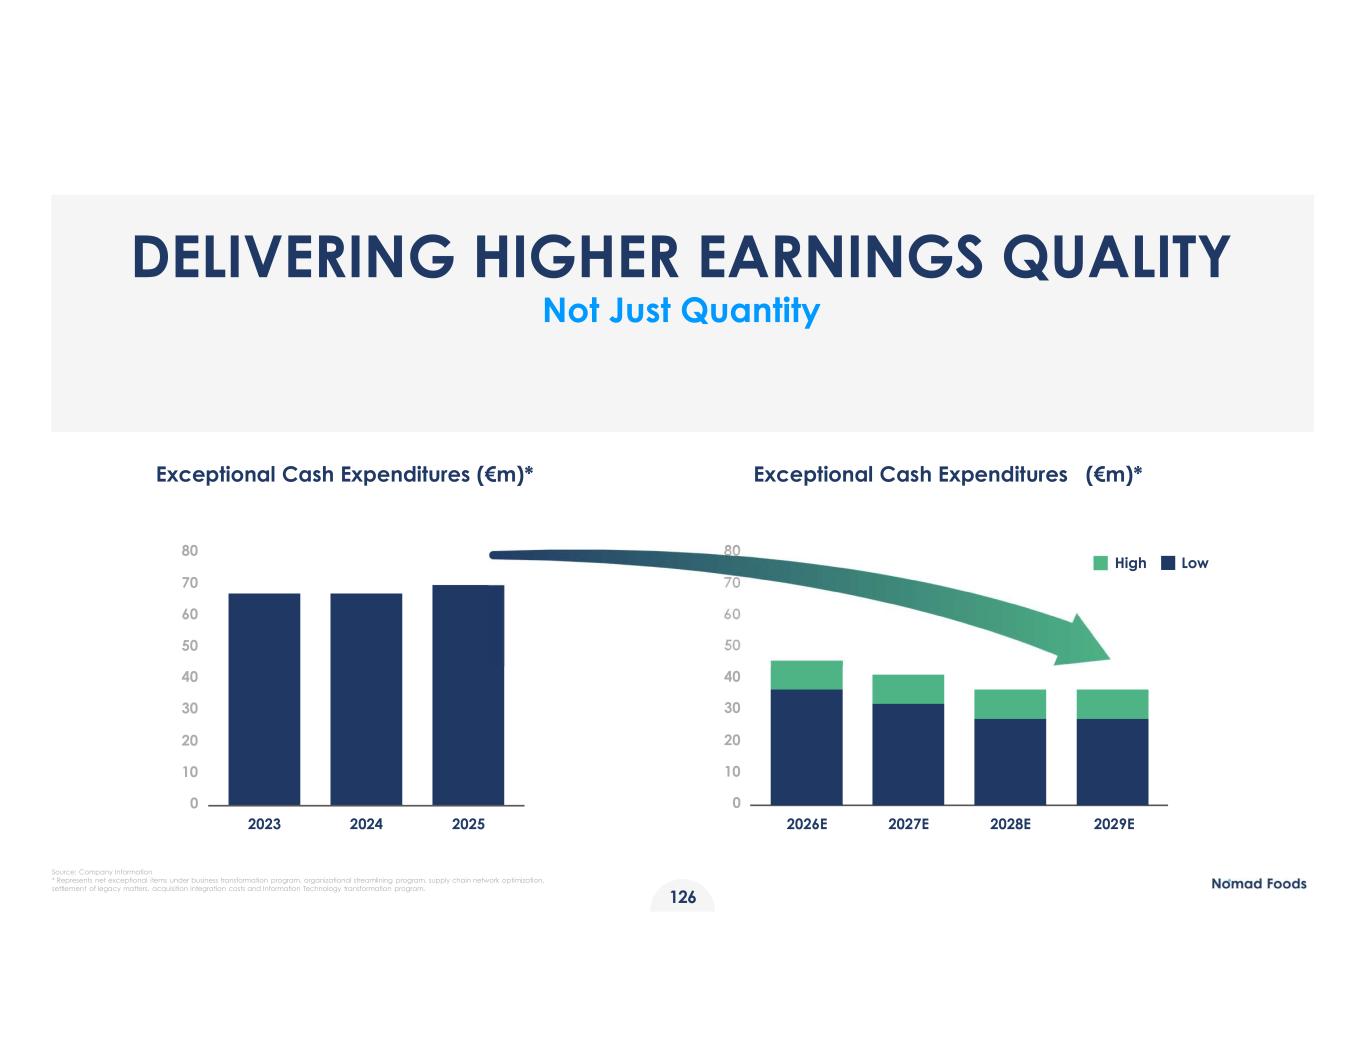
Source: Company Information * Represents net exceptional items under business transformation program, organizational streamlining program, supply chain network optimization, settlement of legacy matters, acquisition integration costs and Information Technology transformation program. DELIVERING HIGHER EARNINGS QUALITY Not Just Quantity 80 70 60 50 40 30 20 10 0 2023 2024 2025 Exceptional Cash Expenditures (€m)* Exceptional Cash Expenditures (€m)* 40 30 20 10 0 80 70 60 50 2026E 2027E 2028E 2029E High Low 126
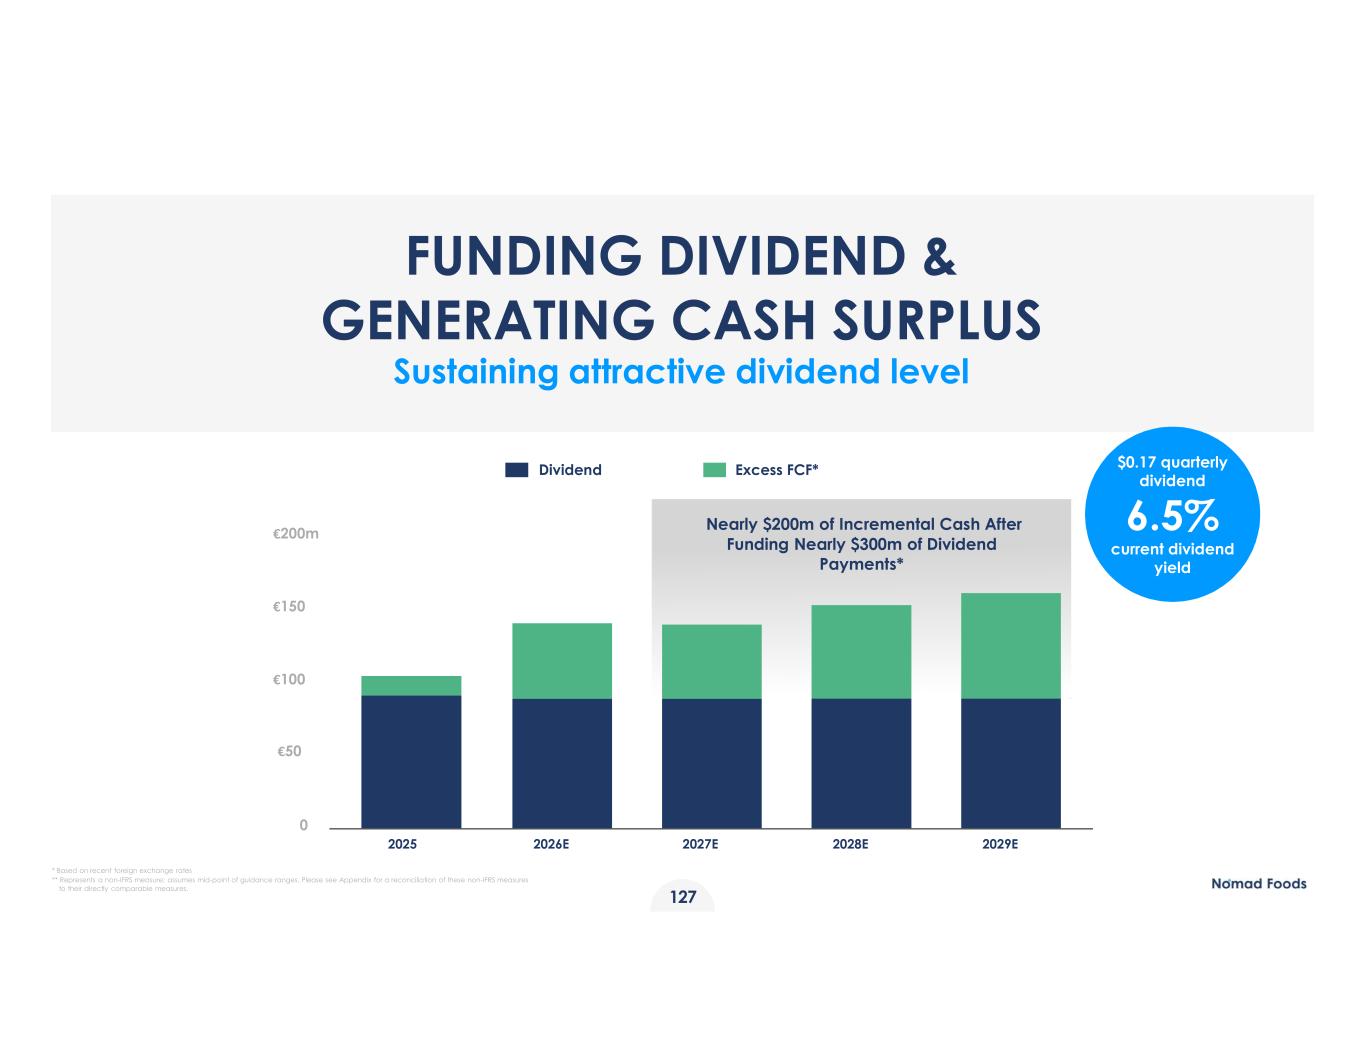
SMALLEST TITLE 127 FUNDING DIVIDEND & GENERATING CASH SURPLUS Sustaining attractive dividend level Dividend Excess FCF* €50 0 €100 €150 €200m 2025 2026E 2027E 2028E 2029E Nearly $200m of Incremental Cash After Funding Nearly $300m of Dividend Payments* $0.17 quarterly dividend 6.5% current dividend yield * Based on recent foreign exchange rates ** Represents a non-IFRS measure; assumes mid-point of guidance ranges. Please see Appendix for a reconciliation of these non-IFRS measures to their directly comparable measures.
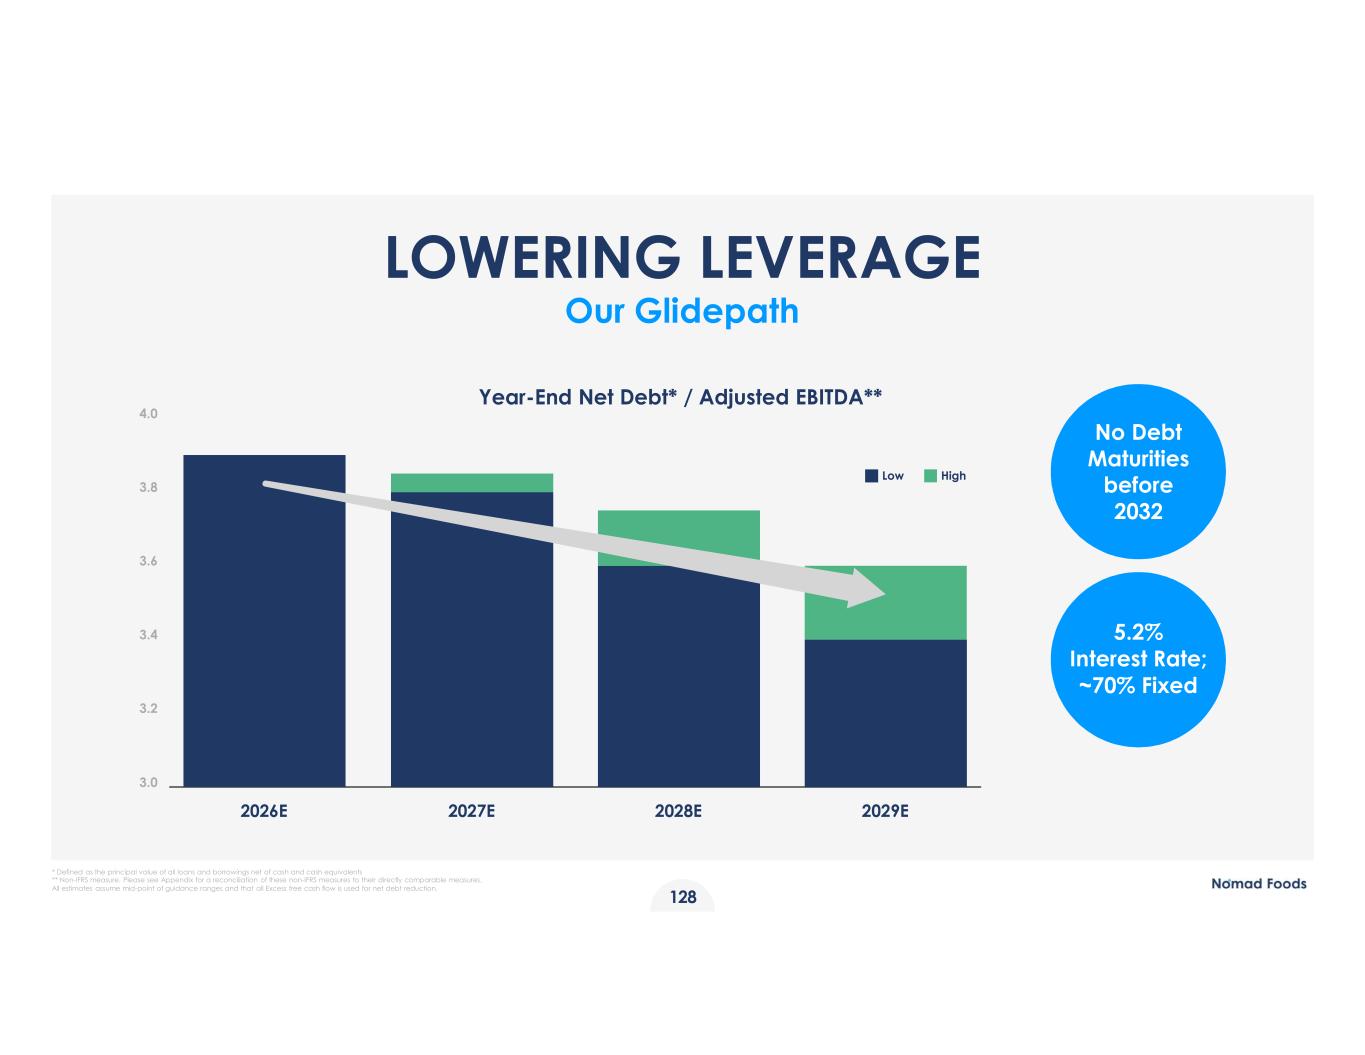
* Defined as the principal value of all loans and borrowings net of cash and cash equivalents ** Non-IFRS measure. Please see Appendix for a reconciliation of these non-IFRS measures to their directly comparable measures. All estimates assume mid-point of guidance ranges and that all Excess free cash flow is used for net debt reduction. LOWERING LEVERAGE Our Glidepath Year-End Net Debt* / Adjusted EBITDA** No Debt Maturities before 2032 5.2% Interest Rate; ~70% Fixed 3.0 3.2 3.4 3.6 3.8 4.0 2026E 2027E 2028E 2029E Low High 128
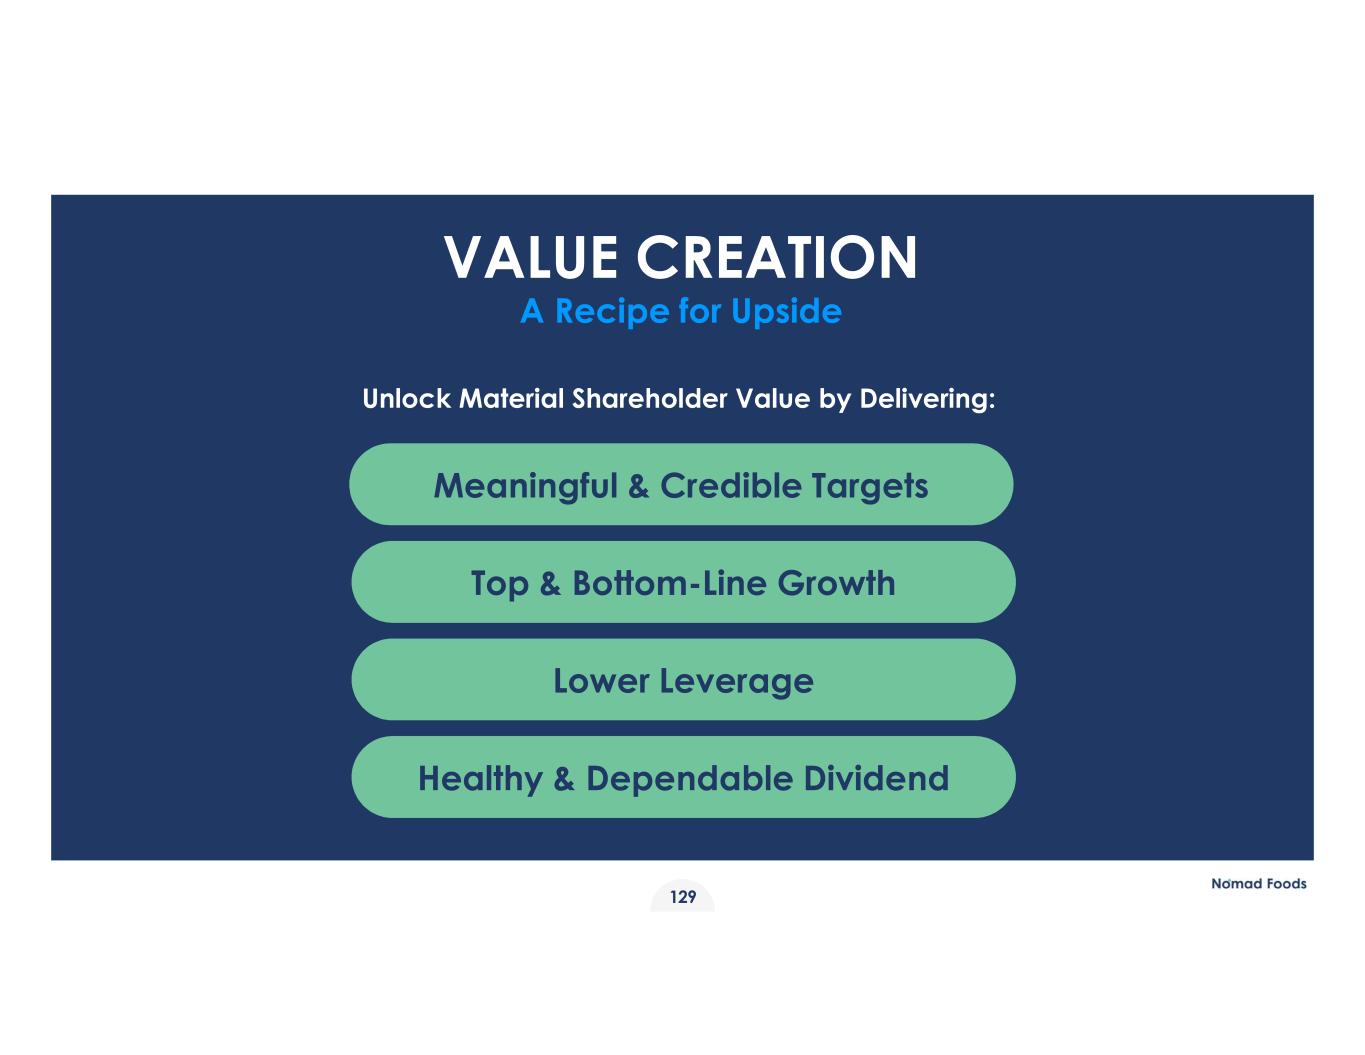
VALUE CREATION A Recipe for Upside Unlock Material Shareholder Value by Delivering: Meaningful & Credible Targets Top & Bottom-Line Growth Lower Leverage Healthy & Dependable Dividend 129
130 CLOSING REMARKS Dominic Brisby

Q&A
Appendix
133 The following tables have been included to allow users to reconcile Non-IFRS financial measures as well as Adjusted financial information included within this presentation to reported IFRS financial measures. 1. Definitions of Non-IFRS financial measures referred to in this presentation. 2. Reconciliation of Non-IFRS financial measures. Contents
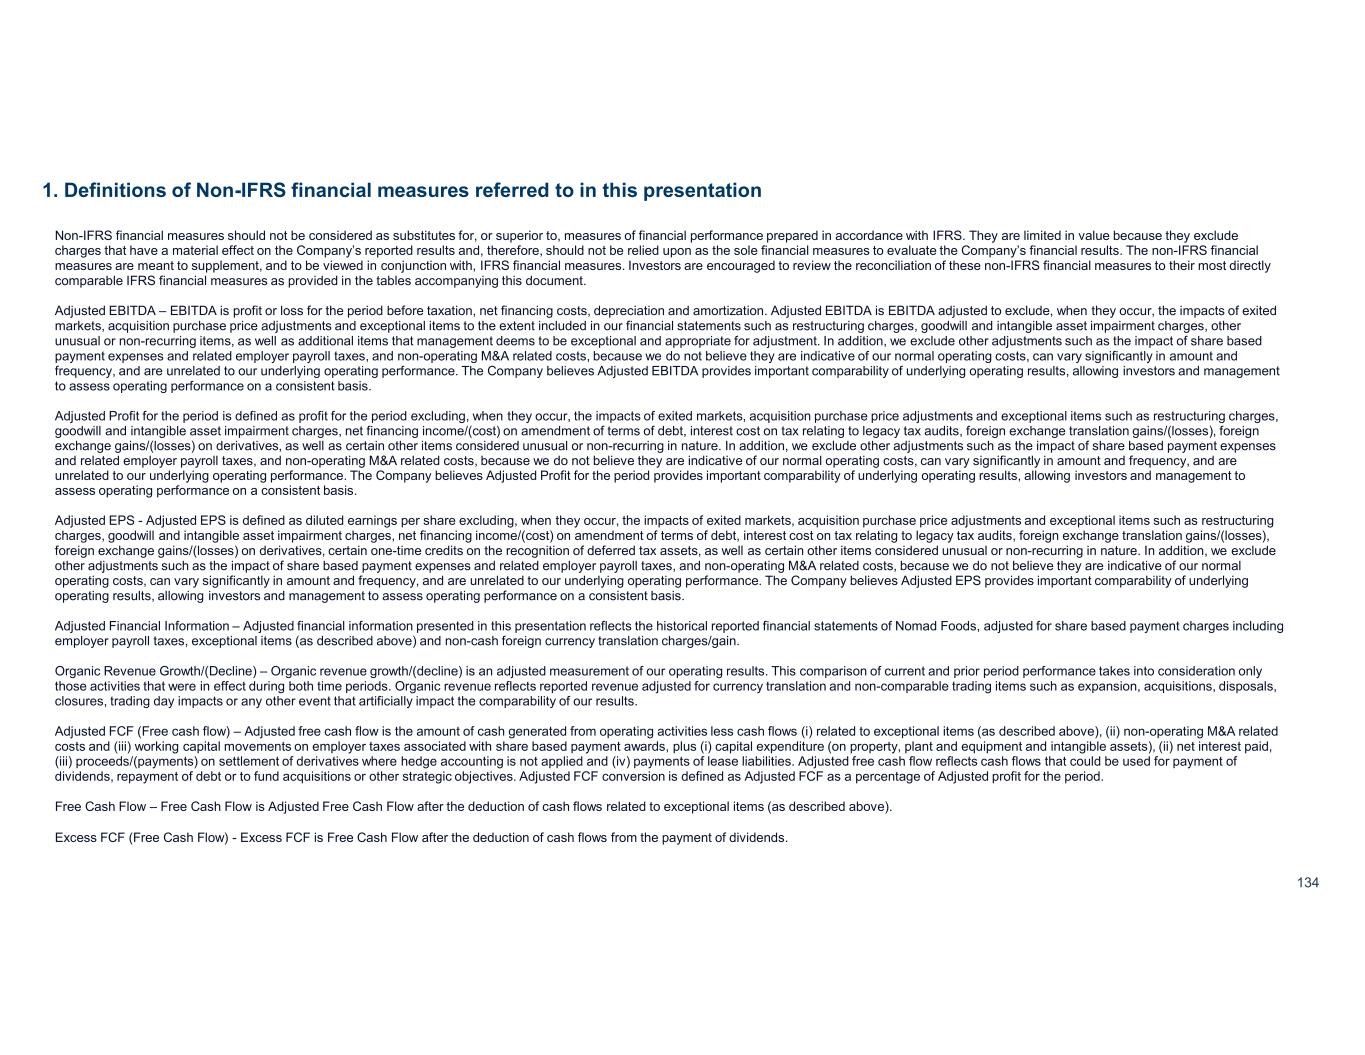
1. Definitions of Non-IFRS financial measures referred to in this presentation 134 Non-IFRS financial measures should not be considered as substitutes for, or superior to, measures of financial performance prepared in accordance with IFRS. They are limited in value because they exclude charges that have a material effect on the Company’s reported results and, therefore, should not be relied upon as the sole financial measures to evaluate the Company’s financial results. The non-IFRS financial measures are meant to supplement, and to be viewed in conjunction with, IFRS financial measures. Investors are encouraged to review the reconciliation of these non-IFRS financial measures to their most directly comparable IFRS financial measures as provided in the tables accompanying this document. Adjusted EBITDA – EBITDA is profit or loss for the period before taxation, net financing costs, depreciation and amortization. Adjusted EBITDA is EBITDA adjusted to exclude, when they occur, the impacts of exited markets, acquisition purchase price adjustments and exceptional items to the extent included in our financial statements such as restructuring charges, goodwill and intangible asset impairment charges, other unusual or non-recurring items, as well as additional items that management deems to be exceptional and appropriate for adjustment. In addition, we exclude other adjustments such as the impact of share based payment expenses and related employer payroll taxes, and non-operating M&A related costs, because we do not believe they are indicative of our normal operating costs, can vary significantly in amount and frequency, and are unrelated to our underlying operating performance. The Company believes Adjusted EBITDA provides important comparability of underlying operating results, allowing investors and management to assess operating performance on a consistent basis. Adjusted Profit for the period is defined as profit for the period excluding, when they occur, the impacts of exited markets, acquisition purchase price adjustments and exceptional items such as restructuring charges, goodwill and intangible asset impairment charges, net financing income/(cost) on amendment of terms of debt, interest cost on tax relating to legacy tax audits, foreign exchange translation gains/(losses), foreign exchange gains/(losses) on derivatives, as well as certain other items considered unusual or non-recurring in nature. In addition, we exclude other adjustments such as the impact of share based payment expenses and related employer payroll taxes, and non-operating M&A related costs, because we do not believe they are indicative of our normal operating costs, can vary significantly in amount and frequency, and are unrelated to our underlying operating performance. The Company believes Adjusted Profit for the period provides important comparability of underlying operating results, allowing investors and management to assess operating performance on a consistent basis. Adjusted EPS - Adjusted EPS is defined as diluted earnings per share excluding, when they occur, the impacts of exited markets, acquisition purchase price adjustments and exceptional items such as restructuring charges, goodwill and intangible asset impairment charges, net financing income/(cost) on amendment of terms of debt, interest cost on tax relating to legacy tax audits, foreign exchange translation gains/(losses), foreign exchange gains/(losses) on derivatives, certain one-time credits on the recognition of deferred tax assets, as well as certain other items considered unusual or non-recurring in nature. In addition, we exclude other adjustments such as the impact of share based payment expenses and related employer payroll taxes, and non-operating M&A related costs, because we do not believe they are indicative of our normal operating costs, can vary significantly in amount and frequency, and are unrelated to our underlying operating performance. The Company believes Adjusted EPS provides important comparability of underlying operating results, allowing investors and management to assess operating performance on a consistent basis. Adjusted Financial Information – Adjusted financial information presented in this presentation reflects the historical reported financial statements of Nomad Foods, adjusted for share based payment charges including employer payroll taxes, exceptional items (as described above) and non-cash foreign currency translation charges/gain. Organic Revenue Growth/(Decline) – Organic revenue growth/(decline) is an adjusted measurement of our operating results. This comparison of current and prior period performance takes into consideration only those activities that were in effect during both time periods. Organic revenue reflects reported revenue adjusted for currency translation and non-comparable trading items such as expansion, acquisitions, disposals, closures, trading day impacts or any other event that artificially impact the comparability of our results. Adjusted FCF (Free cash flow) – Adjusted free cash flow is the amount of cash generated from operating activities less cash flows (i) related to exceptional items (as described above), (ii) non-operating M&A related costs and (iii) working capital movements on employer taxes associated with share based payment awards, plus (i) capital expenditure (on property, plant and equipment and intangible assets), (ii) net interest paid, (iii) proceeds/(payments) on settlement of derivatives where hedge accounting is not applied and (iv) payments of lease liabilities. Adjusted free cash flow reflects cash flows that could be used for payment of dividends, repayment of debt or to fund acquisitions or other strategic objectives. Adjusted FCF conversion is defined as Adjusted FCF as a percentage of Adjusted profit for the period. Free Cash Flow – Free Cash Flow is Adjusted Free Cash Flow after the deduction of cash flows related to exceptional items (as described above). Excess FCF (Free Cash Flow) - Excess FCF is Free Cash Flow after the deduction of cash flows from the payment of dividends.
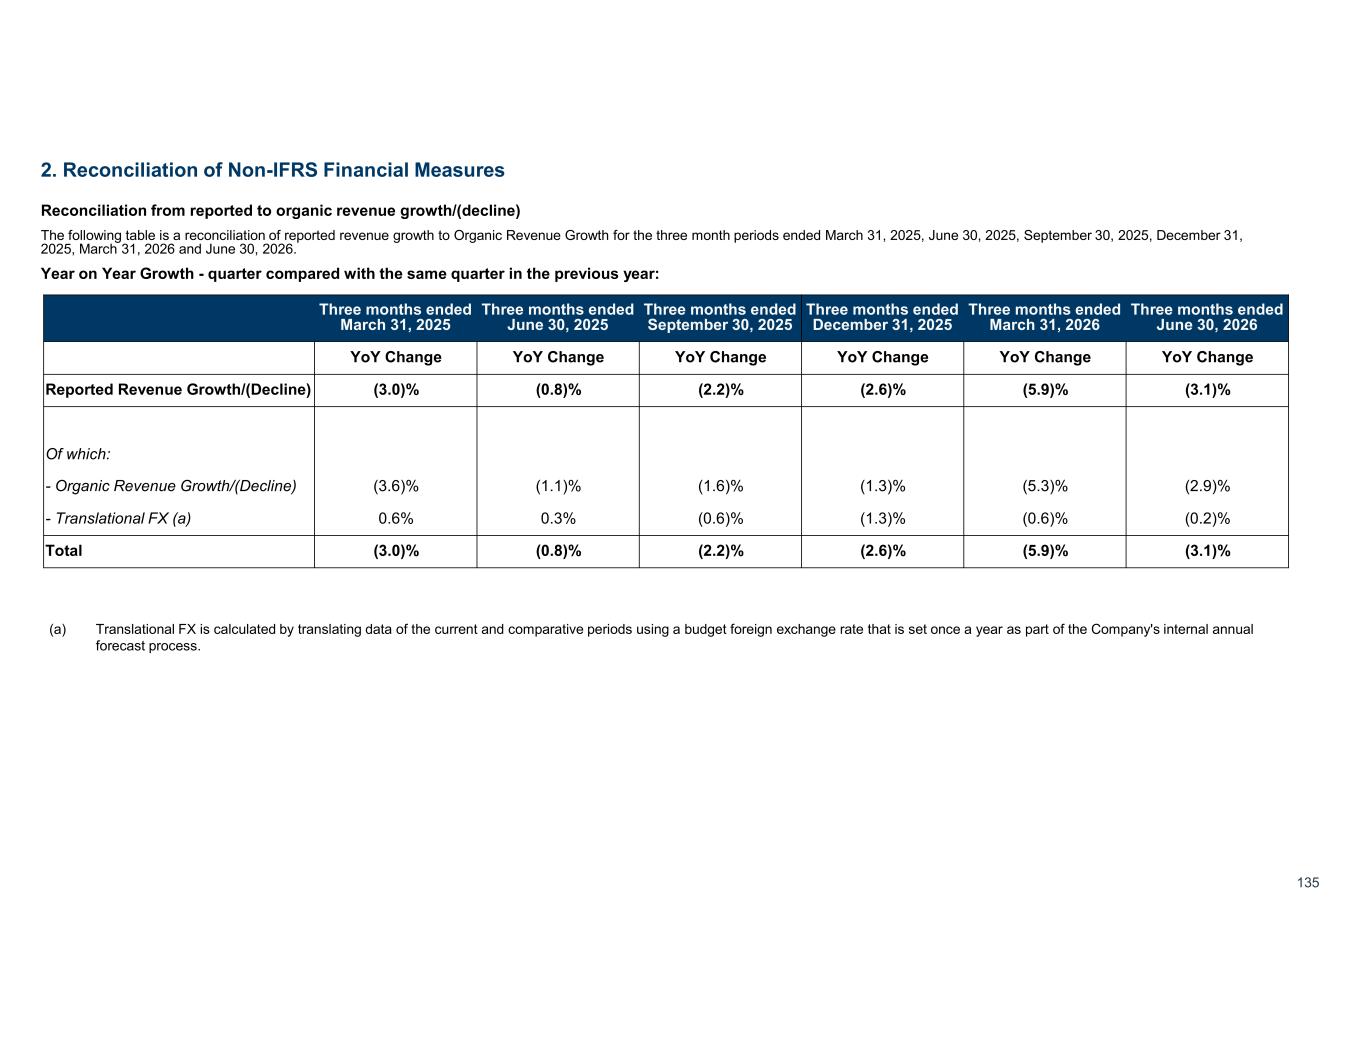
135 2. Reconciliation of Non-IFRS Financial Measures Three months ended June 30, 2026 Three months ended March 31, 2026 Three months ended December 31, 2025 Three months ended September 30, 2025 Three months ended June 30, 2025 Three months ended March 31, 2025 YoY ChangeYoY ChangeYoY ChangeYoY ChangeYoY ChangeYoY Change (3.1)%(5.9)%(2.6)%(2.2)%(0.8)%(3.0)%Reported Revenue Growth/(Decline) Of which: (2.9)%(5.3)%(1.3)%(1.6)%(1.1)%(3.6)%- Organic Revenue Growth/(Decline) (0.2)%(0.6)%(1.3)%(0.6)%0.3%0.6%- Translational FX (a) (3.1)%(5.9)%(2.6)%(2.2)%(0.8)%(3.0)%Total (a) Translational FX is calculated by translating data of the current and comparative periods using a budget foreign exchange rate that is set once a year as part of the Company's internal annual forecast process. Reconciliation from reported to organic revenue growth/(decline) The following table is a reconciliation of reported revenue growth to Organic Revenue Growth for the three month periods ended March 31, 2025, June 30, 2025, September 30, 2025, December 31, 2025, March 31, 2026 and June 30, 2026. Year on Year Growth - quarter compared with the same quarter in the previous year:
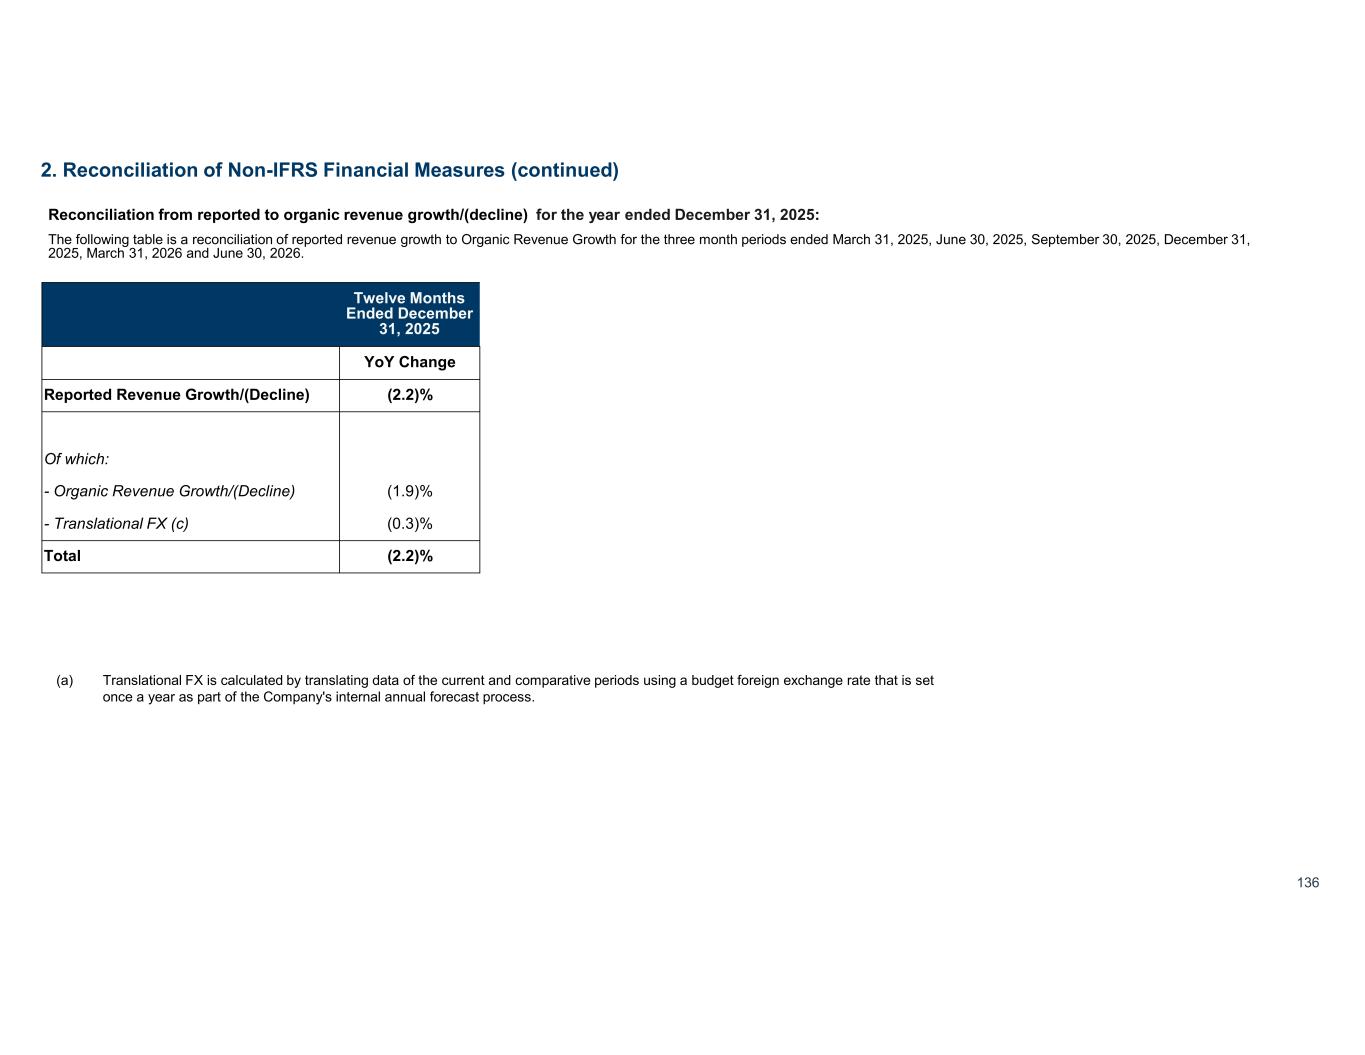
136 2. Reconciliation of Non-IFRS Financial Measures (continued) Twelve Months Ended December 31, 2025 YoY Change (2.2)%Reported Revenue Growth/(Decline) Of which: (1.9)%- Organic Revenue Growth/(Decline) (0.3)%- Translational FX (c) (2.2)%Total (a) Translational FX is calculated by translating data of the current and comparative periods using a budget foreign exchange rate that is set once a year as part of the Company's internal annual forecast process. Reconciliation from reported to organic revenue growth/(decline) for the year ended December 31, 2025: The following table is a reconciliation of reported revenue growth to Organic Revenue Growth for the three month periods ended March 31, 2025, June 30, 2025, September 30, 2025, December 31, 2025, March 31, 2026 and June 30, 2026.
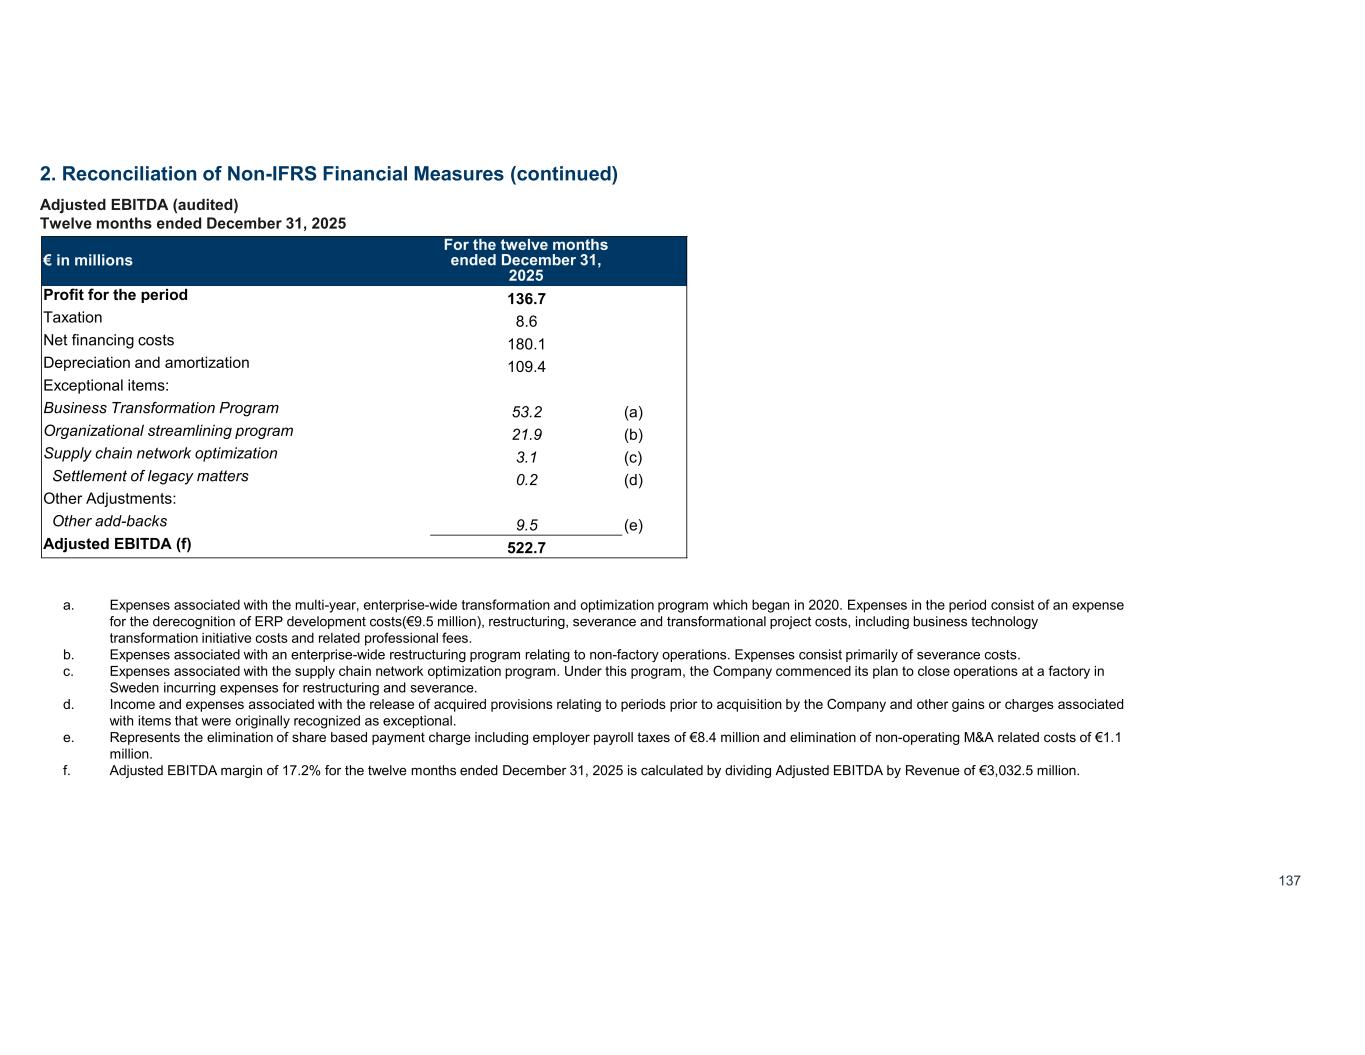
137 2. Reconciliation of Non-IFRS Financial Measures (continued) Adjusted EBITDA (audited) Twelve months ended December 31, 2025 For the twelve months ended December 31, 2025 € in millions 136.7Profit for the period 8.6Taxation 180.1Net financing costs 109.4Depreciation and amortization Exceptional items: (a)53.2Business Transformation Program (b)21.9Organizational streamlining program (c)3.1Supply chain network optimization (d)0.2Settlement of legacy matters Other Adjustments: (e)9.5Other add-backs 522.7Adjusted EBITDA (f) a. Expenses associated with the multi-year, enterprise-wide transformation and optimization program which began in 2020. Expenses in the period consist of an expense for the derecognition of ERP development costs(€9.5 million), restructuring, severance and transformational project costs, including business technology transformation initiative costs and related professional fees. b. Expenses associated with an enterprise-wide restructuring program relating to non-factory operations. Expenses consist primarily of severance costs. c. Expenses associated with the supply chain network optimization program. Under this program, the Company commenced its plan to close operations at a factory in Sweden incurring expenses for restructuring and severance. d. Income and expenses associated with the release of acquired provisions relating to periods prior to acquisition by the Company and other gains or charges associated with items that were originally recognized as exceptional. e. Represents the elimination of share based payment charge including employer payroll taxes of €8.4 million and elimination of non-operating M&A related costs of €1.1 million. f. Adjusted EBITDA margin of 17.2% for the twelve months ended December 31, 2025 is calculated by dividing Adjusted EBITDA by Revenue of €3,032.5 million.
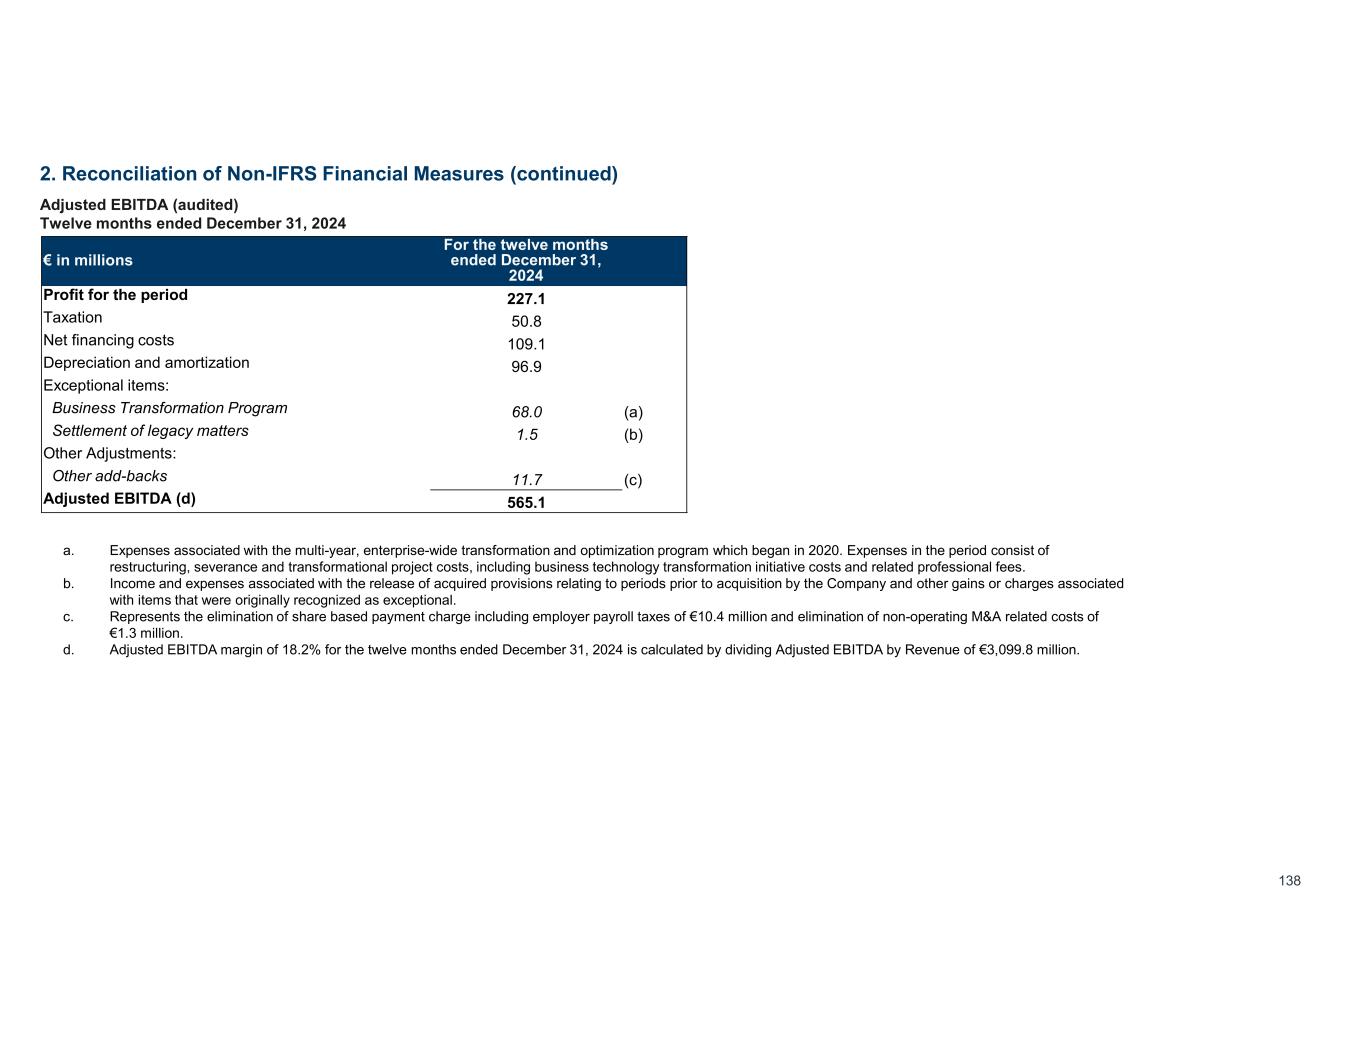
138 2. Reconciliation of Non-IFRS Financial Measures (continued) Adjusted EBITDA (audited) Twelve months ended December 31, 2024 For the twelve months ended December 31, 2024 € in millions 227.1Profit for the period 50.8Taxation 109.1Net financing costs 96.9Depreciation and amortization Exceptional items: (a)68.0Business Transformation Program (b)1.5Settlement of legacy matters Other Adjustments: (c)11.7Other add-backs 565.1Adjusted EBITDA (d) a. Expenses associated with the multi-year, enterprise-wide transformation and optimization program which began in 2020. Expenses in the period consist of restructuring, severance and transformational project costs, including business technology transformation initiative costs and related professional fees. b. Income and expenses associated with the release of acquired provisions relating to periods prior to acquisition by the Company and other gains or charges associated with items that were originally recognized as exceptional. c. Represents the elimination of share based payment charge including employer payroll taxes of €10.4 million and elimination of non-operating M&A related costs of €1.3 million. d. Adjusted EBITDA margin of 18.2% for the twelve months ended December 31, 2024 is calculated by dividing Adjusted EBITDA by Revenue of €3,099.8 million.
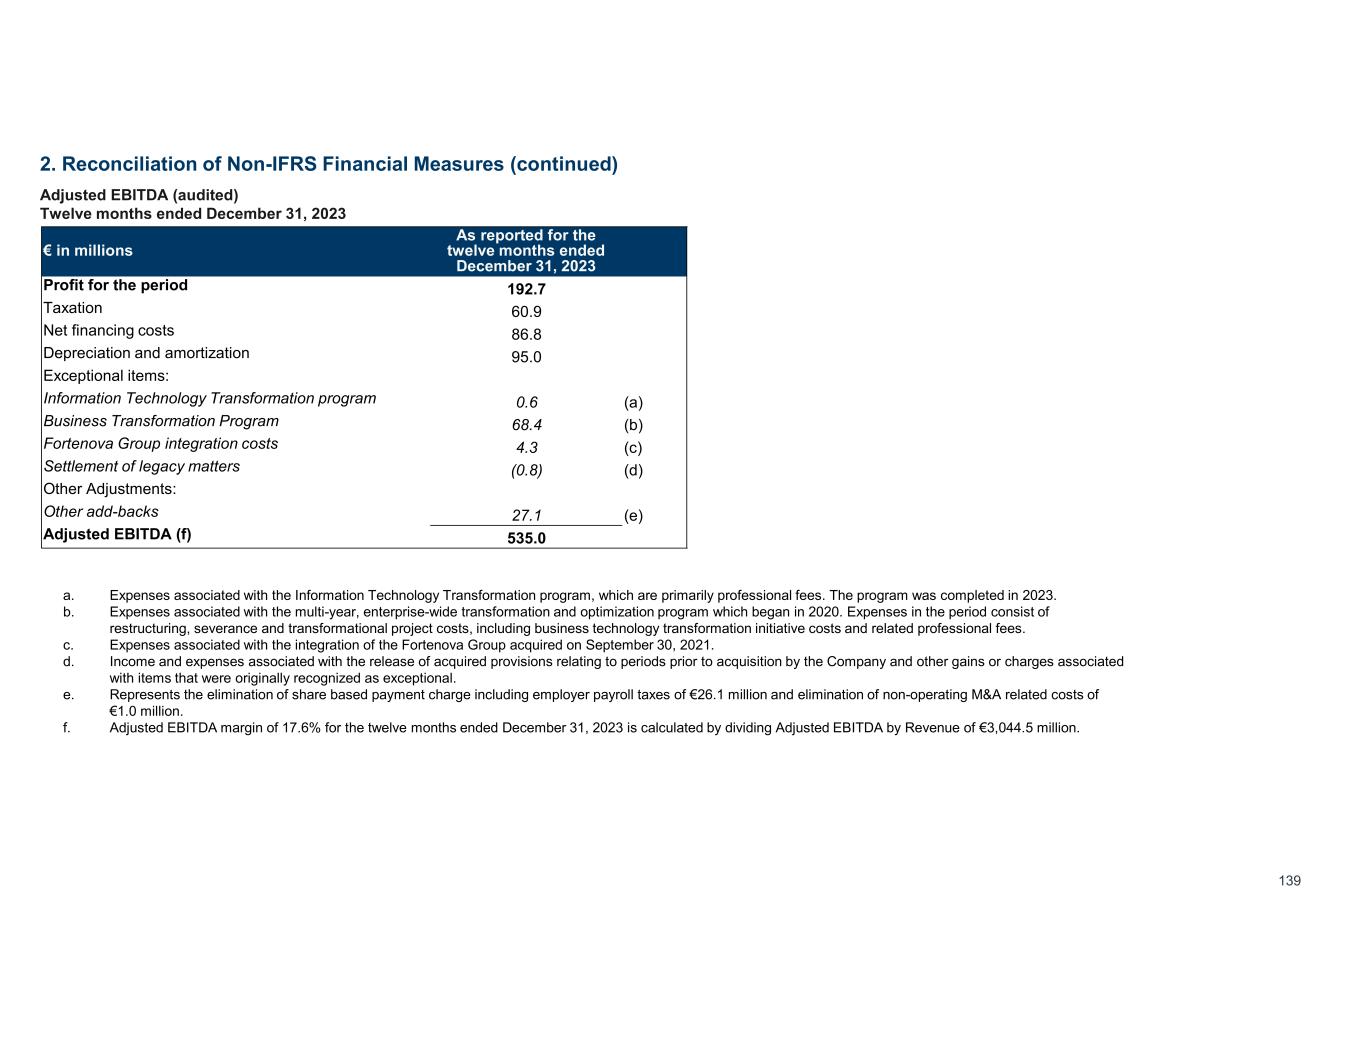
139 2. Reconciliation of Non-IFRS Financial Measures (continued) Adjusted EBITDA (audited) Twelve months ended December 31, 2023 As reported for the twelve months ended December 31, 2023 € in millions 192.7Profit for the period 60.9Taxation 86.8Net financing costs 95.0Depreciation and amortization Exceptional items: (a)0.6Information Technology Transformation program (b)68.4Business Transformation Program (c)4.3Fortenova Group integration costs (d)(0.8)Settlement of legacy matters Other Adjustments: (e)27.1Other add-backs 535.0Adjusted EBITDA (f) a. Expenses associated with the Information Technology Transformation program, which are primarily professional fees. The program was completed in 2023. b. Expenses associated with the multi-year, enterprise-wide transformation and optimization program which began in 2020. Expenses in the period consist of restructuring, severance and transformational project costs, including business technology transformation initiative costs and related professional fees. c. Expenses associated with the integration of the Fortenova Group acquired on September 30, 2021. d. Income and expenses associated with the release of acquired provisions relating to periods prior to acquisition by the Company and other gains or charges associated with items that were originally recognized as exceptional. e. Represents the elimination of share based payment charge including employer payroll taxes of €26.1 million and elimination of non-operating M&A related costs of €1.0 million. f. Adjusted EBITDA margin of 17.6% for the twelve months ended December 31, 2023 is calculated by dividing Adjusted EBITDA by Revenue of €3,044.5 million.
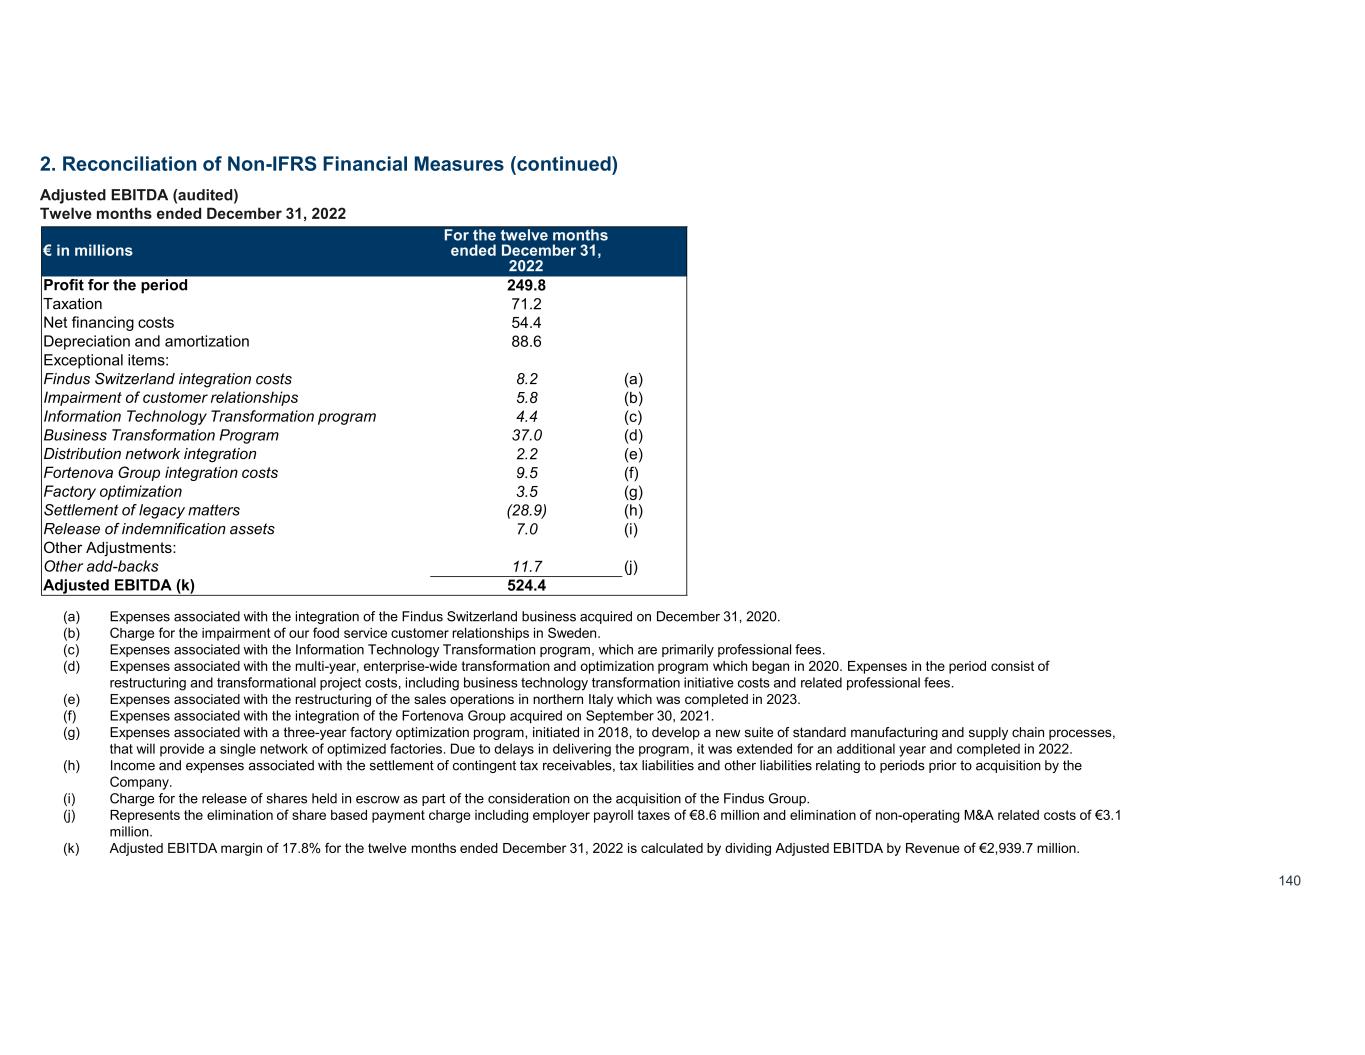
140 2. Reconciliation of Non-IFRS Financial Measures (continued) Adjusted EBITDA (audited) Twelve months ended December 31, 2022 For the twelve months ended December 31, 2022 € in millions 249.8Profit for the period 71.2Taxation 54.4Net financing costs 88.6Depreciation and amortization Exceptional items: (a)8.2Findus Switzerland integration costs (b)5.8Impairment of customer relationships (c)4.4Information Technology Transformation program (d)37.0Business Transformation Program (e)2.2Distribution network integration (f)9.5Fortenova Group integration costs (g)3.5Factory optimization (h)(28.9)Settlement of legacy matters (i)7.0Release of indemnification assets Other Adjustments: (j)11.7Other add-backs 524.4Adjusted EBITDA (k) (a) Expenses associated with the integration of the Findus Switzerland business acquired on December 31, 2020. (b) Charge for the impairment of our food service customer relationships in Sweden. (c) Expenses associated with the Information Technology Transformation program, which are primarily professional fees. (d) Expenses associated with the multi-year, enterprise-wide transformation and optimization program which began in 2020. Expenses in the period consist of restructuring and transformational project costs, including business technology transformation initiative costs and related professional fees. (e) Expenses associated with the restructuring of the sales operations in northern Italy which was completed in 2023. (f) Expenses associated with the integration of the Fortenova Group acquired on September 30, 2021. (g) Expenses associated with a three-year factory optimization program, initiated in 2018, to develop a new suite of standard manufacturing and supply chain processes, that will provide a single network of optimized factories. Due to delays in delivering the program, it was extended for an additional year and completed in 2022. (h) Income and expenses associated with the settlement of contingent tax receivables, tax liabilities and other liabilities relating to periods prior to acquisition by the Company. (i) Charge for the release of shares held in escrow as part of the consideration on the acquisition of the Findus Group. (j) Represents the elimination of share based payment charge including employer payroll taxes of €8.6 million and elimination of non-operating M&A related costs of €3.1 million. (k) Adjusted EBITDA margin of 17.8% for the twelve months ended December 31, 2022 is calculated by dividing Adjusted EBITDA by Revenue of €2,939.7 million.
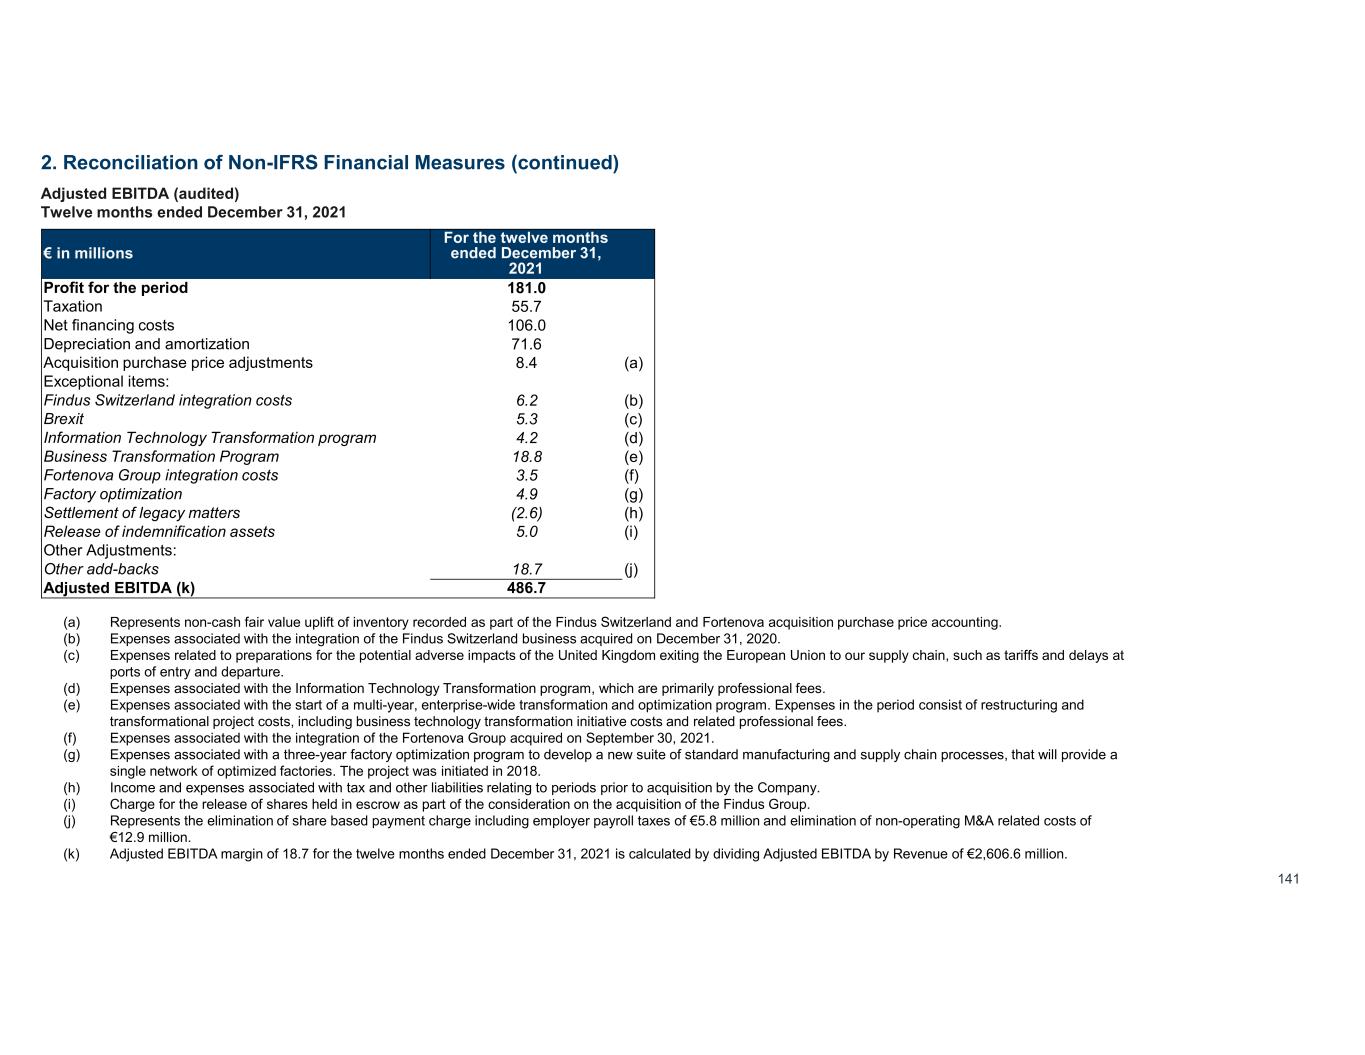
141 2. Reconciliation of Non-IFRS Financial Measures (continued) Adjusted EBITDA (audited) Twelve months ended December 31, 2021 For the twelve months ended December 31, 2021 € in millions 181.0Profit for the period 55.7Taxation 106.0Net financing costs 71.6Depreciation and amortization (a)8.4Acquisition purchase price adjustments Exceptional items: (b)6.2Findus Switzerland integration costs (c)5.3Brexit (d)4.2Information Technology Transformation program (e)18.8Business Transformation Program (f)3.5Fortenova Group integration costs (g)4.9Factory optimization (h)(2.6)Settlement of legacy matters (i)5.0Release of indemnification assets Other Adjustments: (j)18.7Other add-backs 486.7Adjusted EBITDA (k) (a) Represents non-cash fair value uplift of inventory recorded as part of the Findus Switzerland and Fortenova acquisition purchase price accounting. (b) Expenses associated with the integration of the Findus Switzerland business acquired on December 31, 2020. (c) Expenses related to preparations for the potential adverse impacts of the United Kingdom exiting the European Union to our supply chain, such as tariffs and delays at ports of entry and departure. (d) Expenses associated with the Information Technology Transformation program, which are primarily professional fees. (e) Expenses associated with the start of a multi-year, enterprise-wide transformation and optimization program. Expenses in the period consist of restructuring and transformational project costs, including business technology transformation initiative costs and related professional fees. (f) Expenses associated with the integration of the Fortenova Group acquired on September 30, 2021. (g) Expenses associated with a three-year factory optimization program to develop a new suite of standard manufacturing and supply chain processes, that will provide a single network of optimized factories. The project was initiated in 2018. (h) Income and expenses associated with tax and other liabilities relating to periods prior to acquisition by the Company. (i) Charge for the release of shares held in escrow as part of the consideration on the acquisition of the Findus Group. (j) Represents the elimination of share based payment charge including employer payroll taxes of €5.8 million and elimination of non-operating M&A related costs of €12.9 million. (k) Adjusted EBITDA margin of 18.7 for the twelve months ended December 31, 2021 is calculated by dividing Adjusted EBITDA by Revenue of €2,606.6 million.
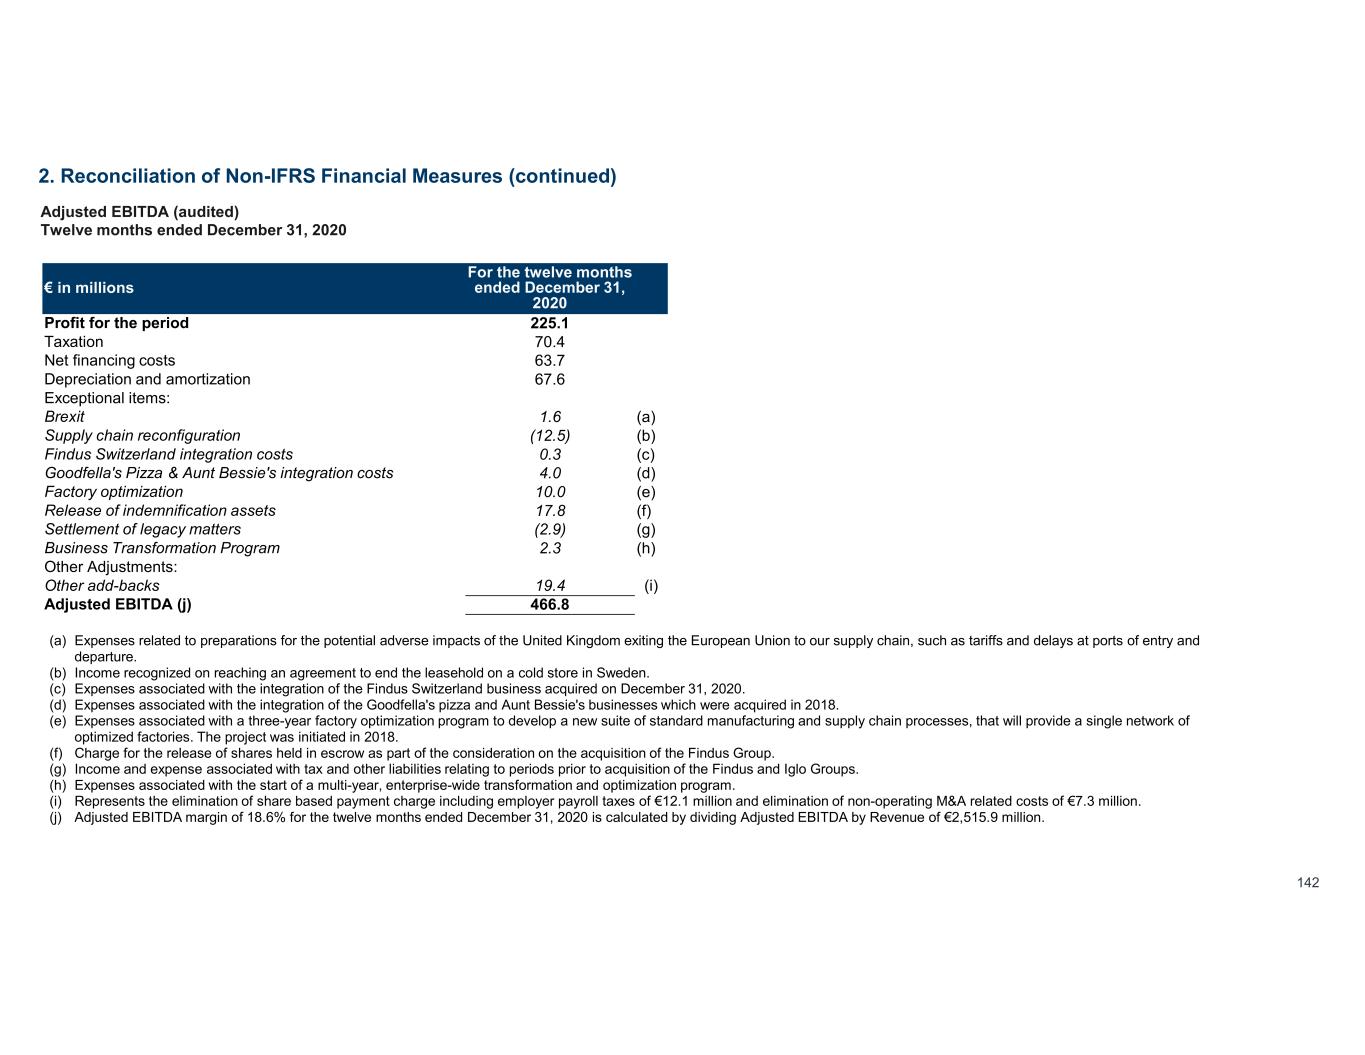
142 Adjusted EBITDA (audited) Twelve months ended December 31, 2020 For the twelve months ended December 31, 2020 € in millions 225.1Profit for the period 70.4Taxation 63.7Net financing costs 67.6Depreciation and amortization Exceptional items: (a)1.6Brexit (b)(12.5)Supply chain reconfiguration (c)0.3Findus Switzerland integration costs (d)4.0Goodfella's Pizza & Aunt Bessie's integration costs (e)10.0Factory optimization (f)17.8Release of indemnification assets (g)(2.9)Settlement of legacy matters (h)2.3Business Transformation Program Other Adjustments: (i)19.4Other add-backs 466.8Adjusted EBITDA (j) (a) Expenses related to preparations for the potential adverse impacts of the United Kingdom exiting the European Union to our supply chain, such as tariffs and delays at ports of entry and departure. (b) Income recognized on reaching an agreement to end the leasehold on a cold store in Sweden. (c) Expenses associated with the integration of the Findus Switzerland business acquired on December 31, 2020. (d) Expenses associated with the integration of the Goodfella's pizza and Aunt Bessie's businesses which were acquired in 2018. (e) Expenses associated with a three-year factory optimization program to develop a new suite of standard manufacturing and supply chain processes, that will provide a single network of optimized factories. The project was initiated in 2018. (f) Charge for the release of shares held in escrow as part of the consideration on the acquisition of the Findus Group. (g) Income and expense associated with tax and other liabilities relating to periods prior to acquisition of the Findus and Iglo Groups. (h) Expenses associated with the start of a multi-year, enterprise-wide transformation and optimization program. (i) Represents the elimination of share based payment charge including employer payroll taxes of €12.1 million and elimination of non-operating M&A related costs of €7.3 million. (j) Adjusted EBITDA margin of 18.6% for the twelve months ended December 31, 2020 is calculated by dividing Adjusted EBITDA by Revenue of €2,515.9 million. 2. Reconciliation of Non-IFRS Financial Measures (continued)
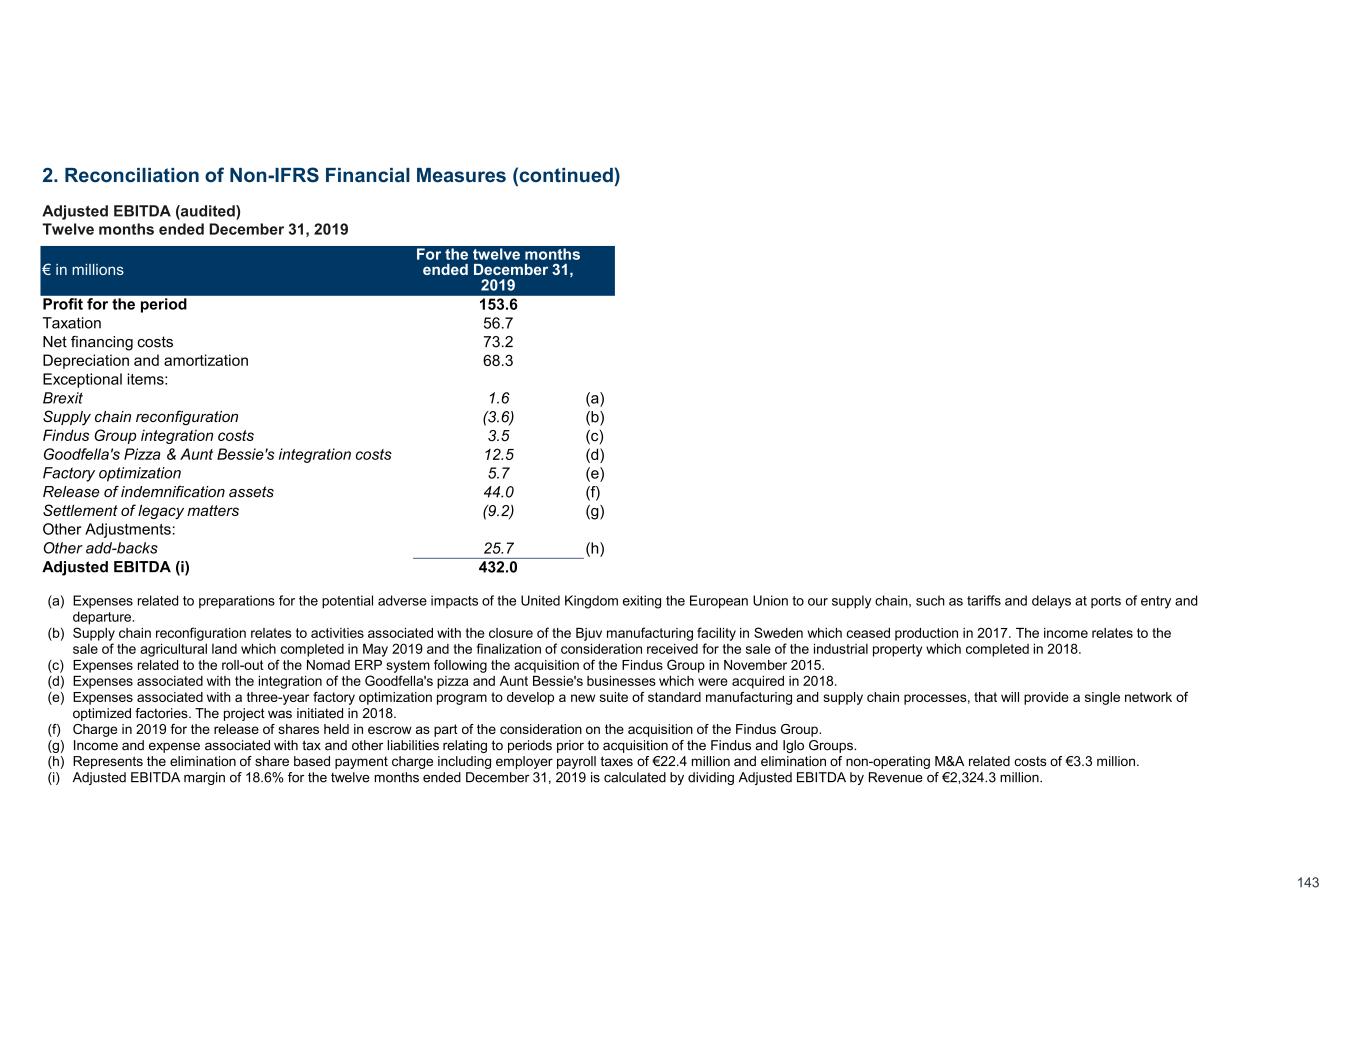
143 Adjusted EBITDA (audited) Twelve months ended December 31, 2019 For the twelve months ended December 31, 2019 € in millions 153.6Profit for the period 56.7Taxation 73.2Net financing costs 68.3Depreciation and amortization Exceptional items: (a)1.6Brexit (b)(3.6)Supply chain reconfiguration (c)3.5Findus Group integration costs (d)12.5Goodfella's Pizza & Aunt Bessie's integration costs (e)5.7Factory optimization (f)44.0Release of indemnification assets (g)(9.2)Settlement of legacy matters Other Adjustments: (h)25.7Other add-backs 432.0Adjusted EBITDA (i) (a) Expenses related to preparations for the potential adverse impacts of the United Kingdom exiting the European Union to our supply chain, such as tariffs and delays at ports of entry and departure. (b) Supply chain reconfiguration relates to activities associated with the closure of the Bjuv manufacturing facility in Sweden which ceased production in 2017. The income relates to the sale of the agricultural land which completed in May 2019 and the finalization of consideration received for the sale of the industrial property which completed in 2018. (c) Expenses related to the roll-out of the Nomad ERP system following the acquisition of the Findus Group in November 2015. (d) Expenses associated with the integration of the Goodfella's pizza and Aunt Bessie's businesses which were acquired in 2018. (e) Expenses associated with a three-year factory optimization program to develop a new suite of standard manufacturing and supply chain processes, that will provide a single network of optimized factories. The project was initiated in 2018. (f) Charge in 2019 for the release of shares held in escrow as part of the consideration on the acquisition of the Findus Group. (g) Income and expense associated with tax and other liabilities relating to periods prior to acquisition of the Findus and Iglo Groups. (h) Represents the elimination of share based payment charge including employer payroll taxes of €22.4 million and elimination of non-operating M&A related costs of €3.3 million. (i) Adjusted EBITDA margin of 18.6% for the twelve months ended December 31, 2019 is calculated by dividing Adjusted EBITDA by Revenue of €2,324.3 million. 2. Reconciliation of Non-IFRS Financial Measures (continued)
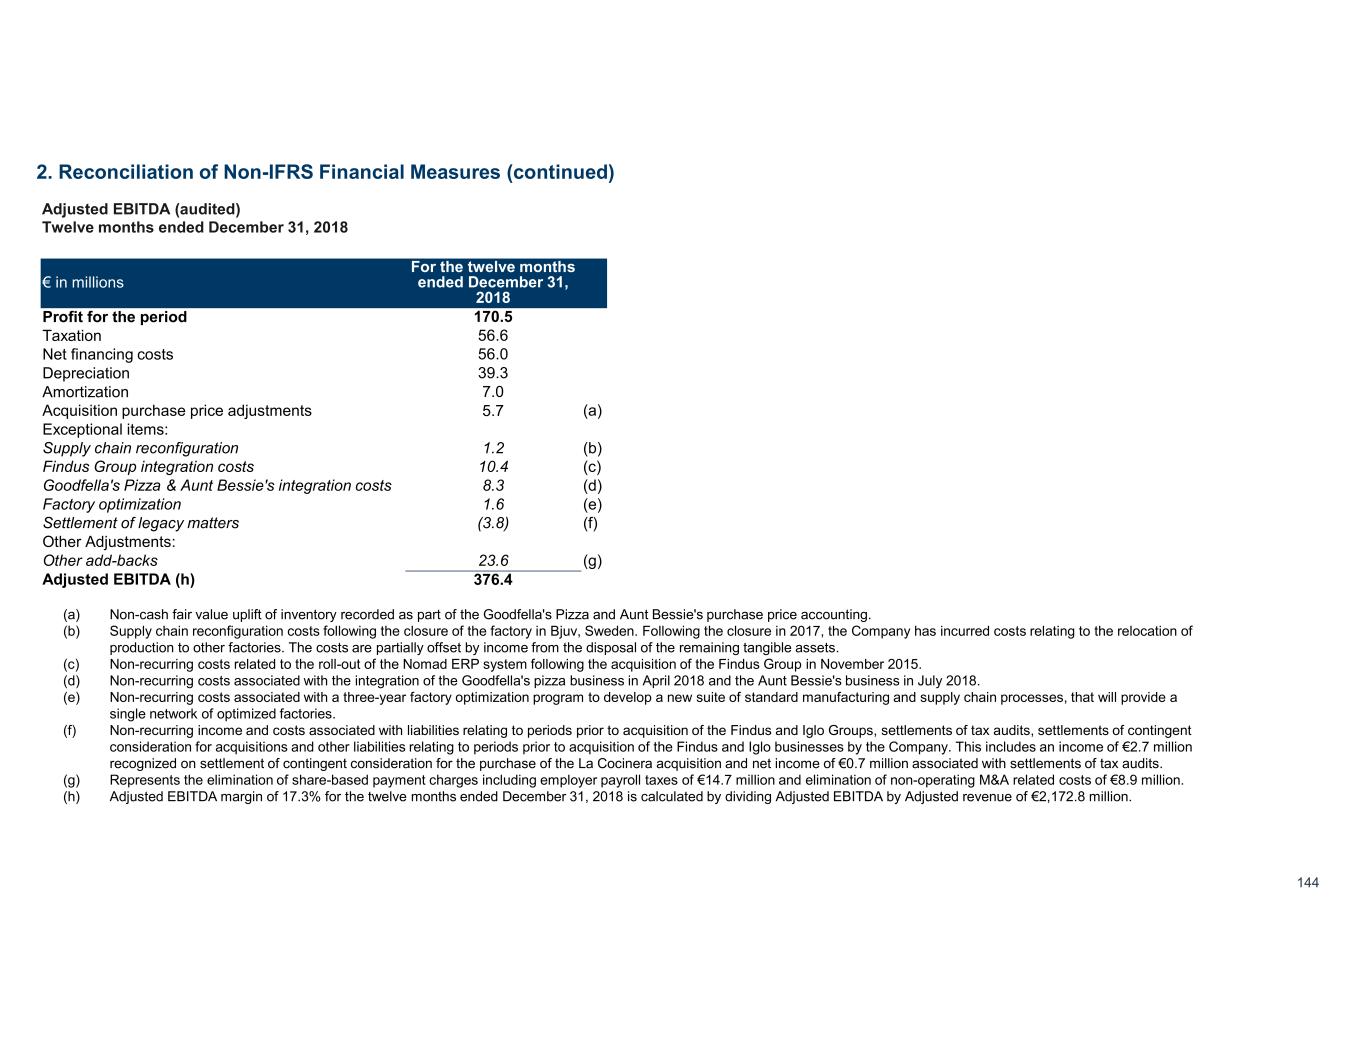
144 Adjusted EBITDA (audited) Twelve months ended December 31, 2018 For the twelve months ended December 31, 2018 € in millions 170.5Profit for the period 56.6Taxation 56.0Net financing costs 39.3Depreciation 7.0Amortization (a)5.7Acquisition purchase price adjustments Exceptional items: (b)1.2Supply chain reconfiguration (c)10.4Findus Group integration costs (d)8.3Goodfella's Pizza & Aunt Bessie's integration costs (e)1.6Factory optimization (f)(3.8)Settlement of legacy matters Other Adjustments: (g)23.6Other add-backs 376.4Adjusted EBITDA (h) (a) Non-cash fair value uplift of inventory recorded as part of the Goodfella's Pizza and Aunt Bessie's purchase price accounting. (b) Supply chain reconfiguration costs following the closure of the factory in Bjuv, Sweden. Following the closure in 2017, the Company has incurred costs relating to the relocation of production to other factories. The costs are partially offset by income from the disposal of the remaining tangible assets. (c) Non-recurring costs related to the roll-out of the Nomad ERP system following the acquisition of the Findus Group in November 2015. (d) Non-recurring costs associated with the integration of the Goodfella's pizza business in April 2018 and the Aunt Bessie's business in July 2018. (e) Non-recurring costs associated with a three-year factory optimization program to develop a new suite of standard manufacturing and supply chain processes, that will provide a single network of optimized factories. (f) Non-recurring income and costs associated with liabilities relating to periods prior to acquisition of the Findus and Iglo Groups, settlements of tax audits, settlements of contingent consideration for acquisitions and other liabilities relating to periods prior to acquisition of the Findus and Iglo businesses by the Company. This includes an income of €2.7 million recognized on settlement of contingent consideration for the purchase of the La Cocinera acquisition and net income of €0.7 million associated with settlements of tax audits. (g) Represents the elimination of share-based payment charges including employer payroll taxes of €14.7 million and elimination of non-operating M&A related costs of €8.9 million. (h) Adjusted EBITDA margin of 17.3% for the twelve months ended December 31, 2018 is calculated by dividing Adjusted EBITDA by Adjusted revenue of €2,172.8 million. 2. Reconciliation of Non-IFRS Financial Measures (continued)
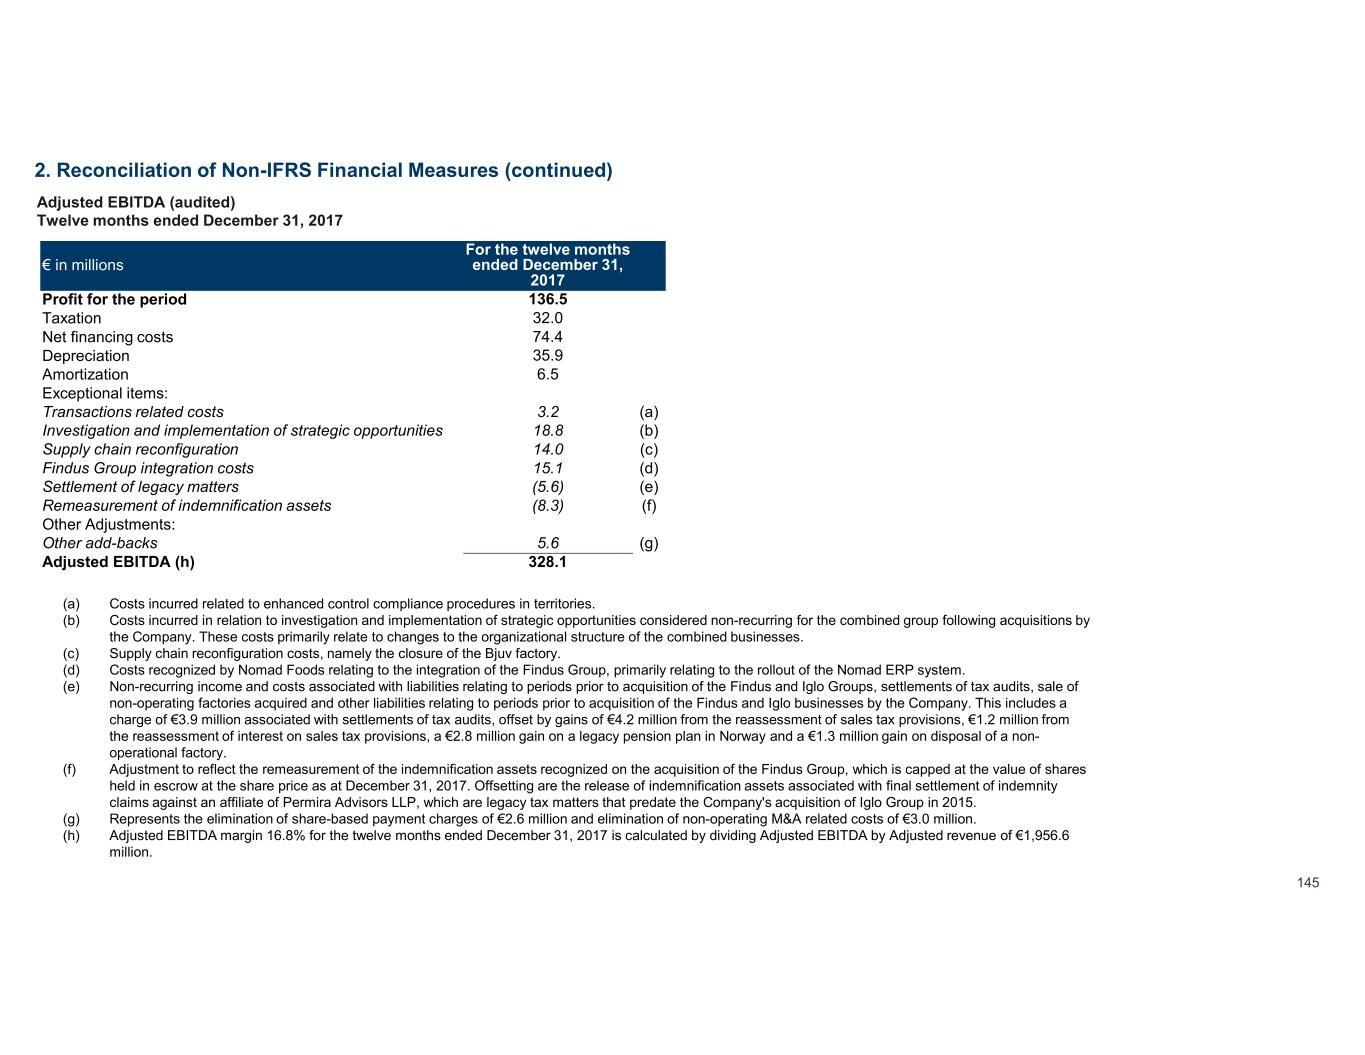
145 Adjusted EBITDA (audited) Twelve months ended December 31, 2017 For the twelve months ended December 31, 2017 € in millions 136.5Profit for the period 32.0Taxation 74.4Net financing costs 35.9Depreciation 6.5Amortization Exceptional items: (a)3.2Transactions related costs (b)18.8Investigation and implementation of strategic opportunities (c)14.0Supply chain reconfiguration (d)15.1Findus Group integration costs (e)(5.6)Settlement of legacy matters (f)(8.3)Remeasurement of indemnification assets Other Adjustments: (g)5.6Other add-backs 328.1Adjusted EBITDA (h) (a) Costs incurred related to enhanced control compliance procedures in territories. (b) Costs incurred in relation to investigation and implementation of strategic opportunities considered non-recurring for the combined group following acquisitions by the Company. These costs primarily relate to changes to the organizational structure of the combined businesses. (c) Supply chain reconfiguration costs, namely the closure of the Bjuv factory. (d) Costs recognized by Nomad Foods relating to the integration of the Findus Group, primarily relating to the rollout of the Nomad ERP system. (e) Non-recurring income and costs associated with liabilities relating to periods prior to acquisition of the Findus and Iglo Groups, settlements of tax audits, sale of non-operating factories acquired and other liabilities relating to periods prior to acquisition of the Findus and Iglo businesses by the Company. This includes a charge of €3.9 million associated with settlements of tax audits, offset by gains of €4.2 million from the reassessment of sales tax provisions, €1.2 million from the reassessment of interest on sales tax provisions, a €2.8 million gain on a legacy pension plan in Norway and a €1.3 million gain on disposal of a non- operational factory. (f) Adjustment to reflect the remeasurement of the indemnification assets recognized on the acquisition of the Findus Group, which is capped at the value of shares held in escrow at the share price as at December 31, 2017. Offsetting are the release of indemnification assets associated with final settlement of indemnity claims against an affiliate of Permira Advisors LLP, which are legacy tax matters that predate the Company's acquisition of Iglo Group in 2015. (g) Represents the elimination of share-based payment charges of €2.6 million and elimination of non-operating M&A related costs of €3.0 million. (h) Adjusted EBITDA margin 16.8% for the twelve months ended December 31, 2017 is calculated by dividing Adjusted EBITDA by Adjusted revenue of €1,956.6 million. 2. Reconciliation of Non-IFRS Financial Measures (continued)
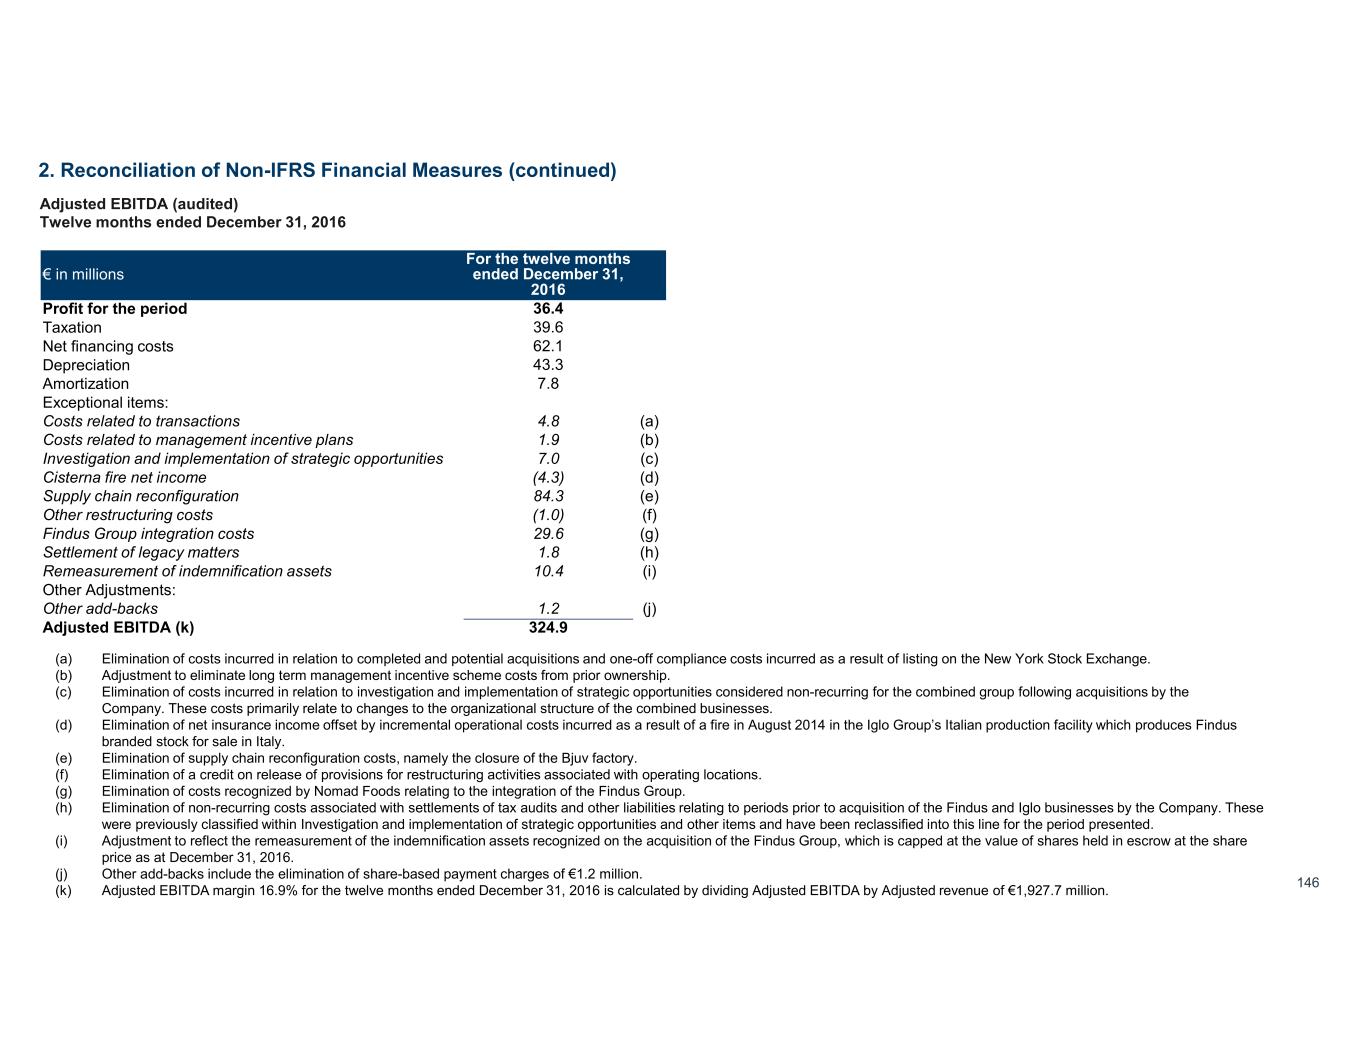
146 Adjusted EBITDA (audited) Twelve months ended December 31, 2016 For the twelve months ended December 31, 2016 € in millions 36.4Profit for the period 39.6Taxation 62.1Net financing costs 43.3Depreciation 7.8Amortization Exceptional items: (a)4.8Costs related to transactions (b)1.9Costs related to management incentive plans (c)7.0Investigation and implementation of strategic opportunities (d)(4.3)Cisterna fire net income (e)84.3Supply chain reconfiguration (f)(1.0)Other restructuring costs (g)29.6Findus Group integration costs (h)1.8Settlement of legacy matters (i)10.4Remeasurement of indemnification assets Other Adjustments: (j)1.2Other add-backs 324.9Adjusted EBITDA (k) (a) Elimination of costs incurred in relation to completed and potential acquisitions and one-off compliance costs incurred as a result of listing on the New York Stock Exchange. (b) Adjustment to eliminate long term management incentive scheme costs from prior ownership. (c) Elimination of costs incurred in relation to investigation and implementation of strategic opportunities considered non-recurring for the combined group following acquisitions by the Company. These costs primarily relate to changes to the organizational structure of the combined businesses. (d) Elimination of net insurance income offset by incremental operational costs incurred as a result of a fire in August 2014 in the Iglo Group’s Italian production facility which produces Findus branded stock for sale in Italy. (e) Elimination of supply chain reconfiguration costs, namely the closure of the Bjuv factory. (f) Elimination of a credit on release of provisions for restructuring activities associated with operating locations. (g) Elimination of costs recognized by Nomad Foods relating to the integration of the Findus Group. (h) Elimination of non-recurring costs associated with settlements of tax audits and other liabilities relating to periods prior to acquisition of the Findus and Iglo businesses by the Company. These were previously classified within Investigation and implementation of strategic opportunities and other items and have been reclassified into this line for the period presented. (i) Adjustment to reflect the remeasurement of the indemnification assets recognized on the acquisition of the Findus Group, which is capped at the value of shares held in escrow at the share price as at December 31, 2016. (j) Other add-backs include the elimination of share-based payment charges of €1.2 million. (k) Adjusted EBITDA margin 16.9% for the twelve months ended December 31, 2016 is calculated by dividing Adjusted EBITDA by Adjusted revenue of €1,927.7 million. 2. Reconciliation of Non-IFRS Financial Measures (continued)
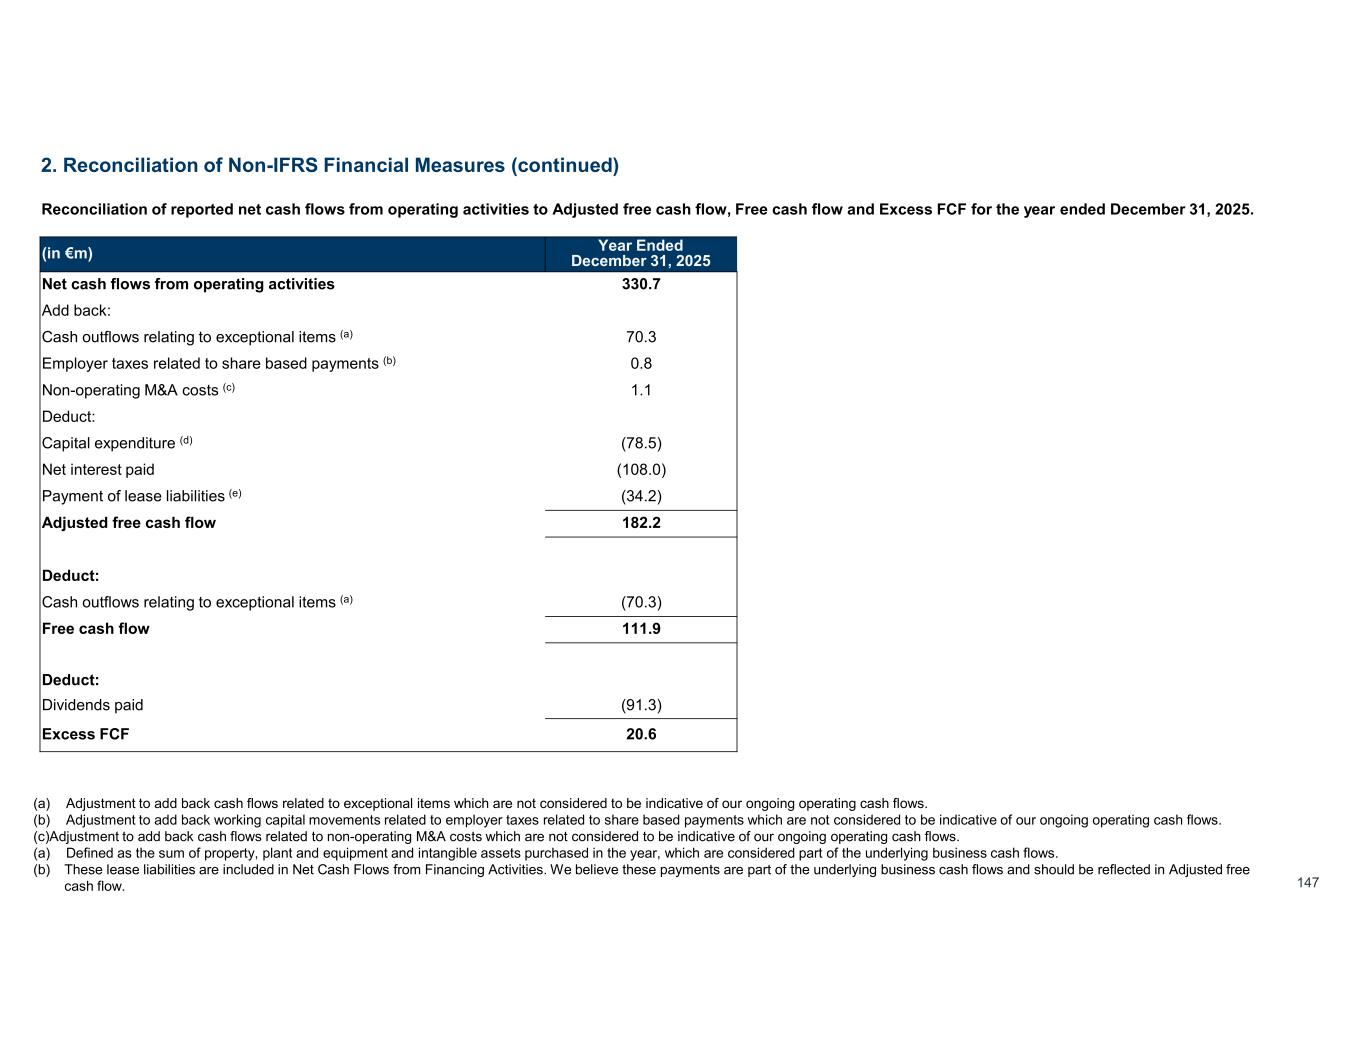
147 2. Reconciliation of Non-IFRS Financial Measures (continued) (a) Adjustment to add back cash flows related to exceptional items which are not considered to be indicative of our ongoing operating cash flows. (b) Adjustment to add back working capital movements related to employer taxes related to share based payments which are not considered to be indicative of our ongoing operating cash flows. (c)Adjustment to add back cash flows related to non-operating M&A costs which are not considered to be indicative of our ongoing operating cash flows. (a) Defined as the sum of property, plant and equipment and intangible assets purchased in the year, which are considered part of the underlying business cash flows. (b) These lease liabilities are included in Net Cash Flows from Financing Activities. We believe these payments are part of the underlying business cash flows and should be reflected in Adjusted free cash flow. Year Ended December 31, 2025(in €m) 330.7Net cash flows from operating activities Add back: 70.3Cash outflows relating to exceptional items (a) 0.8Employer taxes related to share based payments (b) 1.1Non-operating M&A costs (c) Deduct: (78.5)Capital expenditure (d) (108.0)Net interest paid (34.2)Payment of lease liabilities (e) 182.2Adjusted free cash flow Deduct: (70.3)Cash outflows relating to exceptional items (a) 111.9Free cash flow Deduct: (91.3)Dividends paid 20.6Excess FCF Reconciliation of reported net cash flows from operating activities to Adjusted free cash flow, Free cash flow and Excess FCF for the year ended December 31, 2025.