Pay vs Performance Disclosure - USD ($)
Jul. 31, 2026
Aug. 01, 2025
Aug. 02, 2024
Jul. 28, 2023
Jul. 29, 2022
Pay Versus Performance
Pursuant to Section 953(a) of the Dodd-Frank Act and Item 402(v) of SEC Regulation S-K, we are providing the following information about the relationship between executive “compensation actually paid” (or “CAP”) to the Company’s principal executive officer (“PEO”) and non-PEO named executive officers (the “Non-PEO NEOs”) and certain aspects of the financial performance of the Company. The Compensation Committee has not historically and does not utilize CAP as the basis for making compensation decisions. For further information concerning our compensation philosophy and how we align executive compensation with our performance, please see our Compensation Discussion & Analysis.
Pay Versus Performance Table
| Year(1) | | | Summary Compensation Table Total for PEO(2)(7) | | | Summary Compensation Table Total for Former PEO(2)(7) | | | Compensation Actually Paid to PEO(3) | | | Compensation Actually Paid to Former PEO(3) | | | Average Summary Compensation Table Total for Non-PEO NEOs(2)(7) | | | Average Compensation Actually Paid to Non-PEO NEOs(3) | | | Value of Initial Fixed $100 Investment Based on:(4) | | | GAAP Net Income ($mil.) | | | Adjusted EBITDA(6) ($mil.) | | |||||||||||||||||||||||||||||||||
| | Cracker Barrel Total Shareholder Return | | | Peer Group Total Shareholder Return(5) | | ||||||||||||||||||||||||||||||||||||||||||||||||||||||||
| FY2026 | | | | $ | 6,928,561 | | | | | | | | | | $ | 5,493,431 | | | | | | | | | | $ | 1,683,903 | | | | | $ | 1,015,421 | | | | | $ | 51 | | | | | $ | 150 | | | | | $ | 31.7 | | | | | $ | 196.4 | | | ||
| FY2025 | | | | $ | 6,362,615 | | | | | | | | | | $ | 8,008,930 | | | | | | | | | | $ | 1,664,873 | | | | | $ | 2,133,764 | | | | | $ | 52 | | | | | $ | 157 | | | | | $ | 46.4 | | | | | $ | 227.8 | | | ||
| FY2024 | | | | $ | 6,683,711 | | | | | $ | 8,031,417 | | | | | $ | 4,666,545 | | | | | $ | 2,541,766 | | | | | $ | 1,808,547 | | | | | $ | 667,303 | | | | | $ | 36 | | | | | $ | 150 | | | | | $ | 40.9 | | | | | $ | 211.6 | | |
| FY2023 | | | | | | | | | $ | 8,271,679 | | | | | | | | | | $ | 6,097,940 | | | | | $ | 2,324,897 | | | | | $ | 1,996,219 | | | | | $ | 76 | | | | | $ | 106 | | | | | $ | 99.1 | | | | | $ | 252.3 | | | ||
| FY2022 | | | | | | | | | $ | 6,964,276 | | | | | | | | | | $ | 2,980,818 | | | | | $ | 1,207,463 | | | | | $ | 820,067 | | | | | $ | 73 | | | | | $ | 85 | | | | | $ | 131.9 | | | | | $ | 264.8 | | | ||
(1)
Julie Masino has been the PEO since she succeeded the former PEO, Sandra B. Cochran, on November 1, 2023, during Fiscal Year 2024. Sandra B. Cochran served as the PEO for Fiscal Years 2022-2023 and part of Fiscal Year 2024 until she retired on November 1, 2023. Our Non-PEO NEOs for the applicable fiscal years were as follows:
FY2026: Craig Pommells, Douglas Hisel, Richard Wolfson, Bruce Hoffmeister, and Donna Roberts
FY2025: Craig Pommells, Richard Wolfson, Cammie Spillyards-Schaefer, and Laura Daily
FY2024: Craig Pommells, Donna Roberts, Richard Wolfson, and Laura Daily
FY2023: Craig Pommells, Cammie Spillyards-Schaefer, Laura Daily, and Richard Wolfson
FY2022: P. Douglas Couvillion, Craig Pommells, Richard Wolfson, Jennifer Tate, and Laura Daily
(2)
Amounts reported in these columns represent (i) the total compensation reported in the Summary Compensation Table (“SCT”) for the applicable year in the case of our current PEO, Ms. Masino, (ii) our former PEO, Ms. Cochran, and (iii) the average of the total compensation reported in the SCT for the applicable year for our Non-PEO NEOs reported for the applicable year.
(3)
Amounts reported in these columns represent compensation actually paid; adjustments were made to the amounts reported in the Summary Compensation Table for the applicable year. A reconciliation of the adjustments for our current PEO, Ms. Masino, former PEO, Ms. Cochran, and for the average of the Non-PEO NEOs is set forth in the following table, which describes the adjustments, each of which is prescribed by the SEC rules, to calculate the CAP Amounts from SCT amounts.
| | | | Fiscal Year 2026 | | | Fiscal Year 2025 | | | Fiscal Year 2024 | | | Fiscal Year 2023 | | | Fiscal Year 2022 | | |||||||||||||||||||||||||||||||||||||||||||||||||||
| | | | PEO (Masino) | | | Average Non-PEO NEOs | | | PEO (Masino) | | | Average Non-PEO NEOs | | | PEO (Masino) | | | PEO (Cochran) | | | Average Non-PEO NEOs | | | PEO (Cochran) | | | Average Non-PEO NEOs | | | PEO (Cochran) | | | Average Non-PEO NEOs | | |||||||||||||||||||||||||||||||||
| Summary Compensation Table Total | | | | $ | 6,928,561 | | | | | $ | 1,683,903 | | | | | $ | 6,362,615 | | | | | $ | 1,664,873 | | | | | $ | 6,683,711 | | | | | $ | 8,031,417 | | | | | $ | 1,808,547 | | | | | $ | 8,271,679 | | | | | $ | 2,324,897 | | | | | $ | 6,964,276 | | | | | $ | 1,207,463 | | |
| Minus Change in Pension Value Reported in SCT for the Fiscal Year | | | | $ | 0 | | | | | $ | 0 | | | | | $ | 0 | | | | | $ | 0 | | | | | $ | 0 | | | | | $ | 0 | | | | | $ | 0 | | | | | $ | 0 | | | | | $ | 0 | | | | | $ | 0 | | | | | $ | 0 | | |
| Plus Pension Value Service Cost for the Fiscal Year | | | | $ | 0 | | | | | $ | 0 | | | | | $ | 0 | | | | | $ | 0 | | | | | $ | 0 | | | | | $ | 0 | | | | | $ | 0 | | | | | $ | 0 | | | | | $ | 0 | | | | | $ | 0 | | | | | $ | 0 | | |
| Minus Stock Award Value & Option Award Value Reported in SCT for the Fiscal Year | | | | $ | 4,634,925 | | | | | $ | 831,687 | | | | | $ | 3,810,907 | | | | | $ | 679,443 | | | | | $ | 4,049,864 | | | | | $ | 4,699,975 | | | | | $ | 874,442 | | | | | $ | 4,985,393 | | | | | $ | 1,492,391 | | | | | $ | 4,878,994 | | | | | $ | 674,621 | | |
| Plus Year End Fair Value of Equity Awards Granted During the Covered Year that Remain Outstanding and Unvested as of Last Day of the Fiscal Year | | | | $ | 6,097,156 | | | | | $ | 670,972 | | | | | $ | 4,130,694 | | | | | $ | 654,480 | | | | | $ | 2,032,698 | | | | | $ | 2,380,843 | | | | | $ | 468,286 | | | | | $ | 2,828,906 | | | | | $ | 1,149,961 | | | | | $ | 2,957,590 | | | | | $ | 416,251 | | |
| Plus Year over Year Change in Fair Value as of the Last Day of the Fiscal Year of Outstanding and Unvested Equity Awards Granted in Prior Fiscal Years | | | | $ | (2,483,499) | | | | | $ | (320,211) | | | | | $ | 1,335,064 | | | | | $ | 478,156 | | | | | $ | 0 | | | | | $ | (2,291,687) | | | | | $ | (673,518) | | | | | $ | (67,220) | | | | | $ | (7,090) | | | | | $ | (2,127,771) | | | | | $ | (182,339) | | |
| Plus Fair Value as of Vesting Date of Equity Awards Granted and Vested in the Fiscal Year | | | | $ | 0 | | | | | $ | 0 | | | | | $ | 0 | | | | | $ | 0 | | | | | $ | 0 | | | | | $ | 0 | | | | | $ | 0 | | | | | $ | 0 | | | | | $ | 15,854 | | | | | $ | 0 | | | | | $ | 41,473 | | |
| Plus Year over Year Change in Fair Value as of the Vesting Date of Equity Awards Granted in Prior Fiscal Years that Vested During the Fiscal Year | | | | $ | (413,862) | | | | | $ | (130,067) | | | | | $ | (8,537) | | | | | $ | 15,697 | | | | | $ | 0 | | | | | $ | (878,832) | | | | | $ | (61,569) | | | | | $ | 49,968 | | | | | $ | 4,988 | | | | | $ | 65,717 | | | | | $ | 11,841 | | |
| Minus Fair Value at the End of the Prior Year of Equity Awards that Failed to Meet Vesting Conditions in the Fiscal Year (including equity forfeited) | | | | $ | 0 | | | | | $ | 57,489 | | | | | $ | 0 | | | | | $ | 0 | | | | | $ | 0 | | | | | $ | 0 | | | | | $ | 0 | | | | | $ | 0 | | | | | $ | 0 | | | | | $ | 0 | | | | | $ | 0 | | |
| Plus Value of Dividends or other Earnings Paid on Stock or Option Awards Not Otherwise Reflected in Fair Value or Total Compensation for the Fiscal Year | | | | $ | 0 | | | | | $ | 0 | | | | | $ | 0 | | | | | $ | 0 | | | | | $ | 0 | | | | | $ | 0 | | | | | $ | 0 | | | | | $ | 0 | | | | | $ | 0 | | | | | $ | 0 | | | | | $ | 0 | | |
| Compensation Actually Paid | | | | $ | 5,493,431 | | | | | $ | 1,015,421 | | | | | $ | 8,008,930 | | | | | $ | 2,133,764 | | | | | $ | 4,666,545 | | | | | $ | 2,541,766 | | | | | $ | 667,303 | | | | | $ | 6,097,940 | | | | | $ | 1,996,219 | | | | | $ | 2,980,818 | | | | | $ | 820,067 | | |
In the table above, the unvested equity values are computed in accordance with the methodology used for financial reporting purposes, and for unvested awards subject to performance-based vesting conditions, based on the probable outcome of such performance-based vesting conditions as of the last day of the year.
(4)
Total Shareholder Return (TSR) is cumulative for the measurement periods beginning on July 30, 2021 and ending on each of our 2022, 2023, 2024, 2025, and 2026 fiscal year ends, respectively, calculated in accordance with Item 201(e) of Regulation S-K.
(5)
“Peer Group” represents the S&P 400 Restaurants Index, which is used by the Company for purposes of compliance with Item 201(e) of Regulation S-K.
(6)
Adjusted EBITDA is our company-selected measure. Values shown reflect adjusted EBITDA as calculated for purposes of our Annual Bonus Plan for the applicable reporting fiscal year. Adjusted EBITDA is a non-GAAP financial measure. For a definition of adjusted EBITDA and a reconciliation of this non-GAAP financial measure to the most comparable GAAP financial measure, and an explanation of why we believe adjusted EBITDA presents useful information to investors, see Appendix A.
(7)
Dividend equivalents which were or will be paid to NEOs upon vesting of LTPP awards, time-based RSU grants, or other time-based RSA grants that vested or were unvested as of the end of each fiscal year end are included in the Summary Compensation Table; see footnote 2 of the All Other Compensation table for an explanation.
(1)
Julie Masino has been the PEO since she succeeded the former PEO, Sandra B. Cochran, on November 1, 2023, during Fiscal Year 2024. Sandra B. Cochran served as the PEO for Fiscal Years 2022-2023 and part of Fiscal Year 2024 until she retired on November 1, 2023. Our Non-PEO NEOs for the applicable fiscal years were as follows:
FY2026: Craig Pommells, Douglas Hisel, Richard Wolfson, Bruce Hoffmeister, and Donna Roberts
FY2025: Craig Pommells, Richard Wolfson, Cammie Spillyards-Schaefer, and Laura Daily
FY2024: Craig Pommells, Donna Roberts, Richard Wolfson, and Laura Daily
FY2023: Craig Pommells, Cammie Spillyards-Schaefer, Laura Daily, and Richard Wolfson
FY2022: P. Douglas Couvillion, Craig Pommells, Richard Wolfson, Jennifer Tate, and Laura Daily
(5)
“Peer Group” represents the S&P 400 Restaurants Index, which is used by the Company for purposes of compliance with Item 201(e) of Regulation S-K.
(2)
Amounts reported in these columns represent (i) the total compensation reported in the Summary Compensation Table (“SCT”) for the applicable year in the case of our current PEO, Ms. Masino, (ii) our former PEO, Ms. Cochran, and (iii) the average of the total compensation reported in the SCT for the applicable year for our Non-PEO NEOs reported for the applicable year.
(3)
Amounts reported in these columns represent compensation actually paid; adjustments were made to the amounts reported in the Summary Compensation Table for the applicable year. A reconciliation of the adjustments for our current PEO, Ms. Masino, former PEO, Ms. Cochran, and for the average of the Non-PEO NEOs is set forth in the following table, which describes the adjustments, each of which is prescribed by the SEC rules, to calculate the CAP Amounts from SCT amounts.
| | | | Fiscal Year 2026 | | | Fiscal Year 2025 | | | Fiscal Year 2024 | | | Fiscal Year 2023 | | | Fiscal Year 2022 | | |||||||||||||||||||||||||||||||||||||||||||||||||||
| | | | PEO (Masino) | | | Average Non-PEO NEOs | | | PEO (Masino) | | | Average Non-PEO NEOs | | | PEO (Masino) | | | PEO (Cochran) | | | Average Non-PEO NEOs | | | PEO (Cochran) | | | Average Non-PEO NEOs | | | PEO (Cochran) | | | Average Non-PEO NEOs | | |||||||||||||||||||||||||||||||||
| Summary Compensation Table Total | | | | $ | 6,928,561 | | | | | $ | 1,683,903 | | | | | $ | 6,362,615 | | | | | $ | 1,664,873 | | | | | $ | 6,683,711 | | | | | $ | 8,031,417 | | | | | $ | 1,808,547 | | | | | $ | 8,271,679 | | | | | $ | 2,324,897 | | | | | $ | 6,964,276 | | | | | $ | 1,207,463 | | |
| Minus Change in Pension Value Reported in SCT for the Fiscal Year | | | | $ | 0 | | | | | $ | 0 | | | | | $ | 0 | | | | | $ | 0 | | | | | $ | 0 | | | | | $ | 0 | | | | | $ | 0 | | | | | $ | 0 | | | | | $ | 0 | | | | | $ | 0 | | | | | $ | 0 | | |
| Plus Pension Value Service Cost for the Fiscal Year | | | | $ | 0 | | | | | $ | 0 | | | | | $ | 0 | | | | | $ | 0 | | | | | $ | 0 | | | | | $ | 0 | | | | | $ | 0 | | | | | $ | 0 | | | | | $ | 0 | | | | | $ | 0 | | | | | $ | 0 | | |
| Minus Stock Award Value & Option Award Value Reported in SCT for the Fiscal Year | | | | $ | 4,634,925 | | | | | $ | 831,687 | | | | | $ | 3,810,907 | | | | | $ | 679,443 | | | | | $ | 4,049,864 | | | | | $ | 4,699,975 | | | | | $ | 874,442 | | | | | $ | 4,985,393 | | | | | $ | 1,492,391 | | | | | $ | 4,878,994 | | | | | $ | 674,621 | | |
| Plus Year End Fair Value of Equity Awards Granted During the Covered Year that Remain Outstanding and Unvested as of Last Day of the Fiscal Year | | | | $ | 6,097,156 | | | | | $ | 670,972 | | | | | $ | 4,130,694 | | | | | $ | 654,480 | | | | | $ | 2,032,698 | | | | | $ | 2,380,843 | | | | | $ | 468,286 | | | | | $ | 2,828,906 | | | | | $ | 1,149,961 | | | | | $ | 2,957,590 | | | | | $ | 416,251 | | |
| Plus Year over Year Change in Fair Value as of the Last Day of the Fiscal Year of Outstanding and Unvested Equity Awards Granted in Prior Fiscal Years | | | | $ | (2,483,499) | | | | | $ | (320,211) | | | | | $ | 1,335,064 | | | | | $ | 478,156 | | | | | $ | 0 | | | | | $ | (2,291,687) | | | | | $ | (673,518) | | | | | $ | (67,220) | | | | | $ | (7,090) | | | | | $ | (2,127,771) | | | | | $ | (182,339) | | |
| Plus Fair Value as of Vesting Date of Equity Awards Granted and Vested in the Fiscal Year | | | | $ | 0 | | | | | $ | 0 | | | | | $ | 0 | | | | | $ | 0 | | | | | $ | 0 | | | | | $ | 0 | | | | | $ | 0 | | | | | $ | 0 | | | | | $ | 15,854 | | | | | $ | 0 | | | | | $ | 41,473 | | |
| Plus Year over Year Change in Fair Value as of the Vesting Date of Equity Awards Granted in Prior Fiscal Years that Vested During the Fiscal Year | | | | $ | (413,862) | | | | | $ | (130,067) | | | | | $ | (8,537) | | | | | $ | 15,697 | | | | | $ | 0 | | | | | $ | (878,832) | | | | | $ | (61,569) | | | | | $ | 49,968 | | | | | $ | 4,988 | | | | | $ | 65,717 | | | | | $ | 11,841 | | |
| Minus Fair Value at the End of the Prior Year of Equity Awards that Failed to Meet Vesting Conditions in the Fiscal Year (including equity forfeited) | | | | $ | 0 | | | | | $ | 57,489 | | | | | $ | 0 | | | | | $ | 0 | | | | | $ | 0 | | | | | $ | 0 | | | | | $ | 0 | | | | | $ | 0 | | | | | $ | 0 | | | | | $ | 0 | | | | | $ | 0 | | |
| Plus Value of Dividends or other Earnings Paid on Stock or Option Awards Not Otherwise Reflected in Fair Value or Total Compensation for the Fiscal Year | | | | $ | 0 | | | | | $ | 0 | | | | | $ | 0 | | | | | $ | 0 | | | | | $ | 0 | | | | | $ | 0 | | | | | $ | 0 | | | | | $ | 0 | | | | | $ | 0 | | | | | $ | 0 | | | | | $ | 0 | | |
| Compensation Actually Paid | | | | $ | 5,493,431 | | | | | $ | 1,015,421 | | | | | $ | 8,008,930 | | | | | $ | 2,133,764 | | | | | $ | 4,666,545 | | | | | $ | 2,541,766 | | | | | $ | 667,303 | | | | | $ | 6,097,940 | | | | | $ | 1,996,219 | | | | | $ | 2,980,818 | | | | | $ | 820,067 | | |
In the table above, the unvested equity values are computed in accordance with the methodology used for financial reporting purposes, and for unvested awards subject to performance-based vesting conditions, based on the probable outcome of such performance-based vesting conditions as of the last day of the year.
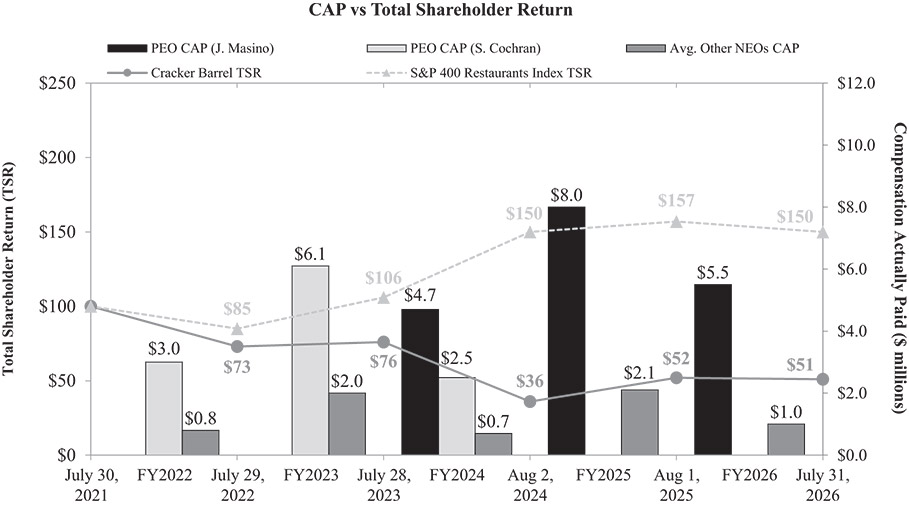
Relationship between CAP and TSR. The graph below illustrates the relationship between our TSR and the Peer Group TSR, as well as the relationship between CAP for the current and former PEO and Non-PEO NEOs and our TSR.
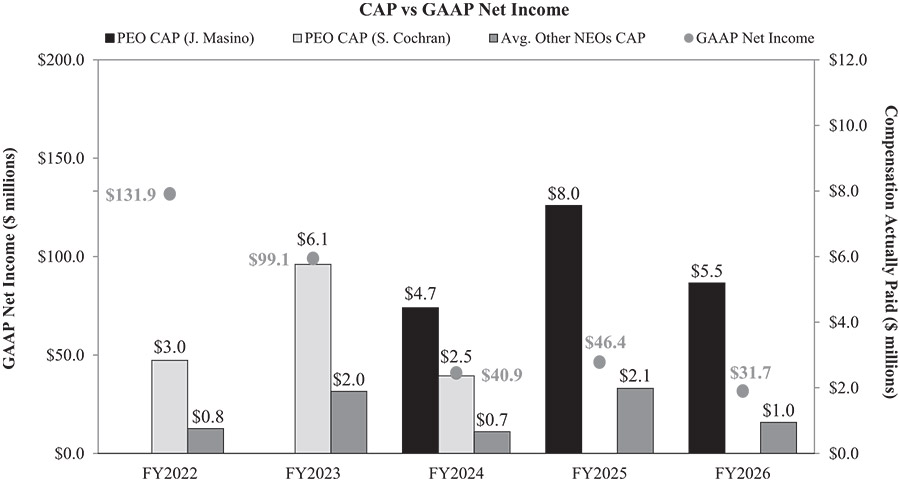
Relationship between CAP and GAAP Net Income. The graph below reflects the relationship between the current and former PEO and Average Non-PEO NEOs CAP and our GAAP Net Income.
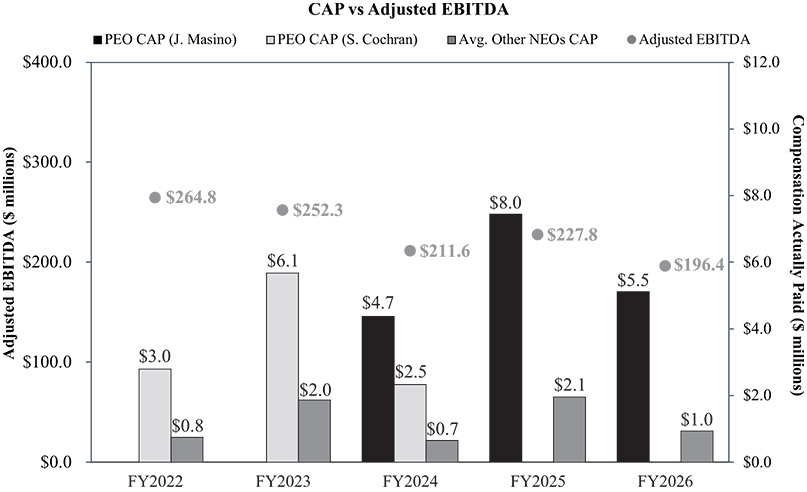
Relationship between CAP and Adjusted EBITDA (our Company-Selected Measure). The graph below reflects the relationship between the current and former PEO and Average Non-PEO NEOs CAP and the Company’s Adjusted EBITDA.
Relationship between CAP and TSR. The graph below illustrates the relationship between our TSR and the Peer Group TSR, as well as the relationship between CAP for the current and former PEO and Non-PEO NEOs and our TSR.
Performance Measures Used to Link Company Performance and CAP. The following is a list of performance measures, which in our assessment represent the most important performance measures used by the Company to link compensation actually paid to the named executive officers for Fiscal 2026. Each metric below is used for purposes of determining payouts under either our annual incentive program or vesting of our performance stock units. Please see the CD&A for a further description of these metrics and how they are used in the Company’s executive compensation program.
Adjusted EBITDA (CSM)
Adjusted Operating Income
Total Shareholder Return
Adjusted Operating Income
Total Shareholder Return
(6)
Adjusted EBITDA is our company-selected measure. Values shown reflect adjusted EBITDA as calculated for purposes of our Annual Bonus Plan for the applicable reporting fiscal year. Adjusted EBITDA is a non-GAAP financial measure. For a definition of adjusted EBITDA and a reconciliation of this non-GAAP financial measure to the most comparable GAAP financial measure, and an explanation of why we believe adjusted EBITDA presents useful information to investors, see Appendix A.