Pay Versus Performance
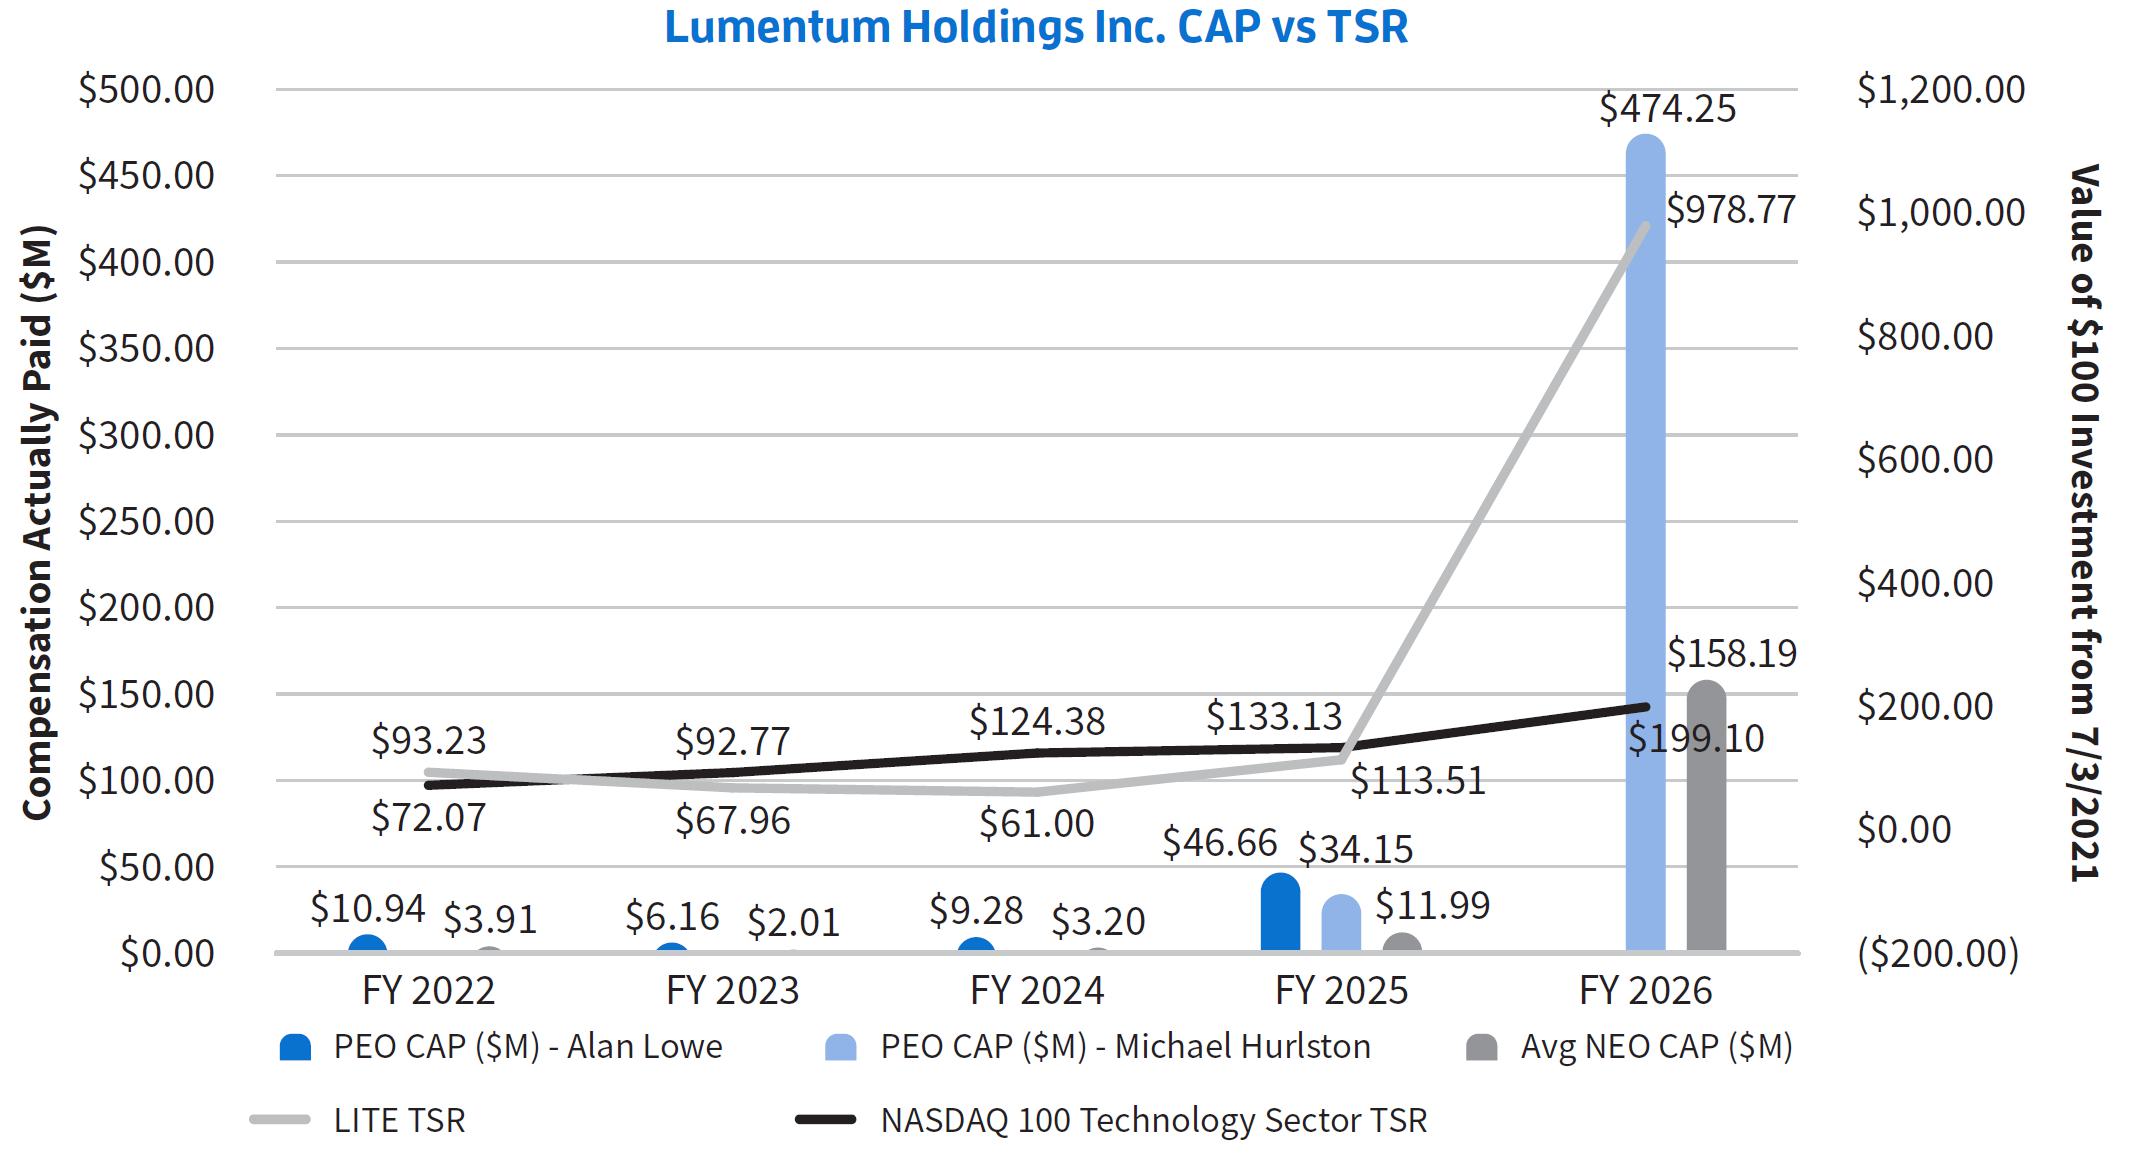
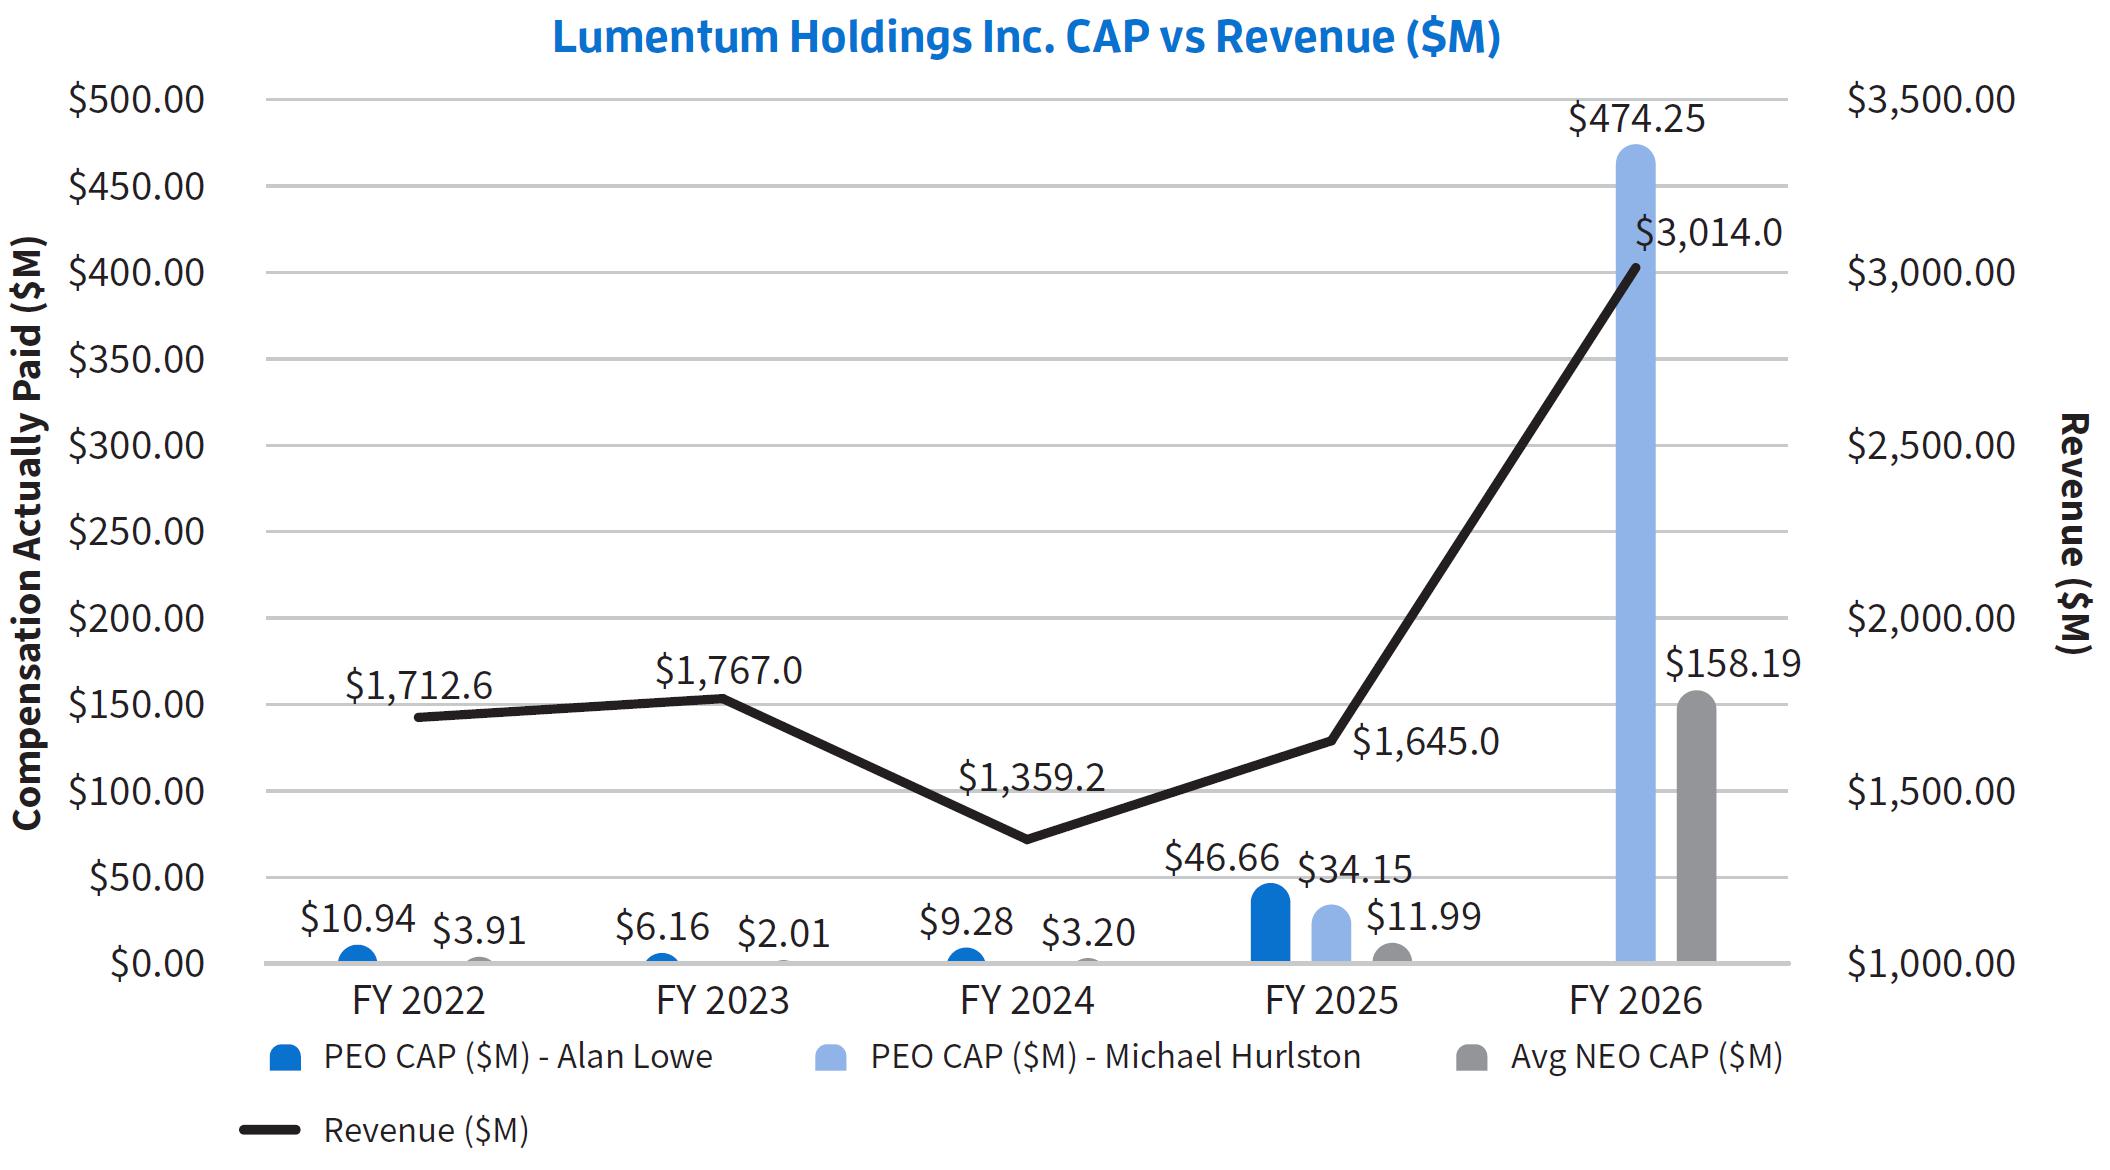
The following table shows the total compensation for our NEOs for the past five fiscal years as set forth in the Summary Compensation Table, the “compensation actually paid” to our PEO (Michael Hurlston, Chief Executive Officer since 2025), former PEO (Alan Lowe, Chief Executive Officer from 2015 to 2025) and on an average basis, our other NEOs (in each case, as determined under SEC rules), our TSR, our prior peer group TSR (NASDAQ 100 Technology Sector Index), our net income, and revenue.
| Alan Lowe | Michael Hurlston | |||||||||||||||||||
| Fiscal Year | Summary Compensation Table Total for PEO(1) | Compensation Actually Paid to PEO(2) | Summary Compensation Table Total for PEO(1) | Compensation Actually Paid to PEO(2) | Average Summary Compensation Table Total for non-PEO NEOs(3) | Average Compensation Actually Paid to non-PEO NEOs(2) | Total Shareholder Return(4) | Peer
Group Total Shareholder Return(4) | Net Income ($M)(5) | Revenue(6) | ||||||||||
| (a) | (b) | (c) | (d) | (e) | (f) | (g) | (h) | (i) | (j) | (k) | ||||||||||
| 2026 | – | – | $15,392,731 | $474,253,106 | $7,552,226 | $158,186,747 | $978.77 | $199.10 | ($6,935.10) | $3,014.0 | ||||||||||
| 2025 | $46,407,285 | $46,661,132 | $27,670,076 | $34,152,996 | $4,614,066 | $11,993,836 | $113.51 | $133.13 | $25.90 | $1,645.0 | ||||||||||
| 2024 | $12,077,066 | $9,284,053 | – | – | $3,864,547 | $3,201,388 | $61.00 | $124.38 | ($546.50) | $1,359.2 | ||||||||||
| 2023 | $13,905,732 | $6,157,896 | – | – | $4,514,349 | $2,014,899 | $67.96 | $92.77 | ($131.60) | $1,767.0 | ||||||||||
| 2022 | $10,793,744 | $10,940,691 | – | – | $3,837,309 | $3,910,681 | $93.23 | $72.07 | $198.90 | $1,712.6 | ||||||||||
| (1) | The dollar amounts reported in columns (b) and (d) are the amounts of total compensation reported for PEO (Hurlston) and former PEO (Lowe) for each corresponding year in the “Total” column of the Summary Compensation Table. Refer to “Executive Compensation – Executive Compensation Tables – Summary Compensation Table” above. |
| (4) | TSR determined in Column (h) is based on the value of an initial fixed investment of $100 in LITE as of July 4, 2021. TSR determined in Column (i) is based on the value of an initial fixed investment of $100 in the NASDAQ 100 Technology Sector Index as of July 4, 2021. |
| (2) | The dollar amounts reported in columns (c), (e), and (g) represent the amount of “compensation actually paid” (otherwise known as CAP), as computed in accordance with SEC rules. “Compensation actually paid” does not necessarily represent cash and/or equity value transferred to the applicable NEO without restriction, but rather is a value calculated under applicable SEC rules. We do not have a defined benefit plan so no adjustment for pension benefits is included in the table below. Similarly, no adjustment is made for dividends as dividends are factored into the fair value of the award. The following table details these adjustments: |
| The following table details these adjustments for each fiscal year for our PEO and for our non-PEO NEOs on average: |
| Fiscal Year |
Summary Compensation Table Total (a) |
Subtract Grant Date Fair Value of Stock Awards (b) |
Add Fair Value at Fiscal Year-end of Outstanding and Unvested Options Awards and Stock Awards Granted in Fiscal Year (i) |
Adjust for Change in Fair Value of Outstanding and Unvested Option Awards and Stock Awards Granted in Prior Fiscal Years (ii) |
Add Fair Value at Vesting of Option Awards and Stock Awards Granted in Fiscal Year that Vested During Fiscal Year (iii) |
Adjust for Change in Fair Value of Outstanding Option Awards and Stock Awards Granted in Prior Fiscal Years for Which Applicable Vesting Conditions Were Satisfied During Fiscal Year (iv) |
Subtract Fair Value of Prior Fiscal Year-End of Option Awards and Stock Awards Granted in Prior Fiscal Years that Failed to Meet Applicable Vesting Conditions During Fiscal Year (v) |
CAP (c) | |||||||||||
| 2026 | PEO Michael Hurlston | $15,392,731 | ($12,291,577) | $136,629,103 | $308,574,169 | $0 | $25,948,680 | $0 | $474,253,106 | ||||||||||
| Non-PEO NEOs | $7,552,226 | ($6,114,924) | $53,958,828 | $95,851,291 | $0 | $7,847,978 | ($908,653) | $158,186,747 |
| (a) | The dollar amounts reported in the Summary Compensation Table for the applicable year. |
| (b) | The grant date fair value of equity awards represents the total of the amounts reported in the “Stock Awards” column in the Summary Compensation Table for the applicable year. (i-v) The recalculated value of equity awards for each applicable year includes the addition (or subtraction, as applicable) of the following: |
| (i) | Fair Value at Fiscal Year-End of Outstanding and Unvested Option Awards and Stock Awards Granted in Fiscal Year; |
| (ii) | Change in Fair Value of Outstanding and Unvested Option Awards and Stock Awards Granted in Prior Fiscal Years from the end of the prior Fiscal Year to the end of the current Fiscal Year; |
| (iii) | Change in Fair Value as of Vesting Date (compared to prior Fiscal Year End) of Option Awards and Stock Awards Granted in the Current Year and Prior Fiscal Years For Which Applicable Vesting Conditions Were Satisfied During Fiscal Year; (iv) Fair Value at Vesting Date of Option Awards and Stock Awards Granted in Fiscal Year; |
| (v) | Fair Value as of Prior Fiscal Year-End of Option Awards and Stock Awards Granted in Prior Fiscal Years That Failed to Meet Applicable Vesting Conditions During Fiscal Year. |
| (c) | “Compensation Actually Paid” does not necessarily represent cash and/or equity value transferred to the applicable NEO without restriction, but rather is a value calculated under applicable SEC rules. |
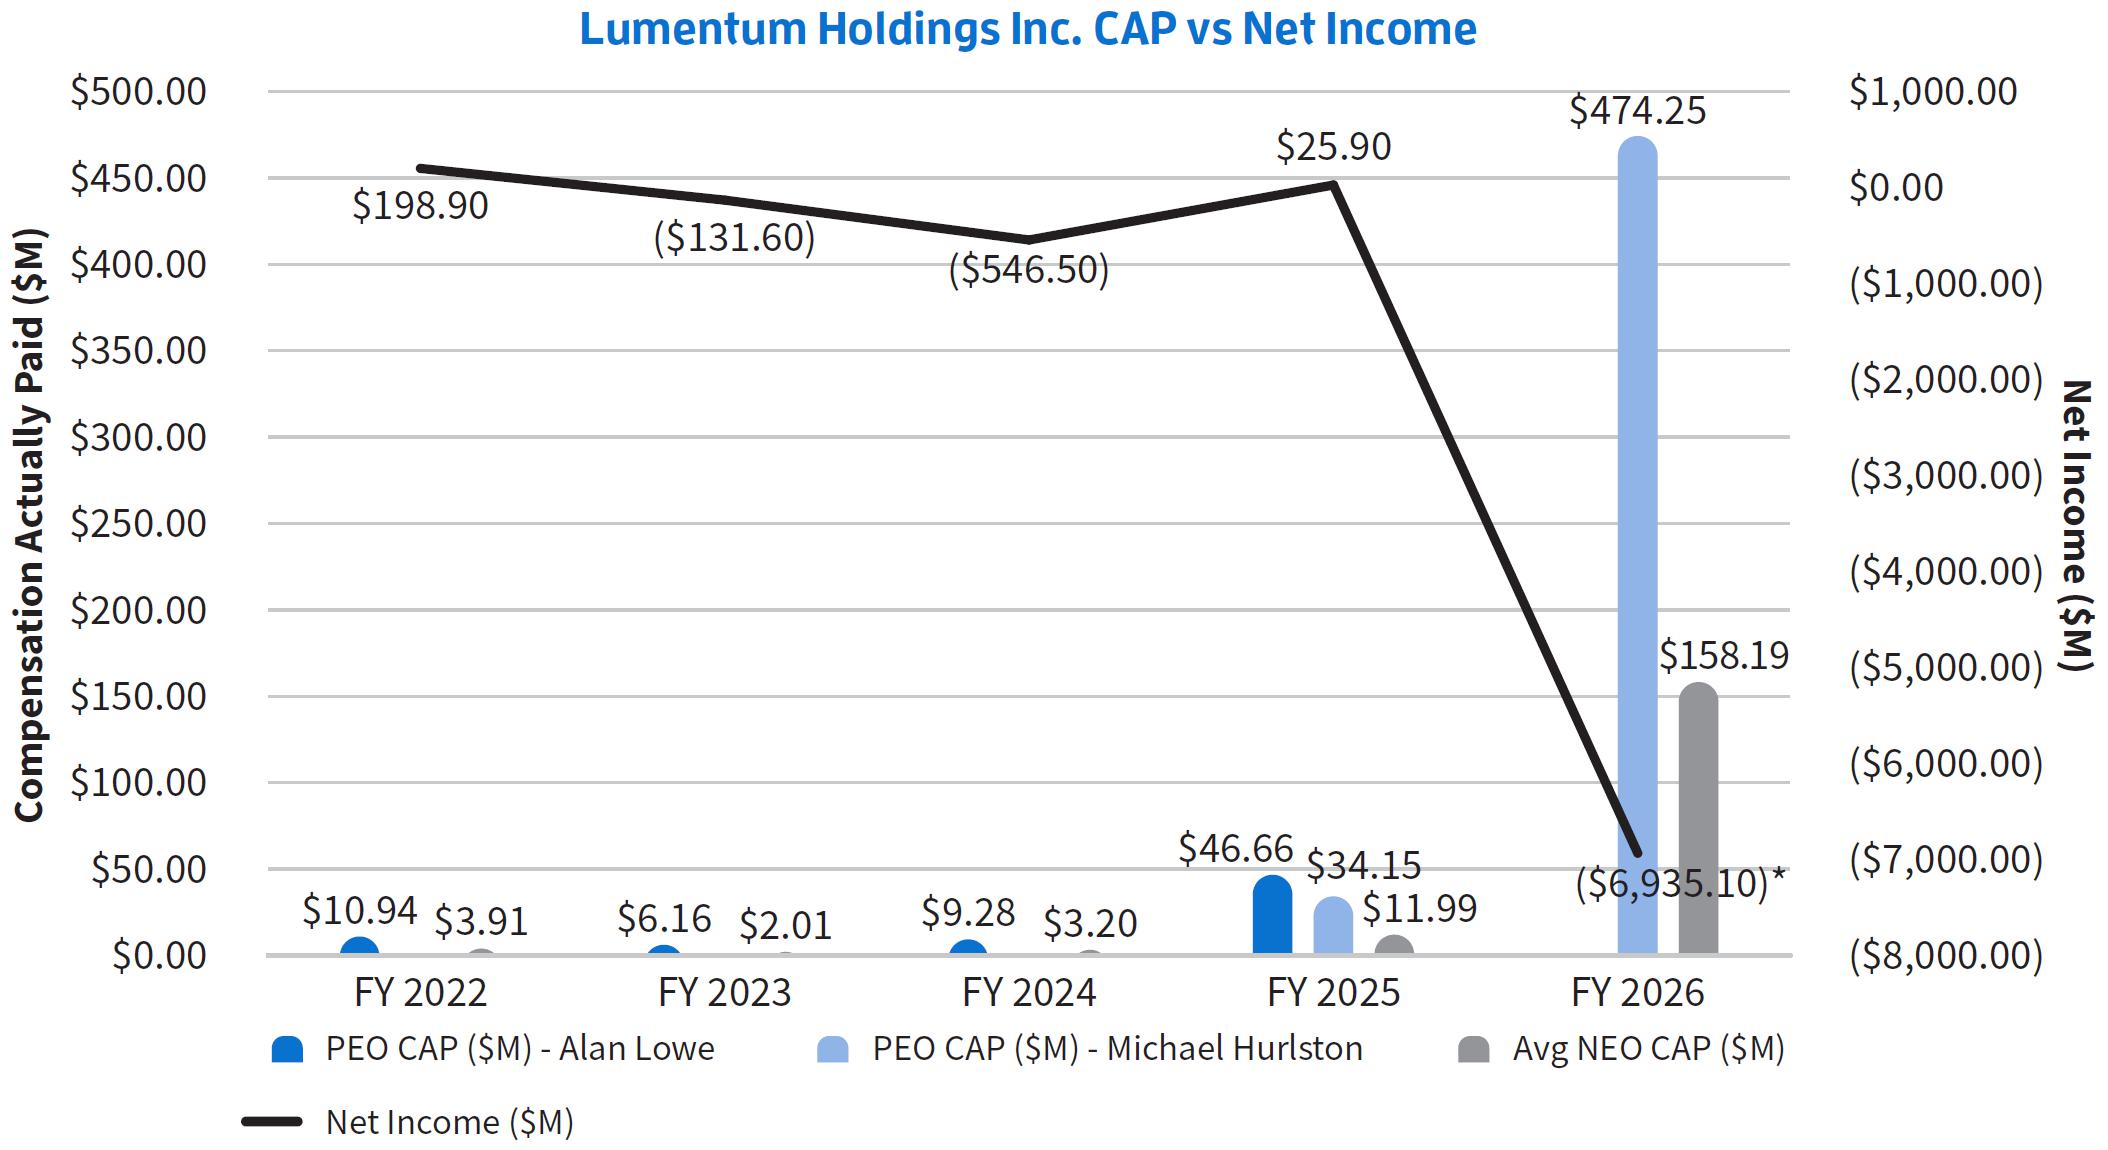
| * | The GAAP net loss for fiscal year 2026 was driven by the equalization of certain amounts of our convertible notes in the fourth quarter of fiscal year 2026, which contributed to a one-time, non-cash loss on debt extinguishment of $7.8 billion. |
Performance Measures
A mix of performance measures are used in order to align executive pay with Company performance. As required by SEC rules, the performance measures identified as the most important for NEOs’ 2026 compensation decisions are listed in the table below, each of which is described in more detail in the CD&A.
| Most Important Performance Measures Driving Compensation Actually Paid |
| Revenue |
| Gross Margin |
| Operating Income |
| Earnings per Share |
| (6) | Lumentum selected Revenue as its Company Selected Measure, which is the most important financial measure that links Company performance with Compensation Actually Paid. Dollar amounts in Column (k) are LITE’s GAAP revenue for each fiscal year (in millions). |