Shareholder Report
Jul. 31, 2026
USD ($)
Holding
This report describes changes to the Fund that occurred during the reporting period.
What were the Fund costs for the period since inception? (based on a hypothetical $10,000 investment)
| Cost of a $10,000 investment | Costs paid as a percentage of $10,000 investment* | |||
| ETF Class Shares |
$59 | 0.59% | ||
| * | Annualized for period less than one year. |
How did the Fund perform since inception? What affected the Fund’s performance?
| Performance Highlights The Nuveen Dividend Growth Fund returned 1.60% for ETF Shares at net asset value (NAV) for the abbreviated reported period since the share class launched on June 2, 2026, through July 31, 2026. The Fund outperformed the S&P 500 Index, which returned –1.41%. Top contributors to relative performance • Out‑of‑benchmark position in Taiwan Semiconductor Manufacturing Co., Ltd. • Overweight to Amphenol Corporation. • Underweight and security selection in the consumer discretionary sector, including an overweight to TJX Companies Inc. and lack of exposure to Tesla, Inc. Top detractors from relative performance • Security selection in the information technology sector, including an overweight to Accenture Plc and lack of exposure to Micron Technology, Inc. and Advanced Micro Devices, Inc. • Underweight to Alphabet Inc. • Security selection and an overweight to the financials sector, including overweights to Ares Management Corporation and S&P Global, Inc. • Security selection in the health care sector, including overweights to Zoetis, Inc. and Abbott Laboratories. |
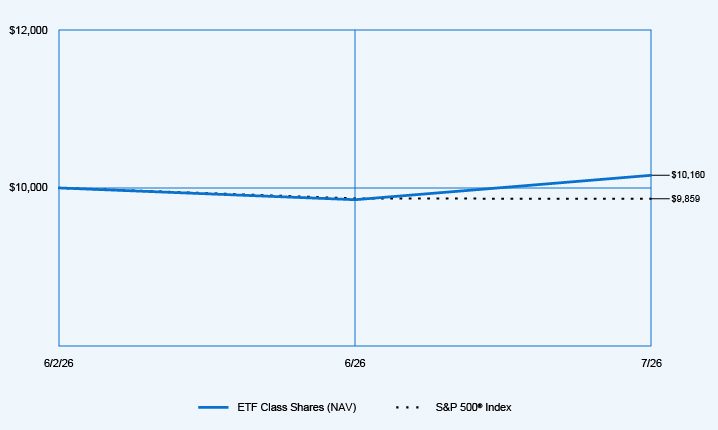
Cumulative Total Returns
| Since Inception (6/2/26) |
||||
| ETF Class Shares (NAV) |
1.60 | % | ||
| S&P 500® Index |
(1.41 | )% | ||
| Lipper Equity Income Funds Classification Average |
2.95 | % | ||
Fund Statistics (as of July 31, 2026)
| Fund net assets |
$ | 6,311,929,958 | ||
| Total number of portfolio holdings |
45 | |||
| Portfolio turnover (%) |
20% | |||
| Total management fees paid for the year |
$ | 38,204,244 | ||
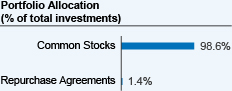 |
How has the Fund changed?
Portfolio manager update(s): Effective April 30, 2026, Charles Carr was added as a portfolio manager of the Fund.
For more complete information, you may review the Fund’s next prospectus, which is expected to be available by November 30, 2026 at https://www.nuveen.com/en‑us/exchange‑traded‑funds/prospectuses or upon request at (800) 257‑8787.
For more complete information, you may review the Fund’s next prospectus, which is expected to be available by November 30, 2026 at https://www.nuveen.com/en‑us/exchange‑traded‑funds/prospectuses or upon request at (800) 257‑8787.
This report describes changes to the Fund that occurred during the reporting period.
What were the Fund costs for the last year? (based on a hypothetical $10,000 investment)
| Cost of a $10,000 investment | Costs paid as a percentage of $10,000 investment* | |||
| Class I Shares |
$68 | 0.65% | ||
| * | Annualized for period less than one year. |
How did the Fund perform last year? What affected the Fund’s performance?
| Performance Highlights The Nuveen Dividend Growth Fund returned 10.05% for Class I Shares at net asset value (NAV) for the 12 months ended July 31, 2026. The Fund significantly underperformed the S&P 500 Index, which returned 19.56%. Top contributors to relative performance • Out‑of‑benchmark position in Taiwan Semiconductor Manufacturing Co., Ltd. • Overweight to Amphenol Corporation. • Underweight and security selection in the consumer discretionary sector, including an overweight to TJX Companies Inc. and lack of exposure to Tesla, Inc. Top detractors from relative performance • Security selection in the information technology sector, including an overweight to Accenture Plc and lack of exposure to Micron Technology, Inc. and Advanced Micro Devices, Inc. • Underweight to Alphabet Inc. • Security selection and an overweight to the financials sector, including overweights to Ares Management Corporation and S&P Global, Inc. • Security selection in the health care sector, including overweights to Zoetis, Inc. and Abbott Laboratories. |
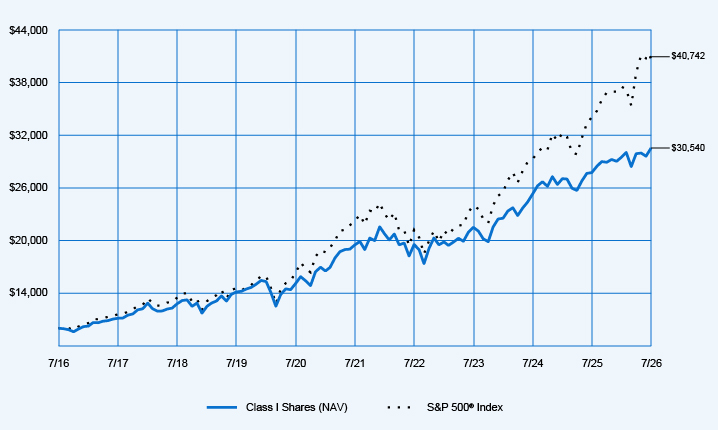
Average Annual Total Returns
| 1‑Year | 5‑Year | 10‑Year | ||||||||||
| Class I Shares (NAV) |
10.05 | % | 9.38 | % | 11.81 | % | ||||||
| S&P 500® Index |
19.56 | % | 12.86 | % | 15.08 | % | ||||||
| Lipper Equity Income Funds Classification Average |
20.18 | % | 9.85 | % | 10.59 | % | ||||||
Fund Statistics (as of July 31, 2026)
| Fund net assets |
$ | 6,311,929,958 | ||
| Total number of portfolio holdings |
45 | |||
| Portfolio turnover (%) |
20% | |||
| Total management fees paid for the year |
$ | 38,204,244 | ||
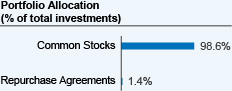 |
How has the Fund changed?
Portfolio manager update(s): Effective April 30, 2026, Charles Carr was added as a portfolio manager of the Fund.
For more complete information, you may review the Fund’s next prospectus, which is expected to be available
by November 30, 2026 at https://www.nuveen.com/en‑us/mutual‑funds/prospectuses or upon request at (800) 257-8787.
For more complete information, you may review the Fund’s next prospectus, which is expected to be available
by November 30, 2026 at https://www.nuveen.com/en‑us/mutual‑funds/prospectuses or upon request at (800) 257-8787.
This report describes changes to the Fund that occurred during the reporting period.
What were the Fund costs for the last year? (based on a hypothetical $10,000 investment)
| Cost of a $10,000 investment | Costs paid as a percentage of $10,000 investment* | |||
| Class R6 Shares |
$64 | 0.61% | ||
| * | Annualized for period less than one year. |
How did the Fund perform last year? What affected the Fund’s performance?
| Performance Highlights The Nuveen Dividend Growth Fund returned 10.09% for Class R6 Shares at net asset value (NAV) for the 12 months ended July 31, 2026. The Fund significantly underperformed the S&P 500 Index, which returned 19.56%. Top contributors to relative performance • Out‑of‑benchmark position in Taiwan Semiconductor Manufacturing Co., Ltd. • Overweight to Amphenol Corporation. • Underweight and security selection in the consumer discretionary sector, including an overweight to TJX Companies Inc. and lack of exposure to Tesla, Inc. Top detractors from relative performance • Security selection in the information technology sector, including an overweight to Accenture Plc and lack of exposure to Micron Technology, Inc. and Advanced Micro Devices, Inc. • Underweight to Alphabet Inc. • Security selection and an overweight to the financials sector, including overweights to Ares Management Corporation and S&P Global, Inc. • Security selection in the health care sector, including overweights to Zoetis, Inc. and Abbott Laboratories. |
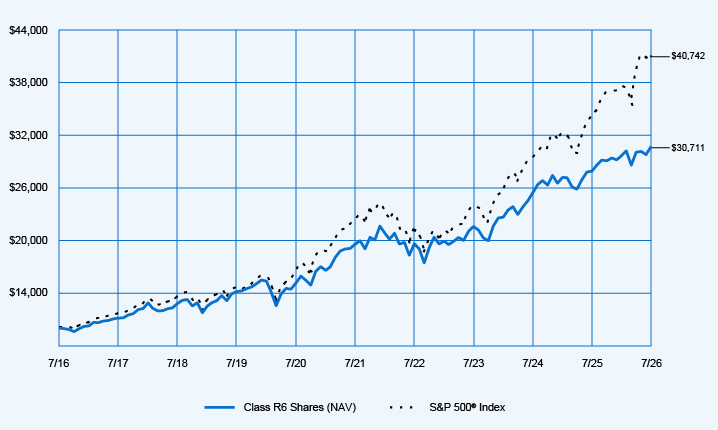
Average Annual Total Returns
| 1-Year | 5-Year | 10-Year | ||||||||||
| Class R6 Shares (NAV) |
10.09 | % | 9.44 | % | 11.87 | % | ||||||
| S&P 500® Index |
19.56 | % | 12.86 | % | 15.08 | % | ||||||
| Lipper Equity Income Funds Classification Average |
20.18 | % | 9.85 | % | 10.59 | % | ||||||
Fund Statistics (as of July 31, 2026)
| Fund net assets |
$ | 6,311,929,958 | ||
| Total number of portfolio holdings |
45 | |||
| Portfolio turnover (%) |
20% | |||
| Total management fees paid for the year |
$ | 38,204,244 | ||
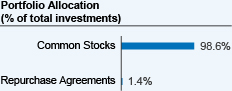 |
How has the Fund changed?
Portfolio manager update(s): Effective April 30, 2026, Charles Carr was added as a portfolio manager of the Fund.
For more complete information, you may review the Fund’s next prospectus, which is expected to be available by November 30, 2026 at https://www.nuveen.com/en‑us/mutual‑funds/prospectuses or upon request at (800) 257-8787.
For more complete information, you may review the Fund’s next prospectus, which is expected to be available by November 30, 2026 at https://www.nuveen.com/en‑us/mutual‑funds/prospectuses or upon request at (800) 257-8787.
This report describes changes to the Fund that occurred during the reporting period.
What were the Fund costs for the last year? (based on a hypothetical $10,000 investment)
| Cost of a $10,000 investment | Costs paid as a percentage of $10,000 investment* | |||
| Class C Shares |
$172 | 1.65% | ||
| * | Annualized for period less than one year. |
How did the Fund perform last year? What affected the Fund’s performance?
| Performance Highlights The Nuveen Dividend Growth Fund returned 8.96% for Class C Shares at net asset value (NAV) for the 12 months ended July 31, 2026. The Fund significantly underperformed the S&P 500 Index, which returned 19.56%. Top contributors to relative performance • Out‑of‑benchmark position in Taiwan Semiconductor Manufacturing Co., Ltd. • Overweight to Amphenol Corporation. • Underweight and security selection in the consumer discretionary sector, including an overweight to TJX Companies Inc. and lack of exposure to Tesla, Inc. Top detractors from relative performance • Security selection in the information technology sector, including an overweight to Accenture Plc and lack of exposure to Micron Technology, Inc. and Advanced Micro Devices, Inc. • Underweight to Alphabet Inc. • Security selection and an overweight to the financials sector, including overweights to Ares Management Corporation and S&P Global, Inc. • Security selection in the health care sector, including overweights to Zoetis, Inc. and Abbott Laboratories. |
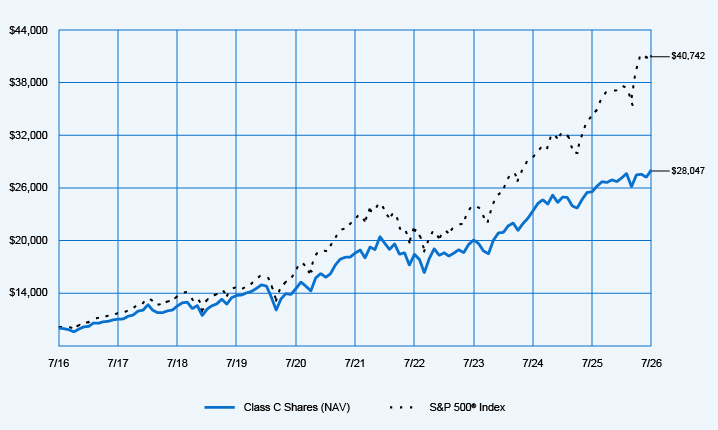
Average Annual Total Returns
| 1-Year | 5-Year | 10-Year | ||||||||||
| Class C Shares at NAV (excluding maximum sales charge) |
8.96 | % | 8.29 | % | 10.86 | % | ||||||
| S&P 500® Index |
19.56 | % | 12.86 | % | 15.08 | % | ||||||
| Lipper Equity Income Funds Classification Average |
20.18 | % | 9.85 | % | 10.59 | % | ||||||
Fund Statistics (as of July 31, 2026)
| Fund net assets |
$ | 6,311,929,958 | ||
| Total number of portfolio holdings |
45 | |||
| Portfolio turnover (%) |
20% | |||
| Total management fees paid for the year |
$ | 38,204,244 | ||
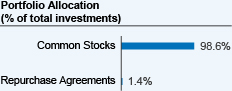 |
How has the Fund changed?
Portfolio manager update(s): Effective April 30, 2026, Charles Carr was added as a portfolio manager of the Fund.
For more complete information, you may review the Fund’s next prospectus, which is expected to be available
by November 30, 2026 at https://www.nuveen.com/en‑us/mutual‑funds/prospectuses or upon request at (800) 257-8787.
For more complete information, you may review the Fund’s next prospectus, which is expected to be available
by November 30, 2026 at https://www.nuveen.com/en‑us/mutual‑funds/prospectuses or upon request at (800) 257-8787.
This report describes changes to the Fund that occurred during the reporting period.
What were the Fund costs for the last year? (based on a hypothetical $10,000 investment)
| Cost of a $10,000 investment | Costs paid as a percentage of $10,000 investment* | |||
| Class A Shares |
$94 | 0.90% | ||
| * | Annualized for period less than one year. |
How did the Fund perform last year? What affected the Fund’s performance?
| Performance Highlights The Nuveen Dividend Growth Fund returned 9.78% for Class A Shares at net asset value (NAV) for the 12 months ended July 31, 2026. The Fund significantly underperformed the S&P 500 Index, which returned 19.56%. Top contributors to relative performance • Out‑of‑benchmark position in Taiwan Semiconductor Manufacturing Co., Ltd. • Overweight to Amphenol Corporation. • Underweight and security selection in the consumer discretionary sector, including an overweight to TJX Companies Inc. and lack of exposure to Tesla, Inc. Top detractors from relative performance • Security selection in the information technology sector, including an overweight to Accenture Plc and lack of exposure to Micron Technology, Inc. and Advanced Micro Devices, Inc. • Underweight to Alphabet Inc. • Security selection and an overweight to the financials sector, including overweights to Ares Management Corporation and S&P Global, Inc. • Security selection in the health care sector, including overweights to Zoetis, Inc. and Abbott Laboratories. |
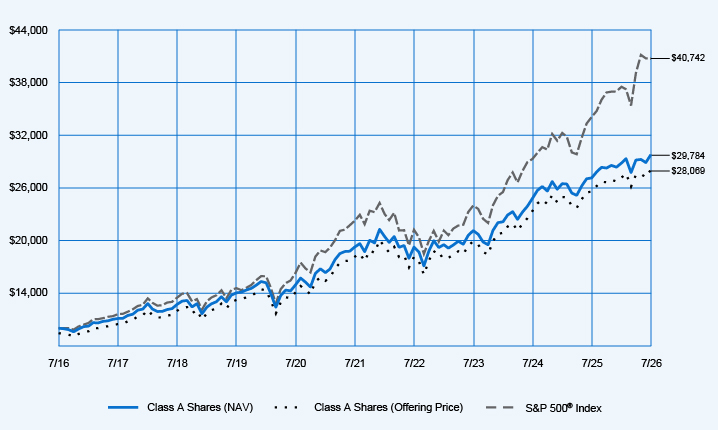
Average Annual Total Returns
| 1-Year | 5-Year | 10-Year | ||||||||||
| Class A Shares at NAV (excluding maximum sales charge) |
9.78 | % | 9.11 | % | 11.53 | % | ||||||
| Class A Shares at maximum sales charge (Offering Price) |
3.47 | % | 7.83 | % | 10.87 | % | ||||||
| S&P 500® Index |
19.56 | % | 12.86 | % | 15.08 | % | ||||||
| Lipper Equity Income Funds Classification Average |
20.18 | % | 9.85 | % | 10.59 | % | ||||||
Fund Statistics (as of July 31, 2026)
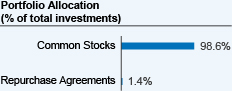
| Fund net assets |
$ | 6,311,929,958 | ||
| Total number of portfolio holdings |
45 | |||
| Portfolio turnover (%) |
20% | |||
| Total management fees paid for the year |
$ | 38,204,244 | ||
 |
How has the Fund changed?
Portfolio manager update(s): Effective April 30, 2026, Charles Carr was added as a portfolio manager of the Fund.
For more complete information, you may review the Fund’s next prospectus, which is expected to be available by November 30, 2026 at https://www.nuveen.com/en‑us/mutual‑funds/prospectuses or upon request at (800) 257-8787.
For more complete information, you may review the Fund’s next prospectus, which is expected to be available by November 30, 2026 at https://www.nuveen.com/en‑us/mutual‑funds/prospectuses or upon request at (800) 257-8787.
This report describes changes to the Fund that occurred during the reporting period.
What were the Fund costs for the last year? (based on a hypothetical $10,000 investment)
| Cost of a $10,000 investment | Costs paid as a percentage of $10,000 investment* | |||
| Class A Shares |
$94 | 0.90% | ||
| * | Annualized for period less than one year. |
How did the Fund perform last year? What affected the Fund’s performance?
| Performance Highlights The Nuveen Winslow Large‑Cap Growth ESG Fund returned 8.22% for Class A Shares at net asset value (NAV) for the 12 months ended July 31, 2026. The Fund performed in line with the Russell 1000 Growth Index, which returned 8.03%. Top contributors to relative performance • Security selection and an overweight in the industrials sector, led by overweights to GE Vernova Inc. and Quanta Services Inc. • Overweight positions in Micron Technology Inc. and Advanced Micro Devices Inc. Top detractors from relative performance • Security selection within the communication services sector, led by an overweight position in Spotify Technology SA. • An underweight to Apple Inc. • Overweights to Intuit Inc. and Snowflake Inc. |
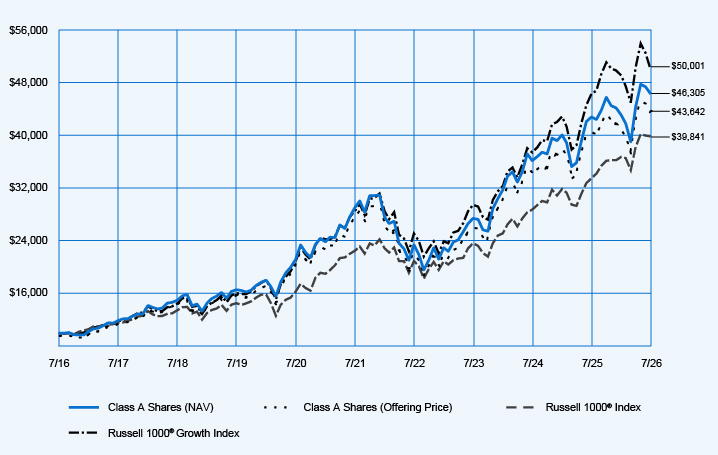
Average Annual Total Returns
| 1-Year | 5-Year | 10-Year | ||||||||||
| Class A Shares at NAV (excluding maximum sales charge) |
8.22 | % | 9.80 | % | 16.56 | % | ||||||
| Class A Shares at maximum sales charge (Offering Price) |
2.00 | % | 8.51 | % | 15.88 | % | ||||||
| Russell 1000® Index |
18.94 | % | 12.12 | % | 14.82 | % | ||||||
| Russell 1000® Growth Index |
8.03 | % | 11.88 | % | 17.46 | % | ||||||
| Lipper Large‑Cap Growth Funds Classification Average |
9.81 | % | 9.39 | % | 15.49 | % | ||||||
Fund Statistics (as of July 31, 2026)
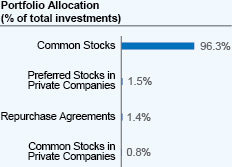
| Fund net assets |
$ | 932,713,424 | ||
| Total number of portfolio holdings |
45 | |||
| Portfolio turnover (%) |
133% | |||
| Total management fees paid for the year |
$ | 5,531,302 | ||
 |
How has the Fund changed?
For more complete information, you may review the Fund’s next prospectus, which is expected to be available by November 30, 2026 at https://www.nuveen.com/en‑us/mutual‑funds/prospectuses or upon request at (800) 257-8787.
For more complete information, you may review the Fund’s next prospectus, which is expected to be available by November 30, 2026 at https://www.nuveen.com/en‑us/mutual‑funds/prospectuses or upon request at (800) 257-8787.
This report describes changes to the Fund that occurred during the reporting period.
What were the Fund costs for the last year? (based on a hypothetical $10,000 investment)
| Cost of a $10,000 investment | Costs paid as a percentage of $10,000 investment* | |||
| Class C Shares |
$171 | 1.65% | ||
| * | Annualized for period less than one year. |
How did the Fund perform last year? What affected the Fund’s performance?
| Performance Highlights The Nuveen Winslow Large‑Cap Growth ESG Fund returned 7.42% for Class C Shares at net asset value (NAV) for the 12 months ended July 31, 2026. The Fund underperformed the Russell 1000 Growth Index, which returned 8.03%. Top contributors to relative performance • Security selection and an overweight in the industrials sector, led by overweights to GE Vernova Inc. and Quanta Services Inc. • Overweight positions in Micron Technology Inc. and Advanced Micro Devices Inc. Top detractors from relative performance • Security selection within the communication services sector, led by an overweight position in Spotify Technology SA. • An underweight to Apple Inc. • Overweights to Intuit Inc. and Snowflake Inc. |
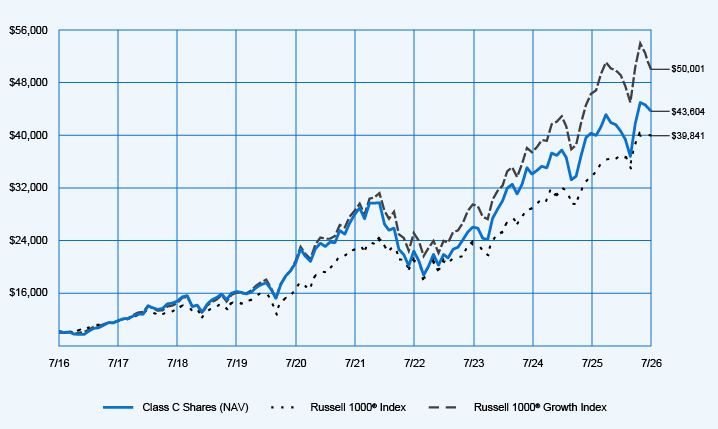
Average Annual Total Returns
| 1‑Year | 5‑Year | 10‑Year | ||||||||||
| Class C Shares at NAV (excluding maximum sales charge) |
7.42 | % | 8.98 | % | 15.87 | % | ||||||
| Russell 1000® Index |
18.94 | % | 12.12 | % | 14.82 | % | ||||||
| Russell 1000® Growth Index |
8.03 | % | 11.88 | % | 17.46 | % | ||||||
| Lipper Large‑Cap Growth Funds Classification Average |
9.81 | % | 9.39 | % | 15.49 | % | ||||||
Fund Statistics (as of July 31, 2026)
| Fund net assets |
$ | 932,713,424 | ||
| Total number of portfolio holdings |
45 | |||
| Portfolio turnover (%) |
133% | |||
| Total management fees paid for the year |
$ | 5,531,302 | ||
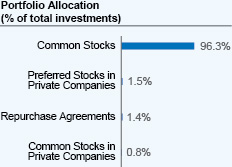 |
How has the Fund changed?
For more complete information, you may review the Fund’s next prospectus, which is expected to be available by November 30, 2026 at https://www.nuveen.com/en‑us/mutual‑funds/prospectuses or upon request at (800) 257-8787.
For more complete information, you may review the Fund’s next prospectus, which is expected to be available by November 30, 2026 at https://www.nuveen.com/en‑us/mutual‑funds/prospectuses or upon request at (800) 257-8787.
This report describes changes to the Fund that occurred during the reporting period.
What were the Fund costs for the last year? (based on a hypothetical $10,000 investment)
| Cost of a $10,000 investment | Costs paid as a percentage of $10,000 investment* | |||
| Class R6 Shares |
$60 | 0.58% | ||
| * | Annualized for period less than one year. |
How did the Fund perform last year? What affected the Fund’s performance?
| Performance Highlights The Nuveen Winslow Large‑Cap Growth ESG Fund returned 8.54% for Class R6 Shares at net asset value (NAV) for the 12 months ended July 31, 2026. The Fund outperformed the Russell 1000 Growth Index, which returned 8.03%. Top contributors to relative performance • Security selection and an overweight in the industrials sector, led by overweights to GE Vernova Inc. and Quanta Services Inc. • Overweight positions in Micron Technology Inc. and Advanced Micro Devices Inc. Top detractors from relative performance • Security selection within the communication services sector, led by an overweight position in Spotify Technology SA. • An underweight to Apple Inc. • Overweights to Intuit Inc. and Snowflake Inc. |
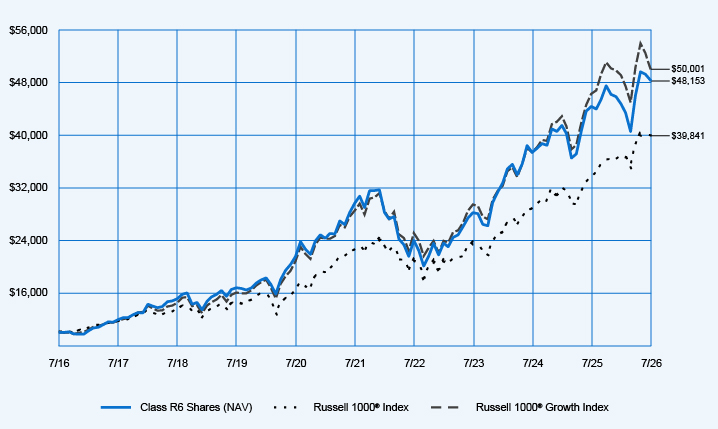
Average Annual Total Returns
| 1‑Year | 5‑Year | 10‑Year | ||||||||||
| Class R6 Shares at NAV |
8.54 | % | 10.19 | % | 17.02 | % | ||||||
| Russell 1000® Index |
18.94 | % | 12.12 | % | 14.82 | % | ||||||
| Russell 1000® Growth Index |
8.03 | % | 11.88 | % | 17.46 | % | ||||||
| Lipper Large‑Cap Growth Funds Classification Average |
9.81 | % | 9.39 | % | 15.49 | % | ||||||
Fund Statistics (as of July 31, 2026)
| Fund net assets |
$ | 932,713,424 | ||
| Total number of portfolio holdings |
45 | |||
| Portfolio turnover (%) |
133% | |||
| Total management fees paid for the year |
$ | 5,531,302 | ||
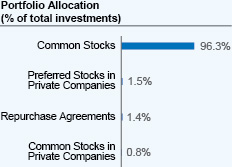 |
How has the Fund changed?
For more complete information, you may review the Fund’s next prospectus, which is expected to be available by November 30, 2026 at https://www.nuveen.com/en‑us/mutual‑funds/prospectuses or upon request at (800) 257‑8787.
For more complete information, you may review the Fund’s next prospectus, which is expected to be available by November 30, 2026 at https://www.nuveen.com/en‑us/mutual‑funds/prospectuses or upon request at (800) 257‑8787.
This report describes changes to the Fund that occurred during the reporting period.
What were the Fund costs for the last year? (based on a hypothetical $10,000 investment)
| Cost of a $10,000 investment | Costs paid as a percentage of $10,000 investment* | |||
| Class I Shares |
$68 | 0.65% | ||
| * | Annualized for period less than one year. |
How did the Fund perform last year? What affected the Fund’s performance?
| Performance Highlights The Nuveen Winslow Large‑Cap Growth ESG Fund returned 8.48% for Class I Shares at net asset value (NAV) for the 12 months ended July 31, 2026. The Fund outperformed the Russell 1000 Growth Index, which returned 8.03%. Top contributors to relative performance • Security selection and an overweight in the industrials sector, led by overweights to GE Vernova Inc. and Quanta Services Inc. • Overweight positions in Micron Technology Inc. and Advanced Micro Devices Inc. Top detractors from relative performance • Security selection within the communication services sector, led by an overweight position in Spotify Technology SA. • An underweight to Apple Inc. • Overweights to Intuit Inc. and Snowflake Inc. |
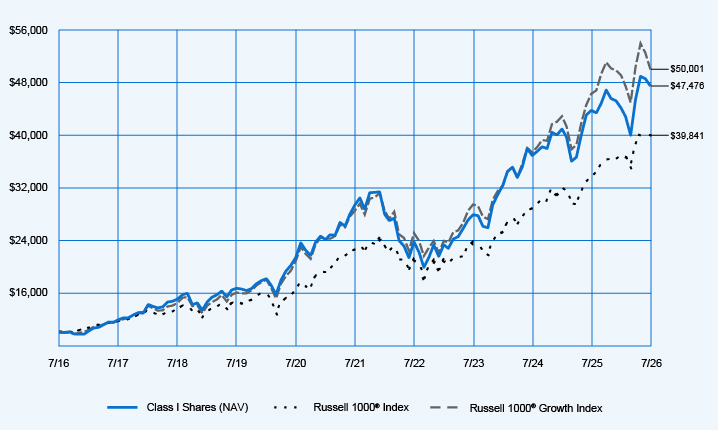
Average Annual Total Returns
| 1‑Year | 5‑Year | 10‑Year | ||||||||||
| Class I Shares at NAV |
8.48 | % | 10.07 | % | 16.86 | % | ||||||
| Russell 1000® Index |
18.94 | % | 12.12 | % | 14.82 | % | ||||||
| Russell 1000® Growth Index |
8.03 | % | 11.88 | % | 17.46 | % | ||||||
| Lipper Large‑Cap Growth Funds Classification Average |
9.81 | % | 9.39 | % | 15.49 | % | ||||||
Fund Statistics (as of July 31, 2026)
| Fund net assets |
$ | 932,713,424 | ||
| Total number of portfolio holdings |
45 | |||
| Portfolio turnover (%) |
133% | |||
| Total management fees paid for the year |
$ | 5,531,302 | ||
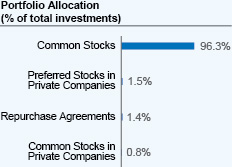 |
How has the Fund changed?
For more complete information, you may review the Fund’s next prospectus, which is expected to be available by November 30, 2026 at https://www.nuveen.com/en‑us/mutual‑funds/prospectuses or upon request at (800) 257‑8787.
For more complete information, you may review the Fund’s next prospectus, which is expected to be available by November 30, 2026 at https://www.nuveen.com/en‑us/mutual‑funds/prospectuses or upon request at (800) 257‑8787.
This report describes changes to the Fund that occurred during the reporting period.
What were the Fund costs for the last year? (based on a hypothetical $10,000 investment)
| Cost of a $10,000 investment | Costs paid as a percentage of $10,000 investment* | |||
| Class I Shares |
$97 | 0.90% | ||
| * | Annualized for period less than one year. |
How did the Fund perform last year? What affected the Fund’s performance?
| Performance Highlights The Nuveen Global Dividend Growth Fund returned 14.57% for Class I Shares at net asset value (NAV) for the 12 months ended July 31, 2026. The Fund significantly underperformed the MSCI World (Net), which returned 20.41%. Top contributors to relative performance • Out‑of‑benchmark position in Taiwan Semiconductor Manufacturing Co., Ltd. • Overweight to ASML Holding NV. • Overweight to ORIX Corporation. Top detractors from relative performance • Lack of exposure to Alphabet Inc. • Security selection in the information technology sector, including overweights to SAP SE, Accenture Plc and Microsoft Corporation, as well as lack of exposure to Micron Technology, Inc. • Security selection in the industrials sector, including overweights to Northrop Grumman Corp. and Experian PLC. • Security selection in the health care sector, including overweights to Abbott Laboratories and Zoetis, Inc. |
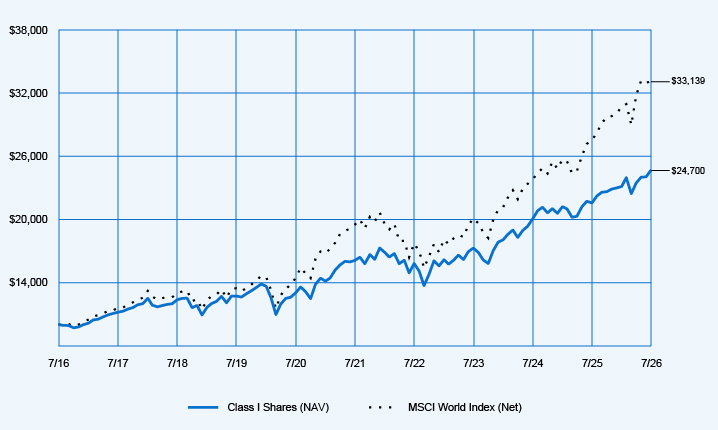
Average Annual Total Returns
| 1-Year | 5-Year | 10-Year | ||||||||||
| Class I Shares (NAV) |
14.57 | % | 8.93 | % | 9.46 | % | ||||||
| MSCI World Index (Net) |
20.41 | % | 11.19 | % | 12.73 | % | ||||||
| Lipper Global Equity Income Funds Classification Average |
23.26 | % | 10.12 | % | 9.25 | % | ||||||
Fund Statistics (as of July 31, 2026)
| Fund net assets |
$ | 16,894,609 | ||
| Total number of portfolio holdings |
49 | |||
| Portfolio turnover (%) |
17% | |||
| Total management fees paid for the year |
$ | 122,687 | ||
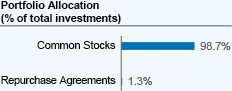 |
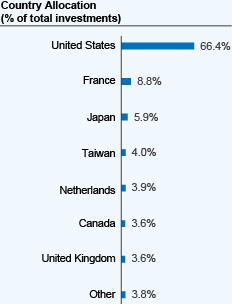 |
How has the Fund changed?
Portfolio manager update(s): Effective April 30, 2026, Charles Carr was added as a portfolio manager of the Fund.
For more complete information, you may review the Fund’s next prospectus, which is expected to be available by November 30, 2026 at https://www.nuveen.com/en‑us/mutual‑funds/prospectuses or upon request at (800) 257-8787.
For more complete information, you may review the Fund’s next prospectus, which is expected to be available by November 30, 2026 at https://www.nuveen.com/en‑us/mutual‑funds/prospectuses or upon request at (800) 257-8787.
This report describes changes to the Fund that occurred during the reporting period.
What were the Fund costs for the last year? (based on a hypothetical $10,000 investment)
| Cost of a $10,000 investment | Costs paid as a percentage of $10,000 investment* | |||
| Class C Shares |
$202 | 1.89% | ||
* Annualized for period less than one year.
How did the Fund perform last year? What affected the Fund’s performance?
| Performance Highlights The Nuveen Global Dividend Growth Fund returned 13.45% for Class C Shares at net asset value (NAV) for the 12 months ended July 31, 2026. The Fund significantly underperformed the MSCI World (Net), which returned 20.41%. Top contributors to relative performance • Out‑of‑benchmark position in Taiwan Semiconductor Manufacturing Co., Ltd. • Overweight to ASML Holding NV. • Overweight to ORIX Corporation. Top detractors from relative performance • Lack of exposure to Alphabet Inc. • Security selection in the information technology sector, including overweights to SAP SE, Accenture Plc and Microsoft Corporation, as well as lack of exposure to Micron Technology, Inc. • Security selection in the industrials sector, including overweights to Northrop Grumman Corp. and Experian PLC. • Security selection in the health care sector, including overweights to Abbott Laboratories and Zoetis, Inc. |
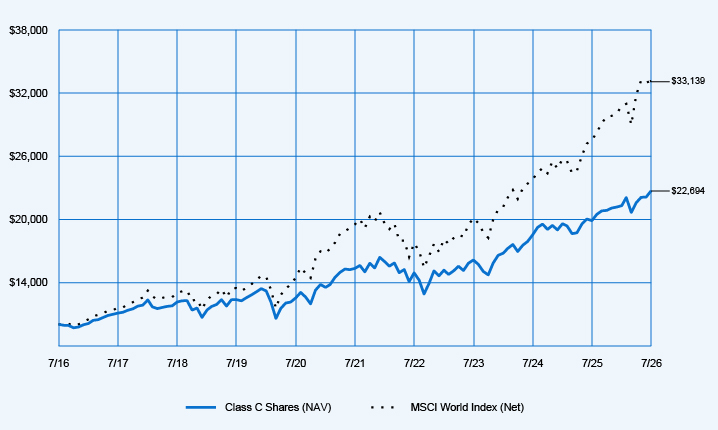
Average Annual Total Returns
| 1-Year | 5-Year | 10-Year | ||||
| Class C Shares at NAV (excluding maximum sales charge) |
13.45% | 7.85% | 8.54% | |||
| MSCI World Index (Net) |
20.41% | 11.19% | 12.73% | |||
| Lipper Global Equity Income Funds Classification Average |
23.26% | 10.12% | 9.25% | |||
Fund Statistics (as of July 31, 2026)
| Fund net assets |
$ | 16,894,609 | ||
| Total number of portfolio holdings |
49 | |||
| Portfolio turnover (%) |
17% | |||
| Total management fees paid for the year |
$ | 122,687 | ||
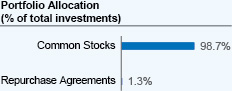 |
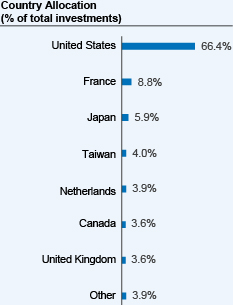 |
How has the Fund changed?
Portfolio manager update(s): Effective April 30, 2026, Charles Carr was added as a portfolio manager of the Fund.
For more complete information, you may review the Fund’s next prospectus, which is expected to be available by November 30, 2026 at https://www.nuveen.com/en‑us/mutual‑funds/prospectuses or upon request at (800) 257-8787.
For more complete information, you may review the Fund’s next prospectus, which is expected to be available by November 30, 2026 at https://www.nuveen.com/en‑us/mutual‑funds/prospectuses or upon request at (800) 257-8787.
This report describes changes to the Fund that occurred during the reporting period.
What were the Fund costs for the last year? (based on a hypothetical $10,000 investment)
| Cost of a $10,000 investment | Costs paid as a percentage of $10,000 investment* | |||
| Class A Shares |
$123 | 1.15% | ||
* Annualized for period less than one year.
How did the Fund perform last year? What affected the Fund’s performance?
| Performance Highlights The Nuveen Global Dividend Growth Fund returned 14.27% for Class A Shares at net asset value (NAV) for the 12 months ended July 31, 2026. The Fund significantly underperformed the MSCI World (Net), which returned 20.41%. Top contributors to relative performance • Out‑of‑benchmark position in Taiwan Semiconductor Manufacturing Co., Ltd. • Overweight to ASML Holding NV. • Overweight to ORIX Corporation. Top detractors from relative performance • Lack of exposure to Alphabet Inc. • Security selection in the information technology sector, including overweights to SAP SE, Accenture Plc and Microsoft Corporation, as well as lack of exposure to Micron Technology, Inc. • Security selection in the industrials sector, including overweights to Northrop Grumman Corp. and Experian PLC. • Security selection in the health care sector, including overweights to Abbott Laboratories and Zoetis, Inc. |
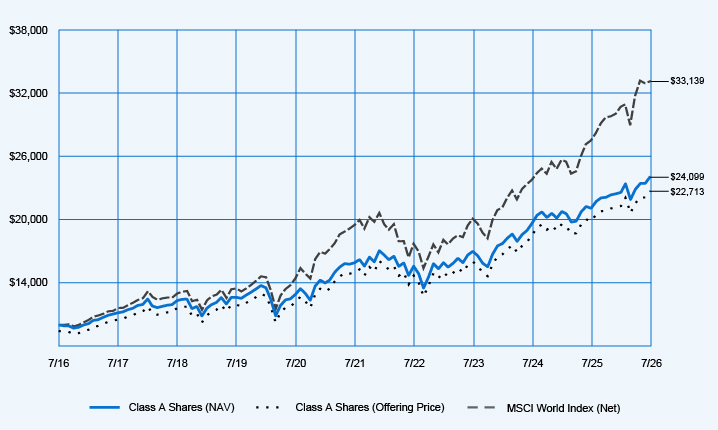
Average Annual Total Returns
| 1-Year | 5-Year | 10-Year | ||||
| Class A Shares at NAV (excluding maximum sales charge) |
14.27% | 8.66% | 9.19% | |||
| Class A Shares at maximum sales charge (Offering Price) |
7.70% | 7.38% | 8.55% | |||
| MSCI World Index (Net) |
20.41% | 11.19% | 12.73% | |||
| Lipper Global Equity Income Funds Classification Average |
23.26% | 10.12% | 9.25% | |||
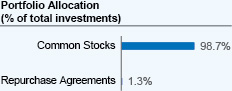
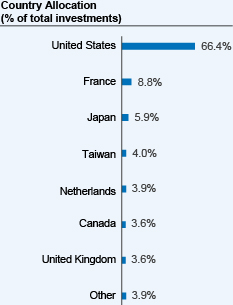
Fund Statistics (as of July 31, 2026)
| Fund net assets |
$ | 16,894,609 | ||
| Total number of portfolio holdings |
49 | |||
| Portfolio turnover (%) |
17% | |||
| Total management fees paid for the year |
$ | 122,687 | ||
 |
 |
How has the Fund changed?
Portfolio manager update(s): Effective April 30, 2026, Charles Carr was added as a portfolio manager of the Fund.
For more complete information, you may review the Fund’s next prospectus, which is expected to be available by November 30, 2026 at https://www.nuveen.com/en‑us/mutual‑funds/prospectuses or upon request at (800) 257-8787.
For more complete information, you may review the Fund’s next prospectus, which is expected to be available by November 30, 2026 at https://www.nuveen.com/en‑us/mutual‑funds/prospectuses or upon request at (800) 257-8787.
| [1] | Annualized for period less than one year. |
| [2] | Annualized for period less than one year. |
| [3] | Annualized for period less than one year. |
| [4] | Annualized for period less than one year. |
| [5] | Annualized for period less than one year. |
| [6] | Annualized for period less than one year. |
| [7] | Annualized for period less than one year. |
| [8] | Annualized for period less than one year. |
| [9] | Annualized for period less than one year. |
| [10] | Annualized for period less than one year. |
| [11] | Annualized for period less than one year. |
| [12] | Annualized for period less than one year. |