Shareholder Report
|
12 Months Ended |
|
Jul. 31, 2026
USD ($)
Holding
|
Jul. 31, 2025 |
| Shareholder Report [Line Items] |
|
|
| Document Type |
N-CSR
|
|
| Amendment Flag |
false
|
|
| Registrant Name |
Domini Investment Trust
|
|
| Entity Central Index Key |
0000851680
|
|
| Entity Investment Company Type |
N-1A
|
|
| Document Period End Date |
Jul. 31, 2026
|
|
| Shareholder Report Annual or Semi-Annual |
Annual Shareholder Report
|
|
| C000009466 |
|
|
| Shareholder Report [Line Items] |
|
|
| Fund Name |
Domini Impact Equity Fund
|
|
| Class Name |
INVESTOR SHARES
|
|
| Trading Symbol |
DSEFX
|
|
| Annual or Semi-Annual Statement [Text Block] |
This annual shareholder report contains important information about the Domini Impact Equity Fund for the period of August 1, 2025 to July 31, 2026.
|
|
| Additional Information [Text Block] |
You can find additional information about the Fund at domini.com. You can also request information by contacting us at 1-800-582-6757 or by emailing funddocuments@domini.com.
|
|
| Additional Information Phone Number |
1-800-582-6757
|
|
| Additional Information Email |
<span style="box-sizing: border-box; color: rgb(0, 0, 0); display: inline; flex-wrap: nowrap; font-size: 12px; font-weight: 400; grid-area: auto; line-height: 18px; margin: 0px; overflow: visible; text-align: left; text-align-last: auto; white-space-collapse: preserve-breaks;">funddocuments@domini.com</span>
|
|
| Additional Information Website |
domini.com
|
|
| Expenses [Text Block] |
What were the Fund costs for last year?(based on a hypothetical $10,000 investment)
Table Summary
Class Name |
Cost of a $10,000 investment |
Costs paid as a percentage of a $10,000 investment |
Investor shares |
$110 |
1.01% | |
|
| Expenses Paid, Amount |
$ 110
|
|
| Expense Ratio, Percent |
1.01%
|
|
| Factors Affecting Performance [Text Block] |
How did the Fund perform last year and what affected its performance?The Fund’s Investor shares returned 16.94% for the trailing twelve months ended July 31, 2026, underperforming relative to the S&P 500 Index (the “benchmark”), which returned 19.56%. The Fund invests in a diversified U.S. equity portfolio consistent with the promotion of universal human dignity and ecological sustainability. It does not invest in the GICS Energy sector in accordance with Domini’s exclusionary standards on fossil fuels. U.S. equities delivered strong returns over the period, buoyed by continued enthusiasm for artificial intelligence (AI) infrastructure spending, resilient corporate earnings, and three Federal Reserve rate cuts in the second half of 2025. Markets navigated meaningful volatility, including a first-quarter 2026 selloff tied to U.S.–Iran tensions that sent energy prices sharply higher. This was followed by a strong rebound in the second quarter, as initial reports of a potential cease-fire supported a recovery in risk appetite. Stock selection was the primary reason that the Fund’s returns lagged the benchmark, with weak selection in Materials and Health Care partially offset by stronger selection in Communication Services. Sector positioning also had a negative impact overall, predominantly driven by the Fund’s zero exposure to Energy, which was the top performing sector for the benchmark over the period. The largest individual detractor was an underweight position in Tesla, which the Fund did not hold during its strongest stretch of performance. Other detractors included an overweight position in Netflix, underweight positions in Lam Research and Eli Lilly, and an out-of-benchmark position in Royal Gold. Top contributors included technology names that benefited from strong AI-driven demand, including overweight positions in Micron Technology and Marvell Technology. Other contributors included an underweight position in Oracle, as well as not holding Meta Platforms and Palantir Technologies, both of which are currently ineligible for investment based on Domini’s qualitative evaluation of their environmental and social impact. Top Relative ContributorsSectors: Stocks: Micron Technology, Inc. (overweight) Meta Platforms, Inc. (not held, ineligible) Marvell Technology, Inc. (overweight)
Sectors: Materials (overweight) Health Care (overweight) Energy (excluded)
Stocks: Tesla, Inc. (underweight) Netflix, Inc. (overweight) Lam Research Corporation (underweight)
|
|
| Performance Past Does Not Indicate Future [Text] |
Keep in mind that the Fund's past performance is not a good predictor of how the Fund will perform in the future.
|
|
| Line Graph [Table Text Block] |
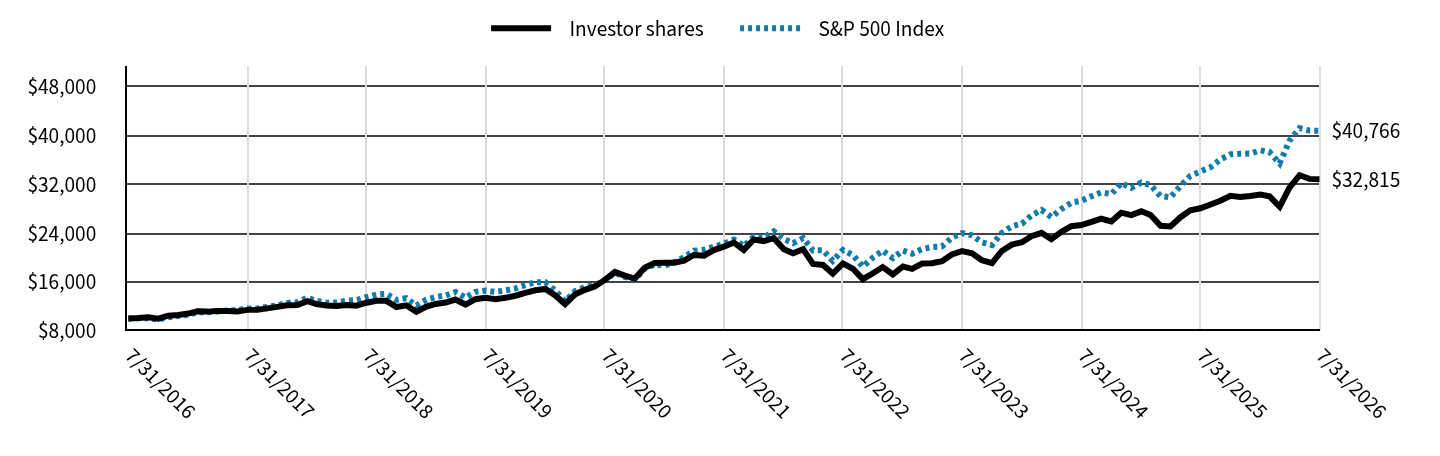
Table Summary
|
Investor shares |
S&P 500 Index |
7/31/2016 |
$10,000 |
$10,000 |
8/31/2016 |
$10,065 |
$10,014 |
9/30/2016 |
$10,177 |
$10,016 |
10/31/2016 |
$9,960 |
$9,834 |
11/30/2016 |
$10,445 |
$10,198 |
12/31/2016 |
$10,580 |
$10,399 |
1/31/2017 |
$10,801 |
$10,597 |
2/28/2017 |
$11,166 |
$11,018 |
3/31/2017 |
$11,121 |
$11,031 |
4/30/2017 |
$11,232 |
$11,145 |
5/31/2017 |
$11,239 |
$11,302 |
6/30/2017 |
$11,151 |
$11,372 |
7/31/2017 |
$11,407 |
$11,606 |
8/31/2017 |
$11,434 |
$11,642 |
9/30/2017 |
$11,651 |
$11,882 |
10/31/2017 |
$11,899 |
$12,159 |
11/30/2017 |
$12,175 |
$12,532 |
12/31/2017 |
$12,211 |
$12,671 |
1/31/2018 |
$12,844 |
$13,397 |
2/28/2018 |
$12,341 |
$12,903 |
3/31/2018 |
$12,126 |
$12,575 |
4/30/2018 |
$12,058 |
$12,623 |
5/31/2018 |
$12,188 |
$12,927 |
6/30/2018 |
$12,100 |
$13,007 |
7/31/2018 |
$12,584 |
$13,491 |
8/31/2018 |
$12,912 |
$13,931 |
9/30/2018 |
$12,887 |
$14,010 |
10/31/2018 |
$11,870 |
$13,052 |
11/30/2018 |
$12,151 |
$13,318 |
12/31/2018 |
$11,103 |
$12,116 |
1/31/2019 |
$11,932 |
$13,086 |
2/28/2019 |
$12,371 |
$13,506 |
3/31/2019 |
$12,614 |
$13,768 |
4/30/2019 |
$13,102 |
$14,326 |
5/31/2019 |
$12,281 |
$13,416 |
6/30/2019 |
$13,158 |
$14,362 |
7/31/2019 |
$13,378 |
$14,569 |
8/31/2019 |
$13,170 |
$14,339 |
9/30/2019 |
$13,379 |
$14,607 |
10/31/2019 |
$13,725 |
$14,924 |
11/30/2019 |
$14,207 |
$15,465 |
12/31/2019 |
$14,618 |
$15,932 |
1/31/2020 |
$14,831 |
$15,926 |
2/29/2020 |
$13,805 |
$14,615 |
3/31/2020 |
$12,359 |
$12,810 |
4/30/2020 |
$13,926 |
$14,453 |
5/31/2020 |
$14,689 |
$15,141 |
6/30/2020 |
$15,250 |
$15,442 |
7/31/2020 |
$16,319 |
$16,313 |
8/31/2020 |
$17,638 |
$17,486 |
9/30/2020 |
$17,013 |
$16,821 |
10/31/2020 |
$16,537 |
$16,374 |
11/30/2020 |
$18,303 |
$18,167 |
12/31/2020 |
$19,094 |
$18,864 |
1/31/2021 |
$19,132 |
$18,674 |
2/28/2021 |
$19,144 |
$19,189 |
3/31/2021 |
$19,471 |
$20,030 |
4/30/2021 |
$20,402 |
$21,099 |
5/31/2021 |
$20,290 |
$21,247 |
6/30/2021 |
$21,205 |
$21,742 |
7/31/2021 |
$21,774 |
$22,259 |
8/31/2021 |
$22,437 |
$22,936 |
9/30/2021 |
$21,230 |
$21,870 |
10/31/2021 |
$22,937 |
$23,403 |
11/30/2021 |
$22,681 |
$23,241 |
12/31/2021 |
$23,162 |
$24,282 |
1/31/2022 |
$21,354 |
$23,027 |
2/28/2022 |
$20,672 |
$22,338 |
3/31/2022 |
$21,353 |
$23,167 |
4/30/2022 |
$18,928 |
$21,147 |
5/31/2022 |
$18,762 |
$21,185 |
6/30/2022 |
$17,338 |
$19,437 |
7/31/2022 |
$19,021 |
$21,229 |
8/31/2022 |
$18,106 |
$20,363 |
9/30/2022 |
$16,440 |
$18,488 |
10/31/2022 |
$17,407 |
$19,985 |
11/30/2022 |
$18,421 |
$21,103 |
12/31/2022 |
$17,210 |
$19,887 |
1/31/2023 |
$18,517 |
$21,136 |
2/28/2023 |
$18,133 |
$20,620 |
3/31/2023 |
$18,997 |
$21,377 |
4/30/2023 |
$19,051 |
$21,710 |
5/31/2023 |
$19,395 |
$21,804 |
6/30/2023 |
$20,490 |
$23,245 |
7/31/2023 |
$21,038 |
$23,992 |
8/31/2023 |
$20,686 |
$23,610 |
9/30/2023 |
$19,539 |
$22,484 |
10/31/2023 |
$19,066 |
$22,011 |
11/30/2023 |
$21,067 |
$24,022 |
12/31/2023 |
$22,100 |
$25,113 |
1/31/2024 |
$22,488 |
$25,535 |
2/29/2024 |
$23,469 |
$26,898 |
3/31/2024 |
$24,025 |
$27,764 |
4/30/2024 |
$22,995 |
$26,630 |
5/31/2024 |
$24,188 |
$27,950 |
6/30/2024 |
$25,124 |
$28,953 |
7/31/2024 |
$25,308 |
$29,306 |
8/31/2024 |
$25,813 |
$30,018 |
9/30/2024 |
$26,342 |
$30,660 |
10/31/2024 |
$25,899 |
$30,381 |
11/30/2024 |
$27,332 |
$32,164 |
12/31/2024 |
$26,934 |
$31,399 |
1/31/2025 |
$27,557 |
$32,272 |
2/28/2025 |
$26,963 |
$31,852 |
3/31/2025 |
$25,194 |
$30,058 |
4/30/2025 |
$25,072 |
$29,854 |
5/31/2025 |
$26,590 |
$31,733 |
6/30/2025 |
$27,710 |
$33,347 |
7/31/2025 |
$28,062 |
$34,095 |
8/31/2025 |
$28,665 |
$34,786 |
9/30/2025 |
$29,297 |
$36,056 |
10/31/2025 |
$30,087 |
$36,900 |
11/30/2025 |
$29,900 |
$36,992 |
12/31/2025 |
$30,066 |
$37,014 |
1/31/2026 |
$30,306 |
$37,551 |
2/28/2026 |
$30,010 |
$37,265 |
3/31/2026 |
$28,302 |
$35,410 |
4/30/2026 |
$31,423 |
$39,125 |
5/31/2026 |
$33,474 |
$41,184 |
6/30/2026 |
$32,871 |
$40,792 |
7/31/2026 |
$32,815 |
$40,766 |
|
|
| Average Annual Return [Table Text Block] |
Table Summary
Name |
1 Year |
5 Years |
10 Years |
Investor shares |
16.94% |
8.55% |
12.62% |
S&P 500 Index |
19.56% |
12.86% |
15.08% | |
|
| No Deduction of Taxes [Text Block] |
The graph and table do not reflect the deduction of taxes that a shareholder would pay on Fund distributions or redemption of Fund shares.
|
|
| Updated Performance Information Location [Text Block] |
Visit domini.com/performance for the most recent performance information.
|
|
| AssetsNet |
$ 1,192,826,490
|
|
| Holdings Count | Holding |
157
|
|
| Advisory Fees Paid, Amount |
$ 7,501,900
|
|
| InvestmentCompanyPortfolioTurnover |
51.00%
|
|
| Additional Fund Statistics [Text Block] |
The following table outlines certain key Fund statistics as of the end of the reporting period:
Table Summary
Fund's net assets |
$1,192,826,490 |
Total number of portfolio holdings |
157 |
Portfolio turnover rate |
51% |
Total advisory fees paid |
$7,501,900 | |
|
| Holdings [Text Block] |
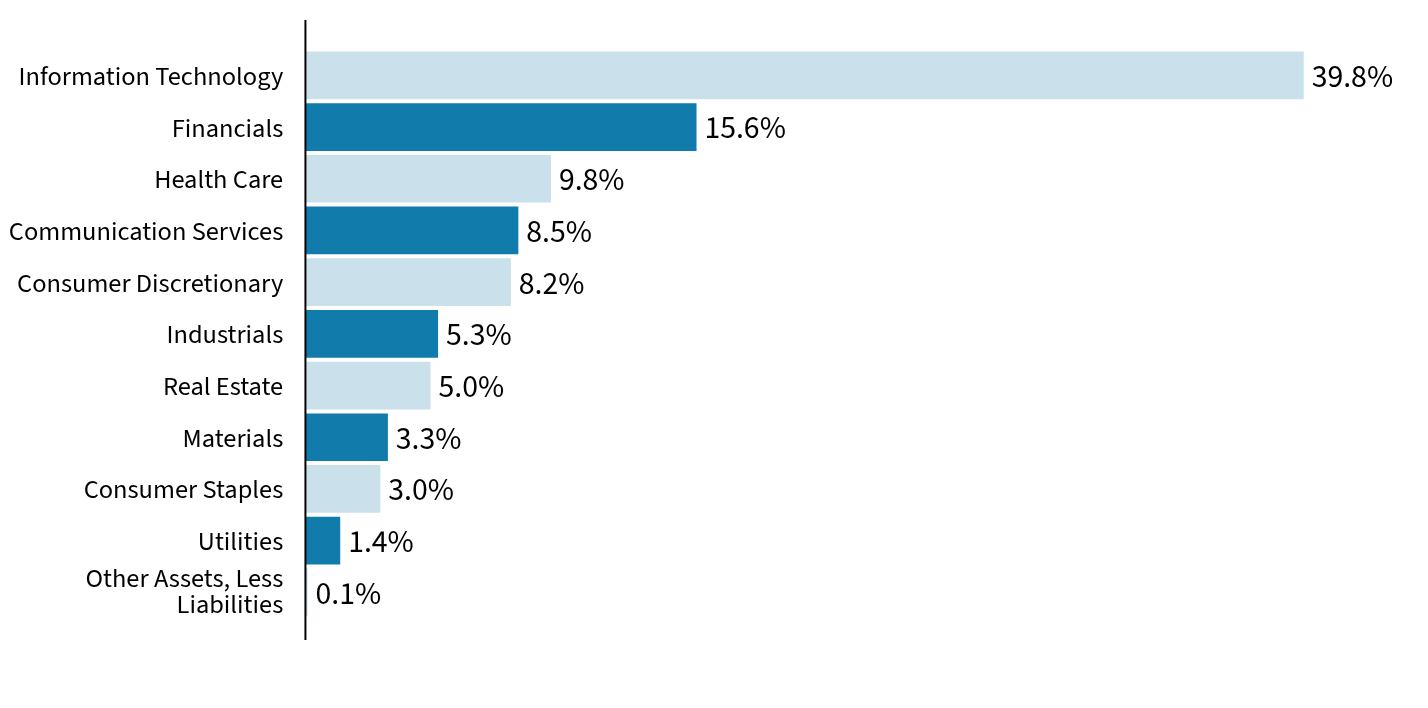
SECTOR ALLOCATION (% of net assets)
Table Summary
Value |
Value |
Other Assets, Less Liabilities |
0.1% |
Utilities |
1.4% |
Consumer Staples |
3.0% |
Materials |
3.3% |
Real Estate |
5.0% |
Industrials |
5.3% |
Consumer Discretionary |
8.2% |
Communication Services |
8.5% |
Health Care |
9.8% |
Financials |
15.6% |
Information Technology |
39.8% | |
|
| Largest Holdings [Text Block] |
TOP TEN HOLDINGS (% of net assets)
Table Summary
NVIDIA Corp. |
7.4% |
Apple, Inc. |
7.1% |
Alphabet, Inc., Class A |
5.6% |
Microsoft Corp. |
5.4% |
Amazon.com, Inc. |
4.1% |
Broadcom, Inc. |
3.8% |
Micron Technology, Inc. |
2.5% |
Eli Lilly & Co. |
2.3% |
Visa, Inc., Class A |
2.1% |
Mastercard, Inc., Class A |
1.9% | |
|
| Updated Prospectus Phone Number |
1-800-582-6757
|
|
| Updated Prospectus Web Address |
domini.com/funddocuments
|
|
| C000071456 |
|
|
| Shareholder Report [Line Items] |
|
|
| Fund Name |
Domini Impact Equity Fund
|
|
| Class Name |
INSTITUTIONAL SHARES
|
|
| Trading Symbol |
DIEQX
|
|
| Annual or Semi-Annual Statement [Text Block] |
This annual shareholder report contains important information about the Domini Impact Equity Fund for the period of August 1, 2025 to July 31, 2026.
|
|
| Additional Information [Text Block] |
You can find additional information about the Fund at domini.com. You can also request information by contacting us at 1-800-582-6757 or by emailing funddocuments@domini.com.
|
|
| Additional Information Phone Number |
1-800-582-6757
|
|
| Additional Information Email |
<span style="box-sizing: border-box; color: rgb(0, 0, 0); display: inline; flex-wrap: nowrap; font-size: 12px; font-weight: 400; grid-area: auto; line-height: 18px; margin: 0px; overflow: visible; text-align: left; text-align-last: auto; white-space-collapse: preserve-breaks;">funddocuments@domini.com</span>
|
|
| Additional Information Website |
domini.com
|
|
| Expenses [Text Block] |
What were the Fund costs for last year?(based on a hypothetical $10,000 investment)
Table Summary
Class Name |
Cost of a $10,000 investment |
Costs paid as a percentage of a $10,000 investment |
Institutional shares |
$78 |
0.72% | |
|
| Expenses Paid, Amount |
$ 78
|
|
| Expense Ratio, Percent |
0.72%
|
|
| Factors Affecting Performance [Text Block] |
How did the Fund perform last year and what affected its performance?The Fund’s Institutional shares returned 17.28% for the trailing twelve months ended July 31, 2026, underperforming relative to the S&P 500 Index (the “benchmark”), which returned 19.56%. The Fund invests in a diversified U.S. equity portfolio consistent with the promotion of universal human dignity and ecological sustainability. It does not invest in the GICS Energy sector in accordance with Domini’s exclusionary standards on fossil fuels. U.S. equities delivered strong returns over the period, buoyed by continued enthusiasm for artificial intelligence (AI) infrastructure spending, resilient corporate earnings, and three Federal Reserve rate cuts in the second half of 2025. Markets navigated meaningful volatility, including a first-quarter 2026 selloff tied to U.S.–Iran tensions that sent energy prices sharply higher. This was followed by a strong rebound in the second quarter, as initial reports of a potential cease-fire supported a recovery in risk appetite. Stock selection was the primary reason that the Fund’s returns lagged the benchmark, with weak selection in Materials and Health Care partially offset by stronger selection in Communication Services. Sector positioning also had a negative impact overall, predominantly driven by the Fund’s zero exposure to Energy, which was the top performing sector for the benchmark over the period. The largest individual detractor was an underweight position in Tesla, which the Fund did not hold during its strongest stretch of performance. Other detractors included an overweight position in Netflix, underweight positions in Lam Research and Eli Lilly, and an out-of-benchmark position in Royal Gold. Top contributors included technology names that benefited from strong AI-driven demand, including overweight positions in Micron Technology and Marvell Technology. Other contributors included an underweight position in Oracle, as well as not holding Meta Platforms and Palantir Technologies, both of which are currently ineligible for investment based on Domini’s qualitative evaluation of their environmental and social impact. Top Relative ContributorsSectors: Stocks: Micron Technology, Inc. (overweight) Meta Platforms, Inc. (not held, ineligible) Marvell Technology, Inc. (overweight)
Sectors: Materials (overweight) Health Care (overweight) Energy (excluded)
Stocks: Tesla, Inc. (underweight) Netflix, Inc. (overweight) Lam Research Corporation (underweight)
|
|
| Performance Past Does Not Indicate Future [Text] |
Keep in mind that the Fund's past performance is not a good predictor of how the Fund will perform in the future.
|
|
| Line Graph [Table Text Block] |
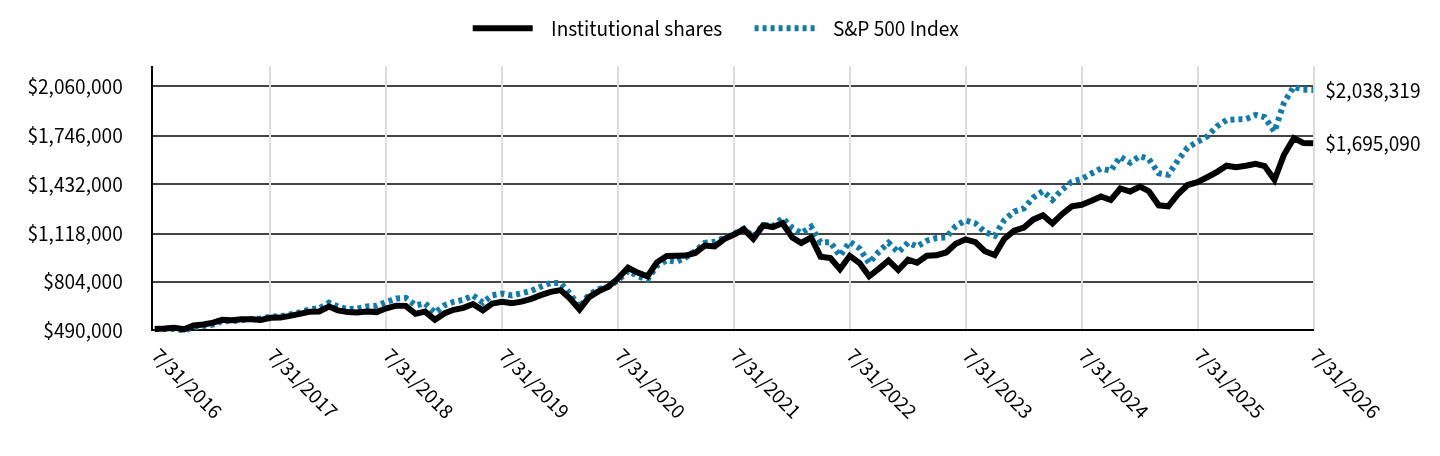
Table Summary
|
Institutional shares |
S&P 500 Index |
7/31/2016 |
$500,000 |
$500,000 |
8/31/2016 |
$503,570 |
$500,700 |
9/30/2016 |
$509,327 |
$500,800 |
10/31/2016 |
$498,590 |
$491,686 |
11/30/2016 |
$522,971 |
$509,878 |
12/31/2016 |
$529,966 |
$519,974 |
1/31/2017 |
$541,202 |
$529,853 |
2/28/2017 |
$559,461 |
$550,888 |
3/31/2017 |
$557,588 |
$551,549 |
4/30/2017 |
$563,206 |
$557,230 |
5/31/2017 |
$563,674 |
$565,087 |
6/30/2017 |
$559,461 |
$568,591 |
7/31/2017 |
$572,569 |
$580,304 |
8/31/2017 |
$573,974 |
$582,103 |
9/30/2017 |
$584,976 |
$594,094 |
10/31/2017 |
$597,850 |
$607,936 |
11/30/2017 |
$611,895 |
$626,600 |
12/31/2017 |
$613,680 |
$633,555 |
1/31/2018 |
$645,719 |
$669,858 |
2/28/2018 |
$620,713 |
$645,140 |
3/31/2018 |
$609,832 |
$628,754 |
4/30/2018 |
$606,700 |
$631,143 |
5/31/2018 |
$613,485 |
$646,353 |
6/30/2018 |
$609,339 |
$650,361 |
7/31/2018 |
$633,713 |
$674,554 |
8/31/2018 |
$650,748 |
$696,545 |
9/30/2018 |
$649,524 |
$700,515 |
10/31/2018 |
$598,246 |
$652,600 |
11/30/2018 |
$612,709 |
$665,913 |
12/31/2018 |
$560,165 |
$605,781 |
1/31/2019 |
$602,147 |
$654,304 |
2/28/2019 |
$624,338 |
$675,307 |
3/31/2019 |
$636,830 |
$688,408 |
4/30/2019 |
$661,544 |
$716,289 |
5/31/2019 |
$620,555 |
$670,804 |
6/30/2019 |
$664,952 |
$718,096 |
7/31/2019 |
$676,115 |
$728,437 |
8/31/2019 |
$665,857 |
$716,927 |
9/30/2019 |
$676,799 |
$730,334 |
10/31/2019 |
$694,323 |
$746,182 |
11/30/2019 |
$718,796 |
$773,268 |
12/31/2019 |
$739,843 |
$796,621 |
1/31/2020 |
$750,969 |
$796,302 |
2/29/2020 |
$699,050 |
$730,767 |
3/31/2020 |
$625,988 |
$640,517 |
4/30/2020 |
$705,829 |
$722,631 |
5/31/2020 |
$744,351 |
$757,029 |
6/30/2020 |
$773,259 |
$772,094 |
7/31/2020 |
$827,736 |
$815,640 |
8/31/2020 |
$894,665 |
$874,284 |
9/30/2020 |
$863,455 |
$841,061 |
10/31/2020 |
$839,150 |
$818,689 |
11/30/2020 |
$929,515 |
$908,335 |
12/31/2020 |
$969,897 |
$943,216 |
1/31/2021 |
$972,133 |
$933,689 |
2/28/2021 |
$972,772 |
$959,459 |
3/31/2021 |
$989,865 |
$1,001,483 |
4/30/2021 |
$1,037,535 |
$1,054,962 |
5/31/2021 |
$1,032,096 |
$1,062,347 |
6/30/2021 |
$1,079,121 |
$1,087,100 |
7/31/2021 |
$1,108,269 |
$1,112,973 |
8/31/2021 |
$1,142,221 |
$1,146,807 |
9/30/2021 |
$1,081,052 |
$1,093,481 |
10/31/2021 |
$1,168,203 |
$1,170,134 |
11/30/2021 |
$1,155,707 |
$1,162,060 |
12/31/2021 |
$1,180,700 |
$1,214,120 |
1/31/2022 |
$1,088,701 |
$1,151,350 |
2/28/2022 |
$1,054,075 |
$1,116,925 |
3/31/2022 |
$1,089,045 |
$1,158,363 |
4/30/2022 |
$965,699 |
$1,057,353 |
5/31/2022 |
$957,544 |
$1,059,257 |
6/30/2022 |
$884,915 |
$971,868 |
7/31/2022 |
$971,298 |
$1,061,474 |
8/31/2022 |
$924,706 |
$1,018,166 |
9/30/2022 |
$839,810 |
$924,393 |
10/31/2022 |
$889,491 |
$999,269 |
11/30/2022 |
$941,554 |
$1,055,128 |
12/31/2022 |
$879,839 |
$994,352 |
1/31/2023 |
$946,505 |
$1,056,798 |
2/28/2023 |
$927,408 |
$1,031,012 |
3/31/2023 |
$971,843 |
$1,068,850 |
4/30/2023 |
$974,627 |
$1,085,524 |
5/31/2023 |
$992,728 |
$1,090,192 |
6/30/2023 |
$1,048,994 |
$1,162,254 |
7/31/2023 |
$1,077,251 |
$1,199,591 |
8/31/2023 |
$1,059,460 |
$1,180,492 |
9/30/2023 |
$1,000,970 |
$1,124,206 |
10/31/2023 |
$976,889 |
$1,100,568 |
11/30/2023 |
$1,079,499 |
$1,201,078 |
12/31/2023 |
$1,132,956 |
$1,255,644 |
1/31/2024 |
$1,153,055 |
$1,276,744 |
2/29/2024 |
$1,203,832 |
$1,344,917 |
3/31/2024 |
$1,232,299 |
$1,388,190 |
4/30/2024 |
$1,179,658 |
$1,331,489 |
5/31/2024 |
$1,241,132 |
$1,397,511 |
6/30/2024 |
$1,289,799 |
$1,447,657 |
7/31/2024 |
$1,299,353 |
$1,465,279 |
8/31/2024 |
$1,325,538 |
$1,500,885 |
9/30/2024 |
$1,353,120 |
$1,533,004 |
10/31/2024 |
$1,330,462 |
$1,519,054 |
11/30/2024 |
$1,404,455 |
$1,608,224 |
12/31/2024 |
$1,384,798 |
$1,569,948 |
1/31/2025 |
$1,416,846 |
$1,613,593 |
2/28/2025 |
$1,387,034 |
$1,592,616 |
3/31/2025 |
$1,296,105 |
$1,502,882 |
4/30/2025 |
$1,290,143 |
$1,492,691 |
5/31/2025 |
$1,368,773 |
$1,586,648 |
6/30/2025 |
$1,426,683 |
$1,667,332 |
7/31/2025 |
$1,445,381 |
$1,704,752 |
8/31/2025 |
$1,476,794 |
$1,739,311 |
9/30/2025 |
$1,509,703 |
$1,802,796 |
10/31/2025 |
$1,550,840 |
$1,844,981 |
11/30/2025 |
$1,541,491 |
$1,849,594 |
12/31/2025 |
$1,550,563 |
$1,850,703 |
1/31/2026 |
$1,563,074 |
$1,877,539 |
2/28/2026 |
$1,548,478 |
$1,863,270 |
3/31/2026 |
$1,460,482 |
$1,770,488 |
4/30/2026 |
$1,621,877 |
$1,956,260 |
5/31/2026 |
$1,728,223 |
$2,059,224 |
6/30/2026 |
$1,697,183 |
$2,039,614 |
7/31/2026 |
$1,695,090 |
$2,038,319 |
|
|
| Average Annual Return [Table Text Block] |
Table Summary
Name |
1 Year |
5 Years |
10 Years |
Institutional shares |
17.28% |
8.87% |
12.99% |
S&P 500 Index |
19.56% |
12.86% |
15.08% | |
|
| No Deduction of Taxes [Text Block] |
The graph and table do not reflect the deduction of taxes that a shareholder would pay on Fund distributions or redemption of Fund shares.
|
|
| Updated Performance Information Location [Text Block] |
Visit domini.com/performance for the most recent performance information.
|
|
| AssetsNet |
$ 1,192,826,490
|
|
| Holdings Count | Holding |
157
|
|
| Advisory Fees Paid, Amount |
$ 7,501,900
|
|
| InvestmentCompanyPortfolioTurnover |
51.00%
|
|
| Additional Fund Statistics [Text Block] |
The following table outlines certain key Fund statistics as of the end of the reporting period:
Table Summary
Fund's net assets |
$1,192,826,490 |
Total number of portfolio holdings |
157 |
Portfolio turnover rate |
51% |
Total advisory fees paid |
$7,501,900 | |
|
| Holdings [Text Block] |
SECTOR ALLOCATION (% of net assets)
Table Summary
Value |
Value |
Other Assets, Less Liabilities |
0.1% |
Utilities |
1.4% |
Consumer Staples |
3.0% |
Materials |
3.3% |
Real Estate |
5.0% |
Industrials |
5.3% |
Consumer Discretionary |
8.2% |
Communication Services |
8.5% |
Health Care |
9.8% |
Financials |
15.6% |
Information Technology |
39.8% | |
|
| Largest Holdings [Text Block] |
TOP TEN HOLDINGS (% of net assets)
Table Summary
NVIDIA Corp. |
7.4% |
Apple, Inc. |
7.1% |
Alphabet, Inc., Class A |
5.6% |
Microsoft Corp. |
5.4% |
Amazon.com, Inc. |
4.1% |
Broadcom, Inc. |
3.8% |
Micron Technology, Inc. |
2.5% |
Eli Lilly & Co. |
2.3% |
Visa, Inc., Class A |
2.1% |
Mastercard, Inc., Class A |
1.9% | |
|
| Updated Prospectus Phone Number |
1-800-582-6757
|
|
| Updated Prospectus Web Address |
domini.com/funddocuments
|
|
| C000009467 |
|
|
| Shareholder Report [Line Items] |
|
|
| Fund Name |
Domini Impact Equity Fund
|
|
| Class Name |
CLASS Y SHARES
|
|
| Trading Symbol |
DSFRX
|
|
| Annual or Semi-Annual Statement [Text Block] |
This annual shareholder report contains important information about the Domini Impact Equity Fund for the period of August 1, 2025 to July 31, 2026.
|
|
| Additional Information [Text Block] |
You can find additional information about the Fund at domini.com. You can also request information by contacting us at 1-800-582-6757 or by emailing funddocuments@domini.com.
|
|
| Additional Information Phone Number |
1-800-582-6757
|
|
| Additional Information Email |
<span style="box-sizing: border-box; color: rgb(0, 0, 0); display: inline; flex-wrap: nowrap; font-size: 12px; font-weight: 400; grid-area: auto; line-height: 18px; margin: 0px; overflow: visible; text-align: left; text-align-last: auto; white-space-collapse: preserve-breaks;">funddocuments@domini.com</span>
|
|
| Additional Information Website |
domini.com
|
|
| Expenses [Text Block] |
What were the Fund costs for last year?(based on a hypothetical $10,000 investment)
Table Summary
Class Name |
Cost of a $10,000 investment |
Costs paid as a percentage of a $10,000 investment |
Class Y shares |
$87 |
0.80% | |
|
| Expenses Paid, Amount |
$ 87
|
|
| Expense Ratio, Percent |
0.80%
|
|
| Factors Affecting Performance [Text Block] |
How did the Fund perform last year and what affected its performance?The Fund’s Class Y shares returned 17.19% for the trailing twelve months ended July 31, 2026, underperforming relative to the S&P 500 Index (the “benchmark”), which returned 19.56%. The Fund invests in a diversified U.S. equity portfolio consistent with the promotion of universal human dignity and ecological sustainability. It does not invest in the GICS Energy sector in accordance with Domini’s exclusionary standards on fossil fuels. U.S. equities delivered strong returns over the period, buoyed by continued enthusiasm for artificial intelligence (AI) infrastructure spending, resilient corporate earnings, and three Federal Reserve rate cuts in the second half of 2025. Markets navigated meaningful volatility, including a first-quarter 2026 selloff tied to U.S.–Iran tensions that sent energy prices sharply higher. This was followed by a strong rebound in the second quarter, as initial reports of a potential cease-fire supported a recovery in risk appetite. Stock selection was the primary reason that the Fund’s returns lagged the benchmark, with weak selection in Materials and Health Care partially offset by stronger selection in Communication Services. Sector positioning also had a negative impact overall, predominantly driven by the Fund’s zero exposure to Energy, which was the top performing sector for the benchmark over the period. The largest individual detractor was an underweight position in Tesla, which the Fund did not hold during its strongest stretch of performance. Other detractors included an overweight position in Netflix, underweight positions in Lam Research and Eli Lilly, and an out-of-benchmark position in Royal Gold. Top contributors included technology names that benefited from strong AI-driven demand, including overweight positions in Micron Technology and Marvell Technology. Other contributors included an underweight position in Oracle, as well as not holding Meta Platforms and Palantir Technologies, both of which are currently ineligible for investment based on Domini’s qualitative evaluation of their environmental and social impact. Top Relative ContributorsSectors: Stocks: Micron Technology, Inc. (overweight) Meta Platforms, Inc. (not held, ineligible) Marvell Technology, Inc. (overweight)
Sectors: Materials (overweight) Health Care (overweight) Energy (excluded)
Stocks: Tesla, Inc. (underweight) Netflix, Inc. (overweight) Lam Research Corporation (underweight)
|
|
| Performance Past Does Not Indicate Future [Text] |
Keep in mind that the Fund's past performance is not a good predictor of how the Fund will perform in the future.
|
|
| Line Graph [Table Text Block] |
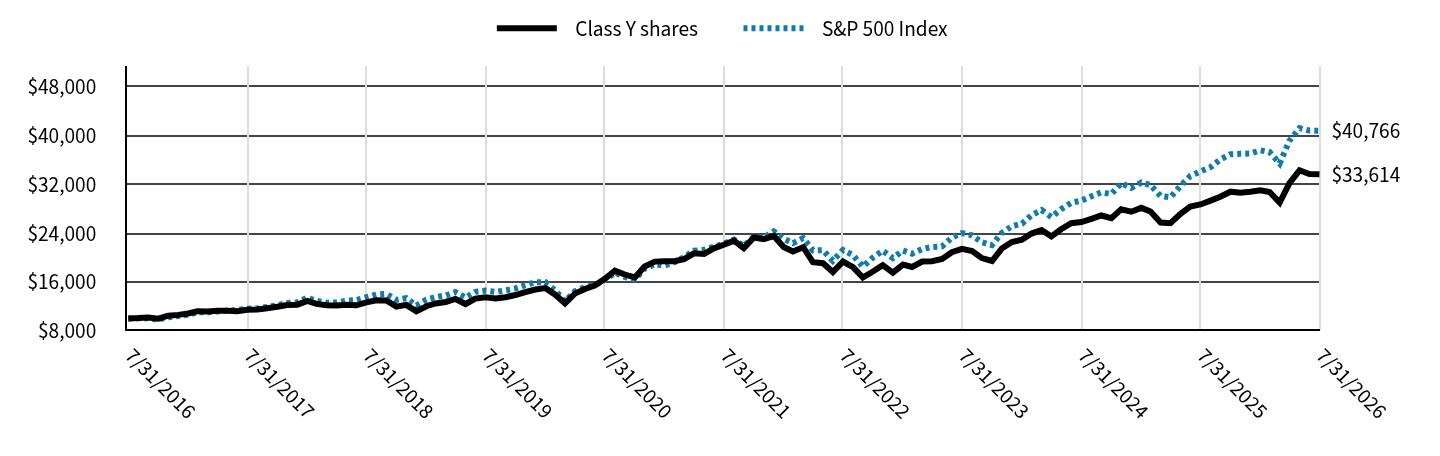
Table Summary
|
Class Y shares |
S&P 500 Index |
7/31/2016 |
$10,000 |
$10,000 |
8/31/2016 |
$10,064 |
$10,014 |
9/30/2016 |
$10,173 |
$10,016 |
10/31/2016 |
$9,962 |
$9,834 |
11/30/2016 |
$10,450 |
$10,198 |
12/31/2016 |
$10,587 |
$10,399 |
1/31/2017 |
$10,819 |
$10,597 |
2/28/2017 |
$11,188 |
$11,018 |
3/31/2017 |
$11,130 |
$11,031 |
4/30/2017 |
$11,246 |
$11,145 |
5/31/2017 |
$11,246 |
$11,302 |
6/30/2017 |
$11,168 |
$11,372 |
7/31/2017 |
$11,420 |
$11,606 |
8/31/2017 |
$11,459 |
$11,642 |
9/30/2017 |
$11,672 |
$11,882 |
10/31/2017 |
$11,924 |
$12,159 |
11/30/2017 |
$12,215 |
$12,532 |
12/31/2017 |
$12,264 |
$12,671 |
1/31/2018 |
$12,887 |
$13,397 |
2/28/2018 |
$12,383 |
$12,903 |
3/31/2018 |
$12,170 |
$12,575 |
4/30/2018 |
$12,107 |
$12,623 |
5/31/2018 |
$12,243 |
$12,927 |
6/30/2018 |
$12,157 |
$13,007 |
7/31/2018 |
$12,643 |
$13,491 |
8/31/2018 |
$12,978 |
$13,931 |
9/30/2018 |
$12,958 |
$14,010 |
10/31/2018 |
$11,935 |
$13,052 |
11/30/2018 |
$12,223 |
$13,318 |
12/31/2018 |
$11,168 |
$12,116 |
1/31/2019 |
$12,005 |
$13,086 |
2/28/2019 |
$12,453 |
$13,506 |
3/31/2019 |
$12,700 |
$13,768 |
4/30/2019 |
$13,193 |
$14,326 |
5/31/2019 |
$12,370 |
$13,416 |
6/30/2019 |
$13,258 |
$14,362 |
7/31/2019 |
$13,481 |
$14,569 |
8/31/2019 |
$13,277 |
$14,339 |
9/30/2019 |
$13,488 |
$14,607 |
10/31/2019 |
$13,837 |
$14,924 |
11/30/2019 |
$14,331 |
$15,465 |
12/31/2019 |
$14,748 |
$15,932 |
1/31/2020 |
$14,969 |
$15,926 |
2/29/2020 |
$13,935 |
$14,615 |
3/31/2020 |
$12,476 |
$12,810 |
4/30/2020 |
$14,066 |
$14,453 |
5/31/2020 |
$14,832 |
$15,141 |
6/30/2020 |
$15,408 |
$15,442 |
7/31/2020 |
$16,492 |
$16,313 |
8/31/2020 |
$17,830 |
$17,486 |
9/30/2020 |
$17,202 |
$16,821 |
10/31/2020 |
$16,718 |
$16,374 |
11/30/2020 |
$18,516 |
$18,167 |
12/31/2020 |
$19,316 |
$18,864 |
1/31/2021 |
$19,361 |
$18,674 |
2/28/2021 |
$19,380 |
$19,189 |
3/31/2021 |
$19,711 |
$20,030 |
4/30/2021 |
$20,666 |
$21,099 |
5/31/2021 |
$20,557 |
$21,247 |
6/30/2021 |
$21,489 |
$21,742 |
7/31/2021 |
$22,069 |
$22,259 |
8/31/2021 |
$22,750 |
$22,936 |
9/30/2021 |
$21,525 |
$21,870 |
10/31/2021 |
$23,264 |
$23,403 |
11/30/2021 |
$23,009 |
$23,241 |
12/31/2021 |
$23,506 |
$24,282 |
1/31/2022 |
$21,678 |
$23,027 |
2/28/2022 |
$20,983 |
$22,338 |
3/31/2022 |
$21,676 |
$23,167 |
4/30/2022 |
$19,218 |
$21,147 |
5/31/2022 |
$19,056 |
$21,185 |
6/30/2022 |
$17,611 |
$19,437 |
7/31/2022 |
$19,327 |
$21,229 |
8/31/2022 |
$18,394 |
$20,363 |
9/30/2022 |
$16,713 |
$18,488 |
10/31/2022 |
$17,693 |
$19,985 |
11/30/2022 |
$18,727 |
$21,103 |
12/31/2022 |
$17,504 |
$19,887 |
1/31/2023 |
$18,828 |
$21,136 |
2/28/2023 |
$18,442 |
$20,620 |
3/31/2023 |
$19,323 |
$21,377 |
4/30/2023 |
$19,385 |
$21,710 |
5/31/2023 |
$19,738 |
$21,804 |
6/30/2023 |
$20,857 |
$23,245 |
7/31/2023 |
$21,411 |
$23,992 |
8/31/2023 |
$21,058 |
$23,610 |
9/30/2023 |
$19,896 |
$22,484 |
10/31/2023 |
$19,418 |
$22,011 |
11/30/2023 |
$21,454 |
$24,022 |
12/31/2023 |
$22,516 |
$25,113 |
1/31/2024 |
$22,907 |
$25,535 |
2/29/2024 |
$23,915 |
$26,898 |
3/31/2024 |
$24,483 |
$27,764 |
4/30/2024 |
$23,439 |
$26,630 |
5/31/2024 |
$24,659 |
$27,950 |
6/30/2024 |
$25,613 |
$28,953 |
7/31/2024 |
$25,802 |
$29,306 |
8/31/2024 |
$26,329 |
$30,018 |
9/30/2024 |
$26,872 |
$30,660 |
10/31/2024 |
$26,422 |
$30,381 |
11/30/2024 |
$27,890 |
$32,164 |
12/31/2024 |
$27,491 |
$31,399 |
1/31/2025 |
$28,126 |
$32,272 |
2/28/2025 |
$27,528 |
$31,852 |
3/31/2025 |
$25,727 |
$30,058 |
4/30/2025 |
$25,609 |
$29,854 |
5/31/2025 |
$27,167 |
$31,733 |
6/30/2025 |
$28,321 |
$33,347 |
7/31/2025 |
$28,684 |
$34,095 |
8/31/2025 |
$29,306 |
$34,786 |
9/30/2025 |
$29,958 |
$36,056 |
10/31/2025 |
$30,773 |
$36,900 |
11/30/2025 |
$30,588 |
$36,992 |
12/31/2025 |
$30,764 |
$37,014 |
1/31/2026 |
$31,011 |
$37,551 |
2/28/2026 |
$30,714 |
$37,265 |
3/31/2026 |
$28,974 |
$35,410 |
4/30/2026 |
$32,174 |
$39,125 |
5/31/2026 |
$34,277 |
$41,184 |
6/30/2026 |
$33,664 |
$40,792 |
7/31/2026 |
$33,614 |
$40,766 |
|
|
| Average Annual Return [Table Text Block] |
Table Summary
Name |
1 Year |
5 Years |
10 Years |
Class Y shares |
17.19% |
8.78% |
12.89% |
S&P 500 Index |
19.56% |
12.86% |
15.08% | |
|
| No Deduction of Taxes [Text Block] |
The graph and table do not reflect the deduction of taxes that a shareholder would pay on Fund distributions or redemption of Fund shares.
|
|
| Updated Performance Information Location [Text Block] |
Visit domini.com/performance for the most recent performance information.
|
|
| AssetsNet |
$ 1,192,826,490
|
|
| Holdings Count | Holding |
157
|
|
| Advisory Fees Paid, Amount |
$ 7,501,900
|
|
| InvestmentCompanyPortfolioTurnover |
51.00%
|
|
| Additional Fund Statistics [Text Block] |
The following table outlines certain key Fund statistics as of the end of the reporting period:
Table Summary
Fund's net assets |
$1,192,826,490 |
Total number of portfolio holdings |
157 |
Portfolio turnover rate |
51% |
Total advisory fees paid |
$7,501,900 | |
|
| Holdings [Text Block] |
SECTOR ALLOCATION (% of net assets)
Table Summary
Value |
Value |
Other Assets, Less Liabilities |
0.1% |
Utilities |
1.4% |
Consumer Staples |
3.0% |
Materials |
3.3% |
Real Estate |
5.0% |
Industrials |
5.3% |
Consumer Discretionary |
8.2% |
Communication Services |
8.5% |
Health Care |
9.8% |
Financials |
15.6% |
Information Technology |
39.8% | |
|
| Largest Holdings [Text Block] |
TOP TEN HOLDINGS (% of net assets)
Table Summary
NVIDIA Corp. |
7.4% |
Apple, Inc. |
7.1% |
Alphabet, Inc., Class A |
5.6% |
Microsoft Corp. |
5.4% |
Amazon.com, Inc. |
4.1% |
Broadcom, Inc. |
3.8% |
Micron Technology, Inc. |
2.5% |
Eli Lilly & Co. |
2.3% |
Visa, Inc., Class A |
2.1% |
Mastercard, Inc., Class A |
1.9% | |
|
| Updated Prospectus Phone Number |
1-800-582-6757
|
|
| Updated Prospectus Web Address |
domini.com/funddocuments
|
|
| C000217516 |
|
|
| Shareholder Report [Line Items] |
|
|
| Fund Name |
Domini Sustainable Solutions Fund
|
|
| Class Name |
INVESTOR SHARES
|
|
| Trading Symbol |
CAREX
|
|
| Annual or Semi-Annual Statement [Text Block] |
This annual shareholder report contains important information about the Domini Sustainable Solutions Fund for the period of August 1, 2025 to July 31, 2026.
|
|
| Additional Information [Text Block] |
You can find additional information about the Fund at domini.com. You can also request information by contacting us at 1-800-582-6757 or by emailing funddocuments@domini.com.
|
|
| Material Fund Change Notice [Text Block] |
This report describes changes to the Fund that occurred during the reporting period.
|
|
| Additional Information Phone Number |
1-800-582-6757
|
|
| Additional Information Email |
<span style="box-sizing: border-box; color: rgb(0, 0, 0); display: inline; flex-wrap: nowrap; font-size: 12px; font-weight: 400; grid-area: auto; line-height: 18px; margin: 0px; overflow: visible; text-align: left; text-align-last: auto; white-space-collapse: preserve-breaks;">funddocuments@domini.com</span>
|
|
| Additional Information Website |
domini.com
|
|
| Expenses [Text Block] |
What were the Fund costs for last year?(based on a hypothetical $10,000 investment)
Table Summary
Class Name |
Cost of a $10,000 investment |
Costs paid as a percentage of a $10,000 investment |
Investor shares |
$152 |
1.33% | |
|
| Expenses Paid, Amount |
$ 152
|
|
| Expense Ratio, Percent |
1.33%
|
|
| Factors Affecting Performance [Text Block] |
How did the Fund perform last year and what affected its performance?The Fund’s Investor shares returned 28.83% for the trailing twelve months ended July 31, 2026, outperforming relative to the MSCI World Equal Weighted Net Total Return Index (the “benchmark”), which returned 18.66%. This Fund invests in a high-conviction portfolio of fewer than 50 stocks, seeking solution-oriented companies that support certain sustainability themes. The portfolio is constructed through bottom-up stock selection, and it is not managed to or constrained by the benchmark. Global equities delivered strong returns over the period, supported by resilient corporate earnings, three Federal Reserve rate cuts in the second half of 2025, and continued enthusiasm for artificial intelligence (AI) infrastructure spending. Markets navigated meaningful volatility, including a first-quarter 2026 selloff tied to U.S.–Iran tensions that sent energy prices sharply higher. This was followed by a strong rebound in the second quarter, as initial reports of a potential cease-fire supported a recovery in risk appetite. Relative to the benchmark, outperformance was primarily driven by stock selection and overweight positioning in Information Technology (IT), which benefited from AI-related infrastructure spending. The top overall contributor was optical networking company Ciena, which more than quadrupled during the period. Other IT names among the top contributors were specialty glass and fiber manufacturer Corning, electronics manufacturing services company Flex, and cybersecurity software company Palo Alto Networks. Selection was also strong in Industrials, where the top contributor was building systems company Comfort Systems USA. Top detractors included fintech and payments company Fiserv, Latin American e-commerce company MercadoLibre, design software company Autodesk, and healthcare robotics company Intuitive Surgical. Results were also negatively impacted by the Fund’s zero exposure to Energy, which was the top performing sector for the benchmark over the period. The Fund does not invest in the GICS Energy sector in accordance with Domini’s exclusionary standards on fossil fuels. Top Relative ContributorsSectors: Stocks: Ciena Corporation (overweight) Corning Incorporated (overweight) Comfort Systems USA, Inc. (overweight)
Sectors: Stocks: Fiserv, Inc. (overweight) MercadoLibre, Inc. (overweight) Autodesk, Inc. (overweight)
|
|
| Performance Past Does Not Indicate Future [Text] |
Keep in mind that the Fund's past performance is not a good predictor of how the Fund will perform in the future.
|
|
| Line Graph [Table Text Block] |
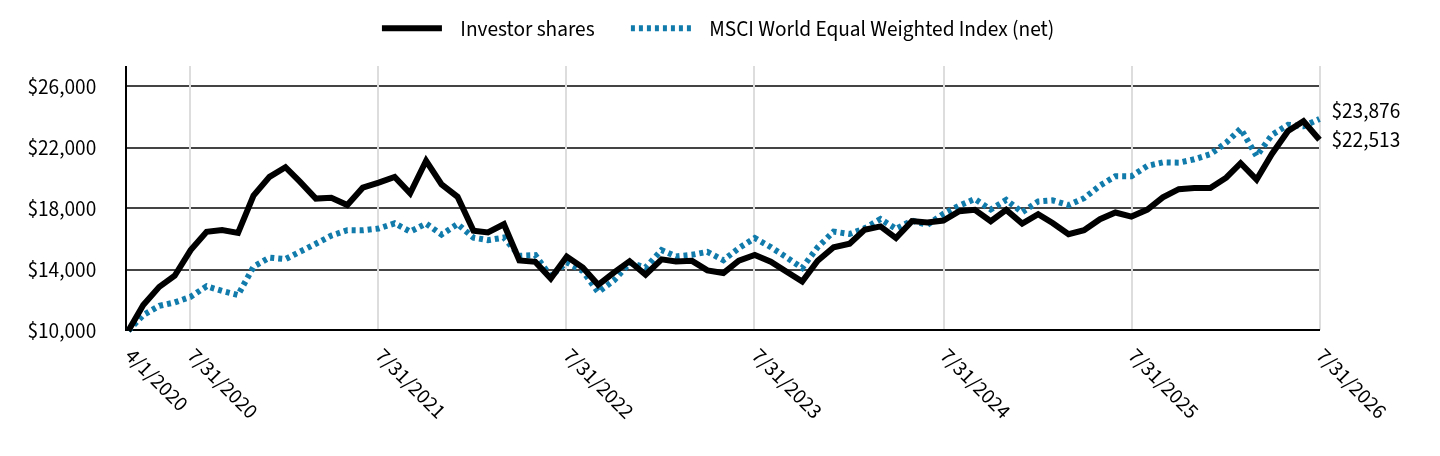
Table Summary
|
Investor shares |
MSCI World Equal Weighted Index (net) |
4/1/2020 |
$10,000 |
$10,000 |
4/30/2020 |
$11,680 |
$11,021 |
5/31/2020 |
$12,870 |
$11,628 |
6/30/2020 |
$13,600 |
$11,852 |
7/31/2020 |
$15,280 |
$12,216 |
8/31/2020 |
$16,480 |
$12,916 |
9/30/2020 |
$16,600 |
$12,606 |
10/31/2020 |
$16,410 |
$12,338 |
11/30/2020 |
$18,850 |
$14,186 |
12/31/2020 |
$20,084 |
$14,788 |
1/31/2021 |
$20,715 |
$14,690 |
2/28/2021 |
$19,764 |
$15,174 |
3/31/2021 |
$18,658 |
$15,696 |
4/30/2021 |
$18,709 |
$16,229 |
5/31/2021 |
$18,234 |
$16,580 |
6/30/2021 |
$19,371 |
$16,577 |
7/31/2021 |
$19,702 |
$16,695 |
8/31/2021 |
$20,074 |
$17,038 |
9/30/2021 |
$19,009 |
$16,493 |
10/31/2021 |
$21,138 |
$17,017 |
11/30/2021 |
$19,588 |
$16,301 |
12/31/2021 |
$18,776 |
$16,988 |
1/31/2022 |
$16,546 |
$16,096 |
2/28/2022 |
$16,439 |
$15,932 |
3/31/2022 |
$16,977 |
$16,100 |
4/30/2022 |
$14,597 |
$14,907 |
5/31/2022 |
$14,510 |
$14,953 |
6/30/2022 |
$13,412 |
$13,562 |
7/31/2022 |
$14,855 |
$14,482 |
8/31/2022 |
$14,133 |
$13,905 |
9/30/2022 |
$13,002 |
$12,524 |
10/31/2022 |
$13,821 |
$13,300 |
11/30/2022 |
$14,554 |
$14,454 |
12/31/2022 |
$13,670 |
$14,133 |
1/31/2023 |
$14,672 |
$15,283 |
2/28/2023 |
$14,532 |
$14,869 |
3/31/2023 |
$14,575 |
$14,974 |
4/30/2023 |
$13,950 |
$15,168 |
5/31/2023 |
$13,778 |
$14,615 |
6/30/2023 |
$14,586 |
$15,411 |
7/31/2023 |
$14,963 |
$16,073 |
8/31/2023 |
$14,521 |
$15,477 |
9/30/2023 |
$13,875 |
$14,820 |
10/31/2023 |
$13,218 |
$14,111 |
11/30/2023 |
$14,586 |
$15,469 |
12/31/2023 |
$15,469 |
$16,494 |
1/31/2024 |
$15,695 |
$16,339 |
2/29/2024 |
$16,611 |
$16,703 |
3/31/2024 |
$16,837 |
$17,315 |
4/30/2024 |
$16,072 |
$16,677 |
5/31/2024 |
$17,182 |
$17,209 |
6/30/2024 |
$17,088 |
$16,936 |
7/31/2024 |
$17,217 |
$17,657 |
8/31/2024 |
$17,831 |
$18,196 |
9/30/2024 |
$17,917 |
$18,629 |
10/31/2024 |
$17,174 |
$17,945 |
11/30/2024 |
$17,917 |
$18,572 |
12/31/2024 |
$17,023 |
$17,761 |
1/31/2025 |
$17,637 |
$18,468 |
2/28/2025 |
$17,055 |
$18,542 |
3/31/2025 |
$16,323 |
$18,233 |
4/30/2025 |
$16,581 |
$18,680 |
5/31/2025 |
$17,303 |
$19,510 |
6/30/2025 |
$17,745 |
$20,125 |
7/31/2025 |
$17,476 |
$20,121 |
8/31/2025 |
$17,939 |
$20,802 |
9/30/2025 |
$18,736 |
$21,029 |
10/31/2025 |
$19,275 |
$21,014 |
11/30/2025 |
$19,350 |
$21,234 |
12/31/2025 |
$19,350 |
$21,563 |
1/31/2026 |
$20,029 |
$22,321 |
2/28/2026 |
$20,977 |
$23,241 |
3/31/2026 |
$19,900 |
$21,448 |
4/30/2026 |
$21,602 |
$22,840 |
5/31/2026 |
$23,089 |
$23,494 |
6/30/2026 |
$23,731 |
$23,397 |
7/31/2026 |
$22,513 |
$23,876 |
|
|
| Average Annual Return [Table Text Block] |
Table Summary
Name |
1 Year |
5 Years |
Since Inception (4/1/20) |
Investor shares |
28.83% |
2.70% |
13.67% |
MSCI World Equal Weighted Index (net) |
18.66% |
7.41% |
14.72% | |
|
| Performance Inception Date |
Apr. 01, 2020
|
|
| No Deduction of Taxes [Text Block] |
The graph and table do not reflect the deduction of taxes that a shareholder would pay on Fund distributions or redemption of Fund shares.
|
|
| Material Change Date |
|
Jul. 31, 2025
|
| Updated Performance Information Location [Text Block] |
Visit domini.com/performance for the most recent performance information.
|
|
| AssetsNet |
$ 54,551,263
|
|
| Holdings Count | Holding |
47
|
|
| Advisory Fees Paid, Amount |
$ 394,759
|
|
| InvestmentCompanyPortfolioTurnover |
42.00%
|
|
| Additional Fund Statistics [Text Block] |
The following table outlines certain key Fund statistics as of the end of the reporting period:
Table Summary
Fund's net assets |
$54,551,263 |
Total number of portfolio holdings |
47 |
Portfolio turnover rate |
42% |
Total advisory fees paid |
$394,759 | |
|
| Holdings [Text Block] |
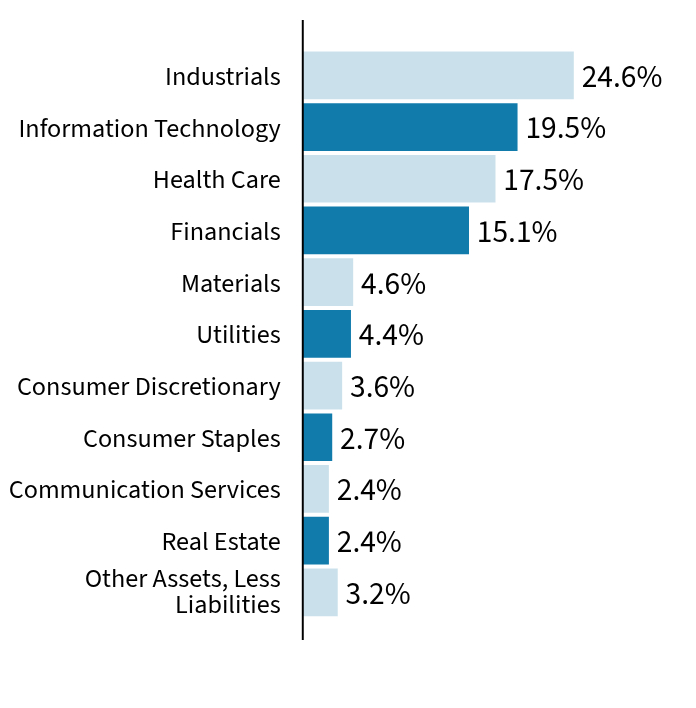
SECTOR ALLOCATION (% of net assets)
Table Summary
Value |
Value |
Other Assets, Less Liabilities |
3.2% |
Real Estate |
2.4% |
Communication Services |
2.4% |
Consumer Staples |
2.7% |
Consumer Discretionary |
3.6% |
Utilities |
4.4% |
Materials |
4.6% |
Financials |
15.1% |
Health Care |
17.5% |
Information Technology |
19.5% |
Industrials |
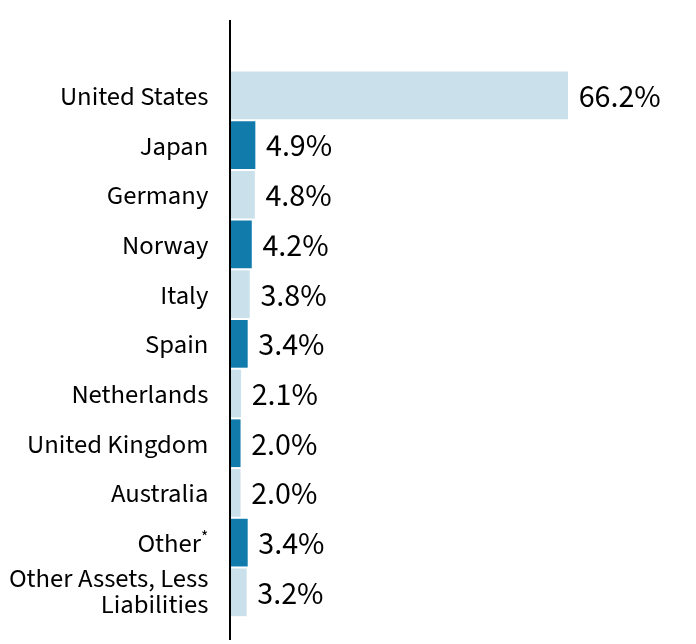
24.6% | GEOGRAPHICAL ALLOCATION (% of net assets)
Table Summary
Value |
Value |
Other Assets, Less Liabilities |
3.2% |
OtherFootnote Reference* |
3.4% |
Australia |
2.0% |
United Kingdom |
2.0% |
Netherlands |
2.1% |
Spain |
3.4% |
Italy |
3.8% |
Norway |
4.2% |
Germany |
4.8% |
Japan |
4.9% |
United States |
66.2% |
| Footnote |
Description |
Footnote* |
Amounts represent investments in countries less than 2% of net assets | |
|
| Largest Holdings [Text Block] |
TOP TEN HOLDINGS (% of net assets)
Table Summary
Palo Alto Networks, Inc. |
4.2% |
CaixaBank SA |
3.4% |
Vertex Pharmaceuticals, Inc. |
3.4% |
DNB Bank ASA |
3.1% |
Federal Agricultural Mortgage Corp., Class C |
3.0% |
Crowdstrike Holdings, Inc., Class A |
3.0% |
GSK PLC |
2.9% |
Resona Holdings, Inc. |
2.8% |
Natera, Inc. |
2.7% |
Quest Diagnostics, Inc. |
2.7% | |
|
| Material Fund Change [Text Block] |
This is a summary of certain changes to the Fund since July 31, 2025. For more complete information, you may review the Fund’s prospectus at domini.com/funddocuments. Reduction in expense limitation: Effective November 30, 2025, the Adviser reduced the contractual expense limitation for the Fund's Investor shares from 1.40% to 1.30%. The reduced expense limitation is in effect through November 30, 2026. |
|
| Material Fund Change Expenses [Text Block] |
Reduction in expense limitation: Effective November 30, 2025, the Adviser reduced the contractual expense limitation for the Fund's Investor shares from 1.40% to 1.30%. The reduced expense limitation is in effect through November 30, 2026.
|
|
| Summary of Change Legend [Text Block] |
This is a summary of certain changes to the Fund since July 31, 2025. For more complete information, you may review the Fund’s prospectus at domini.com/funddocuments.
|
|
| Updated Prospectus Phone Number |
1-800-582-6757
|
|
| Updated Prospectus Web Address |
domini.com/funddocuments
|
|
| C000217517 |
|
|
| Shareholder Report [Line Items] |
|
|
| Fund Name |
Domini Sustainable Solutions Fund
|
|
| Class Name |
INSTITUTIONAL SHARES
|
|
| Trading Symbol |
LIFEX
|
|
| Annual or Semi-Annual Statement [Text Block] |
This annual shareholder report contains important information about the Domini Sustainable Solutions Fund for the period of August 1, 2025 to July 31, 2026.
|
|
| Additional Information [Text Block] |
You can find additional information about the Fund at domini.com. You can also request information by contacting us at 1-800-582-6757 or by emailing funddocuments@domini.com.
|
|
| Material Fund Change Notice [Text Block] |
This report describes changes to the Fund that occurred during the reporting period.
|
|
| Additional Information Phone Number |
1-800-582-6757
|
|
| Additional Information Email |
<span style="box-sizing: border-box; color: rgb(0, 0, 0); display: inline; flex-wrap: nowrap; font-size: 12px; font-weight: 400; grid-area: auto; line-height: 18px; margin: 0px; overflow: visible; text-align: left; text-align-last: auto; white-space-collapse: preserve-breaks;">funddocuments@domini.com</span>
|
|
| Additional Information Website |
domini.com
|
|
| Expenses [Text Block] |
What were the Fund costs for last year?(based on a hypothetical $10,000 investment)
Table Summary
Class Name |
Cost of a $10,000 investment |
Costs paid as a percentage of a $10,000 investment |
Institutional shares |
$124 |
1.08% | |
|
| Expenses Paid, Amount |
$ 124
|
|
| Expense Ratio, Percent |
1.08%
|
|
| Factors Affecting Performance [Text Block] |
How did the Fund perform last year and what affected its performance?The Fund’s Institutional shares returned 29.09% for the trailing twelve months ended July 31, 2026, outperforming relative to the MSCI World Equal Weighted Net Total Return Index (the “benchmark”), which returned 18.66%. This Fund invests in a high-conviction portfolio of fewer than 50 stocks, seeking solution-oriented companies that support certain sustainability themes. The portfolio is constructed through bottom-up stock selection, and it is not managed to or constrained by the benchmark. Global equities delivered strong returns over the period, supported by resilient corporate earnings, three Federal Reserve rate cuts in the second half of 2025, and continued enthusiasm for artificial intelligence (AI) infrastructure spending. Markets navigated meaningful volatility, including a first-quarter 2026 selloff tied to U.S.–Iran tensions that sent energy prices sharply higher. This was followed by a strong rebound in the second quarter, as initial reports of a potential cease-fire supported a recovery in risk appetite. Relative to the benchmark, outperformance was primarily driven by stock selection and overweight positioning in Information Technology (IT), which benefited from AI-related infrastructure spending. The top overall contributor was optical networking company Ciena, which more than quadrupled during the period. Other IT names among the top contributors were specialty glass and fiber manufacturer Corning, electronics manufacturing services company Flex, and cybersecurity software company Palo Alto Networks. Selection was also strong in Industrials, where the top contributor was building systems company Comfort Systems USA. Top detractors included fintech and payments company Fiserv, Latin American e-commerce company MercadoLibre, design software company Autodesk, and healthcare robotics company Intuitive Surgical. Results were also negatively impacted by the Fund’s zero exposure to Energy, which was the top performing sector for the benchmark over the period. The Fund does not invest in the GICS Energy sector in accordance with Domini’s exclusionary standards on fossil fuels. Top Relative ContributorsSectors: Stocks: Ciena Corporation (overweight) Corning Incorporated (overweight) Comfort Systems USA, Inc. (overweight)
Sectors: Stocks: Fiserv, Inc. (overweight) MercadoLibre, Inc. (overweight) Autodesk, Inc. (overweight)
|
|
| Performance Past Does Not Indicate Future [Text] |
Keep in mind that the Fund's past performance is not a good predictor of how the Fund will perform in the future.
|
|
| Line Graph [Table Text Block] |
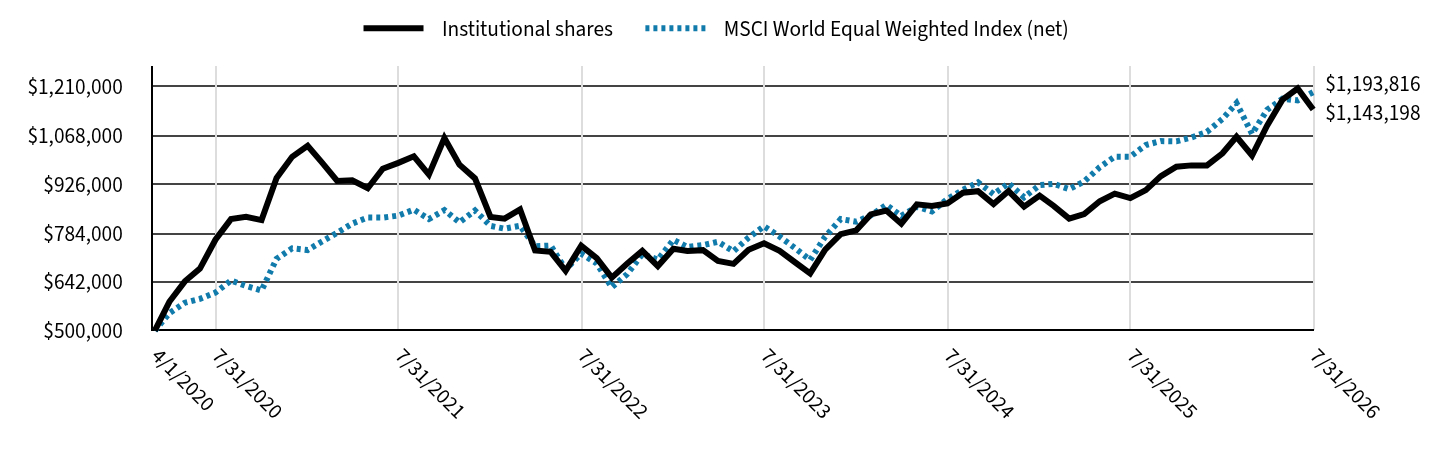
Table Summary
|
Institutional shares |
MSCI World Equal Weighted Index (net) |
4/1/2020 |
$500,000 |
$500,000 |
4/30/2020 |
$584,000 |
$551,030 |
5/31/2020 |
$643,500 |
$581,419 |
6/30/2020 |
$680,500 |
$592,620 |
7/31/2020 |
$764,500 |
$610,794 |
8/31/2020 |
$824,500 |
$645,808 |
9/30/2020 |
$831,000 |
$630,282 |
10/31/2020 |
$821,500 |
$616,886 |
11/30/2020 |
$944,000 |
$709,275 |
12/31/2020 |
$1,005,703 |
$739,411 |
1/31/2021 |
$1,037,745 |
$734,492 |
2/28/2021 |
$990,199 |
$758,678 |
3/31/2021 |
$935,418 |
$784,777 |
4/30/2021 |
$937,485 |
$811,460 |
5/31/2021 |
$914,229 |
$828,977 |
6/30/2021 |
$971,077 |
$828,857 |
7/31/2021 |
$988,132 |
$834,769 |
8/31/2021 |
$1,007,253 |
$851,916 |
9/30/2021 |
$954,023 |
$824,655 |
10/31/2021 |
$1,060,484 |
$850,845 |
11/30/2021 |
$982,964 |
$815,068 |
12/31/2021 |
$942,931 |
$849,397 |
1/31/2022 |
$830,729 |
$804,800 |
2/28/2022 |
$825,874 |
$796,577 |
3/31/2022 |
$852,846 |
$805,008 |
4/30/2022 |
$733,091 |
$745,361 |
5/31/2022 |
$729,315 |
$747,626 |
6/30/2022 |
$674,293 |
$678,097 |
7/31/2022 |
$747,117 |
$724,118 |
8/31/2022 |
$710,974 |
$695,261 |
9/30/2022 |
$654,334 |
$626,223 |
10/31/2022 |
$695,331 |
$665,011 |
11/30/2022 |
$732,012 |
$722,700 |
12/31/2022 |
$687,779 |
$706,658 |
1/31/2023 |
$738,486 |
$764,165 |
2/28/2023 |
$732,012 |
$743,464 |
3/31/2023 |
$734,170 |
$748,720 |
4/30/2023 |
$702,883 |
$758,408 |
5/31/2023 |
$694,252 |
$730,774 |
6/30/2023 |
$735,249 |
$770,528 |
7/31/2023 |
$754,129 |
$803,650 |
8/31/2023 |
$732,012 |
$773,859 |
9/30/2023 |
$699,646 |
$741,021 |
10/31/2023 |
$666,741 |
$705,552 |
11/30/2023 |
$735,788 |
$773,428 |
12/31/2023 |
$780,562 |
$824,700 |
1/31/2024 |
$791,890 |
$816,967 |
2/29/2024 |
$838,281 |
$835,165 |
3/31/2024 |
$849,609 |
$865,770 |
4/30/2024 |
$811,309 |
$833,857 |
5/31/2024 |
$867,410 |
$860,457 |
6/30/2024 |
$862,989 |
$846,781 |
7/31/2024 |
$870,010 |
$882,870 |
8/31/2024 |
$901,332 |
$909,795 |
9/30/2024 |
$905,653 |
$931,439 |
10/31/2024 |
$868,390 |
$897,228 |
11/30/2024 |
$906,193 |
$928,596 |
12/31/2024 |
$860,829 |
$888,034 |
1/31/2025 |
$892,692 |
$923,423 |
2/28/2025 |
$862,989 |
$927,115 |
3/31/2025 |
$825,726 |
$911,632 |
4/30/2025 |
$839,227 |
$933,996 |
5/31/2025 |
$876,490 |
$975,518 |
6/30/2025 |
$898,533 |
$1,006,239 |
7/31/2025 |
$885,550 |
$1,006,052 |
8/31/2025 |
$908,811 |
$1,040,092 |
9/30/2025 |
$949,383 |
$1,051,452 |
10/31/2025 |
$976,972 |
$1,050,680 |
11/30/2025 |
$980,759 |
$1,061,712 |
12/31/2025 |
$980,759 |
$1,078,142 |
1/31/2026 |
$1,015,921 |
$1,116,069 |
2/28/2026 |
$1,064,067 |
$1,162,074 |
3/31/2026 |
$1,009,430 |
$1,072,380 |
4/30/2026 |
$1,095,983 |
$1,142,013 |
5/31/2026 |
$1,172,259 |
$1,174,678 |
6/30/2026 |
$1,204,450 |
$1,169,842 |
7/31/2026 |
$1,143,198 |
$1,193,816 |
|
|
| Average Annual Return [Table Text Block] |
Table Summary
Name |
1 Year |
5 Years |
Since Inception (4/1/20) |
Institutional shares |
29.09% |
2.96% |
13.95% |
MSCI World Equal Weighted Index (net) |
18.66% |
7.41% |
14.72% | |
|
| Performance Inception Date |
Apr. 01, 2020
|
|
| No Deduction of Taxes [Text Block] |
The graph and table do not reflect the deduction of taxes that a shareholder would pay on Fund distributions or redemption of Fund shares.
|
|
| Material Change Date |
|
Jul. 31, 2025
|
| Updated Performance Information Location [Text Block] |
Visit domini.com/performance for the most recent performance information.
|
|
| AssetsNet |
$ 54,551,263
|
|
| Holdings Count | Holding |
47
|
|
| Advisory Fees Paid, Amount |
$ 394,759
|
|
| InvestmentCompanyPortfolioTurnover |
42.00%
|
|
| Additional Fund Statistics [Text Block] |
The following table outlines certain key Fund statistics as of the end of the reporting period:
Table Summary
Fund's net assets |
$54,551,263 |
Total number of portfolio holdings |
47 |
Portfolio turnover rate |
42% |
Total advisory fees paid |
$394,759 | |
|
| Holdings [Text Block] |
SECTOR ALLOCATION (% of net assets)
Table Summary
Value |
Value |
Other Assets, Less Liabilities |
3.2% |
Real Estate |
2.4% |
Communication Services |
2.4% |
Consumer Staples |
2.7% |
Consumer Discretionary |
3.6% |
Utilities |
4.4% |
Materials |
4.6% |
Financials |
15.1% |
Health Care |
17.5% |
Information Technology |
19.5% |
Industrials |
24.6% | GEOGRAPHICAL ALLOCATION (% of net assets)
Table Summary
Value |
Value |
Other Assets, Less Liabilities |
3.2% |
OtherFootnote Reference* |
3.4% |
Australia |
2.0% |
United Kingdom |
2.0% |
Netherlands |
2.1% |
Spain |
3.4% |
Italy |
3.8% |
Norway |
4.2% |
Germany |
4.8% |
Japan |
4.9% |
United States |
66.2% |
| Footnote |
Description |
Footnote* |
Amounts represent investments in countries less than 2% of net assets | |
|
| Largest Holdings [Text Block] |
TOP TEN HOLDINGS (% of net assets)
Table Summary
Palo Alto Networks, Inc. |
4.2% |
CaixaBank SA |
3.4% |
Vertex Pharmaceuticals, Inc. |
3.4% |
DNB Bank ASA |
3.1% |
Federal Agricultural Mortgage Corp., Class C |
3.0% |
Crowdstrike Holdings, Inc., Class A |
3.0% |
GSK PLC |
2.9% |
Resona Holdings, Inc. |
2.8% |
Natera, Inc. |
2.7% |
Quest Diagnostics, Inc. |
2.7% | |
|
| Material Fund Change [Text Block] |
This is a summary of certain changes to the Fund since July 31, 2025. For more complete information, you may review the Fund’s prospectus at domini.com/funddocuments. Reduction in expense limitation: Effective November 30, 2025, the Adviser reduced the contractual expense limitation for the Fund's Institutional shares from 1.15% to 1.05%. The reduced expense limitation is in effect through November 30, 2026. |
|
| Material Fund Change Expenses [Text Block] |
Reduction in expense limitation: Effective November 30, 2025, the Adviser reduced the contractual expense limitation for the Fund's Institutional shares from 1.15% to 1.05%. The reduced expense limitation is in effect through November 30, 2026.
|
|
| Summary of Change Legend [Text Block] |
This is a summary of certain changes to the Fund since July 31, 2025. For more complete information, you may review the Fund’s prospectus at domini.com/funddocuments.
|
|
| Updated Prospectus Phone Number |
1-800-582-6757
|
|
| Updated Prospectus Web Address |
domini.com/funddocuments
|
|
| C000039201 |
|
|
| Shareholder Report [Line Items] |
|
|
| Fund Name |
Domini Impact International Equity Fund
|
|
| Class Name |
INVESTOR SHARES
|
|
| Trading Symbol |
DOMIX
|
|
| Annual or Semi-Annual Statement [Text Block] |
This annual shareholder report contains important information about the Domini Impact International Equity Fund for the period of August 1, 2025 to July 31, 2026.
|
|
| Additional Information [Text Block] |
You can find additional information about the Fund at domini.com. You can also request information by contacting us at 1-800-582-6757 or by emailing funddocuments@domini.com.
|
|
| Material Fund Change Notice [Text Block] |
This report describes changes to the Fund that occurred during the reporting period.
|
|
| Additional Information Phone Number |
1-800-582-6757
|
|
| Additional Information Email |
<span style="box-sizing: border-box; color: rgb(0, 0, 0); display: inline; flex-wrap: nowrap; font-size: 12px; font-weight: 400; grid-area: auto; line-height: 18px; margin: 0px; overflow: visible; text-align: left; text-align-last: auto; white-space-collapse: preserve-breaks;">funddocuments@domini.com</span>
|
|
| Additional Information Website |
domini.com
|
|
| Expenses [Text Block] |
What were the Fund costs for last year?(based on a hypothetical $10,000 investment)
Table Summary
Class Name |
Cost of a $10,000 investment |
Costs paid as a percentage of a $10,000 investment |
Investor shares |
$145 |
1.29% | |
|
| Expenses Paid, Amount |
$ 145
|
|
| Expense Ratio, Percent |
1.29%
|
|
| Factors Affecting Performance [Text Block] |
How did the Fund perform last year and what affected its performance?The Fund’s Investor shares returned 24.14% for the trailing twelve months ended July 31, 2026, underperforming relative to the MSCI EAFE Net Total Return Index (the “benchmark”), which returned 24.33%. International developed equities delivered strong returns over the period, outpacing U.S. equities, supported by resilient corporate earnings, continued investment in artificial intelligence (AI) infrastructure, and supportive central bank actions across major economies. Markets navigated meaningful volatility, including a first-quarter 2026 selloff tied to U.S.–Iran tensions that sent energy prices sharply higher. This was followed by a strong rebound in the second quarter, as initial reports of a potential cease-fire in early April supported a recovery in risk appetite. Domini, the Fund’s Adviser, determines which companies meet its Impact Investment Standards. Wellington Management, the Fund’s Subadviser, then selects Domini-approved securities and manages risk using proprietary quantitative models. In aggregate, Wellington’s Quantitative Equity (“QE”) model made a positive contribution to performance over the period, driven by positive performance from value and momentum factors and partially offset by negative performance from quality factors. From a sector perspective, positive stock selection in Consumer Discretionary, Financials, Industrials, and Communication Services was partially offset by weaker selection in Information Technology and Materials. Sector positioning detracted overall, predominantly driven by the Fund’s zero exposure to Energy, which was among the top performing sectors over the period. The Fund does not invest in the GICS Energy sector in accordance with Domini’s exclusionary standards on fossil fuels. The top individual contributors were overweight positions in pharmaceutical company GSK and banking groups Banco Santander and ABN AMRO. The top detractors were an underweight position in semiconductor equipment supplier ASML and overweight positions in investment company 3i Group and accounting software company Sage Group. Top Relative ContributorsSectors: Stocks: ASML Holding N.V. (underweight) 3i Group plc (overweight) The Sage Group plc (overweight)
|
|
| Performance Past Does Not Indicate Future [Text] |
Keep in mind that the Fund's past performance is not a good predictor of how the Fund will perform in the future.
|
|
| Line Graph [Table Text Block] |
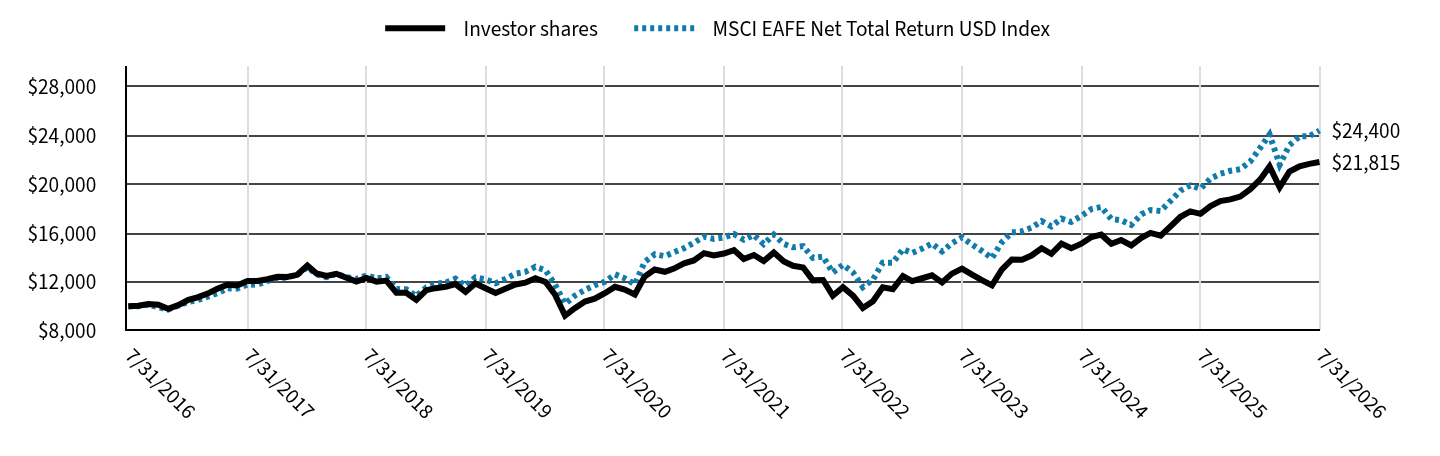
Table Summary
|
Investor shares |
MSCI EAFE Net Total Return USD Index |
7/31/2016 |
$10,000 |
$10,000 |
8/31/2016 |
$10,041 |
$10,007 |
9/30/2016 |
$10,190 |
$10,130 |
10/31/2016 |
$10,122 |
$9,923 |
11/30/2016 |
$9,797 |
$9,725 |
12/31/2016 |
$10,092 |
$10,058 |
1/31/2017 |
$10,518 |
$10,349 |
2/28/2017 |
$10,724 |
$10,497 |
3/31/2017 |
$11,039 |
$10,786 |
4/30/2017 |
$11,438 |
$11,060 |
5/31/2017 |
$11,767 |
$11,466 |
6/30/2017 |
$11,703 |
$11,446 |
7/31/2017 |
$12,061 |
$11,775 |
8/31/2017 |
$12,074 |
$11,771 |
9/30/2017 |
$12,226 |
$12,064 |
10/31/2017 |
$12,419 |
$12,247 |
11/30/2017 |
$12,405 |
$12,376 |
12/31/2017 |
$12,575 |
$12,575 |
1/31/2018 |
$13,335 |
$13,206 |
2/28/2018 |
$12,688 |
$12,611 |
3/31/2018 |
$12,490 |
$12,384 |
4/30/2018 |
$12,659 |
$12,666 |
5/31/2018 |
$12,336 |
$12,381 |
6/30/2018 |
$12,029 |
$12,230 |
7/31/2018 |
$12,311 |
$12,531 |
8/31/2018 |
$12,014 |
$12,289 |
9/30/2018 |
$12,099 |
$12,396 |
10/31/2018 |
$11,097 |
$11,409 |
11/30/2018 |
$11,097 |
$11,394 |
12/31/2018 |
$10,520 |
$10,842 |
1/31/2019 |
$11,319 |
$11,554 |
2/28/2019 |
$11,482 |
$11,849 |
3/31/2019 |
$11,601 |
$11,923 |
4/30/2019 |
$11,822 |
$12,258 |
5/31/2019 |
$11,171 |
$11,670 |
6/30/2019 |
$11,858 |
$12,362 |
7/31/2019 |
$11,472 |
$12,205 |
8/31/2019 |
$11,087 |
$11,889 |
9/30/2019 |
$11,442 |
$12,230 |
10/31/2019 |
$11,783 |
$12,669 |
11/30/2019 |
$11,932 |
$12,812 |
12/31/2019 |
$12,303 |
$13,229 |
1/31/2020 |
$11,984 |
$12,952 |
2/29/2020 |
$10,965 |
$11,781 |
3/31/2020 |
$9,231 |
$10,209 |
4/30/2020 |
$9,840 |
$10,868 |
5/31/2020 |
$10,387 |
$11,341 |
6/30/2020 |
$10,615 |
$11,726 |
7/31/2020 |
$11,072 |
$12,000 |
8/31/2020 |
$11,589 |
$12,616 |
9/30/2020 |
$11,360 |
$12,288 |
10/31/2020 |
$10,965 |
$11,798 |
11/30/2020 |
$12,425 |
$13,627 |
12/31/2020 |
$13,008 |
$14,260 |
1/31/2021 |
$12,825 |
$14,108 |
2/28/2021 |
$13,085 |
$14,425 |
3/31/2021 |
$13,513 |
$14,757 |
4/30/2021 |
$13,757 |
$15,201 |
5/31/2021 |
$14,353 |
$15,696 |
6/30/2021 |
$14,165 |
$15,520 |
7/31/2021 |
$14,319 |
$15,637 |
8/31/2021 |
$14,597 |
$15,912 |
9/30/2021 |
$13,872 |
$15,451 |
10/31/2021 |
$14,196 |
$15,831 |
11/30/2021 |
$13,703 |
$15,095 |
12/31/2021 |
$14,398 |
$15,867 |
1/31/2022 |
$13,671 |
$15,101 |
2/28/2022 |
$13,316 |
$14,833 |
3/31/2022 |
$13,176 |
$14,929 |
4/30/2022 |
$12,125 |
$13,963 |
5/31/2022 |
$12,156 |
$14,068 |
6/30/2022 |
$10,863 |
$12,762 |
7/31/2022 |
$11,566 |
$13,398 |
8/31/2022 |
$10,863 |
$12,761 |
9/30/2022 |
$9,862 |
$11,568 |
10/31/2022 |
$10,409 |
$12,190 |
11/30/2022 |
$11,550 |
$13,563 |
12/31/2022 |
$11,397 |
$13,574 |
1/31/2023 |
$12,469 |
$14,673 |
2/28/2023 |
$12,059 |
$14,367 |
3/31/2023 |
$12,295 |
$14,723 |
4/30/2023 |
$12,532 |
$15,138 |
5/31/2023 |
$11,949 |
$14,498 |
6/30/2023 |
$12,672 |
$15,157 |
7/31/2023 |
$13,089 |
$15,648 |
8/31/2023 |
$12,592 |
$15,049 |
9/30/2023 |
$12,143 |
$14,535 |
10/31/2023 |
$11,710 |
$13,946 |
11/30/2023 |
$12,993 |
$15,240 |
12/31/2023 |
$13,835 |
$16,050 |
1/31/2024 |
$13,803 |
$16,142 |
2/29/2024 |
$14,157 |
$16,438 |
3/31/2024 |
$14,753 |
$16,978 |
4/30/2024 |
$14,302 |
$16,543 |
5/31/2024 |
$15,139 |
$17,184 |
6/30/2024 |
$14,754 |
$16,906 |
7/31/2024 |
$15,130 |
$17,402 |
8/31/2024 |
$15,670 |
$17,968 |
9/30/2024 |
$15,866 |
$18,134 |
10/31/2024 |
$15,114 |
$17,148 |
11/30/2024 |
$15,425 |
$17,050 |
12/31/2024 |
$14,977 |
$16,663 |
1/31/2025 |
$15,608 |
$17,538 |
2/28/2025 |
$16,006 |
$17,878 |
3/31/2025 |
$15,790 |
$17,806 |
4/30/2025 |
$16,537 |
$18,622 |
5/31/2025 |
$17,333 |
$19,474 |
6/30/2025 |
$17,772 |
$19,903 |
7/31/2025 |
$17,572 |
$19,624 |
8/31/2025 |
$18,205 |
$20,461 |
9/30/2025 |
$18,622 |
$20,852 |
10/31/2025 |
$18,755 |
$21,098 |
11/30/2025 |
$18,988 |
$21,228 |
12/31/2025 |
$19,594 |
$21,865 |
1/31/2026 |
$20,406 |
$23,006 |
2/28/2026 |
$21,455 |
$24,071 |
3/31/2026 |
$19,746 |
$21,594 |
4/30/2026 |
$21,032 |
$23,203 |
5/31/2026 |
$21,472 |
$23,915 |
6/30/2026 |
$21,662 |
$23,932 |
7/31/2026 |
$21,815 |
$24,400 |
|
|
| Average Annual Return [Table Text Block] |
Table Summary
Name |
1 Year |
5 Years |
10 Years |
Investor shares |
24.14% |
8.78% |
8.11% |
MSCI EAFE Net Total Return USD Index |
24.33% |
9.31% |
9.33% | |
|
| No Deduction of Taxes [Text Block] |
The graph and table do not reflect the deduction of taxes that a shareholder would pay on Fund distributions or redemption of Fund shares.
|
|
| Material Change Date |
|
Jul. 31, 2025
|
| Updated Performance Information Location [Text Block] |
Visit domini.com/performance for the most recent performance information.
|
|
| AssetsNet |
$ 1,023,935,683
|
|
| Holdings Count | Holding |
149
|
|
| Advisory Fees Paid, Amount |
$ 7,884,537
|
|
| InvestmentCompanyPortfolioTurnover |
88.00%
|
|
| Additional Fund Statistics [Text Block] |
The following table outlines certain key Fund statistics as of the end of the reporting period:
Table Summary
Fund's net assets |
$1,023,935,683 |
Total number of portfolio holdings |
149 |
Portfolio turnover rate |
88% |
Total advisory fees paid |
$7,884,537 | |
|
| Holdings [Text Block] |
SECTOR ALLOCATION (% of net assets)
Table Summary
Value |
Value |
Other Assets, Less Liabilities |
1.5% |
Utilities |
1.0% |
Real Estate |
3.2% |
Materials |
3.7% |
Consumer Staples |
4.0% |
Communication Services |
5.0% |
Consumer Discretionary |
10.3% |
Information Technology |
12.5% |
Health Care |
12.6% |
Industrials |
19.5% |
Financials |
26.7% | GEOGRAPHICAL ALLOCATION (% of net assets)
Table Summary
Value |
Value |
Other Assets, Less Liabilities |
1.5% |
OtherFootnote Reference* |
11.6% |
Spain |
3.4% |
Australia |
4.5% |
Switzerland |
4.6% |
Singapore |
4.6% |
Sweden |
5.7% |
United States |
7.3% |
Netherlands |
7.6% |
United Kingdom |
7.6% |
Germany |
8.7% |
France |
8.9% |
Japan |
24.0% |
| Footnote |
Description |
Footnote* |
Amounts represent investments in countries less than 2% of net assets | |
|
| Largest Holdings [Text Block] |
TOP TEN HOLDINGS (% of net assets)
Table Summary
Novartis AG |
3.4% |
ASML Holding NV |
2.9% |
BNP Paribas SA |
2.4% |
Banco Santander SA |
2.4% |
Sony Group Corp. |
2.4% |
Vodafone Group PLC |
2.3% |
Recruit Holdings Co. Ltd. |
2.3% |
Deutsche Telekom AG |
2.2% |
Sanofi SA |
2.1% |
Fortescue Ltd. |
2.1% | |
|
| Material Fund Change [Text Block] |
This is a summary of certain changes to the Fund since July 31, 2025. For more complete information, you may review the Fund’s prospectus at domini.com/funddocuments. Portfolio Manager update: Effective on June 30, 2026, Andrew Gossard, Managing Director, Director, Quantitative Equity Research, Quantitative Investment Group of Wellington Management Company LLP, was added as a portfolio manager of the Fund. Effective November 30, 2026, Mark Yarger will retire as a portfolio manager of the Fund and the portfolio managers of the Fund will be Christopher Grohe and Andrew Gossard of Wellington Management. |
|
| Material Fund Change Adviser [Text Block] |
Portfolio Manager update: Effective on June 30, 2026, Andrew Gossard, Managing Director, Director, Quantitative Equity Research, Quantitative Investment Group of Wellington Management Company LLP, was added as a portfolio manager of the Fund. Effective November 30, 2026, Mark Yarger will retire as a portfolio manager of the Fund and the portfolio managers of the Fund will be Christopher Grohe and Andrew Gossard of Wellington Management.
|
|
| Summary of Change Legend [Text Block] |
This is a summary of certain changes to the Fund since July 31, 2025. For more complete information, you may review the Fund’s prospectus at domini.com/funddocuments.
|
|
| Updated Prospectus Phone Number |
1-800-582-6757
|
|
| Updated Prospectus Web Address |
domini.com/funddocuments
|
|
| C000123188 |
|
|
| Shareholder Report [Line Items] |
|
|
| Fund Name |
Domini Impact International Equity Fund
|
|
| Class Name |
INSTITUTIONAL SHARES
|
|
| Trading Symbol |
DOMOX
|
|
| Annual or Semi-Annual Statement [Text Block] |
This annual shareholder report contains important information about the Domini Impact International Equity Fund for the period of August 1, 2025 to July 31, 2026.
|
|
| Additional Information [Text Block] |
You can find additional information about the Fund at domini.com. You can also request information by contacting us at 1-800-582-6757 or by emailing funddocuments@domini.com.
|
|
| Material Fund Change Notice [Text Block] |
This report describes changes to the Fund that occurred during the reporting period.
|
|
| Additional Information Phone Number |
1-800-582-6757
|
|
| Additional Information Email |
<span style="box-sizing: border-box; color: rgb(0, 0, 0); display: inline; flex-wrap: nowrap; font-size: 12px; font-weight: 400; grid-area: auto; line-height: 18px; margin: 0px; overflow: visible; text-align: left; text-align-last: auto; white-space-collapse: preserve-breaks;">funddocuments@domini.com</span>
|
|
| Additional Information Website |
domini.com
|
|
| Expenses [Text Block] |
What were the Fund costs for last year?(based on a hypothetical $10,000 investment)
Table Summary
Class Name |
Cost of a $10,000 investment |
Costs paid as a percentage of a $10,000 investment |
Institutional shares |
$101 |
0.90% | |
|
| Expenses Paid, Amount |
$ 101
|
|
| Expense Ratio, Percent |
0.90%
|
|
| Factors Affecting Performance [Text Block] |
How did the Fund perform last year and what affected its performance?The Fund’s Institutional shares returned 24.67% for the trailing twelve months ended July 31, 2026, outperforming relative to the MSCI EAFE Net Total Return Index (the “benchmark”), which returned 24.33%. International developed equities delivered strong returns over the period, outpacing U.S. equities, supported by resilient corporate earnings, continued investment in artificial intelligence (AI) infrastructure, and supportive central bank actions across major economies. Markets navigated meaningful volatility, including a first-quarter 2026 selloff tied to U.S.–Iran tensions that sent energy prices sharply higher. This was followed by a strong rebound in the second quarter, as initial reports of a potential cease-fire in early April supported a recovery in risk appetite. Domini, the Fund’s Adviser, determines which companies meet its Impact Investment Standards. Wellington Management, the Fund’s Subadviser, then selects Domini-approved securities and manages risk using proprietary quantitative models. In aggregate, Wellington’s Quantitative Equity (“QE”) model made a positive contribution to performance over the period, driven by positive performance from value and momentum factors and partially offset by negative performance from quality factors. From a sector perspective, positive stock selection in Consumer Discretionary, Financials, Industrials, and Communication Services was partially offset by weaker selection in Information Technology and Materials. Sector positioning detracted overall, predominantly driven by the Fund’s zero exposure to Energy, which was among the top performing sectors over the period. The Fund does not invest in the GICS Energy sector in accordance with Domini’s exclusionary standards on fossil fuels. The top individual contributors were overweight positions in pharmaceutical company GSK and banking groups Banco Santander and ABN AMRO. The top detractors were an underweight position in semiconductor equipment supplier ASML and overweight positions in investment company 3i Group and accounting software company Sage Group. Top Relative ContributorsSectors: Stocks: ASML Holding N.V. (underweight) 3i Group plc (overweight) The Sage Group plc (overweight)
|
|
| Performance Past Does Not Indicate Future [Text] |
Keep in mind that the Fund's past performance is not a good predictor of how the Fund will perform in the future.
|
|
| Line Graph [Table Text Block] |
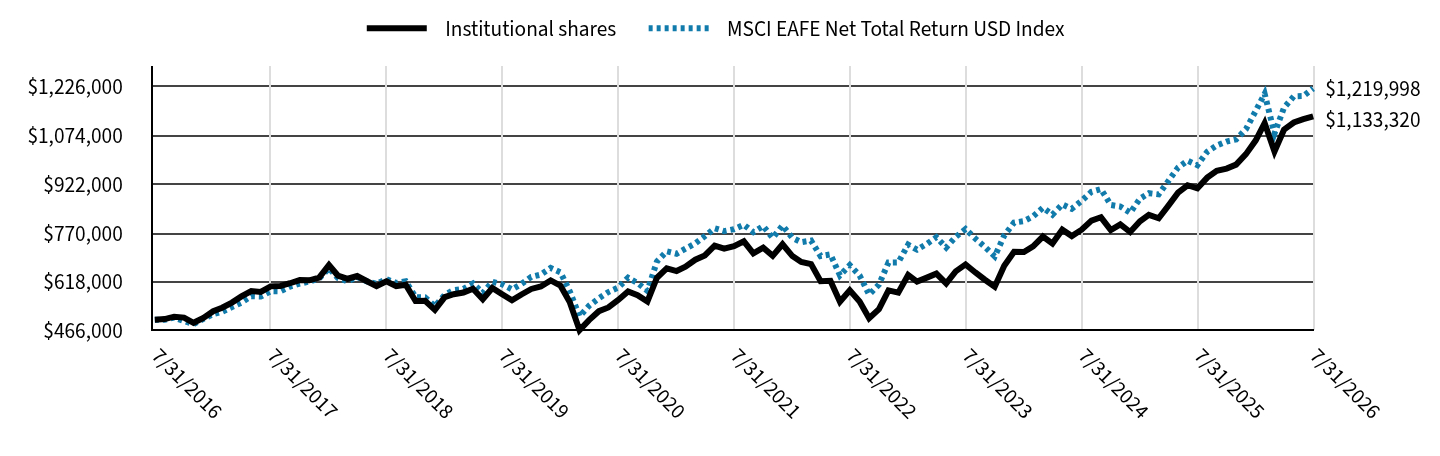
Table Summary
|
Institutional shares |
MSCI EAFE Net Total Return USD Index |
7/31/2016 |
$500,000 |
$500,000 |
8/31/2016 |
$502,030 |
$500,355 |
9/30/2016 |
$509,472 |
$506,502 |
10/31/2016 |
$506,766 |
$496,141 |
11/30/2016 |
$490,528 |
$486,260 |
12/31/2016 |
$505,827 |
$502,887 |
1/31/2017 |
$526,473 |
$517,475 |
2/28/2017 |
$537,484 |
$524,875 |
3/31/2017 |
$553,313 |
$539,324 |
4/30/2017 |
$572,582 |
$553,022 |
5/31/2017 |
$589,099 |
$573,318 |
6/30/2017 |
$586,712 |
$572,286 |
7/31/2017 |
$603,989 |
$588,768 |
8/31/2017 |
$605,371 |
$588,533 |
9/30/2017 |
$613,663 |
$603,187 |
10/31/2017 |
$623,338 |
$612,356 |
11/30/2017 |
$622,647 |
$618,785 |
12/31/2017 |
$631,187 |
$628,748 |
1/31/2018 |
$670,193 |
$660,311 |
2/28/2018 |
$637,570 |
$630,531 |
3/31/2018 |
$627,641 |
$619,181 |
4/30/2018 |
$636,152 |
$633,299 |
5/31/2018 |
$619,840 |
$619,050 |
6/30/2018 |
$604,637 |
$611,497 |
7/31/2018 |
$619,593 |
$626,540 |
8/31/2018 |
$604,637 |
$614,448 |
9/30/2018 |
$608,910 |
$619,793 |
10/31/2018 |
$558,346 |
$570,458 |
11/30/2018 |
$559,058 |
$569,716 |
12/31/2018 |
$530,654 |
$542,085 |
1/31/2019 |
$570,434 |
$577,700 |
2/28/2019 |
$579,441 |
$592,431 |
3/31/2019 |
$584,695 |
$596,164 |
4/30/2019 |
$596,704 |
$612,916 |
5/31/2019 |
$563,679 |
$583,496 |
6/30/2019 |
$598,944 |
$618,097 |
7/31/2019 |
$579,356 |
$610,247 |
8/31/2019 |
$560,521 |
$594,442 |
9/30/2019 |
$578,602 |
$611,503 |
10/31/2019 |
$595,930 |
$633,455 |
11/30/2019 |
$603,464 |
$640,613 |
12/31/2019 |
$622,277 |
$661,433 |
1/31/2020 |
$605,962 |
$647,609 |
2/29/2020 |
$555,466 |
$589,066 |
3/31/2020 |
$467,679 |
$510,425 |
4/30/2020 |
$498,754 |
$543,399 |
5/31/2020 |
$526,721 |
$567,037 |
6/30/2020 |
$538,374 |
$586,316 |
7/31/2020 |
$561,681 |
$599,977 |
8/31/2020 |
$588,094 |
$630,816 |
9/30/2020 |
$576,441 |
$614,415 |
10/31/2020 |
$557,019 |
$589,900 |
11/30/2020 |
$630,822 |
$681,334 |
12/31/2020 |
$660,267 |
$713,016 |
1/31/2021 |
$651,631 |
$705,422 |
2/28/2021 |
$664,978 |
$721,245 |
3/31/2021 |
$686,961 |
$737,826 |
4/30/2021 |
$700,307 |
$760,028 |
5/31/2021 |
$730,926 |
$784,812 |
6/30/2021 |
$721,153 |
$775,983 |
7/31/2021 |
$729,086 |
$781,826 |
8/31/2021 |
$744,160 |
$795,618 |
9/30/2021 |
$706,873 |
$772,529 |
10/31/2021 |
$724,326 |
$791,533 |
11/30/2021 |
$698,939 |
$754,727 |
12/31/2021 |
$735,020 |
$793,369 |
1/31/2022 |
$698,229 |
$755,033 |
2/28/2022 |
$679,833 |
$741,669 |
3/31/2022 |
$673,435 |
$746,438 |
4/30/2022 |
$619,848 |
$698,143 |
5/31/2022 |
$621,448 |
$703,379 |
6/30/2022 |
$555,811 |
$638,106 |
7/31/2022 |
$591,461 |
$669,883 |
8/31/2022 |
$556,621 |
$638,064 |
9/30/2022 |
$504,767 |
$578,405 |
10/31/2022 |
$533,125 |
$609,512 |
11/30/2022 |
$591,461 |
$678,143 |
12/31/2022 |
$584,359 |
$678,685 |
1/31/2023 |
$639,425 |
$733,659 |
2/28/2023 |
$618,878 |
$718,325 |
3/31/2023 |
$631,207 |
$736,140 |
4/30/2023 |
$643,535 |
$756,899 |
5/31/2023 |
$613,125 |
$724,882 |
6/30/2023 |
$650,483 |
$757,864 |
7/31/2023 |
$672,277 |
$782,419 |
8/31/2023 |
$647,130 |
$752,444 |
9/30/2023 |
$624,497 |
$726,741 |
10/31/2023 |
$602,702 |
$697,279 |
11/30/2023 |
$668,086 |
$762,000 |
12/31/2023 |
$711,775 |
$802,485 |
1/31/2024 |
$710,930 |
$807,108 |
2/29/2024 |
$728,682 |
$821,881 |
3/31/2024 |
$759,114 |
$848,913 |
4/30/2024 |
$737,135 |
$827,173 |
5/31/2024 |
$780,248 |
$859,184 |
6/30/2024 |
$760,488 |
$845,314 |
7/31/2024 |
$780,274 |
$870,112 |
8/31/2024 |
$808,664 |
$898,391 |
9/30/2024 |
$818,987 |
$906,683 |
10/31/2024 |
$779,414 |
$857,376 |
11/30/2024 |
$796,620 |
$852,515 |
12/31/2024 |
$773,155 |
$833,129 |
1/31/2025 |
$806,428 |
$876,910 |
2/28/2025 |
$826,567 |
$893,913 |
3/31/2025 |
$816,059 |
$890,306 |
4/30/2025 |
$854,586 |
$931,087 |
5/31/2025 |
$895,739 |
$973,688 |
6/30/2025 |
$918,715 |
$995,142 |
7/31/2025 |
$909,026 |
$981,210 |
8/31/2025 |
$942,498 |
$1,023,041 |
9/30/2025 |
$963,638 |
$1,042,620 |
10/31/2025 |
$970,685 |
$1,054,881 |
11/30/2025 |
$983,016 |
$1,061,421 |
12/31/2025 |
$1,015,615 |
$1,093,264 |
1/31/2026 |
$1,058,604 |
$1,150,310 |
2/28/2026 |
$1,112,340 |
$1,203,570 |
3/31/2026 |
$1,023,676 |
$1,079,722 |
4/30/2026 |
$1,091,742 |
$1,160,162 |
5/31/2026 |
$1,114,132 |
$1,195,744 |
6/30/2026 |
$1,124,311 |
$1,196,581 |
7/31/2026 |
$1,133,320 |
$1,219,998 |
|
|
| Average Annual Return [Table Text Block] |
Table Summary
Name |
1 Year |
5 Years |
10 Years |
Institutional shares |
24.67% |
9.22% |
8.53% |
MSCI EAFE Net Total Return USD Index |
24.33% |
9.31% |
9.33% | |
|
| No Deduction of Taxes [Text Block] |
The graph and table do not reflect the deduction of taxes that a shareholder would pay on Fund distributions or redemption of Fund shares.
|
|
| Material Change Date |
|
Jul. 31, 2025
|
| Updated Performance Information Location [Text Block] |
Visit domini.com/performance for the most recent performance information.
|
|
| AssetsNet |
$ 1,023,935,683
|
|
| Holdings Count | Holding |
149
|
|
| Advisory Fees Paid, Amount |
$ 7,884,537
|
|
| InvestmentCompanyPortfolioTurnover |
88.00%
|
|
| Additional Fund Statistics [Text Block] |
The following table outlines certain key Fund statistics as of the end of the reporting period:
Table Summary
Fund's net assets |
$1,023,935,683 |
Total number of portfolio holdings |
149 |
Portfolio turnover rate |
88% |
Total advisory fees paid |
$7,884,537 | |
|
| Holdings [Text Block] |
SECTOR ALLOCATION (% of net assets)
Table Summary
Value |
Value |
Other Assets, Less Liabilities |
1.5% |
Utilities |
1.0% |
Real Estate |
3.2% |
Materials |
3.7% |
Consumer Staples |
4.0% |
Communication Services |
5.0% |
Consumer Discretionary |
10.3% |
Information Technology |
12.5% |
Health Care |
12.6% |
Industrials |
19.5% |
Financials |
26.7% | GEOGRAPHICAL ALLOCATION (% of net assets)
Table Summary
Value |
Value |
Other Assets, Less Liabilities |
1.5% |
OtherFootnote Reference* |
11.6% |
Spain |
3.4% |
Australia |
4.5% |
Switzerland |
4.6% |
Singapore |
4.6% |
Sweden |
5.7% |
United States |
7.3% |
Netherlands |
7.6% |
United Kingdom |
7.6% |
Germany |
8.7% |
France |
8.9% |
Japan |
24.0% |
| Footnote |
Description |
Footnote* |
Amounts represent investments in countries less than 2% of net assets | |
|
| Largest Holdings [Text Block] |
TOP TEN HOLDINGS (% of net assets)
Table Summary
Novartis AG |
3.4% |
ASML Holding NV |
2.9% |
BNP Paribas SA |
2.4% |
Banco Santander SA |
2.4% |
Sony Group Corp. |
2.4% |
Vodafone Group PLC |
2.3% |
Recruit Holdings Co. Ltd. |
2.3% |
Deutsche Telekom AG |
2.2% |
Sanofi SA |
2.1% |
Fortescue Ltd. |
2.1% | |
|
| Material Fund Change [Text Block] |
This is a summary of certain changes to the Fund since July 31, 2025. For more complete information, you may review the Fund’s prospectus at domini.com/funddocuments. Portfolio Manager update: Effective on June 30, 2026, Andrew Gossard, Managing Director, Director, Quantitative Equity Research, Quantitative Investment Group of Wellington Management Company LLP, was added as a portfolio manager of the Fund. Effective November 30, 2026, Mark Yarger will retire as a portfolio manager of the Fund and the portfolio managers of the Fund will be Christopher Grohe and Andrew Gossard of Wellington Management. |
|
| Material Fund Change Adviser [Text Block] |
Portfolio Manager update: Effective on June 30, 2026, Andrew Gossard, Managing Director, Director, Quantitative Equity Research, Quantitative Investment Group of Wellington Management Company LLP, was added as a portfolio manager of the Fund. Effective November 30, 2026, Mark Yarger will retire as a portfolio manager of the Fund and the portfolio managers of the Fund will be Christopher Grohe and Andrew Gossard of Wellington Management.
|
|
| Summary of Change Legend [Text Block] |
This is a summary of certain changes to the Fund since July 31, 2025. For more complete information, you may review the Fund’s prospectus at domini.com/funddocuments.
|
|
| Updated Prospectus Phone Number |
1-800-582-6757
|
|
| Updated Prospectus Web Address |
domini.com/funddocuments
|
|
| C000200995 |
|
|
| Shareholder Report [Line Items] |
|
|
| Fund Name |
Domini Impact International Equity Fund
|
|
| Class Name |
CLASS Y SHARES
|
|
| Trading Symbol |
DOMYX
|
|
| Annual or Semi-Annual Statement [Text Block] |
This annual shareholder report contains important information about the Domini Impact International Equity Fund for the period of August 1, 2025 to July 31, 2026.
|
|
| Additional Information [Text Block] |
You can find additional information about the Fund at domini.com. You can also request information by contacting us at 1-800-582-6757 or by emailing funddocuments@domini.com.
|
|
| Material Fund Change Notice [Text Block] |
This report describes changes to the Fund that occurred during the reporting period.
|
|
| Additional Information Phone Number |
1-800-582-6757
|
|
| Additional Information Email |
<span style="box-sizing: border-box; color: rgb(0, 0, 0); display: inline; flex-wrap: nowrap; font-size: 12px; font-weight: 400; grid-area: auto; line-height: 18px; margin: 0px; overflow: visible; text-align: left; text-align-last: auto; white-space-collapse: preserve-breaks;">funddocuments@domini.com</span>
|
|
| Additional Information Website |
domini.com
|
|
| Expenses [Text Block] |
What were the Fund costs for last year?(based on a hypothetical $10,000 investment)
Table Summary
Class Name |
Cost of a $10,000 investment |
Costs paid as a percentage of a $10,000 investment |
Class Y shares |
$110 |
0.98% | |
|
| Expenses Paid, Amount |
$ 110
|
|
| Expense Ratio, Percent |
0.98%
|
|
| Factors Affecting Performance [Text Block] |
How did the Fund perform last year and what affected its performance?The Fund’s Class Y shares returned 24.53% for the trailing twelve months ended July 31, 2026, outperforming relative to the MSCI EAFE Net Total Return Index (the “benchmark”), which returned 24.33%. International developed equities delivered strong returns over the period, outpacing U.S. equities, supported by resilient corporate earnings, continued investment in artificial intelligence (AI) infrastructure, and supportive central bank actions across major economies. Markets navigated meaningful volatility, including a first-quarter 2026 selloff tied to U.S.–Iran tensions that sent energy prices sharply higher. This was followed by a strong rebound in the second quarter, as initial reports of a potential cease-fire in early April supported a recovery in risk appetite. Domini, the Fund’s Adviser, determines which companies meet its Impact Investment Standards. Wellington Management, the Fund’s Subadviser, then selects Domini-approved securities and manages risk using proprietary quantitative models. In aggregate, Wellington’s Quantitative Equity (“QE”) model made a positive contribution to performance over the period, driven by positive performance from value and momentum factors and partially offset by negative performance from quality factors. From a sector perspective, positive stock selection in Consumer Discretionary, Financials, Industrials, and Communication Services was partially offset by weaker selection in Information Technology and Materials. Sector positioning detracted overall, predominantly driven by the Fund’s zero exposure to Energy, which was among the top performing sectors over the period. The Fund does not invest in the GICS Energy sector in accordance with Domini’s exclusionary standards on fossil fuels. The top individual contributors were overweight positions in pharmaceutical company GSK and banking groups Banco Santander and ABN AMRO. The top detractors were an underweight position in semiconductor equipment supplier ASML and overweight positions in investment company 3i Group and accounting software company Sage Group. Top Relative ContributorsSectors: Stocks: ASML Holding N.V. (underweight) 3i Group plc (overweight) The Sage Group plc (overweight)
|
|
| Performance Past Does Not Indicate Future [Text] |
Keep in mind that the Fund's past performance is not a good predictor of how the Fund will perform in the future.
|
|
| Line Graph [Table Text Block] |
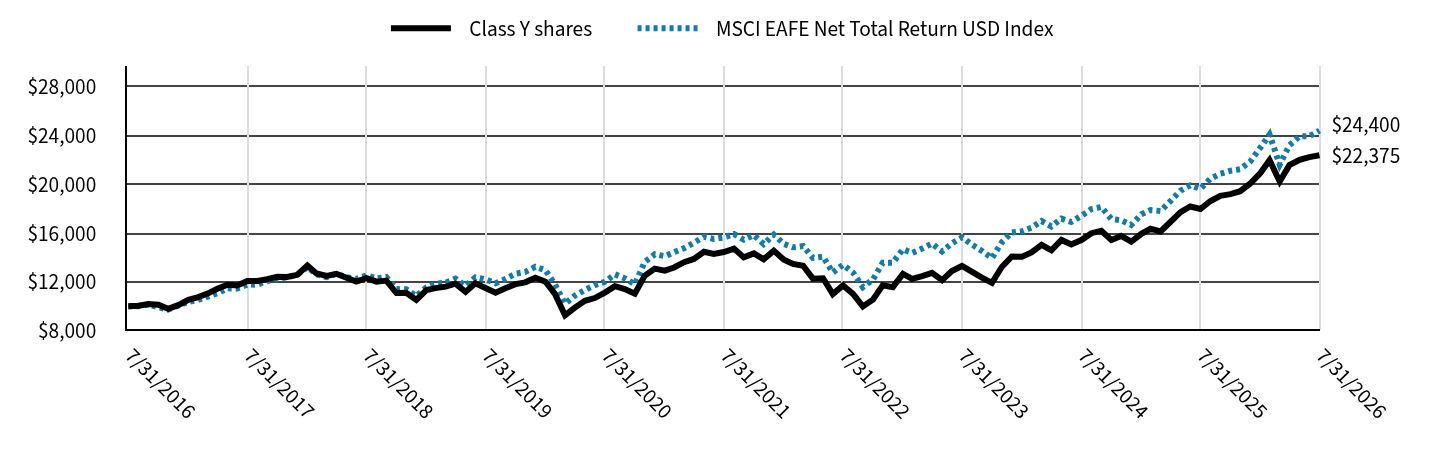
Table Summary
|
Class Y shares |
MSCI EAFE Net Total Return USD Index |
7/31/2016 |
$10,000 |
$10,000 |
8/31/2016 |
$10,041 |
$10,007 |
9/30/2016 |
$10,190 |
$10,130 |
10/31/2016 |
$10,122 |
$9,923 |
11/30/2016 |
$9,797 |
$9,725 |
12/31/2016 |
$10,092 |
$10,058 |
1/31/2017 |
$10,518 |
$10,349 |
2/28/2017 |
$10,724 |
$10,497 |
3/31/2017 |
$11,039 |
$10,786 |
4/30/2017 |
$11,438 |
$11,060 |
5/31/2017 |
$11,767 |
$11,466 |
6/30/2017 |
$11,703 |
$11,446 |
7/31/2017 |
$12,061 |
$11,775 |
8/31/2017 |
$12,074 |
$11,771 |
9/30/2017 |
$12,226 |
$12,064 |
10/31/2017 |
$12,419 |
$12,247 |
11/30/2017 |
$12,405 |
$12,376 |
12/31/2017 |
$12,575 |
$12,575 |
1/31/2018 |
$13,335 |
$13,206 |
2/28/2018 |
$12,688 |
$12,611 |
3/31/2018 |
$12,490 |
$12,384 |
4/30/2018 |
$12,659 |
$12,666 |
5/31/2018 |
$12,336 |
$12,381 |
6/30/2018 |
$12,029 |
$12,230 |
7/31/2018 |
$12,297 |
$12,531 |
8/31/2018 |
$12,014 |
$12,289 |
9/30/2018 |
$12,099 |
$12,396 |
10/31/2018 |
$11,083 |
$11,409 |
11/30/2018 |
$11,111 |
$11,394 |
12/31/2018 |
$10,521 |
$10,842 |
1/31/2019 |
$11,324 |
$11,554 |
2/28/2019 |
$11,488 |
$11,849 |
3/31/2019 |
$11,607 |
$11,923 |
4/30/2019 |
$11,845 |
$12,258 |
5/31/2019 |
$11,176 |
$11,670 |
6/30/2019 |
$11,886 |
$12,362 |
7/31/2019 |
$11,498 |
$12,205 |
8/31/2019 |
$11,109 |
$11,889 |
9/30/2019 |
$11,468 |
$12,230 |
10/31/2019 |
$11,811 |
$12,669 |
11/30/2019 |
$11,960 |
$12,812 |
12/31/2019 |
$12,336 |
$13,229 |
1/31/2020 |
$12,013 |
$12,952 |
2/29/2020 |
$11,013 |
$11,781 |
3/31/2020 |
$9,260 |
$10,209 |
4/30/2020 |
$9,890 |
$10,868 |
5/31/2020 |
$10,444 |
$11,341 |
6/30/2020 |
$10,675 |
$11,726 |
7/31/2020 |
$11,121 |
$12,000 |
8/31/2020 |
$11,644 |
$12,616 |
9/30/2020 |
$11,413 |
$12,288 |
10/31/2020 |
$11,028 |
$11,798 |
11/30/2020 |
$12,490 |
$13,627 |
12/31/2020 |
$13,084 |
$14,260 |
1/31/2021 |
$12,913 |
$14,108 |
2/28/2021 |
$13,177 |
$14,425 |
3/31/2021 |
$13,612 |
$14,757 |
4/30/2021 |
$13,876 |
$15,201 |
5/31/2021 |
$14,467 |
$15,696 |
6/30/2021 |
$14,286 |
$15,520 |
7/31/2021 |
$14,443 |
$15,637 |
8/31/2021 |
$14,726 |
$15,912 |
9/30/2021 |
$14,004 |
$15,451 |
10/31/2021 |
$14,333 |
$15,831 |
11/30/2021 |
$13,847 |
$15,095 |
12/31/2021 |
$14,557 |
$15,867 |
1/31/2022 |
$13,813 |
$15,101 |
2/28/2022 |
$13,465 |
$14,833 |
3/31/2022 |
$13,323 |
$14,929 |
4/30/2022 |
$12,263 |
$13,963 |
5/31/2022 |
$12,294 |
$14,068 |
6/30/2022 |
$10,993 |
$12,762 |
7/31/2022 |
$11,698 |
$13,398 |
8/31/2022 |
$11,009 |
$12,761 |
9/30/2022 |
$9,983 |
$11,568 |
10/31/2022 |
$10,544 |
$12,190 |
11/30/2022 |
$11,714 |
$13,563 |
12/31/2022 |
$11,564 |
$13,574 |
1/31/2023 |
$12,652 |
$14,673 |
2/28/2023 |
$12,246 |
$14,367 |
3/31/2023 |
$12,473 |
$14,723 |
4/30/2023 |
$12,733 |
$15,138 |
5/31/2023 |
$12,132 |
$14,498 |
6/30/2023 |
$12,883 |
$15,157 |
7/31/2023 |
$13,296 |
$15,648 |
8/31/2023 |
$12,816 |
$15,049 |
9/30/2023 |
$12,353 |
$14,535 |
10/31/2023 |
$11,922 |
$13,946 |
11/30/2023 |
$13,214 |
$15,240 |
12/31/2023 |
$14,080 |
$16,050 |
1/31/2024 |
$14,063 |
$16,142 |
2/29/2024 |
$14,414 |
$16,438 |
3/31/2024 |
$15,031 |
$16,978 |
4/30/2024 |
$14,581 |
$16,543 |
5/31/2024 |
$15,431 |
$17,184 |
6/30/2024 |
$15,054 |
$16,906 |
7/31/2024 |
$15,427 |
$17,402 |
8/31/2024 |
$15,987 |
$17,968 |
9/30/2024 |
$16,191 |
$18,134 |
10/31/2024 |
$15,427 |
$17,148 |
11/30/2024 |
$15,766 |
$17,050 |
12/31/2024 |
$15,294 |
$16,663 |
1/31/2025 |
$15,933 |
$17,538 |
2/28/2025 |
$16,347 |
$17,878 |
3/31/2025 |
$16,140 |
$17,806 |
4/30/2025 |
$16,899 |
$18,622 |
5/31/2025 |
$17,711 |
$19,474 |
6/30/2025 |
$18,176 |
$19,903 |
7/31/2025 |
$17,967 |
$19,624 |
8/31/2025 |
$18,627 |
$20,461 |
9/30/2025 |
$19,043 |
$20,852 |
10/31/2025 |
$19,182 |
$21,098 |
11/30/2025 |
$19,425 |
$21,228 |
12/31/2025 |
$20,063 |
$21,865 |
1/31/2026 |
$20,910 |
$23,006 |
2/28/2026 |
$21,969 |
$24,071 |
3/31/2026 |
$20,222 |
$21,594 |
4/30/2026 |
$21,563 |
$23,203 |
5/31/2026 |
$22,004 |
$23,915 |
6/30/2026 |
$22,215 |
$23,932 |
7/31/2026 |
$22,375 |
$24,400 |
|
|
| Average Annual Return [Table Text Block] |
Table Summary
Name |
1 Year |
5 Years |
10 Years |
Class Y shares |
24.53% |
9.15% |
8.39% |
MSCI EAFE Net Total Return USD Index |
24.33% |
9.31% |
9.33% | |
|
| No Deduction of Taxes [Text Block] |
The graph and table do not reflect the deduction of taxes that a shareholder would pay on Fund distributions or redemption of Fund shares.
|
|
| Material Change Date |
|
Jul. 31, 2025
|
| Updated Performance Information Location [Text Block] |
Visit domini.com/performance for the most recent performance information.
|
|
| AssetsNet |
$ 1,023,935,683
|
|
| Holdings Count | Holding |
149
|
|
| Advisory Fees Paid, Amount |
$ 7,884,537
|
|
| InvestmentCompanyPortfolioTurnover |
88.00%
|
|
| Additional Fund Statistics [Text Block] |
The following table outlines certain key Fund statistics as of the end of the reporting period:
Table Summary
Fund's net assets |
$1,023,935,683 |
Total number of portfolio holdings |
149 |
Portfolio turnover rate |
88% |
Total advisory fees paid |
$7,884,537 | |
|
| Holdings [Text Block] |
SECTOR ALLOCATION (% of net assets)
Table Summary
Value |
Value |
Other Assets, Less Liabilities |
1.5% |
Utilities |
1.0% |
Real Estate |
3.2% |
Materials |
3.7% |
Consumer Staples |
4.0% |
Communication Services |
5.0% |
Consumer Discretionary |
10.3% |
Information Technology |
12.5% |
Health Care |
12.6% |
Industrials |
19.5% |
Financials |
26.7% | GEOGRAPHICAL ALLOCATION (% of net assets)
Table Summary
Value |
Value |
Other Assets, Less Liabilities |
1.5% |
OtherFootnote Reference* |
11.6% |
Spain |
3.4% |
Australia |
4.5% |
Switzerland |
4.6% |
Singapore |
4.6% |
Sweden |
5.7% |
United States |
7.3% |
Netherlands |
7.6% |
United Kingdom |
7.6% |
Germany |
8.7% |
France |
8.9% |
Japan |
24.0% |
| Footnote |
Description |
Footnote* |
Amounts represent investments in countries less than 2% of net assets | |
|
| Largest Holdings [Text Block] |
TOP TEN HOLDINGS (% of net assets)
Table Summary
Novartis AG |
3.4% |
ASML Holding NV |
2.9% |
BNP Paribas SA |
2.4% |
Banco Santander SA |
2.4% |
Sony Group Corp. |
2.4% |
Vodafone Group PLC |
2.3% |
Recruit Holdings Co. Ltd. |
2.3% |
Deutsche Telekom AG |
2.2% |
Sanofi SA |
2.1% |
Fortescue Ltd. |
2.1% | |
|
| Material Fund Change [Text Block] |
This is a summary of certain changes to the Fund since July 31, 2025. For more complete information, you may review the Fund’s prospectus at domini.com/funddocuments. Portfolio Manager update: Effective on June 30, 2026, Andrew Gossard, Managing Director, Director, Quantitative Equity Research, Quantitative Investment Group of Wellington Management Company LLP, was added as a portfolio manager of the Fund. Effective November 30, 2026, Mark Yarger will retire as a portfolio manager of the Fund and the portfolio managers of the Fund will be Christopher Grohe and Andrew Gossard of Wellington Management. |
|
| Material Fund Change Adviser [Text Block] |
Portfolio Manager update: Effective on June 30, 2026, Andrew Gossard, Managing Director, Director, Quantitative Equity Research, Quantitative Investment Group of Wellington Management Company LLP, was added as a portfolio manager of the Fund. Effective November 30, 2026, Mark Yarger will retire as a portfolio manager of the Fund and the portfolio managers of the Fund will be Christopher Grohe and Andrew Gossard of Wellington Management.
|
|
| Summary of Change Legend [Text Block] |
This is a summary of certain changes to the Fund since July 31, 2025. For more complete information, you may review the Fund’s prospectus at domini.com/funddocuments.
|
|
| Updated Prospectus Phone Number |
1-800-582-6757
|
|
| Updated Prospectus Web Address |
domini.com/funddocuments
|
|
| C000009468 |
|
|
| Shareholder Report [Line Items] |
|
|
| Fund Name |
Domini Impact Bond Fund
|
|
| Class Name |
INVESTOR SHARES
|
|
| Trading Symbol |
DSBFX
|
|
| Annual or Semi-Annual Statement [Text Block] |
This annual shareholder report contains important information about the Domini Impact Bond Fund for the period of August 1, 2025 to July 31, 2026.
|
|
| Additional Information [Text Block] |
You can find additional information about the Fund at domini.com. You can also request information by contacting us at 1-800-582-6757 or by emailing funddocuments@domini.com.
|
|
| Additional Information Phone Number |
1-800-582-6757
|
|
| Additional Information Email |
<span style="box-sizing: border-box; color: rgb(0, 0, 0); display: inline; flex-wrap: nowrap; font-size: 12px; font-weight: 400; grid-area: auto; line-height: 18px; margin: 0px; overflow: visible; text-align: left; text-align-last: auto; white-space-collapse: preserve-breaks;">funddocuments@domini.com</span>
|
|
| Additional Information Website |
domini.com
|
|
| Expenses [Text Block] |
What were the Fund costs for last year?(based on a hypothetical $10,000 investment)
Table Summary
Class Name |
Cost of a $10,000 investment |
Costs paid as a percentage of a $10,000 investment |
Investor shares |
$88 |
0.87% | |
|
| Expenses Paid, Amount |
$ 88
|
|
| Expense Ratio, Percent |
0.87%
|
|
| Factors Affecting Performance [Text Block] |
How did the Fund perform last year and what affected its performance?The Fund’s Investor shares returned 2.39% for the trailing twelve months ended July 31, 2026, underperforming relative to the Bloomberg U.S. Aggregate Bond Index (the “benchmark”), which returned 2.71%. U.S. bonds generated positive total returns over the period, with credit sectors outperforming duration-equivalent government bonds. Yields were volatile as markets balanced resilient economic growth, persistent inflation, and evolving expectations for Federal Reserve policy, and most developed-market sovereign yields ended higher. The first half of 2026 was marked by increased volatility and periods of spread widening amid U.S.–Iran tensions, but conditions improved toward the end of the period as supportive technicals helped restore risk sentiment. The Fund maintained an underweight to investment-grade corporate bonds in favor of high-yield credit, bank loans, taxable municipals, and securitized sectors. Out-of-benchmark allocations to high yield and bank loans were among the top contributors, benefiting from their coupon advantage. An overweight to taxable municipals and a modest allocation to convertible bonds also contributed favorably. Within securitized sectors, agency mortgage-backed securities and commercial mortgage-backed securities contributed positively despite spikes in interest rate volatility. This was partially offset by a negative impact from asset-backed securities, particularly auto loans. Relative to the benchmark, the Fund had a longer duration position for most of the period, which was a headwind for performance, particularly during the first half. The Fund does not invest in U.S. Treasuries in accordance with Domini’s exclusionary standards on nuclear weapons. During the period, the Fund used derivatives to help implement overall duration strategy. This exposure modestly detracted in aggregate, primarily attributable to U.S. interest rate swaps and partially offset by a positive impact from developed non-U.S. government derivatives. Top Relative Contributors |
|
| Performance Past Does Not Indicate Future [Text] |
Keep in mind that the Fund's past performance is not a good predictor of how the Fund will perform in the future.
|
|
| Line Graph [Table Text Block] |
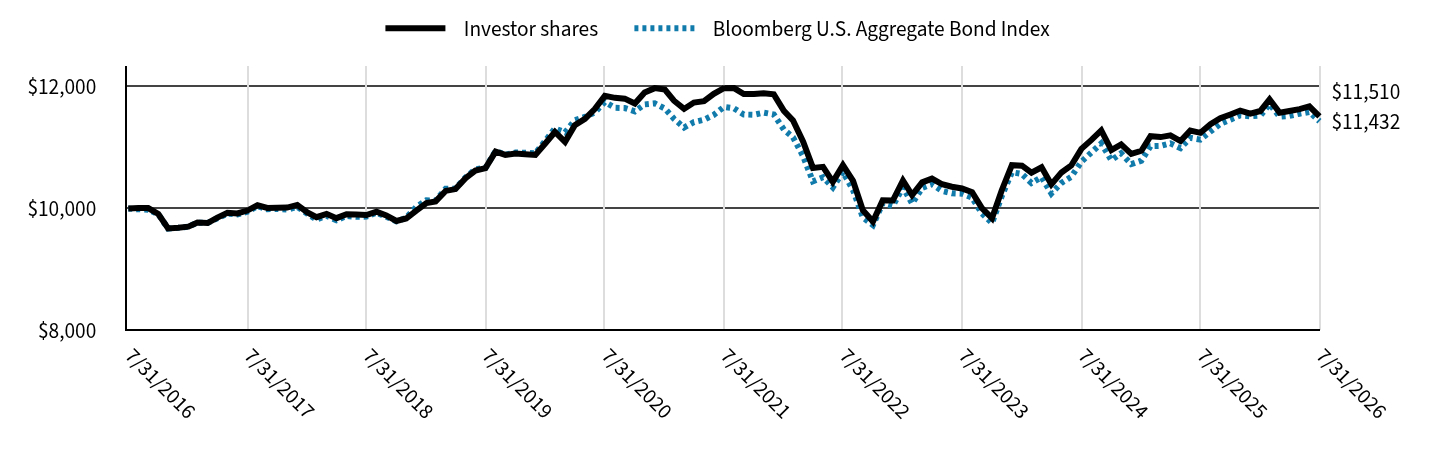
Table Summary
|
Investor shares |
Bloomberg U.S. Aggregate Bond Index |
7/31/2016 |
$10,000 |
$10,000 |
8/31/2016 |
$10,010 |
$9,989 |
9/30/2016 |
$10,009 |
$9,983 |
10/31/2016 |
$9,912 |
$9,907 |
11/30/2016 |
$9,676 |
$9,672 |
12/31/2016 |
$9,687 |
$9,686 |
1/31/2017 |
$9,704 |
$9,705 |
2/28/2017 |
$9,773 |
$9,770 |
3/31/2017 |
$9,764 |
$9,765 |
4/30/2017 |
$9,852 |
$9,841 |
5/31/2017 |
$9,931 |
$9,916 |
6/30/2017 |
$9,922 |
$9,906 |
7/31/2017 |
$9,968 |
$9,949 |
8/31/2017 |
$10,056 |
$10,039 |
9/30/2017 |
$10,012 |
$9,990 |
10/31/2017 |
$10,016 |
$9,996 |
11/30/2017 |
$10,017 |
$9,983 |
12/31/2017 |
$10,060 |
$10,029 |
1/31/2018 |
$9,937 |
$9,914 |
2/28/2018 |
$9,859 |
$9,820 |
3/31/2018 |
$9,914 |
$9,883 |
4/30/2018 |
$9,844 |
$9,809 |
5/31/2018 |
$9,909 |
$9,879 |
6/30/2018 |
$9,904 |
$9,867 |
7/31/2018 |
$9,894 |
$9,869 |
8/31/2018 |
$9,951 |
$9,932 |
9/30/2018 |
$9,889 |
$9,868 |
10/31/2018 |
$9,798 |
$9,791 |
11/30/2018 |
$9,838 |
$9,849 |
12/31/2018 |
$9,968 |
$10,030 |
1/31/2019 |
$10,092 |
$10,137 |
2/28/2019 |
$10,118 |
$10,131 |
3/31/2019 |
$10,290 |
$10,325 |
4/30/2019 |
$10,320 |
$10,328 |
5/31/2019 |
$10,499 |
$10,512 |
6/30/2019 |
$10,623 |
$10,645 |
7/31/2019 |
$10,663 |
$10,668 |
8/31/2019 |
$10,934 |
$10,944 |
9/30/2019 |
$10,880 |
$10,886 |
10/31/2019 |
$10,902 |
$10,919 |
11/30/2019 |
$10,891 |
$10,914 |
12/31/2019 |
$10,879 |
$10,906 |
1/31/2020 |
$11,071 |
$11,115 |
2/29/2020 |
$11,256 |
$11,315 |
3/31/2020 |
$11,094 |
$11,249 |
4/30/2020 |
$11,368 |
$11,449 |
5/31/2020 |
$11,472 |
$11,503 |
6/30/2020 |
$11,631 |
$11,575 |
7/31/2020 |
$11,847 |
$11,748 |
8/31/2020 |
$11,815 |
$11,652 |
9/30/2020 |
$11,802 |
$11,647 |
10/31/2020 |
$11,722 |
$11,594 |
11/30/2020 |
$11,901 |
$11,708 |
12/31/2020 |
$11,974 |
$11,724 |
1/31/2021 |
$11,950 |
$11,640 |
2/28/2021 |
$11,768 |
$11,472 |
3/31/2021 |
$11,634 |
$11,329 |
4/30/2021 |
$11,738 |
$11,418 |
5/31/2021 |
$11,760 |
$11,456 |
6/30/2021 |
$11,882 |
$11,536 |
7/31/2021 |
$11,973 |
$11,665 |
8/31/2021 |
$11,975 |
$11,643 |
9/30/2021 |
$11,877 |
$11,542 |
10/31/2021 |
$11,879 |
$11,538 |
11/30/2021 |
$11,891 |
$11,573 |
12/31/2021 |
$11,873 |
$11,543 |
1/31/2022 |
$11,602 |
$11,295 |
2/28/2022 |
$11,445 |
$11,168 |
3/31/2022 |
$11,097 |
$10,858 |
4/30/2022 |
$10,667 |
$10,446 |
5/31/2022 |
$10,684 |
$10,513 |
6/30/2022 |
$10,438 |
$10,348 |
7/31/2022 |
$10,712 |
$10,601 |
8/31/2022 |
$10,454 |
$10,302 |
9/30/2022 |
$9,974 |
$9,857 |
10/31/2022 |
$9,788 |
$9,730 |
11/30/2022 |
$10,135 |
$10,088 |
12/31/2022 |
$10,132 |
$10,042 |
1/31/2023 |
$10,461 |
$10,350 |
2/28/2023 |
$10,222 |
$10,082 |
3/31/2023 |
$10,430 |
$10,338 |
4/30/2023 |
$10,492 |
$10,401 |
5/31/2023 |
$10,399 |
$10,288 |
6/30/2023 |
$10,359 |
$10,251 |
7/31/2023 |
$10,330 |
$10,244 |
8/31/2023 |
$10,269 |
$10,179 |
9/30/2023 |
$10,008 |
$9,920 |
10/31/2023 |
$9,843 |
$9,763 |
11/30/2023 |
$10,301 |
$10,206 |
12/31/2023 |
$10,712 |
$10,596 |
1/31/2024 |
$10,704 |
$10,567 |
2/29/2024 |
$10,590 |
$10,418 |
3/31/2024 |
$10,677 |
$10,514 |
4/30/2024 |
$10,397 |
$10,248 |
5/31/2024 |
$10,593 |
$10,422 |
6/30/2024 |
$10,706 |
$10,521 |
7/31/2024 |
$10,979 |
$10,767 |
8/31/2024 |
$11,126 |
$10,921 |
9/30/2024 |
$11,281 |
$11,068 |
10/31/2024 |
$10,959 |
$10,793 |
11/30/2024 |
$11,053 |
$10,907 |
12/31/2024 |
$10,896 |
$10,729 |
1/31/2025 |
$10,948 |
$10,786 |
2/28/2025 |
$11,187 |
$11,023 |
3/31/2025 |
$11,172 |
$11,027 |
4/30/2025 |
$11,201 |
$11,070 |
5/31/2025 |
$11,108 |
$10,991 |
6/30/2025 |
$11,279 |
$11,160 |
7/31/2025 |
$11,242 |
$11,131 |
8/31/2025 |
$11,383 |
$11,264 |
9/30/2025 |
$11,480 |
$11,387 |
10/31/2025 |
$11,543 |
$11,458 |
11/30/2025 |
$11,607 |
$11,529 |
12/31/2025 |
$11,558 |
$11,512 |
1/31/2026 |
$11,600 |
$11,524 |
2/28/2026 |
$11,789 |
$11,713 |
3/31/2026 |
$11,571 |
$11,506 |
4/30/2026 |
$11,600 |
$11,519 |
5/31/2026 |
$11,631 |
$11,555 |
6/30/2026 |
$11,674 |
$11,583 |
7/31/2026 |
$11,510 |
$11,432 |
|
|
| Average Annual Return [Table Text Block] |
Table Summary
Name |
1 Year |
5 Years |
10 Years |
Investor shares |
2.39% |
(0.79%) |
1.42% |
Bloomberg U.S. Aggregate Bond Index |
2.71% |
(0.40%) |
1.35% | |
|
| No Deduction of Taxes [Text Block] |
The graph and table do not reflect the deduction of taxes that a shareholder would pay on Fund distributions or redemption of Fund shares.
|
|
| Updated Performance Information Location [Text Block] |
Visit domini.com/performance for the most recent performance information.
|
|
| AssetsNet |
$ 261,291,049
|
|
| Holdings Count | Holding |
389
|
|
| Advisory Fees Paid, Amount |
$ 1,460,824
|
|
| InvestmentCompanyPortfolioTurnover |
195.00%
|
|
| Additional Fund Statistics [Text Block] |
The following table outlines certain key Fund statistics as of the end of the reporting period:
Table Summary
Fund's net assets |
$261,291,049 |
Total number of portfolio holdings |
389 |
Portfolio turnover rate |
195% |
Total advisory fees paid |
$1,460,824 | |
|
| Holdings [Text Block] |
PORTFOLIO COMPOSITION (% of net assets)
Table Summary
Value |
Value |
Other Liabilities, Less Assets |
(8.8%) |
Convertible Bonds |
0.6% |
Senior Floating Rate Interests |
1.5% |
Asset Backed Securities |
2.6% |
Foreign Government & Agency Securities |
3.1% |
Municipal Bonds |
4.7% |
U.S. Government Agency Obligations |
25.5% |
Corporate Bonds and Notes |
34.5% |
Mortgage Backed Securities |
36.3% | |
|
| Largest Holdings [Text Block] |
TOP TEN HOLDINGS (% of net assets)
Table Summary
Federal Home Loan Bank Discount Notes, 0.000%, 08/10/26 |
6.5% |
Federal National Mortgage Association, TBA, 5.500%, 08/01/56 |
6.4% |
European Investment Bank, 0.750%, 09/23/30 |
4.3% |
Federal National Mortgage Association, 0.875%, 08/05/30 |
2.7% |
Kreditanstalt fuer Wiederaufbau, 4.375%, 02/28/34 |
2.3% |
Federal Home Loan Banks, 3.315%, 11/13/35 |
2.2% |
Federal Home Loan Bank Discount Notes, 0.000%, 10/13/26 |
2.1% |
Federal National Mortgage Association Principal STRIPS, 0.000%, 07/15/37 |
2.0% |
Federal Home Loan Banks, 3.250%, 11/16/28 |
1.9% |
Federal National Mortgage Association, 0.750%, 10/08/27 |
1.8% | |
|
| Updated Prospectus Phone Number |
1-800-582-6757
|
|
| Updated Prospectus Web Address |
domini.com/funddocuments
|
|
| C000110199 |
|
|
| Shareholder Report [Line Items] |
|
|
| Fund Name |
Domini Impact Bond Fund
|
|
| Class Name |
INSTITUTIONAL SHARES
|
|
| Trading Symbol |
DSBIX
|
|
| Annual or Semi-Annual Statement [Text Block] |
This annual shareholder report contains important information about the Domini Impact Bond Fund for the period of August 1, 2025 to July 31, 2026.
|
|
| Additional Information [Text Block] |
You can find additional information about the Fund at domini.com. You can also request information by contacting us at 1-800-582-6757 or by emailing funddocuments@domini.com.
|
|
| Additional Information Phone Number |
1-800-582-6757
|
|
| Additional Information Email |
<span style="box-sizing: border-box; color: rgb(0, 0, 0); display: inline; flex-wrap: nowrap; font-size: 12px; font-weight: 400; grid-area: auto; line-height: 18px; margin: 0px; overflow: visible; text-align: left; text-align-last: auto; white-space-collapse: preserve-breaks;">funddocuments@domini.com</span>
|
|
| Additional Information Website |
domini.com
|
|
| Expenses [Text Block] |
What were the Fund costs for last year?(based on a hypothetical $10,000 investment)
Table Summary
Class Name |
Cost of a $10,000 investment |
Costs paid as a percentage of a $10,000 investment |
Institutional shares |
$58 |
0.57% | |
|
| Expenses Paid, Amount |
$ 58
|
|
| Expense Ratio, Percent |
0.57%
|
|
| Factors Affecting Performance [Text Block] |
How did the Fund perform last year and what affected its performance?The Fund’s Institutional shares returned 2.69% for the trailing twelve months ended July 31, 2026, underperforming relative to the Bloomberg U.S. Aggregate Bond Index (the “benchmark”), which returned 2.71%. U.S. bonds generated positive total returns over the period, with credit sectors outperforming duration-equivalent government bonds. Yields were volatile as markets balanced resilient economic growth, persistent inflation, and evolving expectations for Federal Reserve policy, and most developed-market sovereign yields ended higher. The first half of 2026 was marked by increased volatility and periods of spread widening amid U.S.–Iran tensions, but conditions improved toward the end of the period as supportive technicals helped restore risk sentiment. The Fund maintained an underweight to investment-grade corporate bonds in favor of high-yield credit, bank loans, taxable municipals, and securitized sectors. Out-of-benchmark allocations to high yield and bank loans were among the top contributors, benefiting from their coupon advantage. An overweight to taxable municipals and a modest allocation to convertible bonds also contributed favorably. Within securitized sectors, agency mortgage-backed securities and commercial mortgage-backed securities contributed positively despite spikes in interest rate volatility. This was partially offset by a negative impact from asset-backed securities, particularly auto loans. Relative to the benchmark, the Fund had a longer duration position for most of the period, which was a headwind for performance, particularly during the first half. The Fund does not invest in U.S. Treasuries in accordance with Domini’s exclusionary standards on nuclear weapons. During the period, the Fund used derivatives to help implement overall duration strategy. This exposure modestly detracted in aggregate, primarily attributable to U.S. interest rate swaps and partially offset by a positive impact from developed non-U.S. government derivatives. Top Relative Contributors |
|
| Performance Past Does Not Indicate Future [Text] |
Keep in mind that the Fund's past performance is not a good predictor of how the Fund will perform in the future.
|
|
| Line Graph [Table Text Block] |
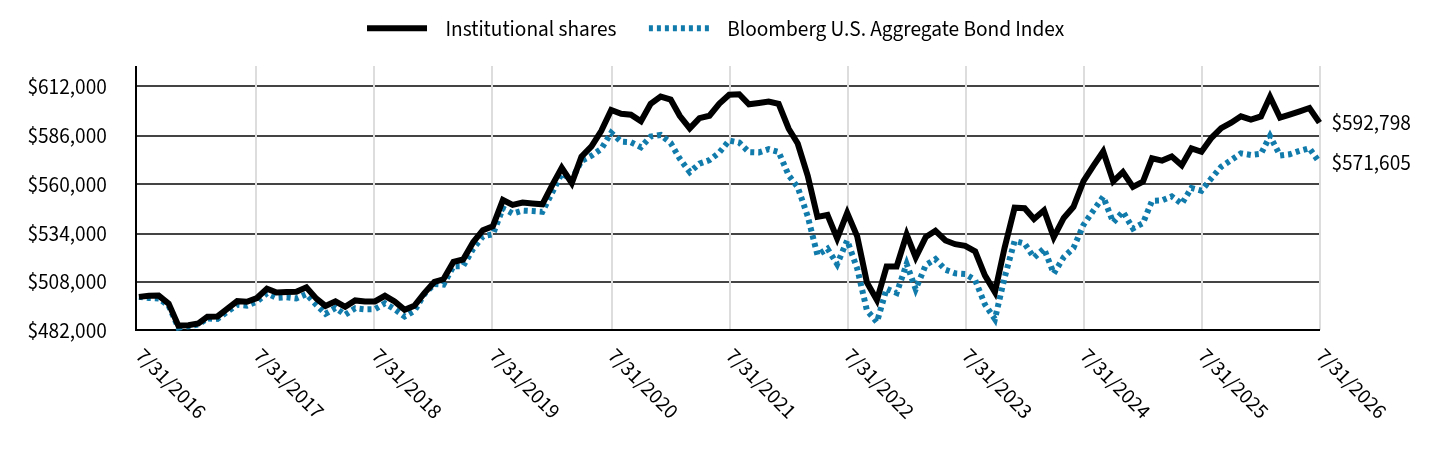
Table Summary
|
Institutional shares |
Bloomberg U.S. Aggregate Bond Index |
7/31/2016 |
$500,000 |
$500,000 |
8/31/2016 |
$500,647 |
$499,450 |
9/30/2016 |
$500,706 |
$499,150 |
10/31/2016 |
$496,414 |
$495,357 |
11/30/2016 |
$484,694 |
$483,617 |
12/31/2016 |
$484,889 |
$484,294 |
1/31/2017 |
$485,856 |
$485,262 |
2/28/2017 |
$489,449 |
$488,514 |
3/31/2017 |
$489,558 |
$488,269 |
4/30/2017 |
$493,613 |
$492,029 |
5/31/2017 |
$497,715 |
$495,818 |
6/30/2017 |
$497,400 |
$495,322 |
7/31/2017 |
$499,380 |
$497,452 |
8/31/2017 |
$504,380 |
$501,929 |
9/30/2017 |
$502,280 |
$499,520 |
10/31/2017 |
$502,605 |
$499,819 |
11/30/2017 |
$502,767 |
$499,170 |
12/31/2017 |
$505,078 |
$501,466 |
1/31/2018 |
$499,037 |
$495,699 |
2/28/2018 |
$495,197 |
$490,990 |
3/31/2018 |
$497,652 |
$494,132 |
4/30/2018 |
$494,703 |
$490,456 |
5/31/2018 |
$498,104 |
$493,939 |
6/30/2018 |
$497,487 |
$493,346 |
7/31/2018 |
$497,577 |
$493,444 |
8/31/2018 |
$500,570 |
$496,603 |
9/30/2018 |
$497,583 |
$493,424 |
10/31/2018 |
$493,092 |
$489,526 |
11/30/2018 |
$495,249 |
$492,463 |
12/31/2018 |
$502,020 |
$501,525 |
1/31/2019 |
$507,935 |
$506,841 |
2/28/2019 |
$509,362 |
$506,537 |
3/31/2019 |
$518,664 |
$516,262 |
4/30/2019 |
$519,893 |
$516,417 |
5/31/2019 |
$529,093 |
$525,609 |
6/30/2019 |
$535,485 |
$532,232 |
7/31/2019 |
$537,657 |
$533,403 |
8/31/2019 |
$551,578 |
$547,218 |
9/30/2019 |
$548,967 |
$544,318 |
10/31/2019 |
$550,205 |
$545,951 |
11/30/2019 |
$549,761 |
$545,678 |
12/31/2019 |
$549,304 |
$545,296 |
1/31/2020 |
$559,654 |
$555,765 |
2/29/2020 |
$568,736 |
$565,769 |
3/31/2020 |
$560,633 |
$562,431 |
4/30/2020 |
$574,667 |
$572,443 |
5/31/2020 |
$580,146 |
$575,133 |
6/30/2020 |
$588,337 |
$578,756 |
7/31/2020 |
$599,501 |
$587,380 |
8/31/2020 |
$597,521 |
$582,622 |
9/30/2020 |
$596,976 |
$582,331 |
10/31/2020 |
$593,544 |
$579,710 |
11/30/2020 |
$602,790 |
$585,391 |
12/31/2020 |
$606,693 |
$586,211 |
1/31/2021 |
$605,086 |
$581,990 |
2/28/2021 |
$596,424 |
$573,610 |
3/31/2021 |
$589,760 |
$566,439 |
4/30/2021 |
$595,178 |
$570,914 |
5/31/2021 |
$596,471 |
$572,798 |
6/30/2021 |
$602,844 |
$576,808 |
7/31/2021 |
$607,615 |
$583,268 |
8/31/2021 |
$607,887 |
$582,160 |
9/30/2021 |
$602,535 |
$577,095 |
10/31/2021 |
$603,262 |
$576,922 |
11/30/2021 |
$604,044 |
$578,653 |
12/31/2021 |
$602,763 |
$577,148 |
1/31/2022 |
$589,563 |
$564,740 |
2/28/2022 |
$581,665 |
$558,415 |
3/31/2022 |
$564,492 |
$542,891 |
4/30/2022 |
$542,623 |
$522,315 |
5/31/2022 |
$543,628 |
$525,658 |
6/30/2022 |
$531,153 |
$517,412 |
7/31/2022 |
$544,756 |
$530,054 |
8/31/2022 |
$532,227 |
$515,107 |
9/30/2022 |
$507,717 |
$492,854 |
10/31/2022 |
$498,328 |
$486,496 |
11/30/2022 |
$516,218 |
$504,380 |
12/31/2022 |
$516,210 |
$502,106 |
1/31/2023 |
$533,217 |
$517,520 |
2/28/2023 |
$521,051 |
$504,117 |
3/31/2023 |
$531,854 |
$516,921 |
4/30/2023 |
$535,175 |
$520,074 |
5/31/2023 |
$530,005 |
$514,411 |
6/30/2023 |
$528,050 |
$512,559 |
7/31/2023 |
$527,203 |
$512,204 |
8/31/2023 |
$524,216 |
$508,932 |
9/30/2023 |
$511,447 |
$495,998 |
10/31/2023 |
$502,540 |
$488,171 |
11/30/2023 |
$526,206 |
$510,278 |
12/31/2023 |
$547,468 |
$529,811 |
1/31/2024 |
$547,186 |
$528,356 |
2/29/2024 |
$541,448 |
$520,891 |
3/31/2024 |
$546,075 |
$525,702 |
4/30/2024 |
$531,751 |
$512,422 |
5/31/2024 |
$542,008 |
$521,109 |
6/30/2024 |
$547,947 |
$526,044 |
7/31/2024 |
$561,608 |
$538,332 |
8/31/2024 |
$569,874 |
$546,066 |
9/30/2024 |
$577,431 |
$553,378 |
10/31/2024 |
$561,523 |
$539,655 |
11/30/2024 |
$566,469 |
$545,360 |
12/31/2024 |
$558,542 |
$536,435 |
1/31/2025 |
$561,335 |
$539,280 |
2/28/2025 |
$573,778 |
$551,144 |
3/31/2025 |
$572,578 |
$551,353 |
4/30/2025 |
$574,791 |
$553,519 |
5/31/2025 |
$570,096 |
$549,556 |
6/30/2025 |
$579,092 |
$558,006 |
7/31/2025 |
$577,288 |
$556,533 |
8/31/2025 |
$584,732 |
$563,191 |
9/30/2025 |
$589,896 |
$569,335 |
10/31/2025 |
$592,733 |
$572,890 |
11/30/2025 |
$596,158 |
$576,442 |
12/31/2025 |
$594,354 |
$575,590 |
1/31/2026 |
$596,082 |
$576,205 |
2/28/2026 |
$606,596 |
$585,640 |
3/31/2026 |
$595,419 |
$575,321 |
4/30/2026 |
$597,070 |
$575,965 |
5/31/2026 |
$598,808 |
$577,759 |
6/30/2026 |
$600,572 |
$579,150 |
7/31/2026 |
$592,798 |
$571,605 |
|
|
| Average Annual Return [Table Text Block] |
Table Summary
Name |
1 Year |
5 Years |
10 Years |
Institutional shares |
2.69% |
(0.49%) |
1.72% |
Bloomberg U.S. Aggregate Bond Index |
2.71% |
(0.40%) |
1.35% | |
|
| No Deduction of Taxes [Text Block] |
The graph and table do not reflect the deduction of taxes that a shareholder would pay on Fund distributions or redemption of Fund shares.
|
|
| Updated Performance Information Location [Text Block] |
Visit domini.com/performance for the most recent performance information.
|
|
| AssetsNet |
$ 261,291,049
|
|
| Holdings Count | Holding |
389
|
|
| Advisory Fees Paid, Amount |
$ 1,460,824
|
|
| InvestmentCompanyPortfolioTurnover |
195.00%
|
|
| Additional Fund Statistics [Text Block] |
The following table outlines certain key Fund statistics as of the end of the reporting period:
Table Summary
Fund's net assets |
$261,291,049 |
Total number of portfolio holdings |
389 |
Portfolio turnover rate |
195% |
Total advisory fees paid |
$1,460,824 | |
|
| Holdings [Text Block] |
PORTFOLIO COMPOSITION (% of net assets)
Table Summary
Value |
Value |
Other Liabilities, Less Assets |
(8.8%) |
Convertible Bonds |
0.6% |
Senior Floating Rate Interests |
1.5% |
Asset Backed Securities |
2.6% |
Foreign Government & Agency Securities |
3.1% |
Municipal Bonds |
4.7% |
U.S. Government Agency Obligations |
25.5% |
Corporate Bonds and Notes |
34.5% |
Mortgage Backed Securities |
36.3% | |
|
| Largest Holdings [Text Block] |
TOP TEN HOLDINGS (% of net assets)
Table Summary
Federal Home Loan Bank Discount Notes, 0.000%, 08/10/26 |
6.5% |
Federal National Mortgage Association, TBA, 5.500%, 08/01/56 |
6.4% |
European Investment Bank, 0.750%, 09/23/30 |
4.3% |
Federal National Mortgage Association, 0.875%, 08/05/30 |
2.7% |
Kreditanstalt fuer Wiederaufbau, 4.375%, 02/28/34 |
2.3% |
Federal Home Loan Banks, 3.315%, 11/13/35 |
2.2% |
Federal Home Loan Bank Discount Notes, 0.000%, 10/13/26 |
2.1% |
Federal National Mortgage Association Principal STRIPS, 0.000%, 07/15/37 |
2.0% |
Federal Home Loan Banks, 3.250%, 11/16/28 |
1.9% |
Federal National Mortgage Association, 0.750%, 10/08/27 |
1.8% | |
|
| Updated Prospectus Phone Number |
1-800-582-6757
|
|
| Updated Prospectus Web Address |
domini.com/funddocuments
|
|
| C000200994 |
|
|
| Shareholder Report [Line Items] |
|
|
| Fund Name |
Domini Impact Bond Fund
|
|
| Class Name |
CLASS Y SHARES
|
|
| Trading Symbol |
DSBYX
|
|
| Annual or Semi-Annual Statement [Text Block] |
This annual shareholder report contains important information about the Domini Impact Bond Fund for the period of August 1, 2025 to July 31, 2026.
|
|
| Additional Information [Text Block] |
You can find additional information about the Fund at domini.com. You can also request information by contacting us at 1-800-582-6757 or by emailing funddocuments@domini.com.
|
|
| Additional Information Phone Number |
1-800-582-6757
|
|
| Additional Information Email |
<span style="box-sizing: border-box; color: rgb(0, 0, 0); display: inline; flex-wrap: nowrap; font-size: 12px; font-weight: 400; grid-area: auto; line-height: 18px; margin: 0px; overflow: visible; text-align: left; text-align-last: auto; white-space-collapse: preserve-breaks;">funddocuments@domini.com</span>
|
|
| Additional Information Website |
domini.com
|
|
| Expenses [Text Block] |
What were the Fund costs for last year?(based on a hypothetical $10,000 investment)
Table Summary
Class Name |
Cost of a $10,000 investment |
Costs paid as a percentage of a $10,000 investment |
Class Y shares |
$66 |
0.65% | |
|
| Expenses Paid, Amount |
$ 66
|
|
| Expense Ratio, Percent |
0.65%
|
|
| Factors Affecting Performance [Text Block] |
How did the Fund perform last year and what affected its performance?The Fund’s Class Y shares returned 2.61% for the trailing twelve months ended July 31, 2026, underperforming relative to the Bloomberg U.S. Aggregate Bond Index (the “benchmark”), which returned 2.71%. U.S. bonds generated positive total returns over the period, with credit sectors outperforming duration-equivalent government bonds. Yields were volatile as markets balanced resilient economic growth, persistent inflation, and evolving expectations for Federal Reserve policy, and most developed-market sovereign yields ended higher. The first half of 2026 was marked by increased volatility and periods of spread widening amid U.S.–Iran tensions, but conditions improved toward the end of the period as supportive technicals helped restore risk sentiment. The Fund maintained an underweight to investment-grade corporate bonds in favor of high-yield credit, bank loans, taxable municipals, and securitized sectors. Out-of-benchmark allocations to high yield and bank loans were among the top contributors, benefiting from their coupon advantage. An overweight to taxable municipals and a modest allocation to convertible bonds also contributed favorably. Within securitized sectors, agency mortgage-backed securities and commercial mortgage-backed securities contributed positively despite spikes in interest rate volatility. This was partially offset by a negative impact from asset-backed securities, particularly auto loans. Relative to the benchmark, the Fund had a longer duration position for most of the period, which was a headwind for performance, particularly during the first half. The Fund does not invest in U.S. Treasuries in accordance with Domini’s exclusionary standards on nuclear weapons. During the period, the Fund used derivatives to help implement overall duration strategy. This exposure modestly detracted in aggregate, primarily attributable to U.S. interest rate swaps and partially offset by a positive impact from developed non-U.S. government derivatives. Top Relative Contributors |
|
| Performance Past Does Not Indicate Future [Text] |
Keep in mind that the Fund's past performance is not a good predictor of how the Fund will perform in the future.
|
|
| Line Graph [Table Text Block] |
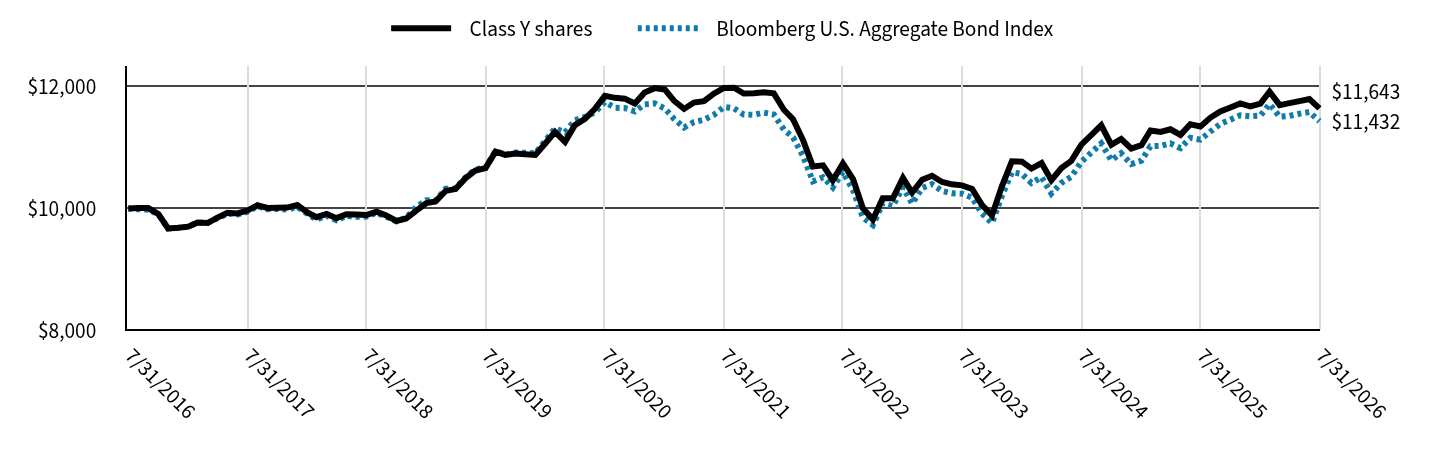
Table Summary
|
Class Y shares |
Bloomberg U.S. Aggregate Bond Index |
7/31/2016 |
$10,000 |
$10,000 |
8/31/2016 |
$10,010 |
$9,989 |
9/30/2016 |
$10,009 |
$9,983 |
10/31/2016 |
$9,912 |
$9,907 |
11/30/2016 |
$9,676 |
$9,672 |
12/31/2016 |
$9,687 |
$9,686 |
1/31/2017 |
$9,704 |
$9,705 |
2/28/2017 |
$9,773 |
$9,770 |
3/31/2017 |
$9,764 |
$9,765 |
4/30/2017 |
$9,852 |
$9,841 |
5/31/2017 |
$9,931 |
$9,916 |
6/30/2017 |
$9,922 |
$9,906 |
7/31/2017 |
$9,968 |
$9,949 |
8/31/2017 |
$10,056 |
$10,039 |
9/30/2017 |
$10,012 |
$9,990 |
10/31/2017 |
$10,016 |
$9,996 |
11/30/2017 |
$10,017 |
$9,983 |
12/31/2017 |
$10,060 |
$10,029 |
1/31/2018 |
$9,937 |
$9,914 |
2/28/2018 |
$9,859 |
$9,820 |
3/31/2018 |
$9,914 |
$9,883 |
4/30/2018 |
$9,844 |
$9,809 |
5/31/2018 |
$9,909 |
$9,879 |
6/30/2018 |
$9,904 |
$9,867 |
7/31/2018 |
$9,894 |
$9,869 |
8/31/2018 |
$9,951 |
$9,932 |
9/30/2018 |
$9,889 |
$9,868 |
10/31/2018 |
$9,798 |
$9,791 |
11/30/2018 |
$9,838 |
$9,849 |
12/31/2018 |
$9,968 |
$10,030 |
1/31/2019 |
$10,092 |
$10,137 |
2/28/2019 |
$10,118 |
$10,131 |
3/31/2019 |
$10,290 |
$10,325 |
4/30/2019 |
$10,320 |
$10,328 |
5/31/2019 |
$10,499 |
$10,512 |
6/30/2019 |
$10,623 |
$10,645 |
7/31/2019 |
$10,663 |
$10,668 |
8/31/2019 |
$10,934 |
$10,944 |
9/30/2019 |
$10,880 |
$10,886 |
10/31/2019 |
$10,902 |
$10,919 |
11/30/2019 |
$10,891 |
$10,914 |
12/31/2019 |
$10,879 |
$10,906 |
1/31/2020 |
$11,071 |
$11,115 |
2/29/2020 |
$11,256 |
$11,315 |
3/31/2020 |
$11,094 |
$11,249 |
4/30/2020 |
$11,368 |
$11,449 |
5/31/2020 |
$11,472 |
$11,503 |
6/30/2020 |
$11,631 |
$11,575 |
7/31/2020 |
$11,847 |
$11,748 |
8/31/2020 |
$11,815 |
$11,652 |
9/30/2020 |
$11,802 |
$11,647 |
10/31/2020 |
$11,722 |
$11,594 |
11/30/2020 |
$11,901 |
$11,708 |
12/31/2020 |
$11,974 |
$11,724 |
1/31/2021 |
$11,950 |
$11,640 |
2/28/2021 |
$11,768 |
$11,472 |
3/31/2021 |
$11,634 |
$11,329 |
4/30/2021 |
$11,738 |
$11,418 |
5/31/2021 |
$11,760 |
$11,456 |
6/30/2021 |
$11,884 |
$11,536 |
7/31/2021 |
$11,977 |
$11,665 |
8/31/2021 |
$11,981 |
$11,643 |
9/30/2021 |
$11,886 |
$11,542 |
10/31/2021 |
$11,890 |
$11,538 |
11/30/2021 |
$11,905 |
$11,573 |
12/31/2021 |
$11,889 |
$11,543 |
1/31/2022 |
$11,620 |
$11,295 |
2/28/2022 |
$11,465 |
$11,168 |
3/31/2022 |
$11,119 |
$10,858 |
4/30/2022 |
$10,690 |
$10,446 |
5/31/2022 |
$10,709 |
$10,513 |
6/30/2022 |
$10,465 |
$10,348 |
7/31/2022 |
$10,741 |
$10,601 |
8/31/2022 |
$10,485 |
$10,302 |
9/30/2022 |
$10,005 |
$9,857 |
10/31/2022 |
$9,821 |
$9,730 |
11/30/2022 |
$10,171 |
$10,088 |
12/31/2022 |
$10,170 |
$10,042 |
1/31/2023 |
$10,502 |
$10,350 |
2/28/2023 |
$10,263 |
$10,082 |
3/31/2023 |
$10,474 |
$10,338 |
4/30/2023 |
$10,538 |
$10,401 |
5/31/2023 |
$10,437 |
$10,288 |
6/30/2023 |
$10,398 |
$10,251 |
7/31/2023 |
$10,381 |
$10,244 |
8/31/2023 |
$10,322 |
$10,179 |
9/30/2023 |
$10,062 |
$9,920 |
10/31/2023 |
$9,888 |
$9,763 |
11/30/2023 |
$10,360 |
$10,206 |
12/31/2023 |
$10,775 |
$10,596 |
1/31/2024 |
$10,769 |
$10,567 |
2/29/2024 |
$10,656 |
$10,418 |
3/31/2024 |
$10,746 |
$10,514 |
4/30/2024 |
$10,466 |
$10,248 |
5/31/2024 |
$10,665 |
$10,422 |
6/30/2024 |
$10,781 |
$10,521 |
7/31/2024 |
$11,047 |
$10,767 |
8/31/2024 |
$11,208 |
$10,921 |
9/30/2024 |
$11,366 |
$11,068 |
10/31/2024 |
$11,044 |
$10,793 |
11/30/2024 |
$11,140 |
$10,907 |
12/31/2024 |
$10,985 |
$10,729 |
1/31/2025 |
$11,039 |
$10,786 |
2/28/2025 |
$11,281 |
$11,023 |
3/31/2025 |
$11,257 |
$11,027 |
4/30/2025 |
$11,300 |
$11,070 |
5/31/2025 |
$11,208 |
$10,991 |
6/30/2025 |
$11,383 |
$11,160 |
7/31/2025 |
$11,347 |
$11,131 |
8/31/2025 |
$11,492 |
$11,264 |
9/30/2025 |
$11,592 |
$11,387 |
10/31/2025 |
$11,658 |
$11,458 |
11/30/2025 |
$11,724 |
$11,529 |
12/31/2025 |
$11,677 |
$11,512 |
1/31/2026 |
$11,722 |
$11,524 |
2/28/2026 |
$11,915 |
$11,713 |
3/31/2026 |
$11,696 |
$11,506 |
4/30/2026 |
$11,728 |
$11,519 |
5/31/2026 |
$11,761 |
$11,555 |
6/30/2026 |
$11,795 |
$11,583 |
7/31/2026 |
$11,643 |
$11,432 |
|
|
| Average Annual Return [Table Text Block] |
Table Summary
Name |
1 Year |
5 Years |
10 Years |
Class Y shares |
2.61% |
(0.56%) |
1.53% |
Bloomberg U.S. Aggregate Bond Index |
2.71% |
(0.40%) |
1.35% | |
|
| No Deduction of Taxes [Text Block] |
The graph and table do not reflect the deduction of taxes that a shareholder would pay on Fund distributions or redemption of Fund shares.
|
|
| Updated Performance Information Location [Text Block] |
Visit domini.com/performance for the most recent performance information.
|
|
| AssetsNet |
$ 261,291,049
|
|
| Holdings Count | Holding |
389
|
|
| Advisory Fees Paid, Amount |
$ 1,460,824
|
|
| InvestmentCompanyPortfolioTurnover |
195.00%
|
|
| Additional Fund Statistics [Text Block] |
The following table outlines certain key Fund statistics as of the end of the reporting period:
Table Summary
Fund's net assets |
$261,291,049 |
Total number of portfolio holdings |
389 |
Portfolio turnover rate |
195% |
Total advisory fees paid |
$1,460,824 | |
|
| Holdings [Text Block] |
PORTFOLIO COMPOSITION (% of net assets)
Table Summary
Value |
Value |
Other Liabilities, Less Assets |
(8.8%) |
Convertible Bonds |
0.6% |
Senior Floating Rate Interests |
1.5% |
Asset Backed Securities |
2.6% |
Foreign Government & Agency Securities |
3.1% |
Municipal Bonds |
4.7% |
U.S. Government Agency Obligations |
25.5% |
Corporate Bonds and Notes |
34.5% |
Mortgage Backed Securities |
36.3% | |
|
| Largest Holdings [Text Block] |
TOP TEN HOLDINGS (% of net assets)
Table Summary
Federal Home Loan Bank Discount Notes, 0.000%, 08/10/26 |
6.5% |
Federal National Mortgage Association, TBA, 5.500%, 08/01/56 |
6.4% |
European Investment Bank, 0.750%, 09/23/30 |
4.3% |
Federal National Mortgage Association, 0.875%, 08/05/30 |
2.7% |
Kreditanstalt fuer Wiederaufbau, 4.375%, 02/28/34 |
2.3% |
Federal Home Loan Banks, 3.315%, 11/13/35 |
2.2% |
Federal Home Loan Bank Discount Notes, 0.000%, 10/13/26 |
2.1% |
Federal National Mortgage Association Principal STRIPS, 0.000%, 07/15/37 |
2.0% |
Federal Home Loan Banks, 3.250%, 11/16/28 |
1.9% |
Federal National Mortgage Association, 0.750%, 10/08/27 |
1.8% | |
|
| Updated Prospectus Phone Number |
1-800-582-6757
|
|
| Updated Prospectus Web Address |
domini.com/funddocuments
|
|