Pay vs Performance Disclosure - USD ($)
|
12 Months Ended |
Jul. 03, 2026 |
Jun. 27, 2025 |
Jun. 28, 2024 |
Jun. 30, 2023 |
Jul. 01, 2022 |
| Pay vs Performance Disclosure |
|
|
|
|
|
| Pay vs Performance Disclosure, Table |
Pay Versus Performance As required by Section 953(a) of the Dodd-Frank Wall Street Reform and Consumer Protection Act, and Item 402(v) of Regulation S-K under the Exchange Act, we are providing the following information about the relationship between executive “compensation actually paid” (as computed in accordance with SEC rules) and certain financial performance measures. For further information concerning our pay-for-performance philosophy and how we align executive compensation with our performance, please see the section entitled “Executive Compensation—Compensation Discussion and Analysis” beginning on page 42. The following tables and related disclosures provide information about (i) the total compensation of our principal executive officer (“PEO”) and our non-PEO named executive officers (collectively, the “Other NEOs”) as presented in the “Fiscal 2024-2026 Summary Compensation Table” above and its equivalent table in prior years’ proxy statements; (ii) the “compensation actually paid” to our PEO and our Other NEOs, as calculated pursuant to Item 402(v) of Regulation S-K under the Exchange Act; (iii) certain financial performance measures; and (iv) the relationship between the “compensation actually paid” to those financial performance measures. | | | | | | | | | | | | | | | | | | | | | | | | | | | | | | | | | | | | | | | | | | | | | | | | | | | | | | | | | | | | | | | | | |
| | | | | | | | | | | | | | Value of Initial Fixed
$100 Investment
Based on: | | | |
| Fiscal
Year | Summary
Compensation Table
Total for PEO(1) | | Compensation
Actually Paid
to PEO(2) | Average
Summary
Compensation
Table for
Other NEOs(1) | Average
Compensation
Actually Paid
to Other
NEOs(2) | Western
Digital
TSR(3) | DJ US
Technology,
Hardware &
Equipment
Index TSR(4) | Net Income
(in millions)(5) | Revenue
(in millions)(6) | | Goeckeler | Tan | | Goeckeler | Tan | | 2026 | | | | $ | 17,168,701 | | | | | | $ | 257,464,053 | | | $ | 5,150,797 | | | $ | 80,686,884 | | | $ | 1,021 | | | $ | 383 | | | $ | 9,424 | | | $ | 12,919 | | | 2025 | | $ | 24,931,456 | | | $ | 11,165,296 | | | | $ | 42,539,122 | | | $ | 15,144,985 | | | $ | 6,239,493 | | | $ | 4,248,317 | | | $ | 198 | | | $ | 352 | | | $ | 1,643 | | | $ | 9,520 | | | 2024 | | $ | 17,690,772 | | | | | | $ | 55,036,294 | | | | | $ | 3,495,976 | | | $ | 6,888,700 | | | $ | 179 | | | $ | 316 | | | $ | (765) | | | $ | 6,317 | | | 2023 | | $ | 11,031,692 | | | | | | $ | (3,260,510) | | | | | $ | 3,412,774 | | | $ | 623,444 | | | $ | 89 | | | $ | 208 | | | $ | (902) | | | $ | 6,255 | | | 2022 | | $ | 32,137,338 | | | | | | $ | (9,097,124) | | | | | $ | 8,508,836 | | | $ | (79,686) | | | $ | 102 | | | $ | 138 | | | $ | 1,546 | | | $ | 18,793 | |
|
|
|
|
|
| Company Selected Measure Name |
revenue
|
|
|
|
|
| Named Executive Officers, Footnote |
Mr. Tan was appointed PEO effective February 22, 2025. David Goeckeler was our PEO from the start of fiscal 2025 through February 21, 2025, and for each of the other years presented. The Other NEOs were: (i) for fiscal 2026, Messrs. Sennesael, Gubbi, Shihab and Ms. Tregillis (ii) for fiscal 2025, Messrs. Sennesael, Gubbi, Shihab, Jabre, Bennett and Soderbery and Ms. Tregillis; (iii) for fiscal 2024 and fiscal 2023, Messrs. Jabre, Soderbery, Ray and Sivaram; and (iv) for fiscal 2022, Messrs. Jabre, Sivaram, Soderbery and Ray and Robert Eulau (our former CFO). The dollar amounts reported are the amounts reported for the PEO, or the average of the amounts reported for the Other NEOs, for each of the corresponding fiscal years in the “Total” column in our applicable Summary Compensation Table. The fiscal 2025 amount reported for Mr. Tan reflects the updated corresponding “Total” column in the “Fiscal 2024-2026 Summary Compensation Table” above.
|
|
|
|
|
| Peer Group Issuers, Footnote |
The peer group used for this purpose is the Dow Jones U.S. Technology Hardware & Equipment Index.
|
|
|
|
|
| Adjustment To PEO Compensation, Footnote |
The following table describes the adjustments, each of which is prescribed by the SEC rules, to calculate the “compensation actually paid” amounts from the Summary Compensation Table for each fiscal year. The Summary Compensation Table amounts and the “compensation actually paid” amounts do not reflect the actual amount of compensation earned by or paid to our named executive officers during the applicable fiscal years, but rather are amounts determined in accordance with Item 402 of Regulation S-K under the Exchange Act. As reflected in the table below, pursuant to the applicable rules, the amounts in the “Stock Awards” column in the applicable Summary Compensation Table are subtracted from the amounts in the “Total” column and the values reflected in the table below are added or subtracted, as applicable. | | | | | | | | | | Fiscal 2026 | Adjustments to Summary Compensation Table Total(a) | PEO | Other NEOs | Summary Compensation Table Total ($) | 17,168,701 | | 5,150,797 | | | Adjustments for stock awards and option awards: | |
| | (Deduct): Stock awards and option awards totals as included in the Summary Compensation Table Total for the covered fiscal year | (12,623,995) | | (2,893,983) | | | Add: Fair value at year end of awards granted during the covered fiscal year that were outstanding and unvested at the covered fiscal year end | 83,943,968 | | 22,347,991 | | | Add/(Deduct): Change as of the vesting date (from the end of the prior fiscal year) in fair value of awards granted in any prior fiscal year for which vesting conditions were satisfied during the covered fiscal year | 33,212,088 | | 14,725,065 | | | Add/(Deduct): Change as of the last day of the covered fiscal year (from the end of the prior fiscal year) in fair value of awards granted in any prior fiscal year that were outstanding and unvested at the covered fiscal year end | 134,866,395 | | 41,058,403 | | | (Deduct): For awards granted in any prior fiscal year that failed to meet the applicable vesting conditions during the covered fiscal year, the fair values as of the last day of the prior fiscal year | — | | — | | | Add: Fair value as of the vesting date for awards granted and vested during the covered fiscal year | — | | — | | | Add: Value of Dividends or Other Earnings Paid on Equity Awards Not Otherwise Reflected in Total Compensation | 896,896 | | 298,611 | | | “Compensation Actually Paid” Amounts (as calculated) | 257,464,053 | | 80,686,884 | |
(a)Equity values are calculated in accordance with FASB ASC Topic 718, and the valuation assumptions used to calculate fair values did not materially differ from those disclosed at the time of the grant. The amounts shown with respect to our Other NEOs are the average amounts for such Other NEOs, as a group.
|
|
|
|
|
| Non-PEO NEO Average Total Compensation Amount |
$ 5,150,797
|
$ 6,239,493
|
$ 3,495,976
|
$ 3,412,774
|
$ 8,508,836
|
| Non-PEO NEO Average Compensation Actually Paid Amount |
$ 80,686,884
|
4,248,317
|
6,888,700
|
623,444
|
(79,686)
|
| Adjustment to Non-PEO NEO Compensation Footnote |
The following table describes the adjustments, each of which is prescribed by the SEC rules, to calculate the “compensation actually paid” amounts from the Summary Compensation Table for each fiscal year. The Summary Compensation Table amounts and the “compensation actually paid” amounts do not reflect the actual amount of compensation earned by or paid to our named executive officers during the applicable fiscal years, but rather are amounts determined in accordance with Item 402 of Regulation S-K under the Exchange Act. As reflected in the table below, pursuant to the applicable rules, the amounts in the “Stock Awards” column in the applicable Summary Compensation Table are subtracted from the amounts in the “Total” column and the values reflected in the table below are added or subtracted, as applicable. | | | | | | | | | | Fiscal 2026 | Adjustments to Summary Compensation Table Total(a) | PEO | Other NEOs | Summary Compensation Table Total ($) | 17,168,701 | | 5,150,797 | | | Adjustments for stock awards and option awards: | |
| | (Deduct): Stock awards and option awards totals as included in the Summary Compensation Table Total for the covered fiscal year | (12,623,995) | | (2,893,983) | | | Add: Fair value at year end of awards granted during the covered fiscal year that were outstanding and unvested at the covered fiscal year end | 83,943,968 | | 22,347,991 | | | Add/(Deduct): Change as of the vesting date (from the end of the prior fiscal year) in fair value of awards granted in any prior fiscal year for which vesting conditions were satisfied during the covered fiscal year | 33,212,088 | | 14,725,065 | | | Add/(Deduct): Change as of the last day of the covered fiscal year (from the end of the prior fiscal year) in fair value of awards granted in any prior fiscal year that were outstanding and unvested at the covered fiscal year end | 134,866,395 | | 41,058,403 | | | (Deduct): For awards granted in any prior fiscal year that failed to meet the applicable vesting conditions during the covered fiscal year, the fair values as of the last day of the prior fiscal year | — | | — | | | Add: Fair value as of the vesting date for awards granted and vested during the covered fiscal year | — | | — | | | Add: Value of Dividends or Other Earnings Paid on Equity Awards Not Otherwise Reflected in Total Compensation | 896,896 | | 298,611 | | | “Compensation Actually Paid” Amounts (as calculated) | 257,464,053 | | 80,686,884 | |
(a)Equity values are calculated in accordance with FASB ASC Topic 718, and the valuation assumptions used to calculate fair values did not materially differ from those disclosed at the time of the grant. The amounts shown with respect to our Other NEOs are the average amounts for such Other NEOs, as a group.
|
|
|
|
|
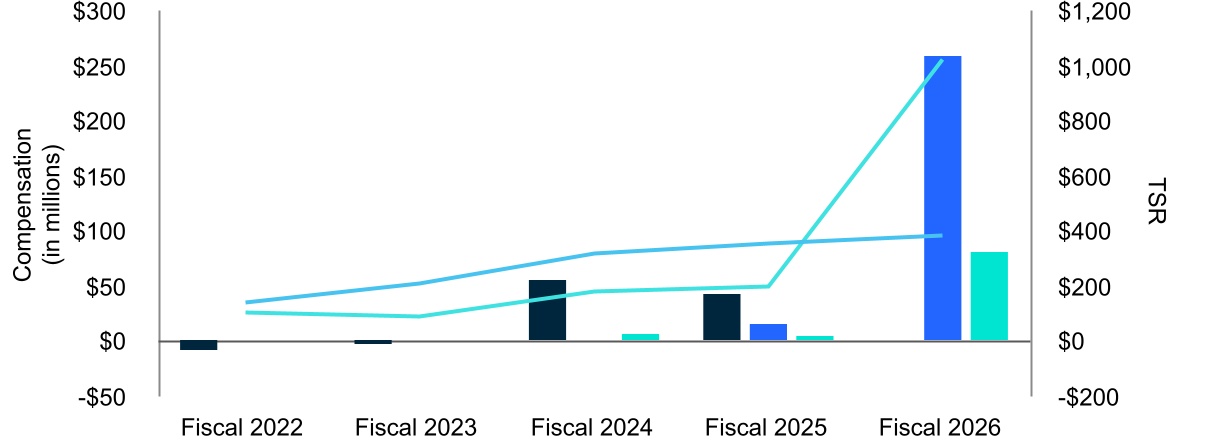
| Compensation Actually Paid vs. Total Shareholder Return |
COMPENSATION ACTUALLY PAID VS. TSR | | | | | | | | | | | | | | | | Compensation Actually Paid to PEO (Goeckeler) | | | Compensation Actually Paid to PEO (Tan) | | | | | | | Average Compensation Actually Paid to Non-PEO NEOs | | | WDC Total Shareholder Return | | | | | | | DJ US Tech, Hardware & Equip Total Shareholder Return | | | |
|
|
|
|
|
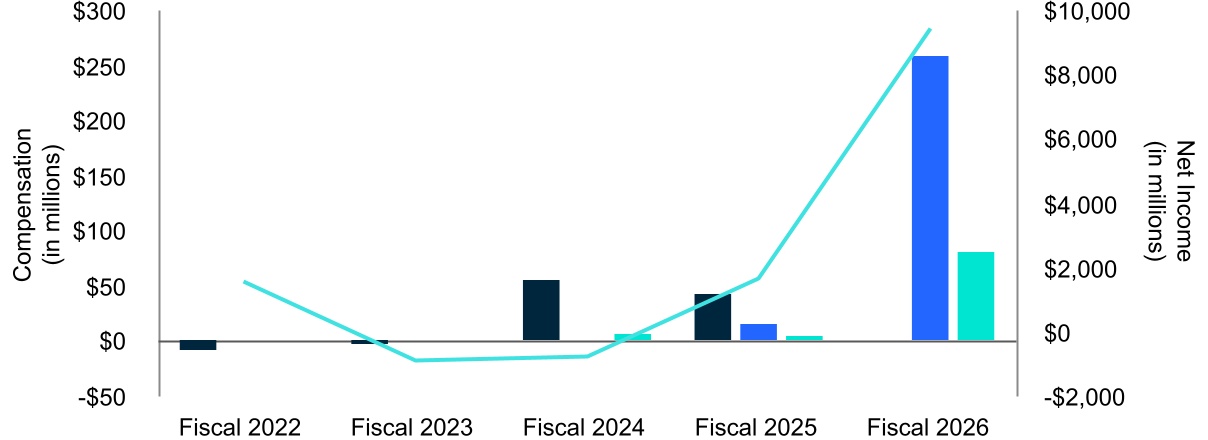
| Compensation Actually Paid vs. Net Income |
COMPENSATION ACTUALLY PAID VS. NET INCOME | | | | | | | | | | | | | | | | Compensation Actually Paid to PEO (Goeckeler) | | | Compensation Actually Paid to PEO (Tan) | | | | | | | Average Compensation Actually Paid to Non-PEO NEOs | | | GAAP Net Income |
|
|
|
|
|
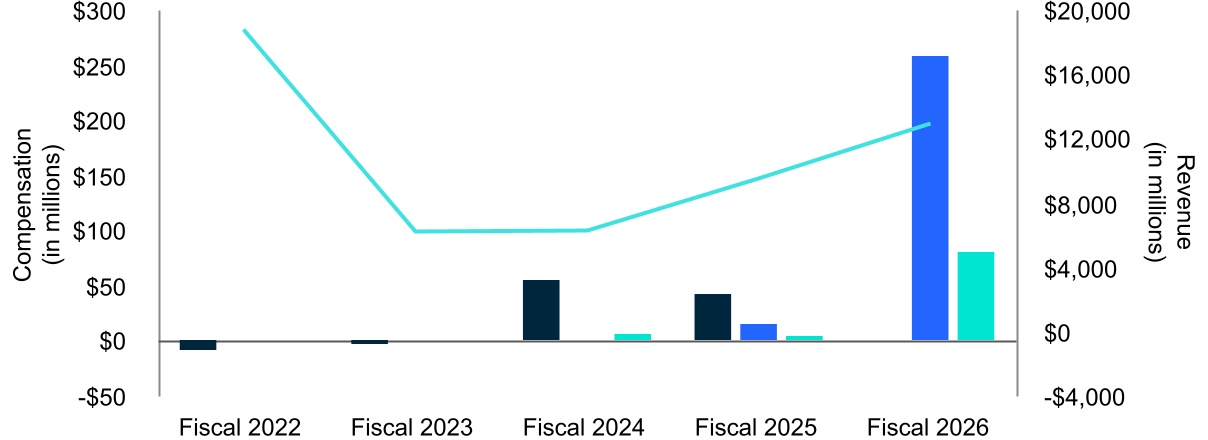
| Compensation Actually Paid vs. Company Selected Measure |
COMPENSATION ACTUALLY PAID VS. REVENUE | | | | | | | | | | | | | | | | Compensation Actually Paid to PEO (Goeckeler) | | | Compensation Actually Paid to PEO (Tan) | | | | | | | Average Compensation Actually Paid to Non-PEO NEOs | | | Revenue |
|
|
|
|
|
| Tabular List, Table |
Financial Performance Measures As described in greater detail under “Executive Compensation—Compensation Discussion and Analysis,” our executive compensation programs reflect a pay-for-performance philosophy. The metrics that we use for both our short- and long-term incentives are selected to incentivize our named executive officers to create value for our stockholders. The most important financial performance measures used to link executive compensation actually paid to our named executive officers to our company’s performance for the most recent fiscal year, are as follows: lAdjusted Free Cash Flow lRevenue (the Company-Selected Measure) lNon-GAAP EPS lNon-GAAP Operating Income
|
|
|
|
|
| Total Shareholder Return Amount |
$ 1,021
|
198
|
179
|
89
|
102
|
| Peer Group Total Shareholder Return Amount |
383
|
352
|
316
|
208
|
138
|
| Net Income (Loss) |
$ 9,424,000,000
|
$ 1,643,000,000
|
$ (765,000,000)
|
$ (902,000,000)
|
$ 1,546,000,000
|
| Company Selected Measure Amount |
12,919,000,000
|
9,520,000,000
|
6,317,000,000
|
6,255,000,000
|
18,793,000,000
|
| PEO Name |
Mr. Tan
|
Goeckeler
|
Goeckeler
|
Goeckeler
|
Goeckeler
|
| Measure:: 1 |
|
|
|
|
|
| Pay vs Performance Disclosure |
|
|
|
|
|
| Name |
Revenue (the Company-Selected Measure)
|
|
|
|
|
| Non-GAAP Measure Description |
The dollar amounts reported represent the amount of revenue reflected in our audited financial statements for the applicable fiscal year. To account for the separation of Sandisk in 2025, revenue for 2025, 2024 and 2023 are reflected on a continuing operations basis with the revenue attributable to Sandisk reported in discontinued operations. Revenue in 2022 includes Sandisk, as separate results for Sandisk are not available for that year.
|
|
|
|
|
| Measure:: 2 |
|
|
|
|
|
| Pay vs Performance Disclosure |
|
|
|
|
|
| Name |
Non-GAAP EPS
|
|
|
|
|
| Measure:: 3 |
|
|
|
|
|
| Pay vs Performance Disclosure |
|
|
|
|
|
| Name |
Non-GAAP Operating Income
|
|
|
|
|
| Tan [Member] |
|
|
|
|
|
| Pay vs Performance Disclosure |
|
|
|
|
|
| PEO Total Compensation Amount |
$ 17,168,701
|
$ 11,165,296
|
|
|
|
| PEO Actually Paid Compensation Amount |
257,464,053
|
15,144,985
|
|
|
|
| Goeckeler [Member] |
|
|
|
|
|
| Pay vs Performance Disclosure |
|
|
|
|
|
| PEO Total Compensation Amount |
|
24,931,456
|
$ 17,690,772
|
$ 11,031,692
|
$ 32,137,338
|
| PEO Actually Paid Compensation Amount |
|
$ 42,539,122
|
$ 55,036,294
|
$ (3,260,510)
|
$ (9,097,124)
|
| PEO | Tan [Member] | (Deduct): Stock Awards And Option Awards Totals As Included In The Summary Compensation Table Total For The Covered Fiscal Year [Member] |
|
|
|
|
|
| Pay vs Performance Disclosure |
|
|
|
|
|
| Adjustment to Compensation, Amount |
(12,623,995)
|
|
|
|
|
| PEO | Tan [Member] | Add: Fair Value At Year End Of Awards Granted During The Covered Fiscal Year That Were Outstanding And Unvested At The Covered Fiscal Year End [Member] |
|
|
|
|
|
| Pay vs Performance Disclosure |
|
|
|
|
|
| Adjustment to Compensation, Amount |
83,943,968
|
|
|
|
|
| PEO | Tan [Member] | Add/(Deduct): Change As Of The Vesting Date (From The End Of The Prior Fiscal Year) In Fair Value Of Awards Granted In Any Prior Fiscal Year For Which Vesting Conditions Were Satisfied [Member] |
|
|
|
|
|
| Pay vs Performance Disclosure |
|
|
|
|
|
| Adjustment to Compensation, Amount |
33,212,088
|
|
|
|
|
| PEO | Tan [Member] | Add/(Deduct): Change As Of The Last Day Of The Covered Fiscal Year (From The End Of The Prior Fiscal Year) In Fair Value Of Awards Granted In Any Prior Fiscal Year That Were Outstanding And Unvested [Member] |
|
|
|
|
|
| Pay vs Performance Disclosure |
|
|
|
|
|
| Adjustment to Compensation, Amount |
134,866,395
|
|
|
|
|
| PEO | Tan [Member] | (Deduct): For Awards Granted In Any Prior Fiscal Year That Failed To Meet The Applicable Vesting Conditions During The Covered Fiscal Year, The Fair Values As Of The Last Day Of The Prior Fiscal Year [Member] |
|
|
|
|
|
| Pay vs Performance Disclosure |
|
|
|
|
|
| Adjustment to Compensation, Amount |
0
|
|
|
|
|
| PEO | Tan [Member] | Add: Fair Value As Of The Vesting Date For Awards Granted And Vested During The Covered Fiscal Year [Member] |
|
|
|
|
|
| Pay vs Performance Disclosure |
|
|
|
|
|
| Adjustment to Compensation, Amount |
0
|
|
|
|
|
| PEO | Tan [Member] | Add: Value of Dividends or Other Earnings Paid on Equity Awards Not Otherwise Reflected in Total Compensation [Member] |
|
|
|
|
|
| Pay vs Performance Disclosure |
|
|
|
|
|
| Adjustment to Compensation, Amount |
896,896
|
|
|
|
|
| Non-PEO NEO | (Deduct): Stock Awards And Option Awards Totals As Included In The Summary Compensation Table Total For The Covered Fiscal Year [Member] |
|
|
|
|
|
| Pay vs Performance Disclosure |
|
|
|
|
|
| Adjustment to Compensation, Amount |
(2,893,983)
|
|
|
|
|
| Non-PEO NEO | Add: Fair Value At Year End Of Awards Granted During The Covered Fiscal Year That Were Outstanding And Unvested At The Covered Fiscal Year End [Member] |
|
|
|
|
|
| Pay vs Performance Disclosure |
|
|
|
|
|
| Adjustment to Compensation, Amount |
22,347,991
|
|
|
|
|
| Non-PEO NEO | Add/(Deduct): Change As Of The Vesting Date (From The End Of The Prior Fiscal Year) In Fair Value Of Awards Granted In Any Prior Fiscal Year For Which Vesting Conditions Were Satisfied [Member] |
|
|
|
|
|
| Pay vs Performance Disclosure |
|
|
|
|
|
| Adjustment to Compensation, Amount |
14,725,065
|
|
|
|
|
| Non-PEO NEO | Add/(Deduct): Change As Of The Last Day Of The Covered Fiscal Year (From The End Of The Prior Fiscal Year) In Fair Value Of Awards Granted In Any Prior Fiscal Year That Were Outstanding And Unvested [Member] |
|
|
|
|
|
| Pay vs Performance Disclosure |
|
|
|
|
|
| Adjustment to Compensation, Amount |
41,058,403
|
|
|
|
|
| Non-PEO NEO | (Deduct): For Awards Granted In Any Prior Fiscal Year That Failed To Meet The Applicable Vesting Conditions During The Covered Fiscal Year, The Fair Values As Of The Last Day Of The Prior Fiscal Year [Member] |
|
|
|
|
|
| Pay vs Performance Disclosure |
|
|
|
|
|
| Adjustment to Compensation, Amount |
0
|
|
|
|
|
| Non-PEO NEO | Add: Fair Value As Of The Vesting Date For Awards Granted And Vested During The Covered Fiscal Year [Member] |
|
|
|
|
|
| Pay vs Performance Disclosure |
|
|
|
|
|
| Adjustment to Compensation, Amount |
0
|
|
|
|
|
| Non-PEO NEO | Add: Value of Dividends or Other Earnings Paid on Equity Awards Not Otherwise Reflected in Total Compensation [Member] |
|
|
|
|
|
| Pay vs Performance Disclosure |
|
|
|
|
|
| Adjustment to Compensation, Amount |
$ 298,611
|
|
|
|
|