Shareholder Report
Jul. 31, 2026
USD ($)
$ / shares
WHAT WERE THE FUND COSTS FOR THE PAST YEAR? (based on a hypothetical $10,000 investment)
|
Class Name
|
Costs of a $10,000 investment
|
Costs paid as a percentage of a $10,000 investment
|
|
Class I
|
$58
|
0.52%
|
HOW DID THE FUND PERFORM LAST YEAR AND WHAT AFFECTED ITS PERFORMANCE?
For the 12-month period ended July 31, 2026, the Market Leaders Value Fund outperformed its primary benchmark returning 22.67% (NAV) versus 18.94% for the Russell 1000® Index. Versus its secondary benchmark, the Market Leaders Value Fund underperformed the benchmark returning 22.67% (NAV) versus 31.19% for the Russell 1000® Value Index.
WHAT FACTORS INFLUENCED PERFORMANCE
RUSSELL 1000 INDEX COMPARISON
When looking at the contributions to performance, we first address how the investment process performed in the marketplace, and then examine the returns from different Global Industry Classification Standard* (“GICS”) sectors and specific stocks that contributed to performance. We evaluate the impact of our decision to start with an equal-weighted universe, as opposed to the market capitalization-weighted index, by measuring the difference in performance between the benchmark, and the benchmark as if it were an equal-weighted portfolio. In the period, having lower in market cap exposure hurt the strategy by -1.99%. We measure the impact of our focus on the top decile of stocks by Shareholder Yield, which contributed +9.31%. From the top decile of Shareholder Yield, we eliminate low quality stocks. Doing so had a negative impact of -1.67% to relative returns. Our portfolio construction methodology, which seeks to own more of stocks qualifying more frequently, recently,and with the highest overall factor profile had a negative impact of -1.92%.
From a sector standpoint, our overweight to Energy and Materials and underweight to Utilities aided returns, while our overweight to Financials and Consumer Discretionary and underweight to Information Technology detracted from performance. Overall, sector allocation decisions hurt returns. Selection within sectors contributed and was a significant driver of performance. Selection within Consumer Discretionary and Financials was the largest contributor while selection within Health Care and Communication Services detracted. Key single name contributors for the period include General Motors Co. and the screening of Microsoft Corp. and Meta Platforms, Inc. Overweights to Comcast Corp. and Fidelity National Information Services detracted. The largest detractor from performance within the period was the screening of Apple, Inc. and Alphabet, Inc., which had over 49% returns in the period.
RUSSELL 1000 VALUE INDEX COMPARISON
When looking at the contributions to performance, we first address how the investment process performed in the marketplace, and then examine the returns from different GICS sectors and specific stocks that contributed to performance. We evaluate the impact of our decision to start with an equal-weighted universe, as opposed to the market capitalization-weighted index, by measuring the difference in performance between the benchmark, and the benchmark as if it were an equal-weighted portfolio. In the period, having lower in market cap exposure hurt the strategy by -8.86%. We measure the impact of our focus on the top decile of stocks by Shareholder Yield, which contributed +5.37%. From the top decile of Shareholder Yield, we eliminate low quality stocks. Doing so had a negative impact of -2.35% to relative returns. Our portfolio construction methodology, which seeks to own more of stocks qualifying more frequently, recently, and with the highest overall factor profile had a negative impact of -2.67%.
From a sector standpoint, our underweight to Utilities and Real Estate aided returns, while our underweight to Information Technology and overweight to Consumer Discretionary detracted from performance. Overall, sector allocation decisions hurt returns. Selection within sectors also detracted and was a significant driver of underperformance. Selection within Consumer Discretionary and Financials was the largest contributors while selection within Information Technology and Communication Services detracted. Key single name contributors for the period include General Motors Co., Valero Energy Corp., and Expedia Group, Inc. Overweights to Comcast Corp., Fidelity National Information Services, and Paypal Holdings, Inc. detracted as did the exclusion of Micron Technology, Inc.
* The Global Industry Classification Standard (“GICS”) was developed by and/or is the exclusive property of MSCI, Inc. (“MSCI”) and Standard & Poor’s Financial Services LLC (“S&P”). GICS is a service mark of MSCI and S&P and has been licensed for use by U.S. Bank Global Fund Services.
POSITIONING
The Market Leaders Value Fund continues to key in on names with high-ranking Shareholder Yields. Stocks deliver returns to shareholders over time based on three drivers—ability to grow their business, expansion of their price multiple, and prudent capital allocation practices like returning capital to shareholders. We view share buybacks as one of many levers that management teams can use to allocate capital. Within Shareholder Yield, buybacks sit side-by-side with dividend yield, another mechanism for the return of capital. We acknowledge that all companies executing buybacks are not created equally, and some firms should likely not be returning cash. We believe these firms will likely go on to underperform, and our process is designed to exclude such stocks from our portfolio. We focus on a subset of firms returning capital to shareholders at super-normal rates, as this tends to be indicative of management’s conviction in the underlying business. Our quality screens further attempt to exclude firms executing buybacks for the wrong reasons—performing debt for equity swaps and manipulating earnings per share. Because of our bias towards names with high Shareholder Yield and lower valuations, we utilize our secondary benchmark, the Russell 1000 Value, to measure our active positioning. These characteristics tend to differ meaningfully for the Russell 1000 Value versus the broad-based Russell 1000 and we believe the value index represents a comparison more closely aligned with the Fund’s process.
As of July 31st, 2026, the Fund’s holdings showed a significantly higher Shareholder Yield than the benchmark. Our Fund returned over 2.2 times more capital to shareholders than the benchmark while maintaining a discounted Price to Earnings and Price to Sales ratio, 25% and 48% respectively. Additionally, our holdings have over 1.1 times free cash flow yield. Our Fund chooses holdings with disciplined management teams that have been returning capital to shareholders at super-normal rates.
Our research leads us to believe that market leadership is cyclical, but that valuation, quality, momentum, and yield are incredibly effective individual selection factors given a three- to five-year time horizon. We believe that maintaining a portfolio of stocks trading at discounted valuations that possess reasonable quality, decent momentum, and high shareholder yields is a compelling long-term investment strategy with a considerably higher probability of success than trying to generate outperformance through market timing or traditional stock picking.
|
Top Contributors
|
|
|
↑
|
MICROSOFT CORP.
|
|
↑
|
GENERAL MOTORS CO.
|
|
↑
|
META PLATFORMS, INC.
|
|
↑
|
VALERO ENERGY CORP.
|
|
↑
|
TAPESTRY, INC.
|
|
Top Detractors
|
|
|
↓
|
APPLE, INC.
|
|
↓
|
ALPHABET, INC.
|
|
↓
|
MICRON TECHNOLOGY, INC.
|
|
↓
|
COMCAST CORP.
|
|
↓
|
FIDELITY NATIONAL INFORMATION SERVICES, INC.
|
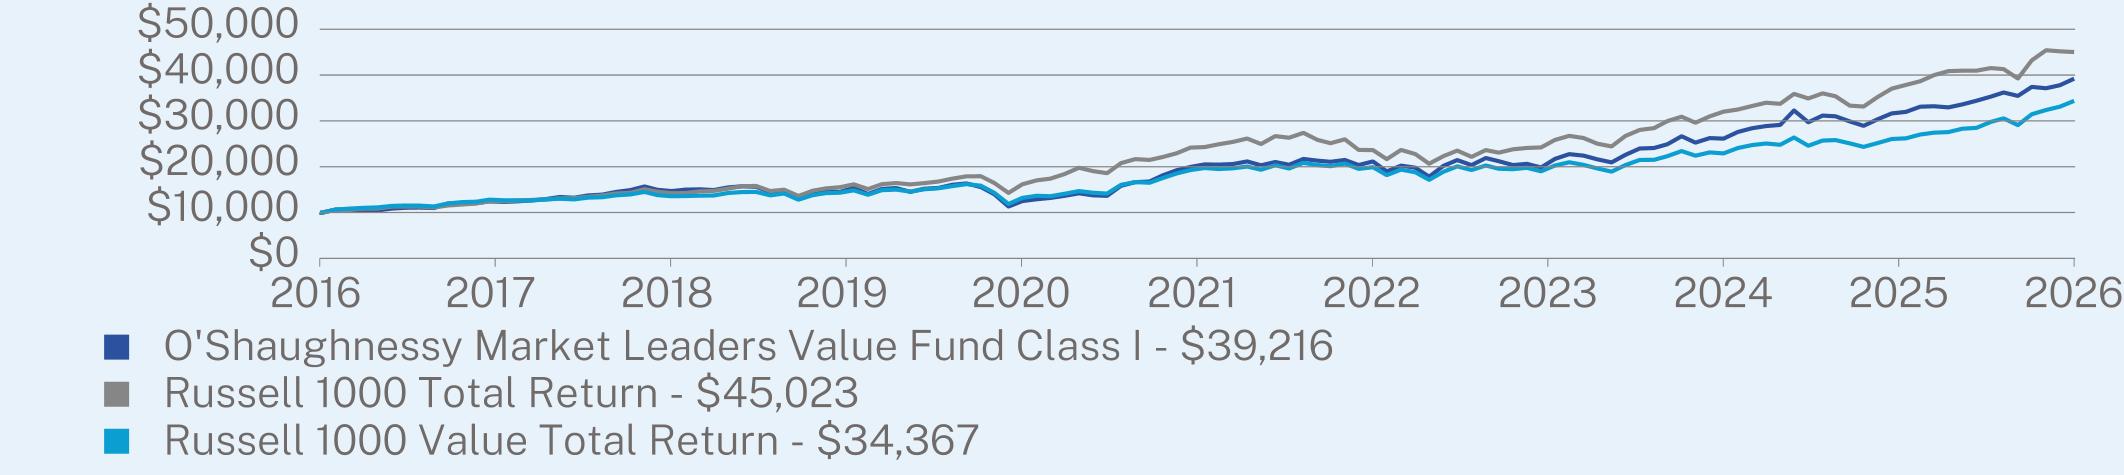
ANNUAL AVERAGE TOTAL RETURN (%)
|
|
1 Year
|
5 Year
|
10 Year
|
|
Class I
|
22.67
|
13.76
|
13.69
|
|
Russell 1000 Total Return
|
18.94
|
12.12
|
14.82
|
|
Russell 1000 Value Total Return
|
31.19
|
11.83
|
11.62
|
Visit https://osfunds.com/ for more recent performance information.
KEY FUND STATISTICS (as of July 31, 2026)
|
Net Assets
|
$287,372,577
|
|
Number of Holdings
|
69
|
|
Net Advisory Fee
|
$1,064,626
|
|
Portfolio Turnover
|
62%
|
WHAT DID THE FUND INVEST IN? (as of July 31, 2026)
|
Top 10 Issuers
|
(% of net assets)
|
|
|
General Motors Co.
|
4.5
|
%
|
|
Altria Group, Inc.
|
4.5
|
%
|
|
Synchrony Financial
|
4.2
|
%
|
|
HCA Holdings, Inc.
|
3.6
|
%
|
|
DR Horton, Inc.
|
3.6
|
%
|
|
Kraft Heinz Co.
|
3.3
|
%
|
|
M&T Bank Corp.
|
3.2
|
%
|
|
MetLife, Inc.
|
3.1
|
%
|
|
Comcast Corp.
|
2.8
|
%
|
|
Tapestry, Inc.
|
2.6
|
%
|
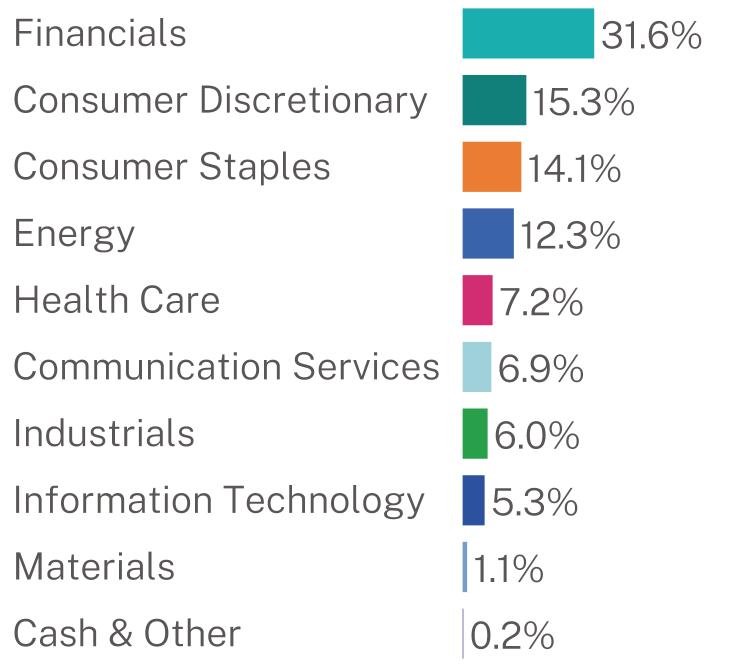
Sector Breakdown (% of net assets)