Shareholder Report
|
12 Months Ended |
|
Jul. 31, 2026
USD ($)
Holding
|
|---|
| Shareholder Report [Line Items] |
|
|
| Document Type |
N-CSR
|
|
| Amendment Flag |
false
|
|
| Registrant Name |
LORD ABBETT TRUST I
|
|
| Entity Central Index Key |
0001139819
|
|
| Entity Investment Company Type |
N-1A
|
|
| Document Period End Date |
Jul. 31, 2026
|
|
| Shareholder Report Annual or Semi-Annual |
Annual Shareholder Report
|
|
| C000249038 |
|
|
| Shareholder Report [Line Items] |
|
|
| Fund Name |
Lord Abbett Diversification Shares: Core Completion Fund
|
|
| Trading Symbol |
LCCDX
|
|
| Annual or Semi-Annual Statement [Text Block] |
This annual shareholder report contains important information about the Lord Abbett Diversification Shares: Core Completion Fund for the period of March 30, 2026 to July 31, 2026 (the "reporting period").
|
|
| Additional Information [Text Block] |
You can find additional information about the Fund at lordabbett.com/SMADocuments. You can also request this information by contacting us at 888-522-2388.
|
|
| Additional Information Phone Number |
888-522-2388
|
|
| Additional Information Website |
<span style="box-sizing: border-box; color: rgb(0, 0, 0); display: inline; flex-wrap: nowrap; font-size: 13.3333px; font-weight: 400; grid-area: auto; line-height: 20px; margin: 0px; overflow: visible; text-align: left; text-align-last: auto; white-space-collapse: preserve-breaks;">lordabbett.com/SMADocuments</span>
|
|
| Expenses [Text Block] |
What were the Fund costs for the reporting period?(based on a hypothetical $10,000 investment) Table SummaryFund Name | Costs of a $10,000 investment | Costs paid as a percentage of a $10,000 investment |
|---|
Lord Abbett Diversification Shares: Core Completion Fund | $0Footnote Reference(a) | 0.00%Footnote Reference(b) |
|---|
| Footnote | Description | Footnote(a) | Expenses for a full reporting period would be higher. | Footnote(b) | Annualized. |
|
|
| Expenses Paid, Amount |
$ 0
|
[1] |
| Expense Ratio, Percent |
0.00%
|
[2] |
| Expenses Short Period Footnote [Text Block] |
Expenses for a full reporting period would be higher.
|
|
| AssetsNet |
$ 9,919,049
|
|
| Holdings Count | Holding |
110
|
|
| Advisory Fees Paid, Amount |
$ 0
|
|
| InvestmentCompanyPortfolioTurnover |
104.00%
|
|
| Additional Fund Statistics [Text Block] |
Table SummaryTotal Net Assets | $9,919,049 |
|---|
# of Portfolio Holdings | 110 |
|---|
Portfolio Turnover Rate | 104% |
|---|
Total Advisory Fees Paid | $0 |
|---|
|
|
| Holdings [Text Block] |
Table SummaryPortfolio Holdings Presented by Portfolio Allocation | %Footnote Reference* |
|---|
Asset-Backed Securities | 31.62% | Corporate Bonds | 2.04% | Foreign Government Obligations | 5.90% | Government Sponsored Enterprises Collateralized Mortgage Obligations | 7.34% | Government Sponsored Enterprises Pass-Throughs | 14.96% | Non-Agency Commercial Mortgage-Backed Securities | 35.70% | U.S. Treasury Obligations | 1.05% | Repurchase Agreements | 1.39% | Total | 100.00% | | Footnote | Description | Footnote* | Represents percent of total investments, which excludes derivatives. |
|
|
| Material Fund Change [Text Block] |
There were no material changes to the Fund during the reporting period. |
|
| Summary of Change Legend [Text Block] |
There were no material changes to the Fund during the reporting period.
|
|
| C000249039 |
|
|
| Shareholder Report [Line Items] |
|
|
| Fund Name |
Lord Abbett Diversification Shares: Core Plus Completion Fund
|
|
| Trading Symbol |
LACPX
|
|
| Annual or Semi-Annual Statement [Text Block] |
This annual shareholder report contains important information about the Lord Abbett Diversification Shares: Core Plus Completion Fund for the period of March 30, 2026 to July 31, 2026 (the "reporting period").
|
|
| Additional Information [Text Block] |
You can find additional information about the Fund at lordabbett.com/SMADocuments. You can also request this information by contacting us at 888-522-2388.
|
|
| Additional Information Phone Number |
888-522-2388
|
|
| Additional Information Website |
<span style="box-sizing: border-box; color: rgb(0, 0, 0); display: inline; flex-wrap: nowrap; font-size: 13.3333px; font-weight: 400; grid-area: auto; line-height: 20px; margin: 0px; overflow: visible; text-align: left; text-align-last: auto; white-space-collapse: preserve-breaks;">lordabbett.com/SMADocuments</span>
|
|
| Expenses [Text Block] |
What were the Fund costs for the reporting period?(based on a hypothetical $10,000 investment) Table SummaryFund Name | Costs of a $10,000 investment | Costs paid as a percentage of a $10,000 investment |
|---|
Lord Abbett Diversification Shares: Core Plus Completion Fund | $0Footnote Reference(a) | 0.00%Footnote Reference(b) |
|---|
| Footnote | Description | Footnote(a) | Expenses for a full reporting period would be higher. | Footnote(b) | Annualized. |
|
|
| Expenses Paid, Amount |
$ 0
|
[3] |
| Expense Ratio, Percent |
0.00%
|
[4] |
| Expenses Short Period Footnote [Text Block] |
Expenses for a full reporting period would be higher.
|
|
| AssetsNet |
$ 9,964,316
|
|
| Holdings Count | Holding |
178
|
|
| Advisory Fees Paid, Amount |
$ 0
|
|
| InvestmentCompanyPortfolioTurnover |
124.00%
|
|
| Additional Fund Statistics [Text Block] |
Table SummaryTotal Net Assets | $9,964,316 |
|---|
# of Portfolio Holdings | 178 |
|---|
Portfolio Turnover Rate | 124% |
|---|
Total Advisory Fees Paid | $0 |
|---|
|
|
| Holdings [Text Block] |
Table SummaryPortfolio Holdings Presented by Portfolio Allocation | %Footnote Reference* |
|---|
Asset-Backed Securities | 13.37% | Corporate Bonds | 32.57% | Foreign Government Obligations | 8.37% | Government Sponsored Enterprises Collateralized Mortgage Obligations | 0.89% | Government Sponsored Enterprises Pass-Throughs | 17.15% | Non-Agency Commercial Mortgage-Backed Securities | 24.44% | U.S. Treasury Obligations | 1.69% | Repurchase Agreements | 1.52% | Total | 100.00% | | Footnote | Description | Footnote* | Represents percent of total investments, which excludes derivatives. |
|
|
| Material Fund Change [Text Block] |
There were no material changes to the Fund during the reporting period. |
|
| Summary of Change Legend [Text Block] |
There were no material changes to the Fund during the reporting period.
|
|
| C000231078 |
|
|
| Shareholder Report [Line Items] |
|
|
| Fund Name |
Lord Abbett Emerging Markets Equity Fund
|
|
| Class Name |
Class A
|
|
| Trading Symbol |
EAMAX
|
|
| Annual or Semi-Annual Statement [Text Block] |
This annual shareholder report contains important information about the Lord Abbett Emerging Markets Equity Fund for the period of August 1, 2025 to July 31, 2026 (the "reporting period").
|
|
| Additional Information [Text Block] |
You can find additional information about the Fund at lordabbett.com/FundDocuments. You can also request this information by contacting us at 888-522-2388.
|
|
| Additional Information Phone Number |
888-522-2388
|
|
| Additional Information Website |
<span style="box-sizing: border-box; color: rgb(0, 0, 0); display: inline; flex-wrap: nowrap; font-size: 13.3333px; font-weight: 400; grid-area: auto; line-height: 20px; margin: 0px; overflow: visible; text-align: left; text-align-last: auto; white-space-collapse: preserve-breaks;">lordabbett.com/FundDocuments</span>
|
|
| Expenses [Text Block] |
What were the Fund costs for the reporting period?(based on a hypothetical $10,000 investment) Table SummaryClass Name | Costs of a $10,000 investment | Costs paid as a percentage of a $10,000 investment |
|---|
Class A | $138 | 1.15% |
|---|
|
|
| Expenses Paid, Amount |
$ 138
|
|
| Expense Ratio, Percent |
1.15%
|
|
| Factors Affecting Performance [Text Block] |
How did the Fund perform last year and what affected its performance?For the fiscal year ended July 31, 2026, the Fund returned 40.20%, reflecting performance at the net asset value (NAV) of Class A shares, with all distributions reinvested, compared to the 36.44% return of a securities market index with investment characteristics similar to those of the Fund, the MSCI Emerging Markets Index (Net). The Fund's broad-based securities market index, the MSCI EAFE Net Index, returned 24.33% over the same period. Markets navigated a resilient economic backdrop amid geopolitical and inflation uncertainty. Healthy consumer spending, labor markets, and corporate earnings supported the outlook, while artificial intelligence ("AI") disruption concerns and U.S.-Iran tensions drove volatility and higher energy prices. A June ceasefire stabilized oil markets, though geopolitical tensions continued to influence Treasury yields. Meanwhile, Kevin Warsh became Fed Chair, and the Fed held rates unchanged in July amid resilient economic data. Top contributors to performance: Security selection within the Information Technology sector contributed to relative performance over the period, driven by an allocation to SK Hynix, a manufacturer of memory chips. Security selection within the Financials sector also contributed to relative performance, driven by an allocation to OTP Bank, a financial services company. Top detractors from performance: Security selection within the Consumer Discretionary sector detracted from relative performance over the period, driven by an allocation to Sea Limited, an e-commerce company. Security selection within the Communication Services sector also detracted from relative performance, driven by an allocation to Bharti Airtel, a telecommunications company. |
|
| Performance Past Does Not Indicate Future [Text] |
The Fund's past performance is no guarantee of future results.
|
|
| Line Graph [Table Text Block] |
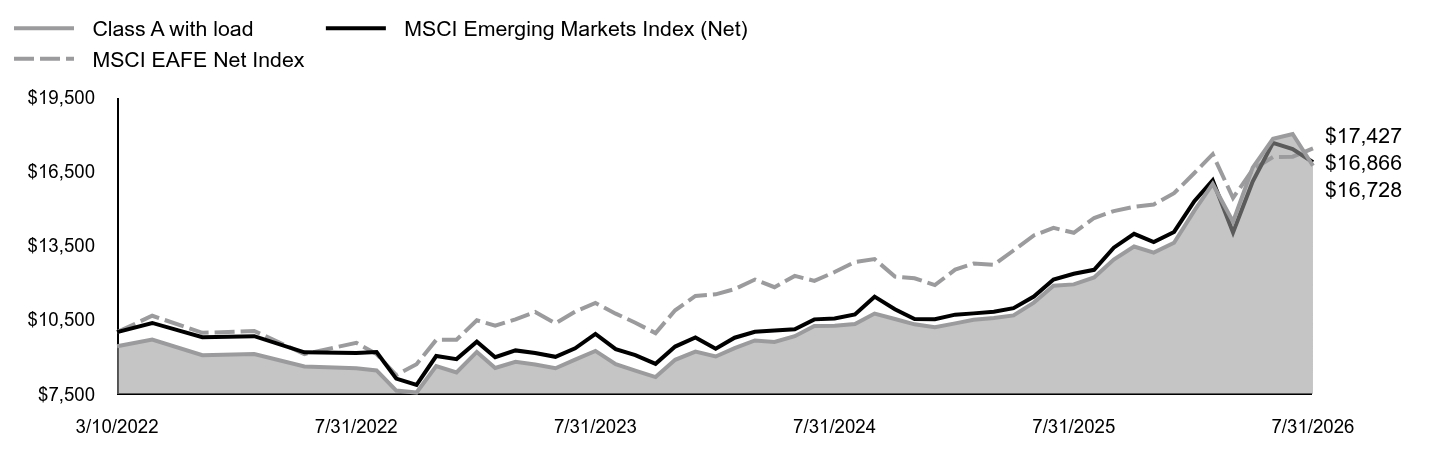 Table Summary | Class A with load | MSCI Emerging Markets Index (Net) | MSCI EAFE Net Index |
|---|
3/10/2022 | $9,427 | $10,000 | $10,000 |
|---|
3/31/2022 | $9,704 | $10,372 | $10,663 |
|---|
4/30/2022 | $9,069 | $9,795 | $9,973 |
|---|
5/31/2022 | $9,119 | $9,838 | $10,047 |
|---|
6/30/2022 | $8,609 | $9,184 | $9,115 |
|---|
7/31/2022 | $8,540 | $9,162 | $9,569 |
|---|
8/31/2022 | $8,452 | $9,200 | $9,115 |
|---|
9/30/2022 | $7,640 | $8,121 | $8,262 |
|---|
10/31/2022 | $7,558 | $7,869 | $8,707 |
|---|
11/30/2022 | $8,628 | $9,036 | $9,687 |
|---|
12/31/2022 | $8,369 | $8,909 | $9,695 |
|---|
1/31/2023 | $9,202 | $9,613 | $10,480 |
|---|
2/28/2023 | $8,555 | $8,989 | $10,261 |
|---|
3/31/2023 | $8,805 | $9,262 | $10,516 |
|---|
4/30/2023 | $8,689 | $9,157 | $10,813 |
|---|
5/31/2023 | $8,542 | $9,003 | $10,355 |
|---|
6/30/2023 | $8,888 | $9,345 | $10,826 |
|---|
7/31/2023 | $9,241 | $9,926 | $11,177 |
|---|
8/31/2023 | $8,702 | $9,315 | $10,748 |
|---|
9/30/2023 | $8,446 | $9,071 | $10,381 |
|---|
10/31/2023 | $8,183 | $8,719 | $9,960 |
|---|
11/30/2023 | $8,882 | $9,417 | $10,885 |
|---|
12/31/2023 | $9,211 | $9,785 | $11,463 |
|---|
1/31/2024 | $9,016 | $9,331 | $11,529 |
|---|
2/29/2024 | $9,354 | $9,775 | $11,740 |
|---|
3/31/2024 | $9,666 | $10,017 | $12,126 |
|---|
4/30/2024 | $9,601 | $10,062 | $11,816 |
|---|
5/31/2024 | $9,836 | $10,118 | $12,273 |
|---|
6/30/2024 | $10,245 | $10,517 | $12,075 |
|---|
7/31/2024 | $10,258 | $10,549 | $12,430 |
|---|
8/31/2024 | $10,330 | $10,719 | $12,834 |
|---|
9/30/2024 | $10,753 | $11,435 | $12,952 |
|---|
10/31/2024 | $10,532 | $10,926 | $12,248 |
|---|
11/30/2024 | $10,317 | $10,534 | $12,178 |
|---|
12/31/2024 | $10,202 | $10,519 | $11,901 |
|---|
1/31/2025 | $10,354 | $10,707 | $12,527 |
|---|
2/28/2025 | $10,498 | $10,759 | $12,770 |
|---|
3/31/2025 | $10,571 | $10,827 | $12,718 |
|---|
4/30/2025 | $10,676 | $10,969 | $13,301 |
|---|
5/31/2025 | $11,195 | $11,437 | $13,909 |
|---|
6/30/2025 | $11,879 | $12,125 | $14,216 |
|---|
7/31/2025 | $11,931 | $12,361 | $14,016 |
|---|
8/31/2025 | $12,214 | $12,520 | $14,614 |
|---|
9/30/2025 | $12,937 | $13,416 | $14,894 |
|---|
10/31/2025 | $13,463 | $13,976 | $15,069 |
|---|
11/30/2025 | $13,213 | $13,642 | $15,162 |
|---|
12/31/2025 | $13,614 | $14,050 | $15,617 |
|---|
1/31/2026 | $14,915 | $15,294 | $16,432 |
|---|
2/28/2026 | $15,991 | $16,134 | $17,192 |
|---|
3/31/2026 | $14,464 | $14,027 | $15,423 |
|---|
4/30/2026 | $16,649 | $16,090 | $16,572 |
|---|
5/31/2026 | $17,817 | $17,649 | $17,081 |
|---|
6/30/2026 | $18,010 | $17,400 | $17,092 |
|---|
7/31/2026 | $16,728 | $16,866 | $17,427 |
|---|
|
|
| Average Annual Return [Table Text Block] |
Table SummaryAATR | 1 Year | Since Inception
3/10/22 |
|---|
Class A at NAV | 40.20% | 13.95% |
|---|
Class A with sales charge | 32.12% | 12.43% |
|---|
MSCI Emerging Markets Index (Net) | 36.44% | 12.64% |
|---|
MSCI EAFE Net Index | 24.33% | 13.48% |
|---|
|
|
| Performance Inception Date |
Mar. 10, 2022
|
|
| No Deduction of Taxes [Text Block] |
The returns do not reflect the deduction of taxes that a shareholder would pay on Fund distributions or redemption of Fund shares.
|
|
| AssetsNet |
$ 18,529,029
|
|
| Holdings Count | Holding |
92
|
|
| Advisory Fees Paid, Amount |
$ 0
|
|
| InvestmentCompanyPortfolioTurnover |
75.00%
|
|
| Additional Fund Statistics [Text Block] |
Table SummaryTotal Net Assets | $18,529,029 |
|---|
# of Portfolio Holdings | 92 |
|---|
Portfolio Turnover Rate | 75% |
|---|
Total Advisory Fees Paid | $0 |
|---|
|
|
| Holdings [Text Block] |
Table SummaryPortfolio Holdings Presented by SectorFootnote Reference* | % Footnote Reference** |
|---|
Communication Services | 7.54% | Consumer Discretionary | 8.59% | Consumer Staples | 3.59% | Energy | 2.10% | Financials | 22.01% | Health Care | 2.75% | Industrials | 8.48% | Information Technology | 38.63% | Materials | 3.53% | Real Estate | 0.55% | Utilities | 0.69% | Repurchase Agreements | 1.54% | Total | 100.00% | | Footnote | Description | Footnote* | A sector may comprise several industries. | Footnote** | Represents percent of total investments, which excludes derivatives. |
|
|
| Material Fund Change [Text Block] |
There were no material changes to the Fund during the reporting period. |
|
| Summary of Change Legend [Text Block] |
There were no material changes to the Fund during the reporting period.
|
|
| C000231082 |
|
|
| Shareholder Report [Line Items] |
|
|
| Fund Name |
Lord Abbett Emerging Markets Equity Fund
|
|
| Class Name |
Class C
|
|
| Trading Symbol |
ELMCX
|
|
| Annual or Semi-Annual Statement [Text Block] |
This annual shareholder report contains important information about the Lord Abbett Emerging Markets Equity Fund for the period of August 1, 2025 to July 31, 2026 (the "reporting period").
|
|
| Additional Information [Text Block] |
You can find additional information about the Fund at lordabbett.com/FundDocuments. You can also request this information by contacting us at 888-522-2388.
|
|
| Additional Information Phone Number |
888-522-2388
|
|
| Additional Information Website |
<span style="box-sizing: border-box; color: rgb(0, 0, 0); display: inline; flex-wrap: nowrap; font-size: 13.3333px; font-weight: 400; grid-area: auto; line-height: 20px; margin: 0px; overflow: visible; text-align: left; text-align-last: auto; white-space-collapse: preserve-breaks;">lordabbett.com/FundDocuments</span>
|
|
| Expenses [Text Block] |
What were the Fund costs for the reporting period?(based on a hypothetical $10,000 investment) Table SummaryClass Name | Costs of a $10,000 investment | Costs paid as a percentage of a $10,000 investment |
|---|
Class C | $227 | 1.90% |
|---|
|
|
| Expenses Paid, Amount |
$ 227
|
|
| Expense Ratio, Percent |
1.90%
|
|
| Factors Affecting Performance [Text Block] |
How did the Fund perform last year and what affected its performance?For the fiscal year ended July 31, 2026, the Fund returned 39.14%, reflecting performance at the net asset value (NAV) of Class C shares, with all distributions reinvested, compared to the 36.44% return of a securities market index with investment characteristics similar to those of the Fund, the MSCI Emerging Markets Index (Net). The Fund's broad-based securities market index, the MSCI EAFE Net Index, returned 24.33% over the same period. Markets navigated a resilient economic backdrop amid geopolitical and inflation uncertainty. Healthy consumer spending, labor markets, and corporate earnings supported the outlook, while artificial intelligence ("AI") disruption concerns and U.S.-Iran tensions drove volatility and higher energy prices. A June ceasefire stabilized oil markets, though geopolitical tensions continued to influence Treasury yields. Meanwhile, Kevin Warsh became Fed Chair, and the Fed held rates unchanged in July amid resilient economic data. Top contributors to performance: Security selection within the Information Technology sector contributed to relative performance over the period, driven by an allocation to SK Hynix, a manufacturer of memory chips. Security selection within the Financials sector also contributed to relative performance, driven by an allocation to OTP Bank, a financial services company. Top detractors from performance: Security selection within the Consumer Discretionary sector detracted from relative performance over the period, driven by an allocation to Sea Limited, an e-commerce company. Security selection within the Communication Services sector also detracted from relative performance, driven by an allocation to Bharti Airtel, a telecommunications company. |
|
| Performance Past Does Not Indicate Future [Text] |
The Fund's past performance is no guarantee of future results.
|
|
| Line Graph [Table Text Block] |
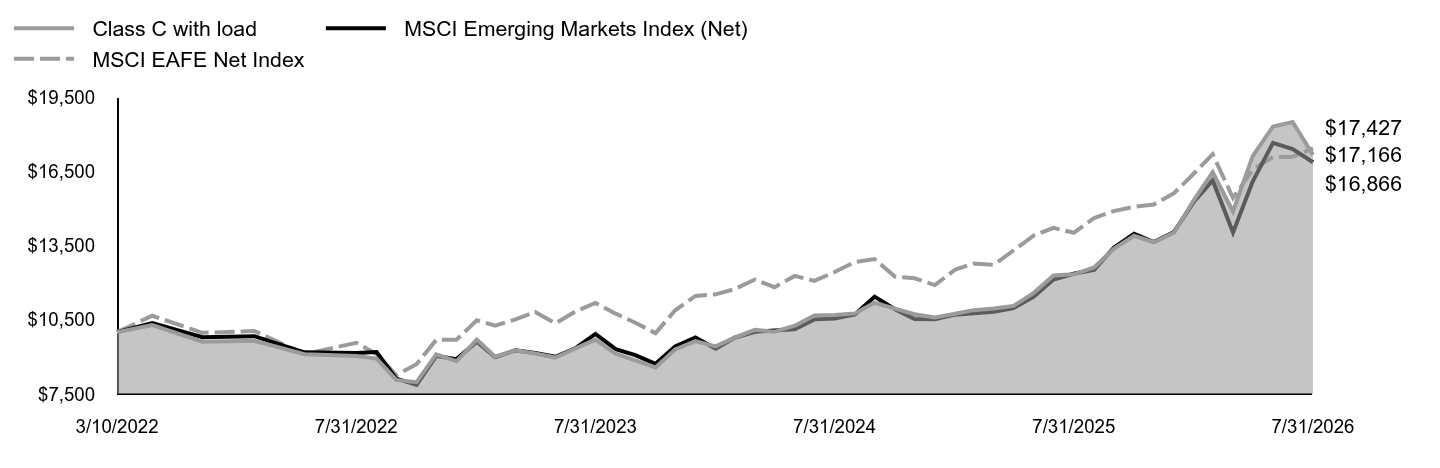 Table Summary | Class C with load | MSCI Emerging Markets Index (Net) | MSCI EAFE Net Index |
|---|
3/10/2022 | $10,000 | $10,000 | $10,000 |
|---|
3/31/2022 | $10,287 | $10,372 | $10,663 |
|---|
4/30/2022 | $9,613 | $9,795 | $9,973 |
|---|
5/31/2022 | $9,653 | $9,838 | $10,047 |
|---|
6/30/2022 | $9,105 | $9,184 | $9,115 |
|---|
7/31/2022 | $9,032 | $9,162 | $9,569 |
|---|
8/31/2022 | $8,932 | $9,200 | $9,115 |
|---|
9/30/2022 | $8,071 | $8,121 | $8,262 |
|---|
10/31/2022 | $7,977 | $7,869 | $8,707 |
|---|
11/30/2022 | $9,099 | $9,036 | $9,687 |
|---|
12/31/2022 | $8,823 | $8,909 | $9,695 |
|---|
1/31/2023 | $9,698 | $9,613 | $10,480 |
|---|
2/28/2023 | $9,006 | $8,989 | $10,261 |
|---|
3/31/2023 | $9,264 | $9,262 | $10,516 |
|---|
4/30/2023 | $9,135 | $9,157 | $10,813 |
|---|
5/31/2023 | $8,972 | $9,003 | $10,355 |
|---|
6/30/2023 | $9,339 | $9,345 | $10,826 |
|---|
7/31/2023 | $9,698 | $9,926 | $11,177 |
|---|
8/31/2023 | $9,128 | $9,315 | $10,748 |
|---|
9/30/2023 | $8,857 | $9,071 | $10,381 |
|---|
10/31/2023 | $8,572 | $8,719 | $9,960 |
|---|
11/30/2023 | $9,298 | $9,417 | $10,885 |
|---|
12/31/2023 | $9,637 | $9,785 | $11,463 |
|---|
1/31/2024 | $9,426 | $9,331 | $11,529 |
|---|
2/29/2024 | $9,781 | $9,775 | $11,740 |
|---|
3/31/2024 | $10,095 | $10,017 | $12,126 |
|---|
4/30/2024 | $10,020 | $10,062 | $11,816 |
|---|
5/31/2024 | $10,259 | $10,118 | $12,273 |
|---|
6/30/2024 | $10,676 | $10,517 | $12,075 |
|---|
7/31/2024 | $10,689 | $10,549 | $12,430 |
|---|
8/31/2024 | $10,758 | $10,719 | $12,834 |
|---|
9/30/2024 | $11,188 | $11,435 | $12,952 |
|---|
10/31/2024 | $10,949 | $10,926 | $12,248 |
|---|
11/30/2024 | $10,723 | $10,534 | $12,178 |
|---|
12/31/2024 | $10,595 | $10,519 | $11,901 |
|---|
1/31/2025 | $10,746 | $10,707 | $12,527 |
|---|
2/28/2025 | $10,890 | $10,759 | $12,770 |
|---|
3/31/2025 | $10,959 | $10,827 | $12,718 |
|---|
4/30/2025 | $11,061 | $10,969 | $13,301 |
|---|
5/31/2025 | $11,589 | $11,437 | $13,909 |
|---|
6/30/2025 | $12,289 | $12,125 | $14,216 |
|---|
7/31/2025 | $12,337 | $12,361 | $14,016 |
|---|
8/31/2025 | $12,618 | $12,520 | $14,614 |
|---|
9/30/2025 | $13,366 | $13,416 | $14,894 |
|---|
10/31/2025 | $13,894 | $13,976 | $15,069 |
|---|
11/30/2025 | $13,633 | $13,642 | $15,162 |
|---|
12/31/2025 | $14,027 | $14,050 | $15,617 |
|---|
1/31/2026 | $15,369 | $15,294 | $16,432 |
|---|
2/28/2026 | $16,464 | $16,134 | $17,192 |
|---|
3/31/2026 | $14,881 | $14,027 | $15,423 |
|---|
4/30/2026 | $17,118 | $16,090 | $16,572 |
|---|
5/31/2026 | $18,308 | $17,649 | $17,081 |
|---|
6/30/2026 | $18,494 | $17,400 | $17,092 |
|---|
7/31/2026 | $17,166 | $16,866 | $17,427 |
|---|
|
|
| Average Annual Return [Table Text Block] |
Table SummaryAATR | 1 Year | Since Inception
3/10/22 |
|---|
Class C at NAV | 39.14% | 13.09% |
|---|
Class C with sales charge | 38.14% | 13.09% |
|---|
MSCI Emerging Markets Index (Net) | 36.44% | 12.64% |
|---|
MSCI EAFE Net Index | 24.33% | 13.48% |
|---|
|
|
| Performance Inception Date |
Mar. 10, 2022
|
|
| No Deduction of Taxes [Text Block] |
The returns do not reflect the deduction of taxes that a shareholder would pay on Fund distributions or redemption of Fund shares.
|
|
| AssetsNet |
$ 18,529,029
|
|
| Holdings Count | Holding |
92
|
|
| Advisory Fees Paid, Amount |
$ 0
|
|
| InvestmentCompanyPortfolioTurnover |
75.00%
|
|
| Additional Fund Statistics [Text Block] |
Table SummaryTotal Net Assets | $18,529,029 |
|---|
# of Portfolio Holdings | 92 |
|---|
Portfolio Turnover Rate | 75% |
|---|
Total Advisory Fees Paid | $0 |
|---|
|
|
| Holdings [Text Block] |
Table SummaryPortfolio Holdings Presented by SectorFootnote Reference* | % Footnote Reference** |
|---|
Communication Services | 7.54% | Consumer Discretionary | 8.59% | Consumer Staples | 3.59% | Energy | 2.10% | Financials | 22.01% | Health Care | 2.75% | Industrials | 8.48% | Information Technology | 38.63% | Materials | 3.53% | Real Estate | 0.55% | Utilities | 0.69% | Repurchase Agreements | 1.54% | Total | 100.00% | | Footnote | Description | Footnote* | A sector may comprise several industries. | Footnote** | Represents percent of total investments, which excludes derivatives. |
|
|
| Material Fund Change [Text Block] |
There were no material changes to the Fund during the reporting period. |
|
| Summary of Change Legend [Text Block] |
There were no material changes to the Fund during the reporting period.
|
|
| C000231081 |
|
|
| Shareholder Report [Line Items] |
|
|
| Fund Name |
Lord Abbett Emerging Markets Equity Fund
|
|
| Class Name |
Class F
|
|
| Trading Symbol |
ELMFX
|
|
| Annual or Semi-Annual Statement [Text Block] |
This annual shareholder report contains important information about the Lord Abbett Emerging Markets Equity Fund for the period of August 1, 2025 to July 31, 2026 (the "reporting period").
|
|
| Additional Information [Text Block] |
You can find additional information about the Fund at lordabbett.com/FundDocuments. You can also request this information by contacting us at 888-522-2388.
|
|
| Additional Information Phone Number |
888-522-2388
|
|
| Additional Information Website |
<span style="box-sizing: border-box; color: rgb(0, 0, 0); display: inline; flex-wrap: nowrap; font-size: 13.3333px; font-weight: 400; grid-area: auto; line-height: 20px; margin: 0px; overflow: visible; text-align: left; text-align-last: auto; white-space-collapse: preserve-breaks;">lordabbett.com/FundDocuments</span>
|
|
| Expenses [Text Block] |
What were the Fund costs for the reporting period?(based on a hypothetical $10,000 investment) Table SummaryClass Name | Costs of a $10,000 investment | Costs paid as a percentage of a $10,000 investment |
|---|
Class F | $108 | 0.90% |
|---|
|
|
| Expenses Paid, Amount |
$ 108
|
|
| Expense Ratio, Percent |
0.90%
|
|
| Factors Affecting Performance [Text Block] |
How did the Fund perform last year and what affected its performance?For the fiscal year ended July 31, 2026, the Fund returned 40.55%, reflecting performance at the net asset value (NAV) of Class F shares, with all distributions reinvested, compared to the 36.44% return of a securities market index with investment characteristics similar to those of the Fund, the MSCI Emerging Markets Index (Net). The Fund's broad-based securities market index, the MSCI EAFE Net Index, returned 24.33% over the same period. Markets navigated a resilient economic backdrop amid geopolitical and inflation uncertainty. Healthy consumer spending, labor markets, and corporate earnings supported the outlook, while artificial intelligence ("AI") disruption concerns and U.S.-Iran tensions drove volatility and higher energy prices. A June ceasefire stabilized oil markets, though geopolitical tensions continued to influence Treasury yields. Meanwhile, Kevin Warsh became Fed Chair, and the Fed held rates unchanged in July amid resilient economic data. Top contributors to performance: Security selection within the Information Technology sector contributed to relative performance over the period, driven by an allocation to SK Hynix, a manufacturer of memory chips. Security selection within the Financials sector also contributed to relative performance, driven by an allocation to OTP Bank, a financial services company. Top detractors from performance: Security selection within the Consumer Discretionary sector detracted from relative performance over the period, driven by an allocation to Sea Limited, an e-commerce company. Security selection within the Communication Services sector also detracted from relative performance, driven by an allocation to Bharti Airtel, a telecommunications company. |
|
| Performance Past Does Not Indicate Future [Text] |
The Fund's past performance is no guarantee of future results.
|
|
| Line Graph [Table Text Block] |
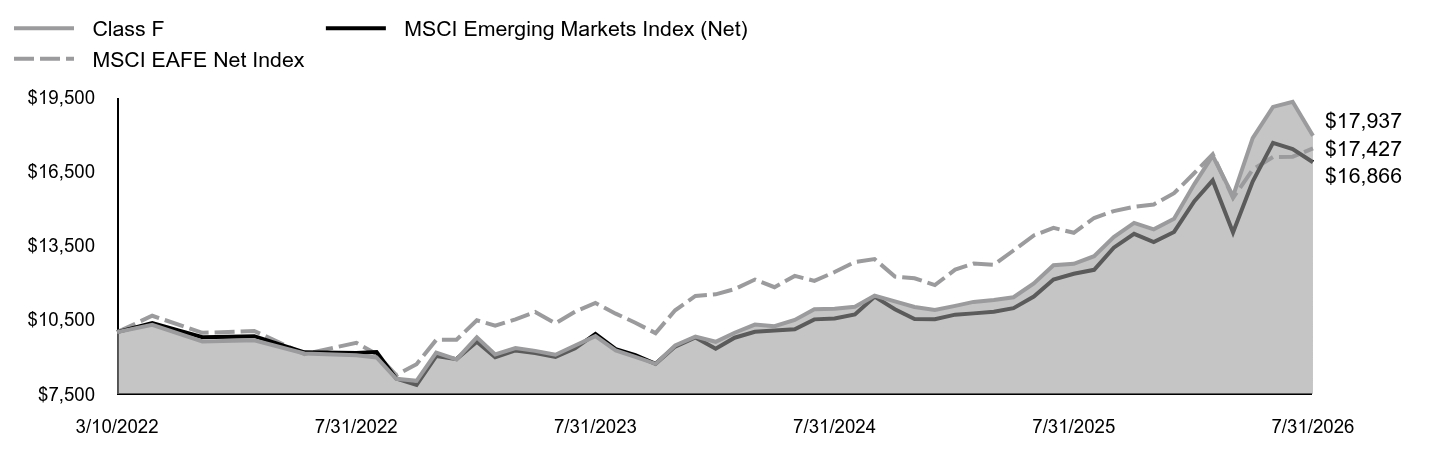 Table Summary | Class F | MSCI Emerging Markets Index (Net) | MSCI EAFE Net Index |
|---|
3/10/2022 | $10,000 | $10,000 | $10,000 |
|---|
3/31/2022 | $10,294 | $10,372 | $10,663 |
|---|
4/30/2022 | $9,626 | $9,795 | $9,973 |
|---|
5/31/2022 | $9,673 | $9,838 | $10,047 |
|---|
6/30/2022 | $9,139 | $9,184 | $9,115 |
|---|
7/31/2022 | $9,065 | $9,162 | $9,569 |
|---|
8/31/2022 | $8,979 | $9,200 | $9,115 |
|---|
9/30/2022 | $8,117 | $8,121 | $8,262 |
|---|
10/31/2022 | $8,031 | $7,869 | $8,707 |
|---|
11/30/2022 | $9,172 | $9,036 | $9,687 |
|---|
12/31/2022 | $8,896 | $8,909 | $9,695 |
|---|
1/31/2023 | $9,788 | $9,613 | $10,480 |
|---|
2/28/2023 | $9,100 | $8,989 | $10,261 |
|---|
3/31/2023 | $9,359 | $9,262 | $10,516 |
|---|
4/30/2023 | $9,243 | $9,157 | $10,813 |
|---|
5/31/2023 | $9,087 | $9,003 | $10,355 |
|---|
6/30/2023 | $9,461 | $9,345 | $10,826 |
|---|
7/31/2023 | $9,842 | $9,926 | $11,177 |
|---|
8/31/2023 | $9,263 | $9,315 | $10,748 |
|---|
9/30/2023 | $8,998 | $9,071 | $10,381 |
|---|
10/31/2023 | $8,719 | $8,719 | $9,960 |
|---|
11/30/2023 | $9,461 | $9,417 | $10,885 |
|---|
12/31/2023 | $9,817 | $9,785 | $11,463 |
|---|
1/31/2024 | $9,610 | $9,331 | $11,529 |
|---|
2/29/2024 | $9,976 | $9,775 | $11,740 |
|---|
3/31/2024 | $10,308 | $10,017 | $12,126 |
|---|
4/30/2024 | $10,239 | $10,062 | $11,816 |
|---|
5/31/2024 | $10,495 | $10,118 | $12,273 |
|---|
6/30/2024 | $10,930 | $10,517 | $12,075 |
|---|
7/31/2024 | $10,944 | $10,549 | $12,430 |
|---|
8/31/2024 | $11,027 | $10,719 | $12,834 |
|---|
9/30/2024 | $11,476 | $11,435 | $12,952 |
|---|
10/31/2024 | $11,241 | $10,926 | $12,248 |
|---|
11/30/2024 | $11,020 | $10,534 | $12,178 |
|---|
12/31/2024 | $10,894 | $10,519 | $11,901 |
|---|
1/31/2025 | $11,062 | $10,707 | $12,527 |
|---|
2/28/2025 | $11,223 | $10,759 | $12,770 |
|---|
3/31/2025 | $11,300 | $10,827 | $12,718 |
|---|
4/30/2025 | $11,412 | $10,969 | $13,301 |
|---|
5/31/2025 | $11,972 | $11,437 | $13,909 |
|---|
6/30/2025 | $12,706 | $12,125 | $14,216 |
|---|
7/31/2025 | $12,762 | $12,361 | $14,016 |
|---|
8/31/2025 | $13,070 | $12,520 | $14,614 |
|---|
9/30/2025 | $13,847 | $13,416 | $14,894 |
|---|
10/31/2025 | $14,414 | $13,976 | $15,069 |
|---|
11/30/2025 | $14,155 | $13,642 | $15,162 |
|---|
12/31/2025 | $14,582 | $14,050 | $15,617 |
|---|
1/31/2026 | $15,984 | $15,294 | $16,432 |
|---|
2/28/2026 | $17,130 | $16,134 | $17,192 |
|---|
3/31/2026 | $15,502 | $14,027 | $15,423 |
|---|
4/30/2026 | $17,845 | $16,090 | $16,572 |
|---|
5/31/2026 | $19,105 | $17,649 | $17,081 |
|---|
6/30/2026 | $19,311 | $17,400 | $17,092 |
|---|
7/31/2026 | $17,937 | $16,866 | $17,427 |
|---|
|
|
| Average Annual Return [Table Text Block] |
Table SummaryAATR | 1 Year | Since Inception
3/10/22 |
|---|
Class F at NAV | 40.55% | 14.23% |
|---|
MSCI Emerging Markets Index (Net) | 36.44% | 12.64% |
|---|
MSCI EAFE Net Index | 24.33% | 13.48% |
|---|
|
|
| Performance Inception Date |
Mar. 10, 2022
|
|
| No Deduction of Taxes [Text Block] |
The returns do not reflect the deduction of taxes that a shareholder would pay on Fund distributions or redemption of Fund shares.
|
|
| AssetsNet |
$ 18,529,029
|
|
| Holdings Count | Holding |
92
|
|
| Advisory Fees Paid, Amount |
$ 0
|
|
| InvestmentCompanyPortfolioTurnover |
75.00%
|
|
| Additional Fund Statistics [Text Block] |
Table SummaryTotal Net Assets | $18,529,029 |
|---|
# of Portfolio Holdings | 92 |
|---|
Portfolio Turnover Rate | 75% |
|---|
Total Advisory Fees Paid | $0 |
|---|
|
|
| Holdings [Text Block] |
Table SummaryPortfolio Holdings Presented by SectorFootnote Reference* | % Footnote Reference** |
|---|
Communication Services | 7.54% | Consumer Discretionary | 8.59% | Consumer Staples | 3.59% | Energy | 2.10% | Financials | 22.01% | Health Care | 2.75% | Industrials | 8.48% | Information Technology | 38.63% | Materials | 3.53% | Real Estate | 0.55% | Utilities | 0.69% | Repurchase Agreements | 1.54% | Total | 100.00% | | Footnote | Description | Footnote* | A sector may comprise several industries. | Footnote** | Represents percent of total investments, which excludes derivatives. |
|
|
| Material Fund Change [Text Block] |
There were no material changes to the Fund during the reporting period. |
|
| Summary of Change Legend [Text Block] |
There were no material changes to the Fund during the reporting period.
|
|
| C000231080 |
|
|
| Shareholder Report [Line Items] |
|
|
| Fund Name |
Lord Abbett Emerging Markets Equity Fund
|
|
| Class Name |
Class F3
|
|
| Trading Symbol |
EMOLX
|
|
| Annual or Semi-Annual Statement [Text Block] |
This annual shareholder report contains important information about the Lord Abbett Emerging Markets Equity Fund for the period of August 1, 2025 to July 31, 2026 (the "reporting period").
|
|
| Additional Information [Text Block] |
You can find additional information about the Fund at lordabbett.com/FundDocuments. You can also request this information by contacting us at 888-522-2388.
|
|
| Additional Information Phone Number |
888-522-2388
|
|
| Additional Information Website |
<span style="box-sizing: border-box; color: rgb(0, 0, 0); display: inline; flex-wrap: nowrap; font-size: 13.3333px; font-weight: 400; grid-area: auto; line-height: 20px; margin: 0px; overflow: visible; text-align: left; text-align-last: auto; white-space-collapse: preserve-breaks;">lordabbett.com/FundDocuments</span>
|
|
| Expenses [Text Block] |
What were the Fund costs for the reporting period?(based on a hypothetical $10,000 investment) Table SummaryClass Name | Costs of a $10,000 investment | Costs paid as a percentage of a $10,000 investment |
|---|
Class F3 | $106 | 0.88% |
|---|
|
|
| Expenses Paid, Amount |
$ 106
|
|
| Expense Ratio, Percent |
0.88%
|
|
| Factors Affecting Performance [Text Block] |
How did the Fund perform last year and what affected its performance?For the fiscal year ended July 31, 2026, the Fund returned 40.61%, reflecting performance at the net asset value (NAV) of Class F3 shares, with all distributions reinvested, compared to the 36.44% return of a securities market index with investment characteristics similar to those of the Fund, the MSCI Emerging Markets Index (Net). The Fund's broad-based securities market index, the MSCI EAFE Net Index, returned 24.33% over the same period. Markets navigated a resilient economic backdrop amid geopolitical and inflation uncertainty. Healthy consumer spending, labor markets, and corporate earnings supported the outlook, while artificial intelligence ("AI") disruption concerns and U.S.-Iran tensions drove volatility and higher energy prices. A June ceasefire stabilized oil markets, though geopolitical tensions continued to influence Treasury yields. Meanwhile, Kevin Warsh became Fed Chair, and the Fed held rates unchanged in July amid resilient economic data. Top contributors to performance: Security selection within the Information Technology sector contributed to relative performance over the period, driven by an allocation to SK Hynix, a manufacturer of memory chips. Security selection within the Financials sector also contributed to relative performance, driven by an allocation to OTP Bank, a financial services company. Top detractors from performance: Security selection within the Consumer Discretionary sector detracted from relative performance over the period, driven by an allocation to Sea Limited, an e-commerce company. Security selection within the Communication Services sector also detracted from relative performance, driven by an allocation to Bharti Airtel, a telecommunications company. |
|
| Performance Past Does Not Indicate Future [Text] |
The Fund's past performance is no guarantee of future results.
|
|
| Line Graph [Table Text Block] |
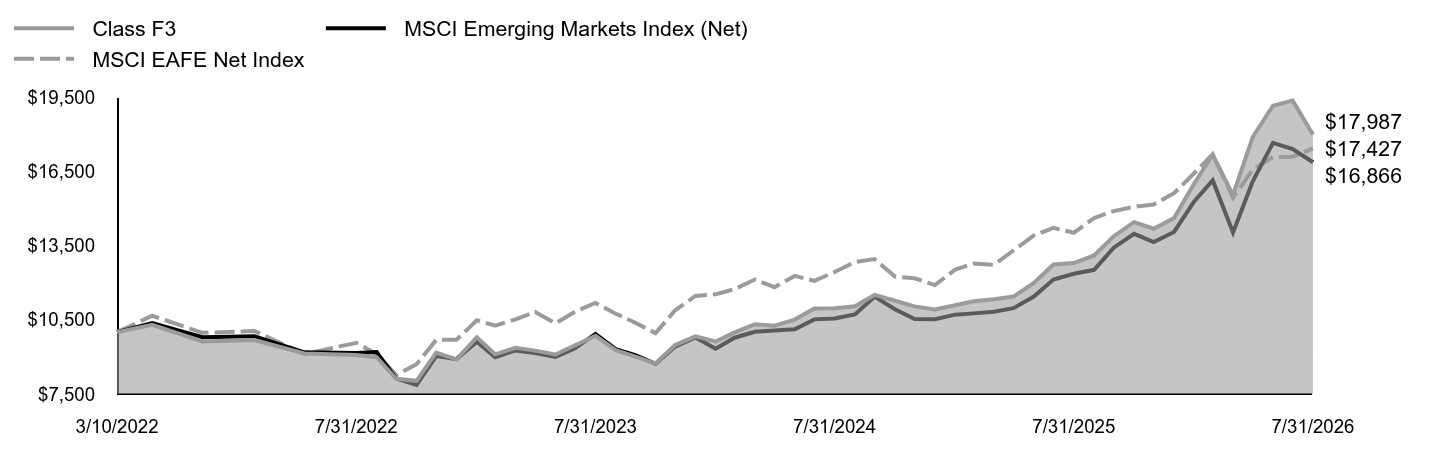 Table Summary | Class F3 | MSCI Emerging Markets Index (Net) | MSCI EAFE Net Index |
|---|
3/10/2022 | $10,000 | $10,000 | $10,000 |
|---|
3/31/2022 | $10,294 | $10,372 | $10,663 |
|---|
4/30/2022 | $9,626 | $9,795 | $9,973 |
|---|
5/31/2022 | $9,680 | $9,838 | $10,047 |
|---|
6/30/2022 | $9,139 | $9,184 | $9,115 |
|---|
7/31/2022 | $9,072 | $9,162 | $9,569 |
|---|
8/31/2022 | $8,985 | $9,200 | $9,115 |
|---|
9/30/2022 | $8,117 | $8,121 | $8,262 |
|---|
10/31/2022 | $8,031 | $7,869 | $8,707 |
|---|
11/30/2022 | $9,172 | $9,036 | $9,687 |
|---|
12/31/2022 | $8,900 | $8,909 | $9,695 |
|---|
1/31/2023 | $9,792 | $9,613 | $10,480 |
|---|
2/28/2023 | $9,104 | $8,989 | $10,261 |
|---|
3/31/2023 | $9,370 | $9,262 | $10,516 |
|---|
4/30/2023 | $9,254 | $9,157 | $10,813 |
|---|
5/31/2023 | $9,097 | $9,003 | $10,355 |
|---|
6/30/2023 | $9,472 | $9,345 | $10,826 |
|---|
7/31/2023 | $9,853 | $9,926 | $11,177 |
|---|
8/31/2023 | $9,274 | $9,315 | $10,748 |
|---|
9/30/2023 | $9,009 | $9,071 | $10,381 |
|---|
10/31/2023 | $8,730 | $8,719 | $9,960 |
|---|
11/30/2023 | $9,479 | $9,417 | $10,885 |
|---|
12/31/2023 | $9,831 | $9,785 | $11,463 |
|---|
1/31/2024 | $9,623 | $9,331 | $11,529 |
|---|
2/29/2024 | $9,990 | $9,775 | $11,740 |
|---|
3/31/2024 | $10,322 | $10,017 | $12,126 |
|---|
4/30/2024 | $10,260 | $10,062 | $11,816 |
|---|
5/31/2024 | $10,509 | $10,118 | $12,273 |
|---|
6/30/2024 | $10,952 | $10,517 | $12,075 |
|---|
7/31/2024 | $10,966 | $10,549 | $12,430 |
|---|
8/31/2024 | $11,049 | $10,719 | $12,834 |
|---|
9/30/2024 | $11,506 | $11,435 | $12,952 |
|---|
10/31/2024 | $11,271 | $10,926 | $12,248 |
|---|
11/30/2024 | $11,042 | $10,534 | $12,178 |
|---|
12/31/2024 | $10,920 | $10,519 | $11,901 |
|---|
1/31/2025 | $11,088 | $10,707 | $12,527 |
|---|
2/28/2025 | $11,249 | $10,759 | $12,770 |
|---|
3/31/2025 | $11,326 | $10,827 | $12,718 |
|---|
4/30/2025 | $11,439 | $10,969 | $13,301 |
|---|
5/31/2025 | $11,993 | $11,437 | $13,909 |
|---|
6/30/2025 | $12,736 | $12,125 | $14,216 |
|---|
7/31/2025 | $12,792 | $12,361 | $14,016 |
|---|
8/31/2025 | $13,101 | $12,520 | $14,614 |
|---|
9/30/2025 | $13,879 | $13,416 | $14,894 |
|---|
10/31/2025 | $14,447 | $13,976 | $15,069 |
|---|
11/30/2025 | $14,181 | $13,642 | $15,162 |
|---|
12/31/2025 | $14,614 | $14,050 | $15,617 |
|---|
1/31/2026 | $16,020 | $15,294 | $16,432 |
|---|
2/28/2026 | $17,171 | $16,134 | $17,192 |
|---|
3/31/2026 | $15,537 | $14,027 | $15,423 |
|---|
4/30/2026 | $17,888 | $16,090 | $16,572 |
|---|
5/31/2026 | $19,152 | $17,649 | $17,081 |
|---|
6/30/2026 | $19,358 | $17,400 | $17,092 |
|---|
7/31/2026 | $17,987 | $16,866 | $17,427 |
|---|
|
|
| Average Annual Return [Table Text Block] |
Table SummaryAATR | 1 Year | Since Inception
3/10/22 |
|---|
Class F3 at NAV | 40.61% | 14.30% |
|---|
MSCI Emerging Markets Index (Net) | 36.44% | 12.64% |
|---|
MSCI EAFE Net Index | 24.33% | 13.48% |
|---|
|
|
| Performance Inception Date |
Mar. 10, 2022
|
|
| No Deduction of Taxes [Text Block] |
The returns do not reflect the deduction of taxes that a shareholder would pay on Fund distributions or redemption of Fund shares.
|
|
| AssetsNet |
$ 18,529,029
|
|
| Holdings Count | Holding |
92
|
|
| Advisory Fees Paid, Amount |
$ 0
|
|
| InvestmentCompanyPortfolioTurnover |
75.00%
|
|
| Additional Fund Statistics [Text Block] |
Table SummaryTotal Net Assets | $18,529,029 |
|---|
# of Portfolio Holdings | 92 |
|---|
Portfolio Turnover Rate | 75% |
|---|
Total Advisory Fees Paid | $0 |
|---|
|
|
| Holdings [Text Block] |
Table SummaryPortfolio Holdings Presented by SectorFootnote Reference* | % Footnote Reference** |
|---|
Communication Services | 7.54% | Consumer Discretionary | 8.59% | Consumer Staples | 3.59% | Energy | 2.10% | Financials | 22.01% | Health Care | 2.75% | Industrials | 8.48% | Information Technology | 38.63% | Materials | 3.53% | Real Estate | 0.55% | Utilities | 0.69% | Repurchase Agreements | 1.54% | Total | 100.00% | | Footnote | Description | Footnote* | A sector may comprise several industries. | Footnote** | Represents percent of total investments, which excludes derivatives. |
|
|
| Material Fund Change [Text Block] |
There were no material changes to the Fund during the reporting period. |
|
| Summary of Change Legend [Text Block] |
There were no material changes to the Fund during the reporting period.
|
|
| C000231079 |
|
|
| Shareholder Report [Line Items] |
|
|
| Fund Name |
Lord Abbett Emerging Markets Equity Fund
|
|
| Class Name |
Class I
|
|
| Trading Symbol |
EMILX
|
|
| Annual or Semi-Annual Statement [Text Block] |
This annual shareholder report contains important information about the Lord Abbett Emerging Markets Equity Fund for the period of August 1, 2025 to July 31, 2026 (the "reporting period").
|
|
| Additional Information [Text Block] |
You can find additional information about the Fund at lordabbett.com/FundDocuments. You can also request this information by contacting us at 888-522-2388.
|
|
| Additional Information Phone Number |
888-522-2388
|
|
| Additional Information Website |
<span style="box-sizing: border-box; color: rgb(0, 0, 0); display: inline; flex-wrap: nowrap; font-size: 13.3333px; font-weight: 400; grid-area: auto; line-height: 20px; margin: 0px; overflow: visible; text-align: left; text-align-last: auto; white-space-collapse: preserve-breaks;">lordabbett.com/FundDocuments</span>
|
|
| Expenses [Text Block] |
What were the Fund costs for the reporting period?(based on a hypothetical $10,000 investment) Table SummaryClass Name | Costs of a $10,000 investment | Costs paid as a percentage of a $10,000 investment |
|---|
Class I | $108 | 0.90% |
|---|
|
|
| Expenses Paid, Amount |
$ 108
|
|
| Expense Ratio, Percent |
0.90%
|
|
| Factors Affecting Performance [Text Block] |
How did the Fund perform last year and what affected its performance?For the fiscal year ended July 31, 2026, the Fund returned 40.59%, reflecting performance at the net asset value (NAV) of Class I shares, with all distributions reinvested, compared to the 36.44% return of a securities market index with investment characteristics similar to those of the Fund, the MSCI Emerging Markets Index (Net). The Fund's broad-based securities market index, the MSCI EAFE Net Index, returned 24.33% over the same period. Markets navigated a resilient economic backdrop amid geopolitical and inflation uncertainty. Healthy consumer spending, labor markets, and corporate earnings supported the outlook, while artificial intelligence ("AI") disruption concerns and U.S.-Iran tensions drove volatility and higher energy prices. A June ceasefire stabilized oil markets, though geopolitical tensions continued to influence Treasury yields. Meanwhile, Kevin Warsh became Fed Chair, and the Fed held rates unchanged in July amid resilient economic data. Top contributors to performance: Security selection within the Information Technology sector contributed to relative performance over the period, driven by an allocation to SK Hynix, a manufacturer of memory chips. Security selection within the Financials sector also contributed to relative performance, driven by an allocation to OTP Bank, a financial services company. Top detractors from performance: Security selection within the Consumer Discretionary sector detracted from relative performance over the period, driven by an allocation to Sea Limited, an e-commerce company. Security selection within the Communication Services sector also detracted from relative performance, driven by an allocation to Bharti Airtel, a telecommunications company. |
|
| Performance Past Does Not Indicate Future [Text] |
The Fund's past performance is no guarantee of future results.
|
|
| Line Graph [Table Text Block] |
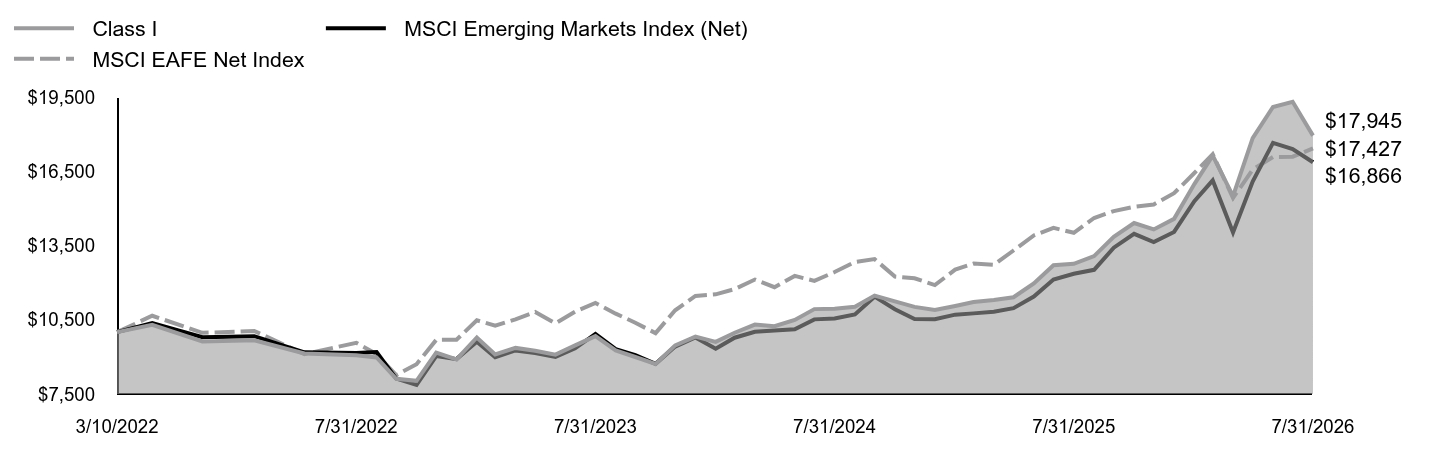 Table Summary | Class I | MSCI Emerging Markets Index (Net) | MSCI EAFE Net Index |
|---|
3/10/2022 | $10,000 | $10,000 | $10,000 |
|---|
3/31/2022 | $10,294 | $10,372 | $10,663 |
|---|
4/30/2022 | $9,626 | $9,795 | $9,973 |
|---|
5/31/2022 | $9,673 | $9,838 | $10,047 |
|---|
6/30/2022 | $9,139 | $9,184 | $9,115 |
|---|
7/31/2022 | $9,065 | $9,162 | $9,569 |
|---|
8/31/2022 | $8,979 | $9,200 | $9,115 |
|---|
9/30/2022 | $8,117 | $8,121 | $8,262 |
|---|
10/31/2022 | $8,031 | $7,869 | $8,707 |
|---|
11/30/2022 | $9,172 | $9,036 | $9,687 |
|---|
12/31/2022 | $8,900 | $8,909 | $9,695 |
|---|
1/31/2023 | $9,785 | $9,613 | $10,480 |
|---|
2/28/2023 | $9,097 | $8,989 | $10,261 |
|---|
3/31/2023 | $9,363 | $9,262 | $10,516 |
|---|
4/30/2023 | $9,247 | $9,157 | $10,813 |
|---|
5/31/2023 | $9,090 | $9,003 | $10,355 |
|---|
6/30/2023 | $9,465 | $9,345 | $10,826 |
|---|
7/31/2023 | $9,839 | $9,926 | $11,177 |
|---|
8/31/2023 | $9,260 | $9,315 | $10,748 |
|---|
9/30/2023 | $8,995 | $9,071 | $10,381 |
|---|
10/31/2023 | $8,716 | $8,719 | $9,960 |
|---|
11/30/2023 | $9,465 | $9,417 | $10,885 |
|---|
12/31/2023 | $9,817 | $9,785 | $11,463 |
|---|
1/31/2024 | $9,609 | $9,331 | $11,529 |
|---|
2/29/2024 | $9,976 | $9,775 | $11,740 |
|---|
3/31/2024 | $10,308 | $10,017 | $12,126 |
|---|
4/30/2024 | $10,239 | $10,062 | $11,816 |
|---|
5/31/2024 | $10,495 | $10,118 | $12,273 |
|---|
6/30/2024 | $10,931 | $10,517 | $12,075 |
|---|
7/31/2024 | $10,945 | $10,549 | $12,430 |
|---|
8/31/2024 | $11,028 | $10,719 | $12,834 |
|---|
9/30/2024 | $11,478 | $11,435 | $12,952 |
|---|
10/31/2024 | $11,243 | $10,926 | $12,248 |
|---|
11/30/2024 | $11,021 | $10,534 | $12,178 |
|---|
12/31/2024 | $10,898 | $10,519 | $11,901 |
|---|
1/31/2025 | $11,060 | $10,707 | $12,527 |
|---|
2/28/2025 | $11,221 | $10,759 | $12,770 |
|---|
3/31/2025 | $11,298 | $10,827 | $12,718 |
|---|
4/30/2025 | $11,410 | $10,969 | $13,301 |
|---|
5/31/2025 | $11,972 | $11,437 | $13,909 |
|---|
6/30/2025 | $12,708 | $12,125 | $14,216 |
|---|
7/31/2025 | $12,764 | $12,361 | $14,016 |
|---|
8/31/2025 | $13,073 | $12,520 | $14,614 |
|---|
9/30/2025 | $13,851 | $13,416 | $14,894 |
|---|
10/31/2025 | $14,412 | $13,976 | $15,069 |
|---|
11/30/2025 | $14,153 | $13,642 | $15,162 |
|---|
12/31/2025 | $14,579 | $14,050 | $15,617 |
|---|
1/31/2026 | $15,985 | $15,294 | $16,432 |
|---|
2/28/2026 | $17,135 | $16,134 | $17,192 |
|---|
3/31/2026 | $15,502 | $14,027 | $15,423 |
|---|
4/30/2026 | $17,845 | $16,090 | $16,572 |
|---|
5/31/2026 | $19,102 | $17,649 | $17,081 |
|---|
6/30/2026 | $19,315 | $17,400 | $17,092 |
|---|
7/31/2026 | $17,945 | $16,866 | $17,427 |
|---|
|
|
| Average Annual Return [Table Text Block] |
Table SummaryAATR | 1 Year | Since Inception
3/10/22 |
|---|
Class I at NAV | 40.59% | 14.24% |
|---|
MSCI Emerging Markets Index (Net) | 36.44% | 12.64% |
|---|
MSCI EAFE Net Index | 24.33% | 13.48% |
|---|
|
|
| Performance Inception Date |
Mar. 10, 2022
|
|
| No Deduction of Taxes [Text Block] |
The returns do not reflect the deduction of taxes that a shareholder would pay on Fund distributions or redemption of Fund shares.
|
|
| AssetsNet |
$ 18,529,029
|
|
| Holdings Count | Holding |
92
|
|
| Advisory Fees Paid, Amount |
$ 0
|
|
| InvestmentCompanyPortfolioTurnover |
75.00%
|
|
| Additional Fund Statistics [Text Block] |
Table SummaryTotal Net Assets | $18,529,029 |
|---|
# of Portfolio Holdings | 92 |
|---|
Portfolio Turnover Rate | 75% |
|---|
Total Advisory Fees Paid | $0 |
|---|
|
|
| Holdings [Text Block] |
Table SummaryPortfolio Holdings Presented by SectorFootnote Reference* | % Footnote Reference** |
|---|
Communication Services | 7.54% | Consumer Discretionary | 8.59% | Consumer Staples | 3.59% | Energy | 2.10% | Financials | 22.01% | Health Care | 2.75% | Industrials | 8.48% | Information Technology | 38.63% | Materials | 3.53% | Real Estate | 0.55% | Utilities | 0.69% | Repurchase Agreements | 1.54% | Total | 100.00% | | Footnote | Description | Footnote* | A sector may comprise several industries. | Footnote** | Represents percent of total investments, which excludes derivatives. |
|
|
| Material Fund Change [Text Block] |
There were no material changes to the Fund during the reporting period. |
|
| Summary of Change Legend [Text Block] |
There were no material changes to the Fund during the reporting period.
|
|
| C000231074 |
|
|
| Shareholder Report [Line Items] |
|
|
| Fund Name |
Lord Abbett Emerging Markets Equity Fund
|
|
| Class Name |
Class R6
|
|
| Trading Symbol |
EMWLX
|
|
| Annual or Semi-Annual Statement [Text Block] |
This annual shareholder report contains important information about the Lord Abbett Emerging Markets Equity Fund for the period of August 1, 2025 to July 31, 2026 (the "reporting period").
|
|
| Additional Information [Text Block] |
You can find additional information about the Fund at lordabbett.com/FundDocuments. You can also request this information by contacting us at 888-522-2388.
|
|
| Additional Information Phone Number |
888-522-2388
|
|
| Additional Information Website |
<span style="box-sizing: border-box; color: rgb(0, 0, 0); display: inline; flex-wrap: nowrap; font-size: 13.3333px; font-weight: 400; grid-area: auto; line-height: 20px; margin: 0px; overflow: visible; text-align: left; text-align-last: auto; white-space-collapse: preserve-breaks;">lordabbett.com/FundDocuments</span>
|
|
| Expenses [Text Block] |
What were the Fund costs for the reporting period?(based on a hypothetical $10,000 investment) Table SummaryClass Name | Costs of a $10,000 investment | Costs paid as a percentage of a $10,000 investment |
|---|
Class R6 | $106 | 0.88% |
|---|
|
|
| Expenses Paid, Amount |
$ 106
|
|
| Expense Ratio, Percent |
0.88%
|
|
| Factors Affecting Performance [Text Block] |
How did the Fund perform last year and what affected its performance?For the fiscal year ended July 31, 2026, the Fund returned 40.61%, reflecting performance at the net asset value (NAV) of Class R6 shares, with all distributions reinvested, compared to the 36.44% return of a securities market index with investment characteristics similar to those of the Fund, the MSCI Emerging Markets Index (Net). The Fund's broad-based securities market index, the MSCI EAFE Net Index, returned 24.33% over the same period. Markets navigated a resilient economic backdrop amid geopolitical and inflation uncertainty. Healthy consumer spending, labor markets, and corporate earnings supported the outlook, while artificial intelligence ("AI") disruption concerns and U.S.-Iran tensions drove volatility and higher energy prices. A June ceasefire stabilized oil markets, though geopolitical tensions continued to influence Treasury yields. Meanwhile, Kevin Warsh became Fed Chair, and the Fed held rates unchanged in July amid resilient economic data. Top contributors to performance: Security selection within the Information Technology sector contributed to relative performance over the period, driven by an allocation to SK Hynix, a manufacturer of memory chips. Security selection within the Financials sector also contributed to relative performance, driven by an allocation to OTP Bank, a financial services company. Top detractors from performance: Security selection within the Consumer Discretionary sector detracted from relative performance over the period, driven by an allocation to Sea Limited, an e-commerce company. Security selection within the Communication Services sector also detracted from relative performance, driven by an allocation to Bharti Airtel, a telecommunications company. |
|
| Performance Past Does Not Indicate Future [Text] |
The Fund's past performance is no guarantee of future results.
|
|
| Line Graph [Table Text Block] |
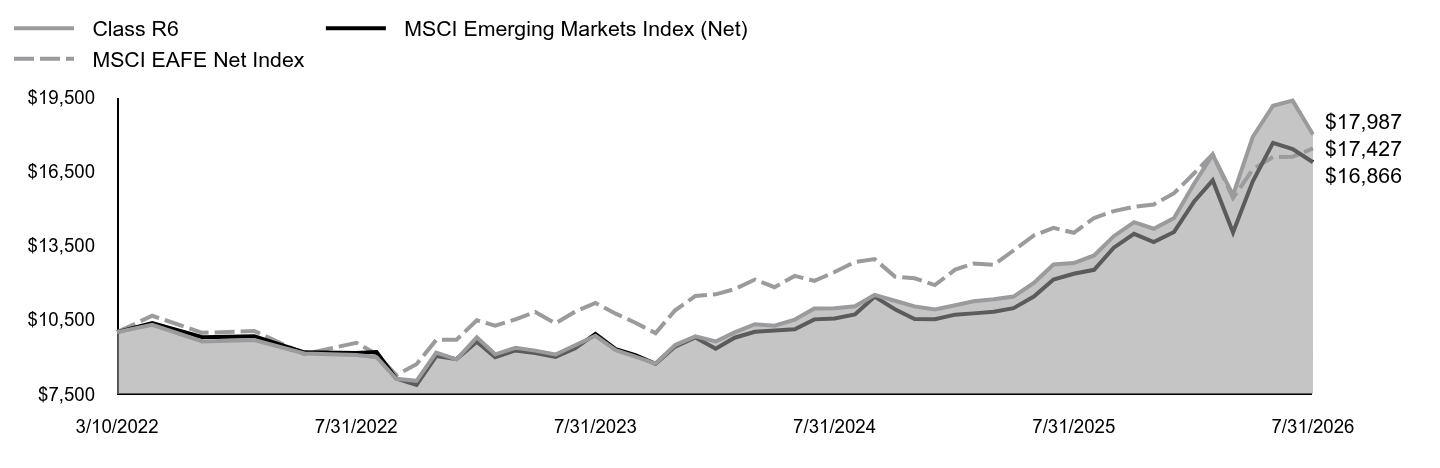 Table Summary | Class R6 | MSCI Emerging Markets Index (Net) | MSCI EAFE Net Index |
|---|
3/10/2022 | $10,000 | $10,000 | $10,000 |
|---|
3/31/2022 | $10,294 | $10,372 | $10,663 |
|---|
4/30/2022 | $9,626 | $9,795 | $9,973 |
|---|
5/31/2022 | $9,680 | $9,838 | $10,047 |
|---|
6/30/2022 | $9,139 | $9,184 | $9,115 |
|---|
7/31/2022 | $9,072 | $9,162 | $9,569 |
|---|
8/31/2022 | $8,985 | $9,200 | $9,115 |
|---|
9/30/2022 | $8,117 | $8,121 | $8,262 |
|---|
10/31/2022 | $8,031 | $7,869 | $8,707 |
|---|
11/30/2022 | $9,172 | $9,036 | $9,687 |
|---|
12/31/2022 | $8,900 | $8,909 | $9,695 |
|---|
1/31/2023 | $9,792 | $9,613 | $10,480 |
|---|
2/28/2023 | $9,104 | $8,989 | $10,261 |
|---|
3/31/2023 | $9,370 | $9,262 | $10,516 |
|---|
4/30/2023 | $9,254 | $9,157 | $10,813 |
|---|
5/31/2023 | $9,097 | $9,003 | $10,355 |
|---|
6/30/2023 | $9,472 | $9,345 | $10,826 |
|---|
7/31/2023 | $9,853 | $9,926 | $11,177 |
|---|
8/31/2023 | $9,274 | $9,315 | $10,748 |
|---|
9/30/2023 | $9,009 | $9,071 | $10,381 |
|---|
10/31/2023 | $8,730 | $8,719 | $9,960 |
|---|
11/30/2023 | $9,479 | $9,417 | $10,885 |
|---|
12/31/2023 | $9,831 | $9,785 | $11,463 |
|---|
1/31/2024 | $9,623 | $9,331 | $11,529 |
|---|
2/29/2024 | $9,990 | $9,775 | $11,740 |
|---|
3/31/2024 | $10,322 | $10,017 | $12,126 |
|---|
4/30/2024 | $10,260 | $10,062 | $11,816 |
|---|
5/31/2024 | $10,509 | $10,118 | $12,273 |
|---|
6/30/2024 | $10,952 | $10,517 | $12,075 |
|---|
7/31/2024 | $10,966 | $10,549 | $12,430 |
|---|
8/31/2024 | $11,049 | $10,719 | $12,834 |
|---|
9/30/2024 | $11,506 | $11,435 | $12,952 |
|---|
10/31/2024 | $11,271 | $10,926 | $12,248 |
|---|
11/30/2024 | $11,042 | $10,534 | $12,178 |
|---|
12/31/2024 | $10,920 | $10,519 | $11,901 |
|---|
1/31/2025 | $11,088 | $10,707 | $12,527 |
|---|
2/28/2025 | $11,249 | $10,759 | $12,770 |
|---|
3/31/2025 | $11,326 | $10,827 | $12,718 |
|---|
4/30/2025 | $11,439 | $10,969 | $13,301 |
|---|
5/31/2025 | $11,993 | $11,437 | $13,909 |
|---|
6/30/2025 | $12,736 | $12,125 | $14,216 |
|---|
7/31/2025 | $12,792 | $12,361 | $14,016 |
|---|
8/31/2025 | $13,101 | $12,520 | $14,614 |
|---|
9/30/2025 | $13,879 | $13,416 | $14,894 |
|---|
10/31/2025 | $14,447 | $13,976 | $15,069 |
|---|
11/30/2025 | $14,181 | $13,642 | $15,162 |
|---|
12/31/2025 | $14,614 | $14,050 | $15,617 |
|---|
1/31/2026 | $16,020 | $15,294 | $16,432 |
|---|
2/28/2026 | $17,171 | $16,134 | $17,192 |
|---|
3/31/2026 | $15,537 | $14,027 | $15,423 |
|---|
4/30/2026 | $17,888 | $16,090 | $16,572 |
|---|
5/31/2026 | $19,152 | $17,649 | $17,081 |
|---|
6/30/2026 | $19,358 | $17,400 | $17,092 |
|---|
7/31/2026 | $17,987 | $16,866 | $17,427 |
|---|
|
|
| Average Annual Return [Table Text Block] |
Table SummaryAATR | 1 Year | Since Inception
3/10/22 |
|---|
Class R6 at NAV | 40.61% | 14.30% |
|---|
MSCI Emerging Markets Index (Net) | 36.44% | 12.64% |
|---|
MSCI EAFE Net Index | 24.33% | 13.48% |
|---|
|
|
| Performance Inception Date |
Mar. 10, 2022
|
|
| No Deduction of Taxes [Text Block] |
The returns do not reflect the deduction of taxes that a shareholder would pay on Fund distributions or redemption of Fund shares.
|
|
| AssetsNet |
$ 18,529,029
|
|
| Holdings Count | Holding |
92
|
|
| Advisory Fees Paid, Amount |
$ 0
|
|
| InvestmentCompanyPortfolioTurnover |
75.00%
|
|
| Additional Fund Statistics [Text Block] |
Table SummaryTotal Net Assets | $18,529,029 |
|---|
# of Portfolio Holdings | 92 |
|---|
Portfolio Turnover Rate | 75% |
|---|
Total Advisory Fees Paid | $0 |
|---|
|
|
| Holdings [Text Block] |
Table SummaryPortfolio Holdings Presented by SectorFootnote Reference* | % Footnote Reference** |
|---|
Communication Services | 7.54% | Consumer Discretionary | 8.59% | Consumer Staples | 3.59% | Energy | 2.10% | Financials | 22.01% | Health Care | 2.75% | Industrials | 8.48% | Information Technology | 38.63% | Materials | 3.53% | Real Estate | 0.55% | Utilities | 0.69% | Repurchase Agreements | 1.54% | Total | 100.00% | | Footnote | Description | Footnote* | A sector may comprise several industries. | Footnote** | Represents percent of total investments, which excludes derivatives. |
|
|
| Material Fund Change [Text Block] |
There were no material changes to the Fund during the reporting period. |
|
| Summary of Change Legend [Text Block] |
There were no material changes to the Fund during the reporting period.
|
|
| C000248998 |
|
|
| Shareholder Report [Line Items] |
|
|
| Fund Name |
Lord Abbett Enhanced Municipal Yield Completion Fund
|
|
| Trading Symbol |
LAEMX
|
|
| Annual or Semi-Annual Statement [Text Block] |
This annual shareholder report contains important information about the Lord Abbett Enhanced Municipal Yield Completion Fund for the period of August 1, 2025 to July 31, 2026 (the "reporting period").
|
|
| Additional Information [Text Block] |
You can find additional information about the Fund at lordabbett.com/SMADocuments. You can also request this information by contacting us at 888-522-2388.
|
|
| Additional Information Phone Number |
888-522-2388
|
|
| Additional Information Website |
<span style="box-sizing: border-box; color: rgb(0, 0, 0); display: inline; flex-wrap: nowrap; font-size: 13.3333px; font-weight: 400; grid-area: auto; line-height: 20px; margin: 0px; overflow: visible; text-align: left; text-align-last: auto; white-space-collapse: preserve-breaks;">lordabbett.com/SMADocuments</span>
|
|
| Expenses [Text Block] |
What were the Fund costs for the reporting period?(based on a hypothetical $10,000 investment) Table SummaryFund Name | Costs of a $10,000 investment | Costs paid as a percentage of a $10,000 investment |
|---|
Enhanced Municipal Yield Completion Fund | $0 | 0.00% |
|---|
|
|
| Expenses Paid, Amount |
$ 0
|
|
| Expense Ratio, Percent |
0.00%
|
|
| Factors Affecting Performance [Text Block] |
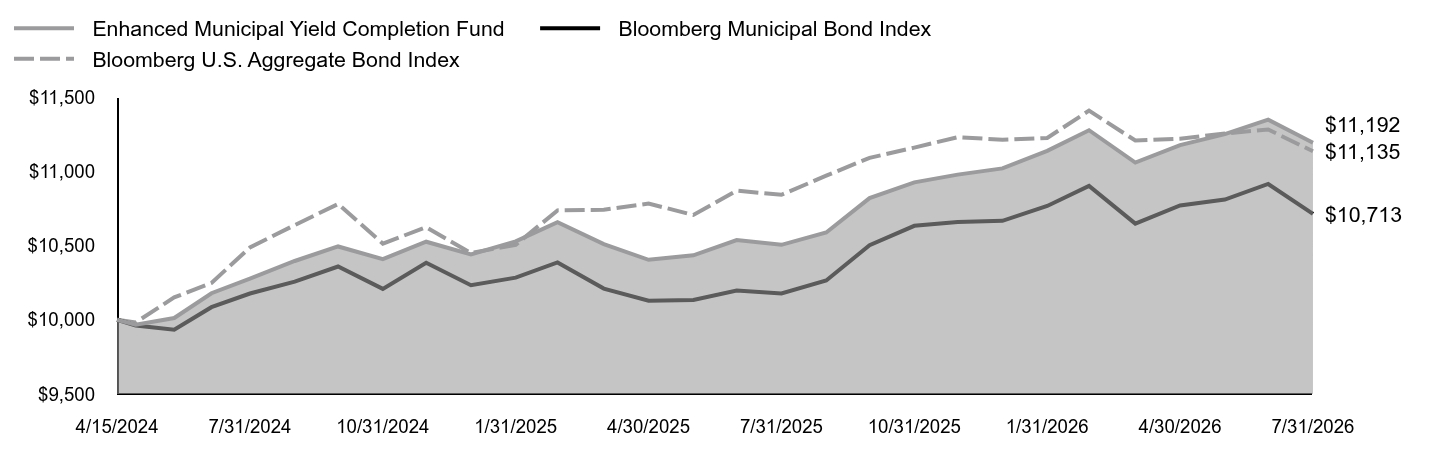
How did the Fund perform last year and what affected its performance?For the fiscal year ended July 31, 2026, the Fund returned 6.55%, reflecting performance at the net asset value (NAV), with all distributions reinvested, compared to the 5.26% return of a securities market index with investment characteristics similar to those of the Fund, the Bloomberg Municipal Bond Index. The Fund's broad-based securities market index, the Bloomberg U.S. Aggregate Bond Index, returned 2.71% over the same period. Positive factors for the municipal market included overall healthy demand for municipal bond funds and a strong fundamental backdrop. Negative factors included an above-average municipal bond supply that pressured the market at various times throughout the fiscal year and has created more dispersion across sectors within the municipal market. Top contributors to performance: An overweight allocation to BBB-rated bonds contributed to relative performance. Security selection, particularly within the Tobacco sector, also contributed to relative performance. Top detractors from performance: The Fund’s yield curve positioning, specifically an underweight allocation to longer-term bonds, detracted from relative performance. An overweight allocation to the Transportation sector also detracted from relative performance. |
|
| Performance Past Does Not Indicate Future [Text] |
The Fund's past performance is no guarantee of future results.
|
|
| Line Graph [Table Text Block] |
Table Summary | Enhanced Municipal Yield Completion Fund | Bloomberg Municipal Bond Index | Bloomberg U.S. Aggregate Bond Index |
|---|
4/15/2024 | $10,000 | $10,000 | $10,000 |
|---|
4/30/2024 | $9,967 | $9,962 | $9,982 |
|---|
5/31/2024 | $10,012 | $9,933 | $10,151 |
|---|
6/30/2024 | $10,179 | $10,085 | $10,248 |
|---|
7/31/2024 | $10,278 | $10,177 | $10,487 |
|---|
8/31/2024 | $10,396 | $10,257 | $10,638 |
|---|
9/30/2024 | $10,494 | $10,359 | $10,780 |
|---|
10/31/2024 | $10,409 | $10,208 | $10,513 |
|---|
11/30/2024 | $10,526 | $10,384 | $10,624 |
|---|
12/31/2024 | $10,440 | $10,233 | $10,450 |
|---|
1/31/2025 | $10,528 | $10,284 | $10,505 |
|---|
2/28/2025 | $10,658 | $10,386 | $10,737 |
|---|
3/31/2025 | $10,510 | $10,210 | $10,741 |
|---|
4/30/2025 | $10,404 | $10,128 | $10,783 |
|---|
5/31/2025 | $10,434 | $10,134 | $10,706 |
|---|
6/30/2025 | $10,537 | $10,197 | $10,870 |
|---|
7/31/2025 | $10,505 | $10,177 | $10,842 |
|---|
8/31/2025 | $10,588 | $10,265 | $10,971 |
|---|
9/30/2025 | $10,820 | $10,503 | $11,091 |
|---|
10/31/2025 | $10,926 | $10,633 | $11,160 |
|---|
11/30/2025 | $10,978 | $10,658 | $11,230 |
|---|
12/31/2025 | $11,020 | $10,667 | $11,213 |
|---|
1/31/2026 | $11,138 | $10,767 | $11,225 |
|---|
2/28/2026 | $11,277 | $10,902 | $11,409 |
|---|
3/31/2026 | $11,059 | $10,648 | $11,208 |
|---|
4/30/2026 | $11,177 | $10,770 | $11,220 |
|---|
5/31/2026 | $11,251 | $10,810 | $11,255 |
|---|
6/30/2026 | $11,348 | $10,915 | $11,282 |
|---|
7/31/2026 | $11,192 | $10,713 | $11,135 |
|---|
|
|
| Average Annual Return [Table Text Block] |
Table SummaryAATR | 1 Year | Since Inception
4/15/24Footnote Reference† |
|---|
Enhanced Municipal Yield Completion Fund | 6.55% | 5.03% |
|---|
Bloomberg Municipal Bond Index | 5.26% | 3.05% |
|---|
Bloomberg U.S. Aggregate Bond Index | 2.71% | 4.80% |
|---|
|
|
| Performance Inception Date |
Apr. 15, 2024
|
[5] |
| No Deduction of Taxes [Text Block] |
The returns do not reflect the deduction of taxes that a shareholder would pay on Fund distributions or redemption of Fund shares.
|
|
| AssetsNet |
$ 546,744,555
|
|
| Holdings Count | Holding |
336
|
|
| Advisory Fees Paid, Amount |
$ 0
|
|
| InvestmentCompanyPortfolioTurnover |
40.00%
|
|
| Additional Fund Statistics [Text Block] |
Table SummaryTotal Net Assets | $546,744,555 |
|---|
# of Portfolio Holdings | 336 |
|---|
Portfolio Turnover Rate | 40% |
|---|
Total Advisory Fees Paid | $0 |
|---|
|
|
| Holdings [Text Block] |
Table SummaryPortfolio Holdings Presented by Credit Rating
S&P or Moody'sFootnote Reference* | %Footnote Reference** |
|---|
| | - AAA2.24%
- AA+3.70%
- AA1.36%
- AA-0.72%
- A+0.65%
- A0.58%
- A-3.06%
- BBB+18.18%
- BBB14.31%
- BBB-11.68%
- BB+7.55%
- BB3.47%
- BB-0.88%
- B+1.76%
- B1.44%
- B-1.15%
- CCC+0.19%
- D0.00%Footnote Reference†
- NR27.08%
- Total 100.00%
| Footnote | Description | Footnote* | Investments in investment grade municipal bonds, which are bonds that are rated, at the time of purchase, within the four highest grades assigned by an independent rating agency such as Moody’s, S&P, or Fitch, or an equivalent short-term rating, as applicable, or are unrated by rating agencies but deemed by Lord Abbett to be of comparable quality. Lower rated municipal bonds are rated, at the time of purchase, or an equivalent short-term rating, as applicable, by an independent rating agency or are unrated by rating agencies but deemed by Lord Abbett to be of comparable quality. | Footnote** | Represents percent of total investments, which excludes derivatives. | Footnote† | Amount is less than 0.01% |
|
|
| Credit Ratings Selection [Text Block] |
Investments in investment grade municipal bonds, which are bonds that are rated, at the time of purchase, within the four highest grades assigned by an independent rating agency such as Moody’s, S&P, or Fitch, or an equivalent short-term rating, as applicable, or are unrated by rating agencies but deemed by Lord Abbett to be of comparable quality. Lower rated municipal bonds are rated, at the time of purchase, or an equivalent short-term rating, as applicable, by an independent rating agency or are unrated by rating agencies but deemed by Lord Abbett to be of comparable quality.
|
|
| Material Fund Change [Text Block] |
There were no material changes to the Fund during the reporting period. |
|
| Summary of Change Legend [Text Block] |
There were no material changes to the Fund during the reporting period.
|
|
| C000241944 |
|
|
| Shareholder Report [Line Items] |
|
|
| Fund Name |
Lord Abbett Investment Grade Floating Rate Fund
|
|
| Class Name |
Class A
|
|
| Trading Symbol |
LGRAX
|
|
| Annual or Semi-Annual Statement [Text Block] |
This annual shareholder report contains important information about the Lord Abbett Investment Grade Floating Rate Fund for the period of August 1, 2025 to July 31, 2026 (the "reporting period").
|
|
| Additional Information [Text Block] |
You can find additional information about the Fund at lordabbett.com/FundDocuments. You can also request this information by contacting us at 888-522-2388.
|
|
| Material Fund Change Notice [Text Block] |
This report describes changes to the Fund that occurred during the reporting period.
|
|
| Additional Information Phone Number |
888-522-2388
|
|
| Additional Information Website |
<span style="box-sizing: border-box; color: rgb(0, 0, 0); display: inline; flex-wrap: nowrap; font-size: 13.3333px; font-weight: 400; grid-area: auto; line-height: 20px; margin: 0px; overflow: visible; text-align: left; text-align-last: auto; white-space-collapse: preserve-breaks;">lordabbett.com/FundDocuments</span>
|
|
| Expenses [Text Block] |
What were the Fund costs for the reporting period?(based on a hypothetical $10,000 investment) Table SummaryClass Name | Costs of a $10,000 investment | Costs paid as a percentage of a $10,000 investment |
|---|
Class A | $62 | 0.60% |
|---|
|
|
| Expenses Paid, Amount |
$ 62
|
|
| Expense Ratio, Percent |
0.60%
|
|
| Factors Affecting Performance [Text Block] |
How did the Fund perform last year and what affected its performance?For the fiscal year ended July 31, 2026, the Fund returned 5.06%, reflecting performance at the net asset value (NAV) of Class A shares with all distributions reinvested, compared to the 4.69% return of a securities market index with investment characteristics similar to those of the Fund, the Bloomberg U.S. Floating Rate Notes Index. The Fund's broad-based securities market index, the Bloomberg U.S. Aggregate Bond Index, returned 2.71% over the same period. From August 2025 through July 2026, U.S. fixed income markets were supported by resilient economic growth, solid consumer spending, healthy corporate earnings and continued investment, particularly in artificial intelligence ("AI"). Markets also faced headwinds from rising inflation pressures and heightened geopolitical tensions, including the U.S.-Iran conflict and its impact on energy prices. These developments contributed to periods of elevated volatility and shifting expectations for Federal Reserve policy. Despite these challenges, credit markets remained broadly constructive, supported by resilient corporate fundamentals and continued demand for income. Overall, the period reflected a balance between economic resilience and growing concerns around inflation, geopolitical risk and potential AI-driven disruption. Top contributors to performance: The Fund’s allocation to collateralized loan obligations was the primary contributor to relative performance. An allocation to asset-backed securities also contributed to relative performance. Top detractors from performance: The Fund’s rates positioning detracted from relative performance. The Fund’s allocation to investment grade corporate bonds also detracted from relative performance. |
|
| Performance Past Does Not Indicate Future [Text] |
The Fund's past performance is no guarantee of future results.
|
|
| Line Graph [Table Text Block] |
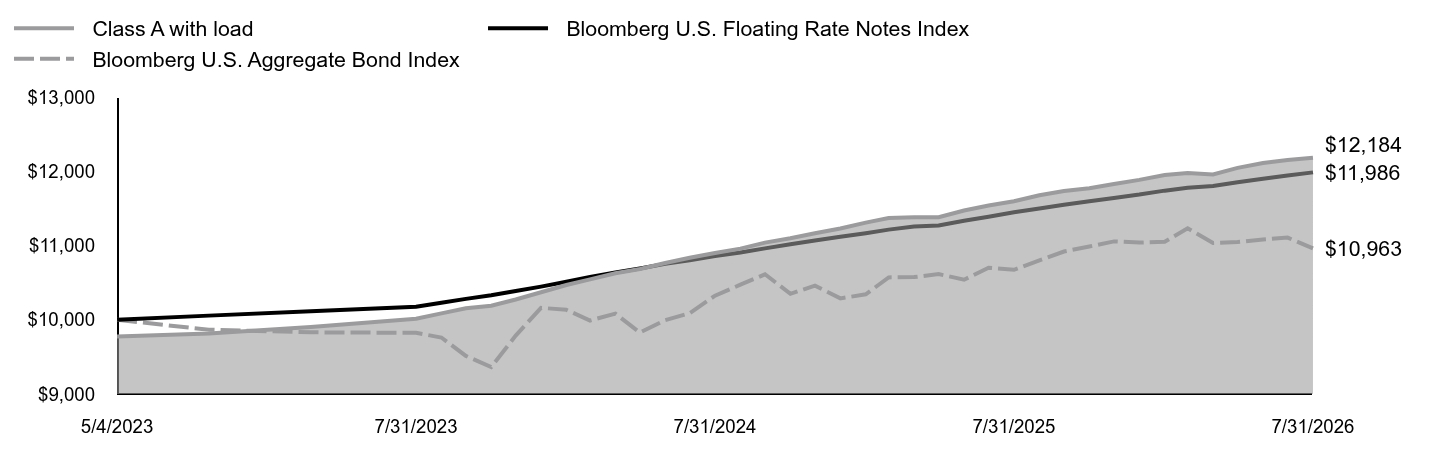 Table Summary | Class A with load | Bloomberg U.S. Floating Rate Notes Index | Bloomberg U.S. Aggregate Bond Index |
|---|
5/4/2023 | $9,775 | $10,000 | $10,000 |
|---|
5/31/2023 | $9,816 | $10,056 | $9,866 |
|---|
6/30/2023 | $9,903 | $10,116 | $9,831 |
|---|
7/31/2023 | $10,013 | $10,176 | $9,824 |
|---|
8/31/2023 | $10,086 | $10,230 | $9,761 |
|---|
9/30/2023 | $10,156 | $10,282 | $9,513 |
|---|
10/31/2023 | $10,190 | $10,331 | $9,363 |
|---|
11/30/2023 | $10,274 | $10,387 | $9,787 |
|---|
12/31/2023 | $10,371 | $10,447 | $10,161 |
|---|
1/31/2024 | $10,468 | $10,513 | $10,134 |
|---|
2/29/2024 | $10,545 | $10,576 | $9,990 |
|---|
3/31/2024 | $10,626 | $10,636 | $10,083 |
|---|
4/30/2024 | $10,684 | $10,692 | $9,828 |
|---|
5/31/2024 | $10,766 | $10,753 | $9,995 |
|---|
6/30/2024 | $10,835 | $10,803 | $10,089 |
|---|
7/31/2024 | $10,899 | $10,859 | $10,325 |
|---|
8/31/2024 | $10,959 | $10,907 | $10,473 |
|---|
9/30/2024 | $11,040 | $10,962 | $10,613 |
|---|
10/31/2024 | $11,099 | $11,018 | $10,350 |
|---|
11/30/2024 | $11,166 | $11,067 | $10,460 |
|---|
12/31/2024 | $11,230 | $11,118 | $10,288 |
|---|
1/31/2025 | $11,309 | $11,167 | $10,343 |
|---|
2/28/2025 | $11,372 | $11,215 | $10,571 |
|---|
3/31/2025 | $11,382 | $11,256 | $10,575 |
|---|
4/30/2025 | $11,382 | $11,271 | $10,616 |
|---|
5/31/2025 | $11,473 | $11,334 | $10,540 |
|---|
6/30/2025 | $11,539 | $11,389 | $10,702 |
|---|
7/31/2025 | $11,597 | $11,449 | $10,674 |
|---|
8/31/2025 | $11,678 | $11,499 | $10,802 |
|---|
9/30/2025 | $11,736 | $11,549 | $10,920 |
|---|
10/31/2025 | $11,773 | $11,597 | $10,988 |
|---|
11/30/2025 | $11,829 | $11,642 | $11,056 |
|---|
12/31/2025 | $11,885 | $11,687 | $11,040 |
|---|
1/31/2026 | $11,951 | $11,740 | $11,051 |
|---|
2/28/2026 | $11,977 | $11,779 | $11,232 |
|---|
3/31/2026 | $11,959 | $11,802 | $11,034 |
|---|
4/30/2026 | $12,047 | $11,852 | $11,047 |
|---|
5/31/2026 | $12,112 | $11,901 | $11,081 |
|---|
6/30/2026 | $12,152 | $11,944 | $11,108 |
|---|
7/31/2026 | $12,184 | $11,986 | $10,963 |
|---|
|
|
| Average Annual Return [Table Text Block] |
Table SummaryAATR | 1 Year | Since Inception
5/4/23 |
|---|
Class A at NAV | 5.06% | 7.03% |
|---|
Class A with sales charge | 2.66% | 6.28% |
|---|
Bloomberg U.S. Floating Rate Notes Index | 4.69% | 5.75% |
|---|
Bloomberg U.S. Aggregate Bond Index | 2.71% | 2.88% |
|---|
|
|
| Performance Inception Date |
May 04, 2023
|
|
| No Deduction of Taxes [Text Block] |
The returns do not reflect the deduction of taxes that a shareholder would pay on Fund distributions or redemption of Fund shares.
|
|
| AssetsNet |
$ 4,995,204,689
|
|
| Holdings Count | Holding |
787
|
|
| Advisory Fees Paid, Amount |
$ 7,999,234
|
|
| InvestmentCompanyPortfolioTurnover |
100.00%
|
|
| Additional Fund Statistics [Text Block] |
Table SummaryTotal Net Assets | $4,995,204,689 |
|---|
# of Portfolio Holdings | 787 |
|---|
Portfolio Turnover Rate | 100% |
|---|
Total Advisory Fees Paid | $7,999,234 |
|---|
|
|
| Holdings [Text Block] |
Table SummaryPortfolio Holdings Presented by Portfolio Allocation | %Footnote Reference* |
|---|
Asset-Backed Securities | 63.66% | Corporate Bonds | 7.55% | Floating Rate Loans | 8.80% | Foreign Government Obligations | 0.97% | Government Sponsored Enterprises Collateralized Mortgage Obligations | 5.78% | Non-Agency Commercial Mortgage-Backed Securities | 6.88% | U.S. Treasury Obligations | 5.16% | Repurchase Agreements | 1.14% | Money Market FundsFootnote Reference** | 0.05% | Time DepositsFootnote Reference** | 0.01% | Total | 100.00% | | Footnote | Description | Footnote* | Represents percent of total investments, which excludes derivatives. | Footnote** | Securities were purchased with the cash collateral from loaned securities. |
|
|
| Material Fund Change [Text Block] |
This is a summary of certain changes to the Fund that occurred during the reporting period, except as otherwise noted. For more information contact 888-522-2388. Effective December 1, 2025, the Fund's Expense Limitation Agreement expired and was not renewed. Prior to that date, the Adviser contractually agreed to limit total net annual operating expenses, excluding 12b-1 fees and acquired fund fees and expenses, interest-related expenses, taxes, expenses related to litigation and potential litigation, and extraordinary expenses, to an annual rate of 0.35%. |
|
| Material Fund Change Expenses [Text Block] |
Effective December 1, 2025, the Fund's Expense Limitation Agreement expired and was not renewed. Prior to that date, the Adviser contractually agreed to limit total net annual operating expenses, excluding 12b-1 fees and acquired fund fees and expenses, interest-related expenses, taxes, expenses related to litigation and potential litigation, and extraordinary expenses, to an annual rate of 0.35%.
|
|
| Summary of Change Legend [Text Block] |
This is a summary of certain changes to the Fund that occurred during the reporting period, except as otherwise noted. For more information contact 888-522-2388.
|
|
| Updated Prospectus Phone Number |
888-522-2388
|
|
| C000241948 |
|
|
| Shareholder Report [Line Items] |
|
|
| Fund Name |
Lord Abbett Investment Grade Floating Rate Fund
|
|
| Class Name |
Class C
|
|
| Trading Symbol |
IGRCX
|
|
| Annual or Semi-Annual Statement [Text Block] |
This annual shareholder report contains important information about the Lord Abbett Investment Grade Floating Rate Fund for the period of August 1, 2025 to July 31, 2026 (the "reporting period").
|
|
| Additional Information [Text Block] |
You can find additional information about the Fund at lordabbett.com/FundDocuments. You can also request this information by contacting us at 888-522-2388.
|
|
| Material Fund Change Notice [Text Block] |
This report describes changes to the Fund that occurred during the reporting period.
|
|
| Additional Information Phone Number |
888-522-2388
|
|
| Additional Information Website |
<span style="box-sizing: border-box; color: rgb(0, 0, 0); display: inline; flex-wrap: nowrap; font-size: 13.3333px; font-weight: 400; grid-area: auto; line-height: 20px; margin: 0px; overflow: visible; text-align: left; text-align-last: auto; white-space-collapse: preserve-breaks;">lordabbett.com/FundDocuments</span>
|
|
| Expenses [Text Block] |
What were the Fund costs for the reporting period?(based on a hypothetical $10,000 investment) Table SummaryClass Name | Costs of a $10,000 investment | Costs paid as a percentage of a $10,000 investment |
|---|
Class C | $140 | 1.37% |
|---|
|
|
| Expenses Paid, Amount |
$ 140
|
|
| Expense Ratio, Percent |
1.37%
|
|
| Factors Affecting Performance [Text Block] |
How did the Fund perform last year and what affected its performance?For the fiscal year ended July 31, 2026, the Fund returned 4.36%, reflecting performance at the net asset value (NAV) of Class C shares with all distributions reinvested, compared to the 4.69% return of a securities market index with investment characteristics similar to those of the Fund, the Bloomberg U.S. Floating Rate Notes Index. The Fund's broad-based securities market index, the Bloomberg U.S. Aggregate Bond Index, returned 2.71% over the same period. From August 2025 through July 2026, U.S. fixed income markets were supported by resilient economic growth, solid consumer spending, healthy corporate earnings and continued investment, particularly in artificial intelligence ("AI"). Markets also faced headwinds from rising inflation pressures and heightened geopolitical tensions, including the U.S.-Iran conflict and its impact on energy prices. These developments contributed to periods of elevated volatility and shifting expectations for Federal Reserve policy. Despite these challenges, credit markets remained broadly constructive, supported by resilient corporate fundamentals and continued demand for income. Overall, the period reflected a balance between economic resilience and growing concerns around inflation, geopolitical risk and potential AI-driven disruption. Top contributors to performance: The Fund’s allocation to collateralized loan obligations was the primary contributor to relative performance. An allocation to asset-backed securities also contributed to relative performance. Top detractors from performance: The Fund’s rates positioning detracted from relative performance. The Fund’s allocation to investment grade corporate bonds also detracted from relative performance. |
|
| Performance Past Does Not Indicate Future [Text] |
The Fund's past performance is no guarantee of future results.
|
|
| Line Graph [Table Text Block] |
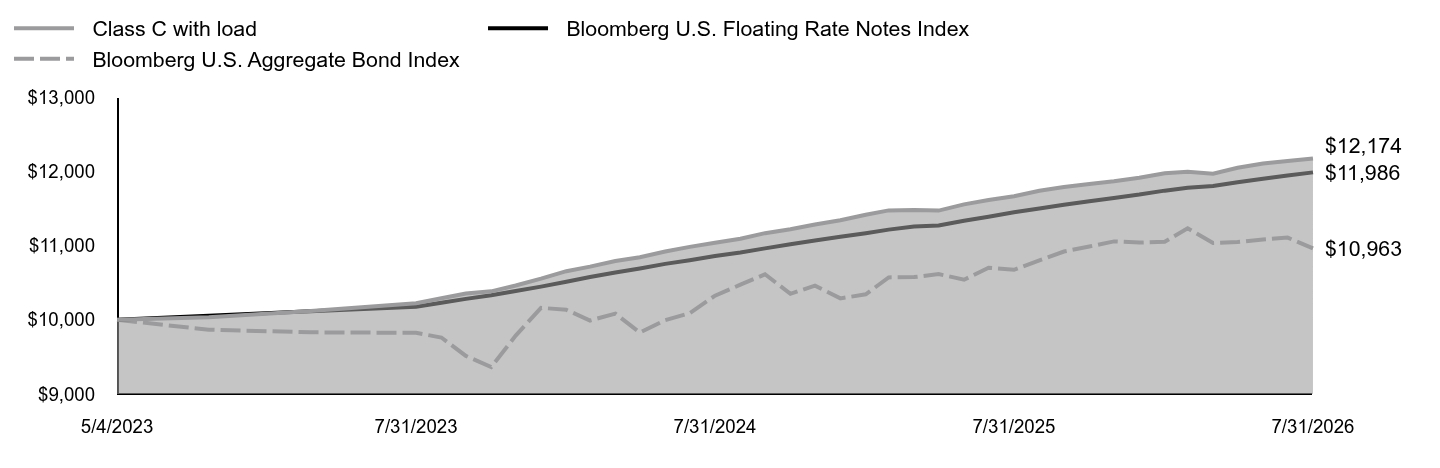 Table Summary | Class C with load | Bloomberg U.S. Floating Rate Notes Index | Bloomberg U.S. Aggregate Bond Index |
|---|
5/4/2023 | $10,000 | $10,000 | $10,000 |
|---|
5/31/2023 | $10,035 | $10,056 | $9,866 |
|---|
6/30/2023 | $10,118 | $10,116 | $9,831 |
|---|
7/31/2023 | $10,223 | $10,176 | $9,824 |
|---|
8/31/2023 | $10,290 | $10,230 | $9,761 |
|---|
9/30/2023 | $10,355 | $10,282 | $9,513 |
|---|
10/31/2023 | $10,383 | $10,331 | $9,363 |
|---|
11/30/2023 | $10,462 | $10,387 | $9,787 |
|---|
12/31/2023 | $10,554 | $10,447 | $10,161 |
|---|
1/31/2024 | $10,655 | $10,513 | $10,134 |
|---|
2/29/2024 | $10,716 | $10,576 | $9,990 |
|---|
3/31/2024 | $10,791 | $10,636 | $10,083 |
|---|
4/30/2024 | $10,843 | $10,692 | $9,828 |
|---|
5/31/2024 | $10,919 | $10,753 | $9,995 |
|---|
6/30/2024 | $10,982 | $10,803 | $10,089 |
|---|
7/31/2024 | $11,039 | $10,859 | $10,325 |
|---|
8/31/2024 | $11,093 | $10,907 | $10,473 |
|---|
9/30/2024 | $11,167 | $10,962 | $10,613 |
|---|
10/31/2024 | $11,221 | $11,018 | $10,350 |
|---|
11/30/2024 | $11,283 | $11,067 | $10,460 |
|---|
12/31/2024 | $11,342 | $11,118 | $10,288 |
|---|
1/31/2025 | $11,416 | $11,167 | $10,343 |
|---|
2/28/2025 | $11,474 | $11,215 | $10,571 |
|---|
3/31/2025 | $11,479 | $11,256 | $10,575 |
|---|
4/30/2025 | $11,471 | $11,271 | $10,616 |
|---|
5/31/2025 | $11,555 | $11,334 | $10,540 |
|---|
6/30/2025 | $11,614 | $11,389 | $10,702 |
|---|
7/31/2025 | $11,665 | $11,449 | $10,674 |
|---|
8/31/2025 | $11,739 | $11,499 | $10,802 |
|---|
9/30/2025 | $11,790 | $11,549 | $10,920 |
|---|
10/31/2025 | $11,830 | $11,597 | $10,988 |
|---|
11/30/2025 | $11,867 | $11,642 | $11,056 |
|---|
12/31/2025 | $11,915 | $11,687 | $11,040 |
|---|
1/31/2026 | $11,974 | $11,740 | $11,051 |
|---|
2/28/2026 | $11,993 | $11,779 | $11,232 |
|---|
3/31/2026 | $11,967 | $11,802 | $11,034 |
|---|
4/30/2026 | $12,048 | $11,852 | $11,047 |
|---|
5/31/2026 | $12,105 | $11,901 | $11,081 |
|---|
6/30/2026 | $12,138 | $11,944 | $11,108 |
|---|
7/31/2026 | $12,174 | $11,986 | $10,963 |
|---|
|
|
| Average Annual Return [Table Text Block] |
Table SummaryAATR | 1 Year | Since Inception
5/4/23 |
|---|
Class C at NAV | 4.36% | 6.26% |
|---|
Class C with sales charge | 3.37% | 6.26% |
|---|
Bloomberg U.S. Floating Rate Notes Index | 4.69% | 5.75% |
|---|
Bloomberg U.S. Aggregate Bond Index | 2.71% | 2.88% |
|---|
|
|
| Performance Inception Date |
May 04, 2023
|
|
| No Deduction of Taxes [Text Block] |
The returns do not reflect the deduction of taxes that a shareholder would pay on Fund distributions or redemption of Fund shares.
|
|
| AssetsNet |
$ 4,995,204,689
|
|
| Holdings Count | Holding |
787
|
|
| Advisory Fees Paid, Amount |
$ 7,999,234
|
|
| InvestmentCompanyPortfolioTurnover |
100.00%
|
|
| Additional Fund Statistics [Text Block] |
Table SummaryTotal Net Assets | $4,995,204,689 |
|---|
# of Portfolio Holdings | 787 |
|---|
Portfolio Turnover Rate | 100% |
|---|
Total Advisory Fees Paid | $7,999,234 |
|---|
|
|
| Holdings [Text Block] |
Table SummaryPortfolio Holdings Presented by Portfolio Allocation | %Footnote Reference* |
|---|
Asset-Backed Securities | 63.66% | Corporate Bonds | 7.55% | Floating Rate Loans | 8.80% | Foreign Government Obligations | 0.97% | Government Sponsored Enterprises Collateralized Mortgage Obligations | 5.78% | Non-Agency Commercial Mortgage-Backed Securities | 6.88% | U.S. Treasury Obligations | 5.16% | Repurchase Agreements | 1.14% | Money Market FundsFootnote Reference** | 0.05% | Time DepositsFootnote Reference** | 0.01% | Total | 100.00% | | Footnote | Description | Footnote* | Represents percent of total investments, which excludes derivatives. | Footnote** | Securities were purchased with the cash collateral from loaned securities. |
|
|
| Material Fund Change [Text Block] |
This is a summary of certain changes to the Fund that occurred during the reporting period, except as otherwise noted. For more information contact 888-522-2388. Effective December 1, 2025, the Fund's Expense Limitation Agreement expired and was not renewed. Prior to that date, the Adviser contractually agreed to limit total net annual operating expenses, excluding 12b-1 fees and acquired fund fees and expenses, interest-related expenses, taxes, expenses related to litigation and potential litigation, and extraordinary expenses, to an annual rate of 0.35%. |
|
| Material Fund Change Expenses [Text Block] |
Effective December 1, 2025, the Fund's Expense Limitation Agreement expired and was not renewed. Prior to that date, the Adviser contractually agreed to limit total net annual operating expenses, excluding 12b-1 fees and acquired fund fees and expenses, interest-related expenses, taxes, expenses related to litigation and potential litigation, and extraordinary expenses, to an annual rate of 0.35%.
|
|
| Summary of Change Legend [Text Block] |
This is a summary of certain changes to the Fund that occurred during the reporting period, except as otherwise noted. For more information contact 888-522-2388.
|
|
| Updated Prospectus Phone Number |
888-522-2388
|
|
| C000241947 |
|
|
| Shareholder Report [Line Items] |
|
|
| Fund Name |
Lord Abbett Investment Grade Floating Rate Fund
|
|
| Class Name |
Class F
|
|
| Trading Symbol |
LGRFX
|
|
| Annual or Semi-Annual Statement [Text Block] |
This annual shareholder report contains important information about the Lord Abbett Investment Grade Floating Rate Fund for the period of August 1, 2025 to July 31, 2026 (the "reporting period").
|
|
| Additional Information [Text Block] |
You can find additional information about the Fund at lordabbett.com/FundDocuments. You can also request this information by contacting us at 888-522-2388.
|
|
| Material Fund Change Notice [Text Block] |
This report describes changes to the Fund that occurred during the reporting period.
|
|
| Additional Information Phone Number |
888-522-2388
|
|
| Additional Information Website |
<span style="box-sizing: border-box; color: rgb(0, 0, 0); display: inline; flex-wrap: nowrap; font-size: 13.3333px; font-weight: 400; grid-area: auto; line-height: 20px; margin: 0px; overflow: visible; text-align: left; text-align-last: auto; white-space-collapse: preserve-breaks;">lordabbett.com/FundDocuments</span>
|
|
| Expenses [Text Block] |
What were the Fund costs for the reporting period?(based on a hypothetical $10,000 investment) Table SummaryClass Name | Costs of a $10,000 investment | Costs paid as a percentage of a $10,000 investment |
|---|
Class F | $48 | 0.47% |
|---|
|
|
| Expenses Paid, Amount |
$ 48
|
|
| Expense Ratio, Percent |
0.47%
|
|
| Factors Affecting Performance [Text Block] |
How did the Fund perform last year and what affected its performance?For the fiscal year ended July 31, 2026, the Fund returned 5.31%, reflecting performance at the net asset value (NAV) of Class F shares with all distributions reinvested, compared to the 4.69% return of a securities market index with investment characteristics similar to those of the Fund, the Bloomberg U.S. Floating Rate Notes Index. The Fund's broad-based securities market index, the Bloomberg U.S. Aggregate Bond Index, returned 2.71% over the same period. From August 2025 through July 2026, U.S. fixed income markets were supported by resilient economic growth, solid consumer spending, healthy corporate earnings and continued investment, particularly in artificial intelligence ("AI"). Markets also faced headwinds from rising inflation pressures and heightened geopolitical tensions, including the U.S.-Iran conflict and its impact on energy prices. These developments contributed to periods of elevated volatility and shifting expectations for Federal Reserve policy. Despite these challenges, credit markets remained broadly constructive, supported by resilient corporate fundamentals and continued demand for income. Overall, the period reflected a balance between economic resilience and growing concerns around inflation, geopolitical risk and potential AI-driven disruption. Top contributors to performance: The Fund’s allocation to collateralized loan obligations was the primary contributor to relative performance. An allocation to asset-backed securities also contributed to relative performance. Top detractors from performance: The Fund’s rates positioning detracted from relative performance. The Fund’s allocation to investment grade corporate bonds also detracted from relative performance. |
|
| Performance Past Does Not Indicate Future [Text] |
The Fund's past performance is no guarantee of future results.
|
|
| Line Graph [Table Text Block] |
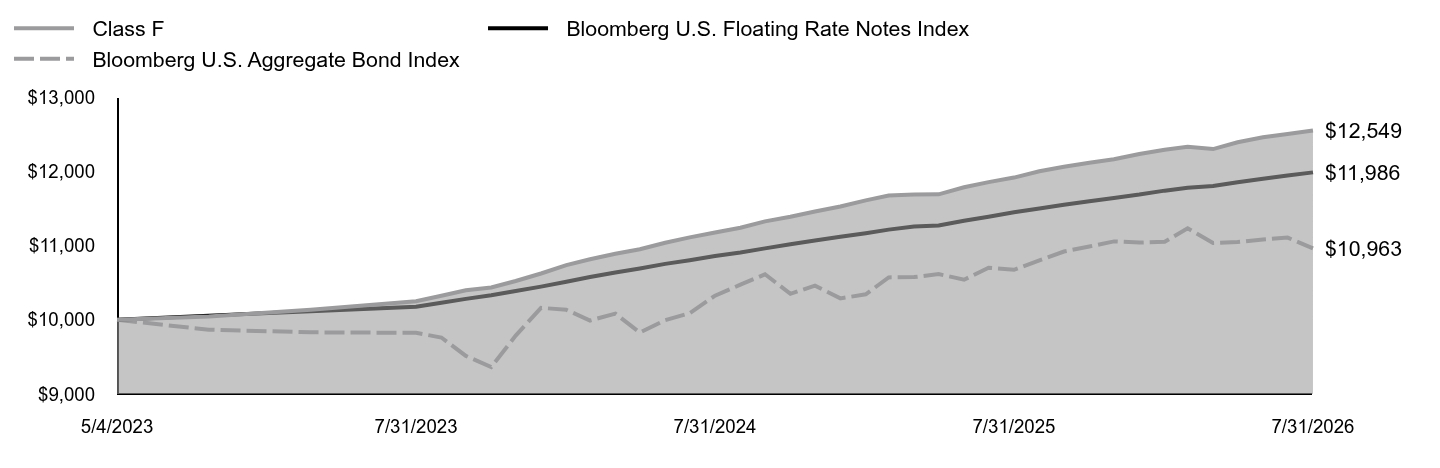 Table Summary | Class F | Bloomberg U.S. Floating Rate Notes Index | Bloomberg U.S. Aggregate Bond Index |
|---|
5/4/2023 | $10,000 | $10,000 | $10,000 |
|---|
5/31/2023 | $10,043 | $10,056 | $9,866 |
|---|
6/30/2023 | $10,134 | $10,116 | $9,831 |
|---|
7/31/2023 | $10,249 | $10,176 | $9,824 |
|---|
8/31/2023 | $10,324 | $10,230 | $9,761 |
|---|
9/30/2023 | $10,398 | $10,282 | $9,513 |
|---|
10/31/2023 | $10,435 | $10,331 | $9,363 |
|---|
11/30/2023 | $10,522 | $10,387 | $9,787 |
|---|
12/31/2023 | $10,624 | $10,447 | $10,161 |
|---|
1/31/2024 | $10,736 | $10,513 | $10,134 |
|---|
2/29/2024 | $10,816 | $10,576 | $9,990 |
|---|
3/31/2024 | $10,890 | $10,636 | $10,083 |
|---|
4/30/2024 | $10,951 | $10,692 | $9,828 |
|---|
5/31/2024 | $11,037 | $10,753 | $9,995 |
|---|
6/30/2024 | $11,110 | $10,803 | $10,089 |
|---|
7/31/2024 | $11,177 | $10,859 | $10,325 |
|---|
8/31/2024 | $11,241 | $10,907 | $10,473 |
|---|
9/30/2024 | $11,326 | $10,962 | $10,613 |
|---|
10/31/2024 | $11,388 | $11,018 | $10,350 |
|---|
11/30/2024 | $11,458 | $11,067 | $10,460 |
|---|
12/31/2024 | $11,526 | $11,118 | $10,288 |
|---|
1/31/2025 | $11,609 | $11,167 | $10,343 |
|---|
2/28/2025 | $11,675 | $11,215 | $10,571 |
|---|
3/31/2025 | $11,688 | $11,256 | $10,575 |
|---|
4/30/2025 | $11,690 | $11,271 | $10,616 |
|---|
5/31/2025 | $11,785 | $11,334 | $10,540 |
|---|
6/30/2025 | $11,855 | $11,389 | $10,702 |
|---|
7/31/2025 | $11,916 | $11,449 | $10,674 |
|---|
8/31/2025 | $12,002 | $11,499 | $10,802 |
|---|
9/30/2025 | $12,063 | $11,549 | $10,920 |
|---|
10/31/2025 | $12,115 | $11,597 | $10,988 |
|---|
11/30/2025 | $12,162 | $11,642 | $11,056 |
|---|
12/31/2025 | $12,233 | $11,687 | $11,040 |
|---|
1/31/2026 | $12,291 | $11,740 | $11,051 |
|---|
2/28/2026 | $12,330 | $11,779 | $11,232 |
|---|
3/31/2026 | $12,300 | $11,802 | $11,034 |
|---|
4/30/2026 | $12,392 | $11,852 | $11,047 |
|---|
5/31/2026 | $12,460 | $11,901 | $11,081 |
|---|
6/30/2026 | $12,502 | $11,944 | $11,108 |
|---|
7/31/2026 | $12,549 | $11,986 | $10,963 |
|---|
|
|
| Average Annual Return [Table Text Block] |
Table SummaryAATR | 1 Year | Since Inception
5/4/23 |
|---|
Class F at NAV | 5.31% | 7.26% |
|---|
Bloomberg U.S. Floating Rate Notes Index | 4.69% | 5.75% |
|---|
Bloomberg U.S. Aggregate Bond Index | 2.71% | 2.88% |
|---|
|
|
| Performance Inception Date |
May 04, 2023
|
|
| No Deduction of Taxes [Text Block] |
The returns do not reflect the deduction of taxes that a shareholder would pay on Fund distributions or redemption of Fund shares.
|
|
| AssetsNet |
$ 4,995,204,689
|
|
| Holdings Count | Holding |
787
|
|
| Advisory Fees Paid, Amount |
$ 7,999,234
|
|
| InvestmentCompanyPortfolioTurnover |
100.00%
|
|
| Additional Fund Statistics [Text Block] |
Table SummaryTotal Net Assets | $4,995,204,689 |
|---|
# of Portfolio Holdings | 787 |
|---|
Portfolio Turnover Rate | 100% |
|---|
Total Advisory Fees Paid | $7,999,234 |
|---|
|
|
| Holdings [Text Block] |
Table SummaryPortfolio Holdings Presented by Portfolio Allocation | %Footnote Reference* |
|---|
Asset-Backed Securities | 63.66% | Corporate Bonds | 7.55% | Floating Rate Loans | 8.80% | Foreign Government Obligations | 0.97% | Government Sponsored Enterprises Collateralized Mortgage Obligations | 5.78% | Non-Agency Commercial Mortgage-Backed Securities | 6.88% | U.S. Treasury Obligations | 5.16% | Repurchase Agreements | 1.14% | Money Market FundsFootnote Reference** | 0.05% | Time DepositsFootnote Reference** | 0.01% | Total | 100.00% | | Footnote | Description | Footnote* | Represents percent of total investments, which excludes derivatives. | Footnote** | Securities were purchased with the cash collateral from loaned securities. |
|
|
| Material Fund Change [Text Block] |
This is a summary of certain changes to the Fund that occurred during the reporting period, except as otherwise noted. For more information contact 888-522-2388. Effective December 1, 2025, the 0.10% distribution fee waiver on Class F shares expired, and the Fund's Expense Limitation Agreement expired and was not renewed. Prior to that date, the Adviser contractually agreed to limit total net annual operating expenses, excluding 12b-1 fees and acquired fund fees and expenses, interest-related expenses, taxes, expenses related to litigation and potential litigation, and extraordinary expenses, to an annual rate of 0.35%. |
|
| Material Fund Change Expenses [Text Block] |
Effective December 1, 2025, the 0.10% distribution fee waiver on Class F shares expired, and the Fund's Expense Limitation Agreement expired and was not renewed. Prior to that date, the Adviser contractually agreed to limit total net annual operating expenses, excluding 12b-1 fees and acquired fund fees and expenses, interest-related expenses, taxes, expenses related to litigation and potential litigation, and extraordinary expenses, to an annual rate of 0.35%.
|
|
| Summary of Change Legend [Text Block] |
This is a summary of certain changes to the Fund that occurred during the reporting period, except as otherwise noted. For more information contact 888-522-2388.
|
|
| Updated Prospectus Phone Number |
888-522-2388
|
|
| C000241946 |
|
|
| Shareholder Report [Line Items] |
|
|
| Fund Name |
Lord Abbett Investment Grade Floating Rate Fund
|
|
| Class Name |
Class F3
|
|
| Trading Symbol |
IGRNX
|
|
| Annual or Semi-Annual Statement [Text Block] |
This annual shareholder report contains important information about the Lord Abbett Investment Grade Floating Rate Fund for the period of August 1, 2025 to July 31, 2026 (the "reporting period").
|
|
| Additional Information [Text Block] |
You can find additional information about the Fund at lordabbett.com/FundDocuments. You can also request this information by contacting us at 888-522-2388.
|
|
| Material Fund Change Notice [Text Block] |
This report describes changes to the Fund that occurred during the reporting period.
|
|
| Additional Information Phone Number |
888-522-2388
|
|
| Additional Information Website |
<span style="box-sizing: border-box; color: rgb(0, 0, 0); display: inline; flex-wrap: nowrap; font-size: 13.3333px; font-weight: 400; grid-area: auto; line-height: 20px; margin: 0px; overflow: visible; text-align: left; text-align-last: auto; white-space-collapse: preserve-breaks;">lordabbett.com/FundDocuments</span>
|
|
| Expenses [Text Block] |
What were the Fund costs for the reporting period?(based on a hypothetical $10,000 investment) Table SummaryClass Name | Costs of a $10,000 investment | Costs paid as a percentage of a $10,000 investment |
|---|
Class F3 | $31 | 0.30% |
|---|
|
|
| Expenses Paid, Amount |
$ 31
|
|
| Expense Ratio, Percent |
0.30%
|
|
| Factors Affecting Performance [Text Block] |
How did the Fund perform last year and what affected its performance?For the fiscal year ended July 31, 2026, the Fund returned 5.37%, reflecting performance at the net asset value (NAV) of Class F3 shares with all distributions reinvested, compared to the 4.69% return of a securities market index with investment characteristics similar to those of the Fund, the Bloomberg U.S. Floating Rate Notes Index. The Fund's broad-based securities market index, the Bloomberg U.S. Aggregate Bond Index, returned 2.71% over the same period. From August 2025 through July 2026, U.S. fixed income markets were supported by resilient economic growth, solid consumer spending, healthy corporate earnings and continued investment, particularly in artificial intelligence ("AI"). Markets also faced headwinds from rising inflation pressures and heightened geopolitical tensions, including the U.S.-Iran conflict and its impact on energy prices. These developments contributed to periods of elevated volatility and shifting expectations for Federal Reserve policy. Despite these challenges, credit markets remained broadly constructive, supported by resilient corporate fundamentals and continued demand for income. Overall, the period reflected a balance between economic resilience and growing concerns around inflation, geopolitical risk and potential AI-driven disruption. Top contributors to performance: The Fund’s allocation to collateralized loan obligations was the primary contributor to relative performance. An allocation to asset-backed securities also contributed to relative performance. Top detractors from performance: The Fund’s rates positioning detracted from relative performance. The Fund’s allocation to investment grade corporate bonds also detracted from relative performance. |
|
| Performance Past Does Not Indicate Future [Text] |
The Fund's past performance is no guarantee of future results.
|
|
| Line Graph [Table Text Block] |
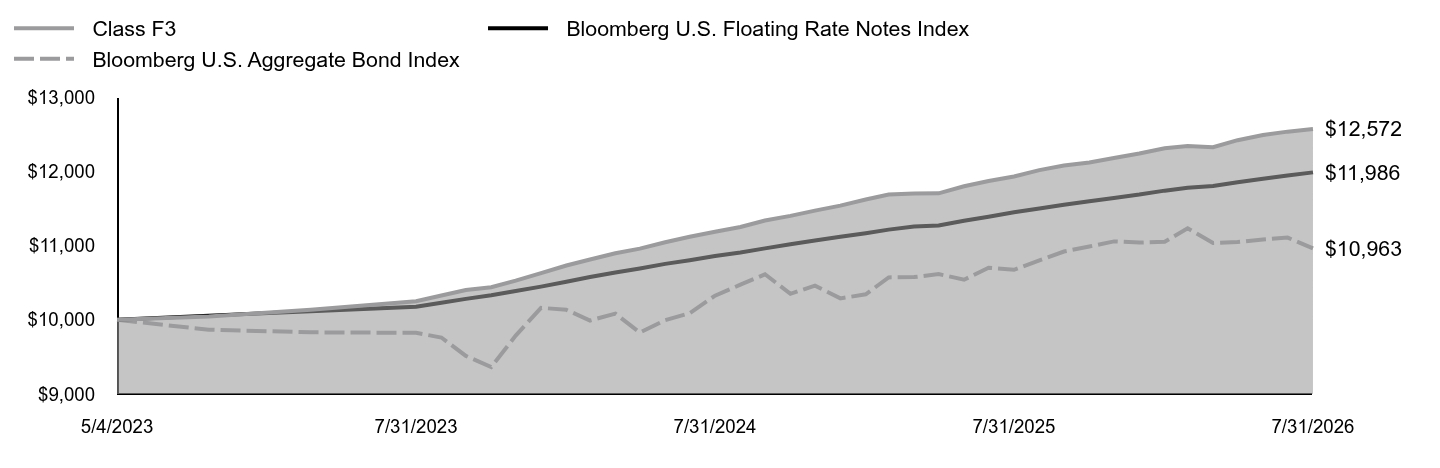 Table Summary | Class F3 | Bloomberg U.S. Floating Rate Notes Index | Bloomberg U.S. Aggregate Bond Index |
|---|
5/4/2023 | $10,000 | $10,000 | $10,000 |
|---|
5/31/2023 | $10,044 | $10,056 | $9,866 |
|---|
6/30/2023 | $10,136 | $10,116 | $9,831 |
|---|
7/31/2023 | $10,250 | $10,176 | $9,824 |
|---|
8/31/2023 | $10,327 | $10,230 | $9,761 |
|---|
9/30/2023 | $10,401 | $10,282 | $9,513 |
|---|
10/31/2023 | $10,439 | $10,331 | $9,363 |
|---|
11/30/2023 | $10,527 | $10,387 | $9,787 |
|---|
12/31/2023 | $10,629 | $10,447 | $10,161 |
|---|
1/31/2024 | $10,731 | $10,513 | $10,134 |
|---|
2/29/2024 | $10,812 | $10,576 | $9,990 |
|---|
3/31/2024 | $10,897 | $10,636 | $10,083 |
|---|
4/30/2024 | $10,959 | $10,692 | $9,828 |
|---|
5/31/2024 | $11,045 | $10,753 | $9,995 |
|---|
6/30/2024 | $11,119 | $10,803 | $10,089 |
|---|
7/31/2024 | $11,187 | $10,859 | $10,325 |
|---|
8/31/2024 | $11,251 | $10,907 | $10,473 |
|---|
9/30/2024 | $11,337 | $10,962 | $10,613 |
|---|
10/31/2024 | $11,400 | $11,018 | $10,350 |
|---|
11/30/2024 | $11,471 | $11,067 | $10,460 |
|---|
12/31/2024 | $11,538 | $11,118 | $10,288 |
|---|
1/31/2025 | $11,621 | $11,167 | $10,343 |
|---|
2/28/2025 | $11,688 | $11,215 | $10,571 |
|---|
3/31/2025 | $11,702 | $11,256 | $10,575 |
|---|
4/30/2025 | $11,704 | $11,271 | $10,616 |
|---|
5/31/2025 | $11,799 | $11,334 | $10,540 |
|---|
6/30/2025 | $11,869 | $11,389 | $10,702 |
|---|
7/31/2025 | $11,931 | $11,449 | $10,674 |
|---|
8/31/2025 | $12,017 | $11,499 | $10,802 |
|---|
9/30/2025 | $12,079 | $11,549 | $10,920 |
|---|
10/31/2025 | $12,120 | $11,597 | $10,988 |
|---|
11/30/2025 | $12,180 | $11,642 | $11,056 |
|---|
12/31/2025 | $12,240 | $11,687 | $11,040 |
|---|
1/31/2026 | $12,312 | $11,740 | $11,051 |
|---|
2/28/2026 | $12,342 | $11,779 | $11,232 |
|---|
3/31/2026 | $12,326 | $11,802 | $11,034 |
|---|
4/30/2026 | $12,420 | $11,852 | $11,047 |
|---|
5/31/2026 | $12,490 | $11,901 | $11,081 |
|---|
6/30/2026 | $12,535 | $11,944 | $11,108 |
|---|
7/31/2026 | $12,572 | $11,986 | $10,963 |
|---|
|
|
| Average Annual Return [Table Text Block] |
Table SummaryAATR | 1 Year | Since Inception
5/4/23 |
|---|
Class F3 at NAV | 5.37% | 7.32% |
|---|
Bloomberg U.S. Floating Rate Notes Index | 4.69% | 5.75% |
|---|
Bloomberg U.S. Aggregate Bond Index | 2.71% | 2.88% |
|---|
|
|
| Performance Inception Date |
May 04, 2023
|
|
| No Deduction of Taxes [Text Block] |
The returns do not reflect the deduction of taxes that a shareholder would pay on Fund distributions or redemption of Fund shares.
|
|
| AssetsNet |
$ 4,995,204,689
|
|
| Holdings Count | Holding |
787
|
|
| Advisory Fees Paid, Amount |
$ 7,999,234
|
|
| InvestmentCompanyPortfolioTurnover |
100.00%
|
|
| Additional Fund Statistics [Text Block] |
Table SummaryTotal Net Assets | $4,995,204,689 |
|---|
# of Portfolio Holdings | 787 |
|---|
Portfolio Turnover Rate | 100% |
|---|
Total Advisory Fees Paid | $7,999,234 |
|---|
|
|
| Holdings [Text Block] |
Table SummaryPortfolio Holdings Presented by Portfolio Allocation | %Footnote Reference* |
|---|
Asset-Backed Securities | 63.66% | Corporate Bonds | 7.55% | Floating Rate Loans | 8.80% | Foreign Government Obligations | 0.97% | Government Sponsored Enterprises Collateralized Mortgage Obligations | 5.78% | Non-Agency Commercial Mortgage-Backed Securities | 6.88% | U.S. Treasury Obligations | 5.16% | Repurchase Agreements | 1.14% | Money Market FundsFootnote Reference** | 0.05% | Time DepositsFootnote Reference** | 0.01% | Total | 100.00% | | Footnote | Description | Footnote* | Represents percent of total investments, which excludes derivatives. | Footnote** | Securities were purchased with the cash collateral from loaned securities. |
|
|
| Material Fund Change [Text Block] |
This is a summary of certain changes to the Fund that occurred during the reporting period, except as otherwise noted. For more information contact 888-522-2388. Effective December 1, 2025, the Fund's Expense Limitation Agreement expired and was not renewed. Prior to that date, the Adviser contractually agreed to limit total net annual operating expenses, excluding 12b-1 fees and acquired fund fees and expenses, interest-related expenses, taxes, expenses related to litigation and potential litigation, and extraordinary expenses, to an annual rate of 0.34%. |
|
| Material Fund Change Expenses [Text Block] |
Effective December 1, 2025, the Fund's Expense Limitation Agreement expired and was not renewed. Prior to that date, the Adviser contractually agreed to limit total net annual operating expenses, excluding 12b-1 fees and acquired fund fees and expenses, interest-related expenses, taxes, expenses related to litigation and potential litigation, and extraordinary expenses, to an annual rate of 0.34%.
|
|
| Summary of Change Legend [Text Block] |
This is a summary of certain changes to the Fund that occurred during the reporting period, except as otherwise noted. For more information contact 888-522-2388.
|
|
| Updated Prospectus Phone Number |
888-522-2388
|
|
| C000241945 |
|
|
| Shareholder Report [Line Items] |
|
|
| Fund Name |
Lord Abbett Investment Grade Floating Rate Fund
|
|
| Class Name |
Class I
|
|
| Trading Symbol |
LGRYX
|
|
| Annual or Semi-Annual Statement [Text Block] |
This annual shareholder report contains important information about the Lord Abbett Investment Grade Floating Rate Fund for the period of August 1, 2025 to July 31, 2026 (the "reporting period").
|
|
| Additional Information [Text Block] |
You can find additional information about the Fund at lordabbett.com/FundDocuments. You can also request this information by contacting us at 888-522-2388.
|
|
| Material Fund Change Notice [Text Block] |
This report describes changes to the Fund that occurred during the reporting period.
|
|
| Additional Information Phone Number |
888-522-2388
|
|
| Additional Information Website |
<span style="box-sizing: border-box; color: rgb(0, 0, 0); display: inline; flex-wrap: nowrap; font-size: 13.3333px; font-weight: 400; grid-area: auto; line-height: 20px; margin: 0px; overflow: visible; text-align: left; text-align-last: auto; white-space-collapse: preserve-breaks;">lordabbett.com/FundDocuments</span>
|
|
| Expenses [Text Block] |
What were the Fund costs for the reporting period?(based on a hypothetical $10,000 investment) Table SummaryClass Name | Costs of a $10,000 investment | Costs paid as a percentage of a $10,000 investment |
|---|
Class I | $41 | 0.40% |
|---|
|
|
| Expenses Paid, Amount |
$ 41
|
|
| Expense Ratio, Percent |
0.40%
|
|
| Factors Affecting Performance [Text Block] |
How did the Fund perform last year and what affected its performance?For the fiscal year ended July 31, 2026, the Fund returned 5.38%, reflecting performance at the net asset value (NAV) of Class I shares with all distributions reinvested, compared to the 4.69% return of a securities market index with investment characteristics similar to those of the Fund, the Bloomberg U.S. Floating Rate Notes Index. The Fund's broad-based securities market index, the Bloomberg U.S. Aggregate Bond Index, returned 2.71% over the same period. From August 2025 through July 2026, U.S. fixed income markets were supported by resilient economic growth, solid consumer spending, healthy corporate earnings and continued investment, particularly in artificial intelligence ("AI"). Markets also faced headwinds from rising inflation pressures and heightened geopolitical tensions, including the U.S.-Iran conflict and its impact on energy prices. These developments contributed to periods of elevated volatility and shifting expectations for Federal Reserve policy. Despite these challenges, credit markets remained broadly constructive, supported by resilient corporate fundamentals and continued demand for income. Overall, the period reflected a balance between economic resilience and growing concerns around inflation, geopolitical risk and potential AI-driven disruption. Top contributors to performance: The Fund’s allocation to collateralized loan obligations was the primary contributor to relative performance. An allocation to asset-backed securities also contributed to relative performance. Top detractors from performance: The Fund’s rates positioning detracted from relative performance. The Fund’s allocation to investment grade corporate bonds also detracted from relative performance. |
|
| Performance Past Does Not Indicate Future [Text] |
The Fund's past performance is no guarantee of future results.
|
|
| Line Graph [Table Text Block] |
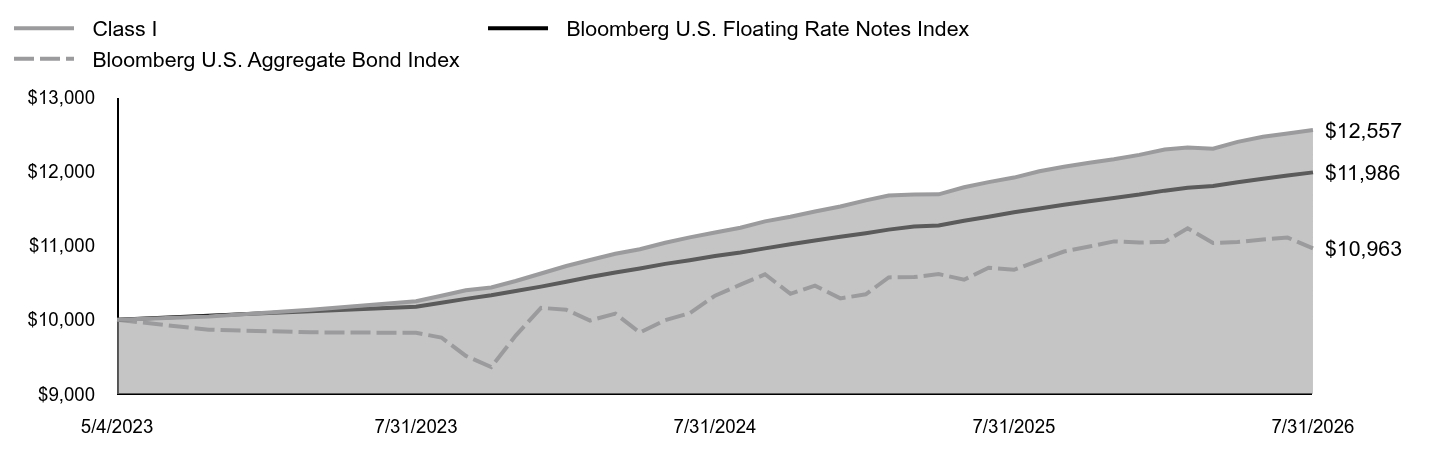 Table Summary | Class I | Bloomberg U.S. Floating Rate Notes Index | Bloomberg U.S. Aggregate Bond Index |
|---|
5/4/2023 | $10,000 | $10,000 | $10,000 |
|---|
5/31/2023 | $10,044 | $10,056 | $9,866 |
|---|
6/30/2023 | $10,134 | $10,116 | $9,831 |
|---|
7/31/2023 | $10,249 | $10,176 | $9,824 |
|---|
8/31/2023 | $10,324 | $10,230 | $9,761 |
|---|
9/30/2023 | $10,398 | $10,282 | $9,513 |
|---|
10/31/2023 | $10,435 | $10,331 | $9,363 |
|---|
11/30/2023 | $10,522 | $10,387 | $9,787 |
|---|
12/31/2023 | $10,624 | $10,447 | $10,161 |
|---|
1/31/2024 | $10,725 | $10,513 | $10,134 |
|---|
2/29/2024 | $10,805 | $10,576 | $9,990 |
|---|
3/31/2024 | $10,890 | $10,636 | $10,083 |
|---|
4/30/2024 | $10,951 | $10,692 | $9,828 |
|---|
5/31/2024 | $11,037 | $10,753 | $9,995 |
|---|
6/30/2024 | $11,110 | $10,803 | $10,089 |
|---|
7/31/2024 | $11,177 | $10,859 | $10,325 |
|---|
8/31/2024 | $11,241 | $10,907 | $10,473 |
|---|
9/30/2024 | $11,326 | $10,962 | $10,613 |
|---|
10/31/2024 | $11,388 | $11,018 | $10,350 |
|---|
11/30/2024 | $11,459 | $11,067 | $10,460 |
|---|
12/31/2024 | $11,526 | $11,118 | $10,288 |
|---|
1/31/2025 | $11,609 | $11,167 | $10,343 |
|---|
2/28/2025 | $11,675 | $11,215 | $10,571 |
|---|
3/31/2025 | $11,688 | $11,256 | $10,575 |
|---|
4/30/2025 | $11,690 | $11,271 | $10,616 |
|---|
5/31/2025 | $11,785 | $11,334 | $10,540 |
|---|
6/30/2025 | $11,855 | $11,389 | $10,702 |
|---|
7/31/2025 | $11,916 | $11,449 | $10,674 |
|---|
8/31/2025 | $12,002 | $11,499 | $10,802 |
|---|
9/30/2025 | $12,063 | $11,549 | $10,920 |
|---|
10/31/2025 | $12,115 | $11,597 | $10,988 |
|---|
11/30/2025 | $12,162 | $11,642 | $11,056 |
|---|
12/31/2025 | $12,222 | $11,687 | $11,040 |
|---|
1/31/2026 | $12,293 | $11,740 | $11,051 |
|---|
2/28/2026 | $12,321 | $11,779 | $11,232 |
|---|
3/31/2026 | $12,305 | $11,802 | $11,034 |
|---|
4/30/2026 | $12,397 | $11,852 | $11,047 |
|---|
5/31/2026 | $12,466 | $11,901 | $11,081 |
|---|
6/30/2026 | $12,510 | $11,944 | $11,108 |
|---|
7/31/2026 | $12,557 | $11,986 | $10,963 |
|---|
|
|
| Average Annual Return [Table Text Block] |
Table SummaryAATR | 1 Year | Since Inception
5/4/23 |
|---|
Class I at NAV | 5.38% | 7.28% |
|---|
Bloomberg U.S. Floating Rate Notes Index | 4.69% | 5.75% |
|---|
Bloomberg U.S. Aggregate Bond Index | 2.71% | 2.88% |
|---|
|
|
| Performance Inception Date |
May 04, 2023
|
|
| No Deduction of Taxes [Text Block] |
The returns do not reflect the deduction of taxes that a shareholder would pay on Fund distributions or redemption of Fund shares.
|
|
| AssetsNet |
$ 4,995,204,689
|
|
| Holdings Count | Holding |
787
|
|
| Advisory Fees Paid, Amount |
$ 7,999,234
|
|
| InvestmentCompanyPortfolioTurnover |
100.00%
|
|
| Additional Fund Statistics [Text Block] |
Table SummaryTotal Net Assets | $4,995,204,689 |
|---|
# of Portfolio Holdings | 787 |
|---|
Portfolio Turnover Rate | 100% |
|---|
Total Advisory Fees Paid | $7,999,234 |
|---|
|
|
| Holdings [Text Block] |
Table SummaryPortfolio Holdings Presented by Portfolio Allocation | %Footnote Reference* |
|---|
Asset-Backed Securities | 63.66% | Corporate Bonds | 7.55% | Floating Rate Loans | 8.80% | Foreign Government Obligations | 0.97% | Government Sponsored Enterprises Collateralized Mortgage Obligations | 5.78% | Non-Agency Commercial Mortgage-Backed Securities | 6.88% | U.S. Treasury Obligations | 5.16% | Repurchase Agreements | 1.14% | Money Market FundsFootnote Reference** | 0.05% | Time DepositsFootnote Reference** | 0.01% | Total | 100.00% | | Footnote | Description | Footnote* | Represents percent of total investments, which excludes derivatives. | Footnote** | Securities were purchased with the cash collateral from loaned securities. |
|
|
| Material Fund Change [Text Block] |
This is a summary of certain changes to the Fund that occurred during the reporting period, except as otherwise noted. For more information contact 888-522-2388. Effective December 1, 2025, the Fund's Expense Limitation Agreement expired and was not renewed. Prior to that date, the Adviser contractually agreed to limit total net annual operating expenses, excluding 12b-1 fees and acquired fund fees and expenses, interest-related expenses, taxes, expenses related to litigation and potential litigation, and extraordinary expenses, to an annual rate of 0.35%. |
|
| Material Fund Change Expenses [Text Block] |
Effective December 1, 2025, the Fund's Expense Limitation Agreement expired and was not renewed. Prior to that date, the Adviser contractually agreed to limit total net annual operating expenses, excluding 12b-1 fees and acquired fund fees and expenses, interest-related expenses, taxes, expenses related to litigation and potential litigation, and extraordinary expenses, to an annual rate of 0.35%.
|
|
| Summary of Change Legend [Text Block] |
This is a summary of certain changes to the Fund that occurred during the reporting period, except as otherwise noted. For more information contact 888-522-2388.
|
|
| Updated Prospectus Phone Number |
888-522-2388
|
|
| C000241941 |
|
|
| Shareholder Report [Line Items] |
|
|
| Fund Name |
Lord Abbett Investment Grade Floating Rate Fund
|
|
| Class Name |
Class R5
|
|
| Trading Symbol |
IGRSX
|
|
| Annual or Semi-Annual Statement [Text Block] |
This annual shareholder report contains important information about the Lord Abbett Investment Grade Floating Rate Fund for the period of August 1, 2025 to July 31, 2026 (the "reporting period").
|
|
| Additional Information [Text Block] |
You can find additional information about the Fund at lordabbett.com/FundDocuments. You can also request this information by contacting us at 888-522-2388.
|
|
| Material Fund Change Notice [Text Block] |
This report describes changes to the Fund that occurred during the reporting period.
|
|
| Additional Information Phone Number |
888-522-2388
|
|
| Additional Information Website |
<span style="box-sizing: border-box; color: rgb(0, 0, 0); display: inline; flex-wrap: nowrap; font-size: 13.3333px; font-weight: 400; grid-area: auto; line-height: 20px; margin: 0px; overflow: visible; text-align: left; text-align-last: auto; white-space-collapse: preserve-breaks;">lordabbett.com/FundDocuments</span>
|
|
| Expenses [Text Block] |
What were the Fund costs for the reporting period?(based on a hypothetical $10,000 investment) Table SummaryClass Name | Costs of a $10,000 investment | Costs paid as a percentage of a $10,000 investment |
|---|
Class R5 | $40 | 0.39% |
|---|
|
|
| Expenses Paid, Amount |
$ 40
|
|
| Expense Ratio, Percent |
0.39%
|
|
| Factors Affecting Performance [Text Block] |
How did the Fund perform last year and what affected its performance?For the fiscal year ended July 31, 2026, the Fund returned 5.29%, reflecting performance at the net asset value (NAV) of Class R5 shares with all distributions reinvested, compared to the 4.69% return of a securities market index with investment characteristics similar to those of the Fund, the Bloomberg U.S. Floating Rate Notes Index. The Fund's broad-based securities market index, the Bloomberg U.S. Aggregate Bond Index, returned 2.71% over the same period. From August 2025 through July 2026, U.S. fixed income markets were supported by resilient economic growth, solid consumer spending, healthy corporate earnings and continued investment, particularly in artificial intelligence ("AI"). Markets also faced headwinds from rising inflation pressures and heightened geopolitical tensions, including the U.S.-Iran conflict and its impact on energy prices. These developments contributed to periods of elevated volatility and shifting expectations for Federal Reserve policy. Despite these challenges, credit markets remained broadly constructive, supported by resilient corporate fundamentals and continued demand for income. Overall, the period reflected a balance between economic resilience and growing concerns around inflation, geopolitical risk and potential AI-driven disruption. Top contributors to performance: The Fund’s allocation to collateralized loan obligations was the primary contributor to relative performance. An allocation to asset-backed securities also contributed to relative performance. Top detractors from performance: The Fund’s rates positioning detracted from relative performance. The Fund’s allocation to investment grade corporate bonds also detracted from relative performance. |
|
| Performance Past Does Not Indicate Future [Text] |
The Fund's past performance is no guarantee of future results.
|
|
| Line Graph [Table Text Block] |
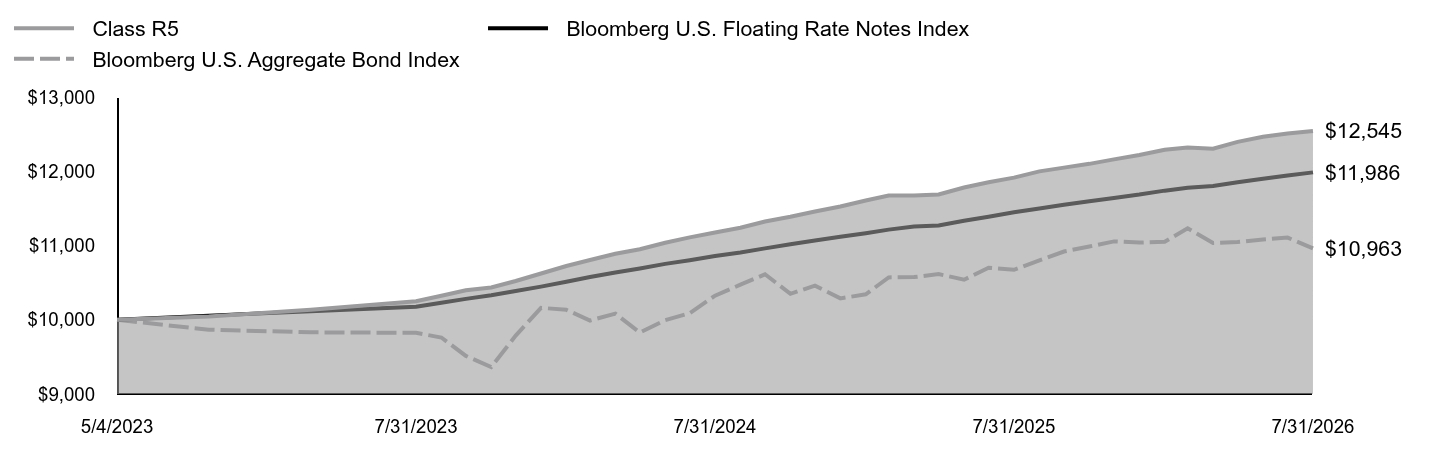 Table Summary | Class R5 | Bloomberg U.S. Floating Rate Notes Index | Bloomberg U.S. Aggregate Bond Index |
|---|
5/4/2023 | $10,000 | $10,000 | $10,000 |
|---|
5/31/2023 | $10,043 | $10,056 | $9,866 |
|---|
6/30/2023 | $10,134 | $10,116 | $9,831 |
|---|
7/31/2023 | $10,249 | $10,176 | $9,824 |
|---|
8/31/2023 | $10,324 | $10,230 | $9,761 |
|---|
9/30/2023 | $10,398 | $10,282 | $9,513 |
|---|
10/31/2023 | $10,435 | $10,331 | $9,363 |
|---|
11/30/2023 | $10,522 | $10,387 | $9,787 |
|---|
12/31/2023 | $10,624 | $10,447 | $10,161 |
|---|
1/31/2024 | $10,725 | $10,513 | $10,134 |
|---|
2/29/2024 | $10,805 | $10,576 | $9,990 |
|---|
3/31/2024 | $10,890 | $10,636 | $10,083 |
|---|
4/30/2024 | $10,951 | $10,692 | $9,828 |
|---|
5/31/2024 | $11,037 | $10,753 | $9,995 |
|---|
6/30/2024 | $11,110 | $10,803 | $10,089 |
|---|
7/31/2024 | $11,177 | $10,859 | $10,325 |
|---|
8/31/2024 | $11,241 | $10,907 | $10,473 |
|---|
9/30/2024 | $11,325 | $10,962 | $10,613 |
|---|
10/31/2024 | $11,388 | $11,018 | $10,350 |
|---|
11/30/2024 | $11,458 | $11,067 | $10,460 |
|---|
12/31/2024 | $11,526 | $11,118 | $10,288 |
|---|
1/31/2025 | $11,608 | $11,167 | $10,343 |
|---|
2/28/2025 | $11,674 | $11,215 | $10,571 |
|---|
3/31/2025 | $11,676 | $11,256 | $10,575 |
|---|
4/30/2025 | $11,689 | $11,271 | $10,616 |
|---|
5/31/2025 | $11,783 | $11,334 | $10,540 |
|---|
6/30/2025 | $11,854 | $11,389 | $10,702 |
|---|
7/31/2025 | $11,915 | $11,449 | $10,674 |
|---|
8/31/2025 | $12,000 | $11,499 | $10,802 |
|---|
9/30/2025 | $12,050 | $11,549 | $10,920 |
|---|
10/31/2025 | $12,101 | $11,597 | $10,988 |
|---|
11/30/2025 | $12,161 | $11,642 | $11,056 |
|---|
12/31/2025 | $12,220 | $11,687 | $11,040 |
|---|
1/31/2026 | $12,291 | $11,740 | $11,051 |
|---|
2/28/2026 | $12,320 | $11,779 | $11,232 |
|---|
3/31/2026 | $12,304 | $11,802 | $11,034 |
|---|
4/30/2026 | $12,397 | $11,852 | $11,047 |
|---|
5/31/2026 | $12,466 | $11,901 | $11,081 |
|---|
6/30/2026 | $12,510 | $11,944 | $11,108 |
|---|
7/31/2026 | $12,545 | $11,986 | $10,963 |
|---|
|
|
| Average Annual Return [Table Text Block] |
Table SummaryAATR | 1 Year | Since Inception
5/4/23 |
|---|
Class R5 at NAV | 5.29% | 7.25% |
|---|
Bloomberg U.S. Floating Rate Notes Index | 4.69% | 5.75% |
|---|
Bloomberg U.S. Aggregate Bond Index | 2.71% | 2.88% |
|---|
|
|
| Performance Inception Date |
May 04, 2023
|
|
| No Deduction of Taxes [Text Block] |
The returns do not reflect the deduction of taxes that a shareholder would pay on Fund distributions or redemption of Fund shares.
|
|
| AssetsNet |
$ 4,995,204,689
|
|
| Holdings Count | Holding |
787
|
|
| Advisory Fees Paid, Amount |
$ 7,999,234
|
|
| InvestmentCompanyPortfolioTurnover |
100.00%
|
|
| Additional Fund Statistics [Text Block] |
Table SummaryTotal Net Assets | $4,995,204,689 |
|---|
# of Portfolio Holdings | 787 |
|---|
Portfolio Turnover Rate | 100% |
|---|
Total Advisory Fees Paid | $7,999,234 |
|---|
|
|
| Holdings [Text Block] |
Table SummaryPortfolio Holdings Presented by Portfolio Allocation | %Footnote Reference* |
|---|
Asset-Backed Securities | 63.66% | Corporate Bonds | 7.55% | Floating Rate Loans | 8.80% | Foreign Government Obligations | 0.97% | Government Sponsored Enterprises Collateralized Mortgage Obligations | 5.78% | Non-Agency Commercial Mortgage-Backed Securities | 6.88% | U.S. Treasury Obligations | 5.16% | Repurchase Agreements | 1.14% | Money Market FundsFootnote Reference** | 0.05% | Time DepositsFootnote Reference** | 0.01% | Total | 100.00% | | Footnote | Description | Footnote* | Represents percent of total investments, which excludes derivatives. | Footnote** | Securities were purchased with the cash collateral from loaned securities. |
|
|
| Material Fund Change [Text Block] |
This is a summary of certain changes to the Fund that occurred during the reporting period, except as otherwise noted. For more information contact 888-522-2388. Effective December 1, 2025, the Fund's Expense Limitation Agreement expired and was not renewed. Prior to that date, the Adviser contractually agreed to limit total net annual operating expenses, excluding 12b-1 fees and acquired fund fees and expenses, interest-related expenses, taxes, expenses related to litigation and potential litigation, and extraordinary expenses, to an annual rate of 0.35%. |
|
| Material Fund Change Expenses [Text Block] |
Effective December 1, 2025, the Fund's Expense Limitation Agreement expired and was not renewed. Prior to that date, the Adviser contractually agreed to limit total net annual operating expenses, excluding 12b-1 fees and acquired fund fees and expenses, interest-related expenses, taxes, expenses related to litigation and potential litigation, and extraordinary expenses, to an annual rate of 0.35%.
|
|
| Summary of Change Legend [Text Block] |
This is a summary of certain changes to the Fund that occurred during the reporting period, except as otherwise noted. For more information contact 888-522-2388.
|
|
| Updated Prospectus Phone Number |
888-522-2388
|
|
| C000241940 |
|
|
| Shareholder Report [Line Items] |
|
|
| Fund Name |
Lord Abbett Investment Grade Floating Rate Fund
|
|
| Class Name |
Class R6
|
|
| Trading Symbol |
LGRUX
|
|
| Annual or Semi-Annual Statement [Text Block] |
This annual shareholder report contains important information about the Lord Abbett Investment Grade Floating Rate Fund for the period of August 1, 2025 to July 31, 2026 (the "reporting period").
|
|
| Additional Information [Text Block] |
You can find additional information about the Fund at lordabbett.com/FundDocuments. You can also request this information by contacting us at 888-522-2388.
|
|
| Material Fund Change Notice [Text Block] |
This report describes changes to the Fund that occurred during the reporting period.
|
|
| Additional Information Phone Number |
888-522-2388
|
|
| Additional Information Website |
<span style="box-sizing: border-box; color: rgb(0, 0, 0); display: inline; flex-wrap: nowrap; font-size: 13.3333px; font-weight: 400; grid-area: auto; line-height: 20px; margin: 0px; overflow: visible; text-align: left; text-align-last: auto; white-space-collapse: preserve-breaks;">lordabbett.com/FundDocuments</span>
|
|
| Expenses [Text Block] |
What were the Fund costs for the reporting period?(based on a hypothetical $10,000 investment) Table SummaryClass Name | Costs of a $10,000 investment | Costs paid as a percentage of a $10,000 investment |
|---|
Class R6 | $30 | 0.29% |
|---|
|
|
| Expenses Paid, Amount |
$ 30
|
|
| Expense Ratio, Percent |
0.29%
|
|
| Factors Affecting Performance [Text Block] |
How did the Fund perform last year and what affected its performance?For the fiscal year ended July 31, 2026, the Fund returned 5.49%, reflecting performance at the net asset value (NAV) of Class R6 shares with all distributions reinvested, compared to the 4.69% return of a securities market index with investment characteristics similar to those of the Fund, the Bloomberg U.S. Floating Rate Notes Index. The Fund's broad-based securities market index, the Bloomberg U.S. Aggregate Bond Index, returned 2.71% over the same period. From August 2025 through July 2026, U.S. fixed income markets were supported by resilient economic growth, solid consumer spending, healthy corporate earnings and continued investment, particularly in artificial intelligence ("AI"). Markets also faced headwinds from rising inflation pressures and heightened geopolitical tensions, including the U.S.-Iran conflict and its impact on energy prices. These developments contributed to periods of elevated volatility and shifting expectations for Federal Reserve policy. Despite these challenges, credit markets remained broadly constructive, supported by resilient corporate fundamentals and continued demand for income. Overall, the period reflected a balance between economic resilience and growing concerns around inflation, geopolitical risk and potential AI-driven disruption. Top contributors to performance: The Fund’s allocation to collateralized loan obligations was the primary contributor to relative performance. An allocation to asset-backed securities also contributed to relative performance. Top detractors from performance: The Fund’s rates positioning detracted from relative performance. The Fund’s allocation to investment grade corporate bonds also detracted from relative performance. |
|
| Performance Past Does Not Indicate Future [Text] |
The Fund's past performance is no guarantee of future results.
|
|
| Line Graph [Table Text Block] |
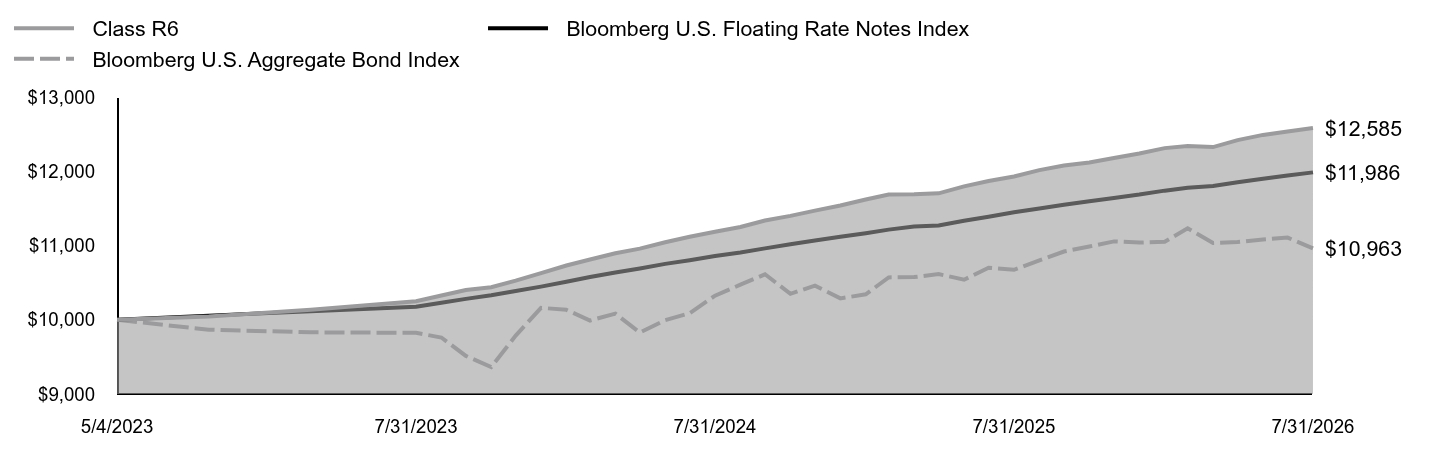 Table Summary | Class R6 | Bloomberg U.S. Floating Rate Notes Index | Bloomberg U.S. Aggregate Bond Index |
|---|
5/4/2023 | $10,000 | $10,000 | $10,000 |
|---|
5/31/2023 | $10,044 | $10,056 | $9,866 |
|---|
6/30/2023 | $10,136 | $10,116 | $9,831 |
|---|
7/31/2023 | $10,250 | $10,176 | $9,824 |
|---|
8/31/2023 | $10,327 | $10,230 | $9,761 |
|---|
9/30/2023 | $10,401 | $10,282 | $9,513 |
|---|
10/31/2023 | $10,439 | $10,331 | $9,363 |
|---|
11/30/2023 | $10,527 | $10,387 | $9,787 |
|---|
12/31/2023 | $10,629 | $10,447 | $10,161 |
|---|
1/31/2024 | $10,731 | $10,513 | $10,134 |
|---|
2/29/2024 | $10,812 | $10,576 | $9,990 |
|---|
3/31/2024 | $10,897 | $10,636 | $10,083 |
|---|
4/30/2024 | $10,959 | $10,692 | $9,828 |
|---|
5/31/2024 | $11,045 | $10,753 | $9,995 |
|---|
6/30/2024 | $11,119 | $10,803 | $10,089 |
|---|
7/31/2024 | $11,187 | $10,859 | $10,325 |
|---|
8/31/2024 | $11,251 | $10,907 | $10,473 |
|---|
9/30/2024 | $11,337 | $10,962 | $10,613 |
|---|
10/31/2024 | $11,400 | $11,018 | $10,350 |
|---|
11/30/2024 | $11,471 | $11,067 | $10,460 |
|---|
12/31/2024 | $11,539 | $11,118 | $10,288 |
|---|
1/31/2025 | $11,621 | $11,167 | $10,343 |
|---|
2/28/2025 | $11,688 | $11,215 | $10,571 |
|---|
3/31/2025 | $11,690 | $11,256 | $10,575 |
|---|
4/30/2025 | $11,704 | $11,271 | $10,616 |
|---|
5/31/2025 | $11,798 | $11,334 | $10,540 |
|---|
6/30/2025 | $11,869 | $11,389 | $10,702 |
|---|
7/31/2025 | $11,930 | $11,449 | $10,674 |
|---|
8/31/2025 | $12,016 | $11,499 | $10,802 |
|---|
9/30/2025 | $12,079 | $11,549 | $10,920 |
|---|
10/31/2025 | $12,119 | $11,597 | $10,988 |
|---|
11/30/2025 | $12,179 | $11,642 | $11,056 |
|---|
12/31/2025 | $12,241 | $11,687 | $11,040 |
|---|
1/31/2026 | $12,313 | $11,740 | $11,051 |
|---|
2/28/2026 | $12,342 | $11,779 | $11,232 |
|---|
3/31/2026 | $12,327 | $11,802 | $11,034 |
|---|
4/30/2026 | $12,421 | $11,852 | $11,047 |
|---|
5/31/2026 | $12,491 | $11,901 | $11,081 |
|---|
6/30/2026 | $12,537 | $11,944 | $11,108 |
|---|
7/31/2026 | $12,585 | $11,986 | $10,963 |
|---|
|
|
| Average Annual Return [Table Text Block] |
Table SummaryAATR | 1 Year | Since Inception
5/4/23 |
|---|
Class R6 at NAV | 5.49% | 7.35% |
|---|
Bloomberg U.S. Floating Rate Notes Index | 4.69% | 5.75% |
|---|
Bloomberg U.S. Aggregate Bond Index | 2.71% | 2.88% |
|---|
|
|
| Performance Inception Date |
May 04, 2023
|
|
| No Deduction of Taxes [Text Block] |
The returns do not reflect the deduction of taxes that a shareholder would pay on Fund distributions or redemption of Fund shares.
|
|
| AssetsNet |
$ 4,995,204,689
|
|
| Holdings Count | Holding |
787
|
|
| Advisory Fees Paid, Amount |
$ 7,999,234
|
|
| InvestmentCompanyPortfolioTurnover |
100.00%
|
|
| Additional Fund Statistics [Text Block] |
Table SummaryTotal Net Assets | $4,995,204,689 |
|---|
# of Portfolio Holdings | 787 |
|---|
Portfolio Turnover Rate | 100% |
|---|
Total Advisory Fees Paid | $7,999,234 |
|---|
|
|
| Holdings [Text Block] |
Table SummaryPortfolio Holdings Presented by Portfolio Allocation | %Footnote Reference* |
|---|
Asset-Backed Securities | 63.66% | Corporate Bonds | 7.55% | Floating Rate Loans | 8.80% | Foreign Government Obligations | 0.97% | Government Sponsored Enterprises Collateralized Mortgage Obligations | 5.78% | Non-Agency Commercial Mortgage-Backed Securities | 6.88% | U.S. Treasury Obligations | 5.16% | Repurchase Agreements | 1.14% | Money Market FundsFootnote Reference** | 0.05% | Time DepositsFootnote Reference** | 0.01% | Total | 100.00% | | Footnote | Description | Footnote* | Represents percent of total investments, which excludes derivatives. | Footnote** | Securities were purchased with the cash collateral from loaned securities. |
|
|
| Material Fund Change [Text Block] |
This is a summary of certain changes to the Fund that occurred during the reporting period, except as otherwise noted. For more information contact 888-522-2388. Effective December 1, 2025, the Fund's Expense Limitation Agreement expired and was not renewed. Prior to that date, the Adviser contractually agreed to limit total net annual operating expenses, excluding 12b-1 fees and acquired fund fees and expenses, interest-related expenses, taxes, expenses related to litigation and potential litigation, and extraordinary expenses, to an annual rate of 0.34%. |
|
| Material Fund Change Expenses [Text Block] |
Effective December 1, 2025, the Fund's Expense Limitation Agreement expired and was not renewed. Prior to that date, the Adviser contractually agreed to limit total net annual operating expenses, excluding 12b-1 fees and acquired fund fees and expenses, interest-related expenses, taxes, expenses related to litigation and potential litigation, and extraordinary expenses, to an annual rate of 0.34%.
|
|
| Summary of Change Legend [Text Block] |
This is a summary of certain changes to the Fund that occurred during the reporting period, except as otherwise noted. For more information contact 888-522-2388.
|
|
| Updated Prospectus Phone Number |
888-522-2388
|
|
| C000228428 |
|
|
| Shareholder Report [Line Items] |
|
|
| Fund Name |
Lord Abbett International Growth Fund
|
|
| Class Name |
Class A
|
|
| Trading Symbol |
LAAGX
|
|
| Annual or Semi-Annual Statement [Text Block] |
This annual shareholder report contains important information about the Lord Abbett International Growth Fund for the period of August 1, 2025 to July 31, 2026 (the "reporting period").
|
|
| Additional Information [Text Block] |
You can find additional information about the Fund at lordabbett.com/FundDocuments. You can also request this information by contacting us at 888-522-2388.
|
|
| Additional Information Phone Number |
888-522-2388
|
|
| Additional Information Website |
<span style="box-sizing: border-box; color: rgb(0, 0, 0); display: inline; flex-wrap: nowrap; font-size: 13.3333px; font-weight: 400; grid-area: auto; line-height: 20px; margin: 0px; overflow: visible; text-align: left; text-align-last: auto; white-space-collapse: preserve-breaks;">lordabbett.com/FundDocuments</span>
|
|
| Expenses [Text Block] |
What were the Fund costs for the reporting period?(based on a hypothetical $10,000 investment) Table SummaryClass Name | Costs of a $10,000 investment | Costs paid as a percentage of a $10,000 investment |
|---|
Class A | $108 | 0.95% |
|---|
|
|
| Expenses Paid, Amount |
$ 108
|
|
| Expense Ratio, Percent |
0.95%
|
|
| Factors Affecting Performance [Text Block] |
How did the Fund perform last year and what affected its performance?For the fiscal year ended July 31, 2026, the Fund returned 26.53%, reflecting performance at the net asset value (NAV) of Class A shares, with all distributions reinvested, compared to the 20.42% return of a securities market index with investment characteristics similar to those of the Fund, the MSCI All Country World ex USA Growth Index (Net). The Fund's broad-based securities market index, the MSCI EAFE Net Index, returned 24.33% over the same period. Markets navigated a resilient economic backdrop amid geopolitical and inflation uncertainty. Healthy consumer spending, labor markets, and corporate earnings supported the outlook, while artificial intelligence ("AI") disruption concerns and U.S.-Iran tensions drove volatility and higher energy prices. A June ceasefire stabilized oil markets, though geopolitical tensions continued to influence Treasury yields. Meanwhile, Kevin Warsh became Fed Chair, and the Fed held rates unchanged in July amid resilient economic data. Top contributors to performance: Security selection within the Information Technology sector contributed to relative performance over the period, driven by an allocation to SK Hynix, a semiconductor manufacturer. Security selection within the Financials sector also contributed to relative performance, driven by an allocation to OTP Bank, a financial services company. Top detractors from performance: Security selection within the Materials sector detracted from relative performance over the period, driven by an allocation to Heidelberg Materials, a building materials company. Security selection within the Communication Services sector also detracted from relative performance, driven by an allocation to Meta Platforms, a technology company. |
|
| Performance Past Does Not Indicate Future [Text] |
The Fund's past performance is no guarantee of future results.
|
|
| Line Graph [Table Text Block] |
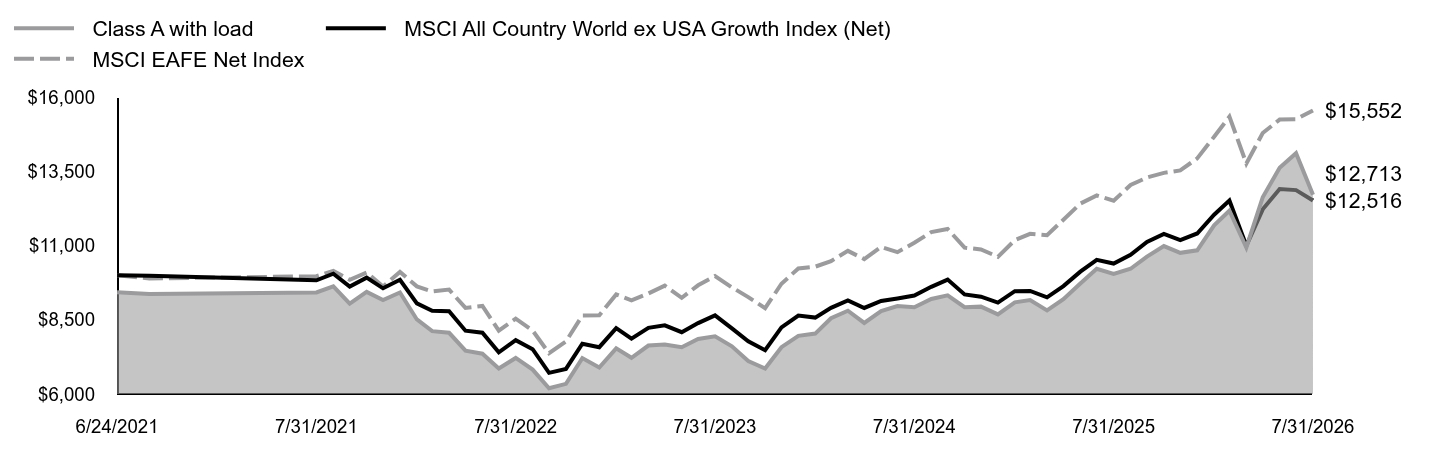 Table Summary | Class A with load | MSCI All Country World ex USA Growth Index (Net) | MSCI EAFE Net Index |
|---|
6/24/2021 | $9,427 | $10,000 | $10,000 |
|---|
6/30/2021 | $9,371 | $9,981 | $9,893 |
|---|
7/31/2021 | $9,421 | $9,830 | $9,967 |
|---|
8/31/2021 | $9,626 | $10,052 | $10,143 |
|---|
9/30/2021 | $9,047 | $9,620 | $9,849 |
|---|
10/31/2021 | $9,439 | $9,918 | $10,091 |
|---|
11/30/2021 | $9,165 | $9,560 | $9,621 |
|---|
12/31/2021 | $9,421 | $9,847 | $10,114 |
|---|
1/31/2022 | $8,511 | $9,053 | $9,625 |
|---|
2/28/2022 | $8,118 | $8,801 | $9,455 |
|---|
3/31/2022 | $8,062 | $8,787 | $9,516 |
|---|
4/30/2022 | $7,458 | $8,133 | $8,900 |
|---|
5/31/2022 | $7,358 | $8,063 | $8,967 |
|---|
6/30/2022 | $6,860 | $7,406 | $8,135 |
|---|
7/31/2022 | $7,215 | $7,814 | $8,540 |
|---|
8/31/2022 | $6,822 | $7,509 | $8,135 |
|---|
9/30/2022 | $6,193 | $6,712 | $7,374 |
|---|
10/31/2022 | $6,343 | $6,844 | $7,770 |
|---|
11/30/2022 | $7,209 | $7,695 | $8,645 |
|---|
12/31/2022 | $6,893 | $7,577 | $8,652 |
|---|
1/31/2023 | $7,539 | $8,218 | $9,353 |
|---|
2/28/2023 | $7,219 | $7,867 | $9,158 |
|---|
3/31/2023 | $7,633 | $8,228 | $9,385 |
|---|
4/30/2023 | $7,665 | $8,312 | $9,650 |
|---|
5/31/2023 | $7,577 | $8,081 | $9,241 |
|---|
6/30/2023 | $7,853 | $8,388 | $9,662 |
|---|
7/31/2023 | $7,941 | $8,650 | $9,974 |
|---|
8/31/2023 | $7,608 | $8,209 | $9,592 |
|---|
9/30/2023 | $7,113 | $7,775 | $9,265 |
|---|
10/31/2023 | $6,856 | $7,473 | $8,889 |
|---|
11/30/2023 | $7,577 | $8,246 | $9,714 |
|---|
12/31/2023 | $7,959 | $8,641 | $10,230 |
|---|
1/31/2024 | $8,035 | $8,574 | $10,289 |
|---|
2/29/2024 | $8,552 | $8,902 | $10,477 |
|---|
3/31/2024 | $8,804 | $9,151 | $10,822 |
|---|
4/30/2024 | $8,394 | $8,898 | $10,545 |
|---|
5/31/2024 | $8,791 | $9,133 | $10,953 |
|---|
6/30/2024 | $8,962 | $9,218 | $10,777 |
|---|
7/31/2024 | $8,924 | $9,315 | $11,093 |
|---|
8/31/2024 | $9,201 | $9,611 | $11,453 |
|---|
9/30/2024 | $9,321 | $9,855 | $11,559 |
|---|
10/31/2024 | $8,924 | $9,354 | $10,931 |
|---|
11/30/2024 | $8,943 | $9,277 | $10,869 |
|---|
12/31/2024 | $8,683 | $9,078 | $10,621 |
|---|
1/31/2025 | $9,087 | $9,465 | $11,180 |
|---|
2/28/2025 | $9,163 | $9,472 | $11,396 |
|---|
3/31/2025 | $8,816 | $9,257 | $11,350 |
|---|
4/30/2025 | $9,195 | $9,634 | $11,870 |
|---|
5/31/2025 | $9,725 | $10,120 | $12,413 |
|---|
6/30/2025 | $10,218 | $10,521 | $12,687 |
|---|
7/31/2025 | $10,047 | $10,394 | $12,509 |
|---|
8/31/2025 | $10,218 | $10,687 | $13,042 |
|---|
9/30/2025 | $10,628 | $11,122 | $13,292 |
|---|
10/31/2025 | $10,982 | $11,390 | $13,448 |
|---|
11/30/2025 | $10,755 | $11,186 | $13,532 |
|---|
12/31/2025 | $10,841 | $11,407 | $13,937 |
|---|
1/31/2026 | $11,682 | $12,037 | $14,665 |
|---|
2/28/2026 | $12,175 | $12,515 | $15,343 |
|---|
3/31/2026 | $10,936 | $10,995 | $13,764 |
|---|
4/30/2026 | $12,624 | $12,221 | $14,790 |
|---|
5/31/2026 | $13,617 | $12,903 | $15,244 |
|---|
6/30/2026 | $14,111 | $12,868 | $15,254 |
|---|
7/31/2026 | $12,713 | $12,516 | $15,552 |
|---|
|
|
| Average Annual Return [Table Text Block] |
Table SummaryAATR | 1 Year | 5 Years | Since Inception
6/24/21 |
|---|
Class A at NAV | 26.53% | 6.18% | 6.04% |
|---|
Class A with sales charge | 19.26% | 4.93% | 4.82% |
|---|
MSCI All Country World ex USA Growth Index (Net) | 20.42% | 4.95% | 4.50% |
|---|
MSCI EAFE Net Index | 24.33% | 9.31% | 9.04% |
|---|
|
|
| Performance Inception Date |
Jun. 24, 2021
|
|
| No Deduction of Taxes [Text Block] |
The returns do not reflect the deduction of taxes that a shareholder would pay on Fund distributions or redemption of Fund shares.
|
|
| AssetsNet |
$ 6,621,278
|
|
| Holdings Count | Holding |
80
|
|
| Advisory Fees Paid, Amount |
$ 0
|
|
| InvestmentCompanyPortfolioTurnover |
99.00%
|
|
| Additional Fund Statistics [Text Block] |
Table SummaryTotal Net Assets | $6,621,278 |
|---|
# of Portfolio Holdings | 80 |
|---|
Portfolio Turnover Rate | 99% |
|---|
Total Advisory Fees Paid | $0 |
|---|
|
|
| Holdings [Text Block] |
Table SummaryPortfolio Holdings Presented by SectorFootnote Reference* | % Footnote Reference** |
|---|
Communication Services | 4.46% | Consumer Discretionary | 11.45% | Consumer Staples | 3.34% | Financials | 11.72% | Health Care | 11.10% | Industrials | 20.62% | Information Technology | 27.00% | Materials | 4.29% | Repurchase Agreements | 6.02% | Total | 100.00% | | Footnote | Description | Footnote* | A sector may comprise several industries. | Footnote** | Represents percent of total investments, which excludes derivatives. |
|
|
| Material Fund Change [Text Block] |
There were no material changes to the Fund during the reporting period. |
|
| Summary of Change Legend [Text Block] |
There were no material changes to the Fund during the reporting period.
|
|
| C000228432 |
|
|
| Shareholder Report [Line Items] |
|
|
| Fund Name |
Lord Abbett International Growth Fund
|
|
| Class Name |
Class C
|
|
| Trading Symbol |
LCAGX
|
|
| Annual or Semi-Annual Statement [Text Block] |
This annual shareholder report contains important information about the Lord Abbett International Growth Fund for the period of August 1, 2025 to July 31, 2026 (the "reporting period").
|
|
| Additional Information [Text Block] |
You can find additional information about the Fund at lordabbett.com/FundDocuments. You can also request this information by contacting us at 888-522-2388.
|
|
| Additional Information Phone Number |
888-522-2388
|
|
| Additional Information Website |
<span style="box-sizing: border-box; color: rgb(0, 0, 0); display: inline; flex-wrap: nowrap; font-size: 13.3333px; font-weight: 400; grid-area: auto; line-height: 20px; margin: 0px; overflow: visible; text-align: left; text-align-last: auto; white-space-collapse: preserve-breaks;">lordabbett.com/FundDocuments</span>
|
|
| Expenses [Text Block] |
What were the Fund costs for the reporting period?(based on a hypothetical $10,000 investment) Table SummaryClass Name | Costs of a $10,000 investment | Costs paid as a percentage of a $10,000 investment |
|---|
Class C | $192 | 1.70% |
|---|
|
|
| Expenses Paid, Amount |
$ 192
|
|
| Expense Ratio, Percent |
1.70%
|
|
| Factors Affecting Performance [Text Block] |
How did the Fund perform last year and what affected its performance?For the fiscal year ended July 31, 2026, the Fund returned 25.51%, reflecting performance at the net asset value (NAV) of Class C shares, with all distributions reinvested, compared to the 20.42% return of a securities market index with investment characteristics similar to those of the Fund, the MSCI All Country World ex USA Growth Index (Net). The Fund's broad-based securities market index, the MSCI EAFE Net Index, returned 24.33% over the same period. Markets navigated a resilient economic backdrop amid geopolitical and inflation uncertainty. Healthy consumer spending, labor markets, and corporate earnings supported the outlook, while artificial intelligence ("AI") disruption concerns and U.S.-Iran tensions drove volatility and higher energy prices. A June ceasefire stabilized oil markets, though geopolitical tensions continued to influence Treasury yields. Meanwhile, Kevin Warsh became Fed Chair, and the Fed held rates unchanged in July amid resilient economic data. Top contributors to performance: Security selection within the Information Technology sector contributed to relative performance over the period, driven by an allocation to SK Hynix, a semiconductor manufacturer. Security selection within the Financials sector also contributed to relative performance, driven by an allocation to OTP Bank, a financial services company. Top detractors from performance: Security selection within the Materials sector detracted from relative performance over the period, driven by an allocation to Heidelberg Materials, a building materials company. Security selection within the Communication Services sector also detracted from relative performance, driven by an allocation to Meta Platforms, a technology company. |
|
| Performance Past Does Not Indicate Future [Text] |
The Fund's past performance is no guarantee of future results.
|
|
| Line Graph [Table Text Block] |
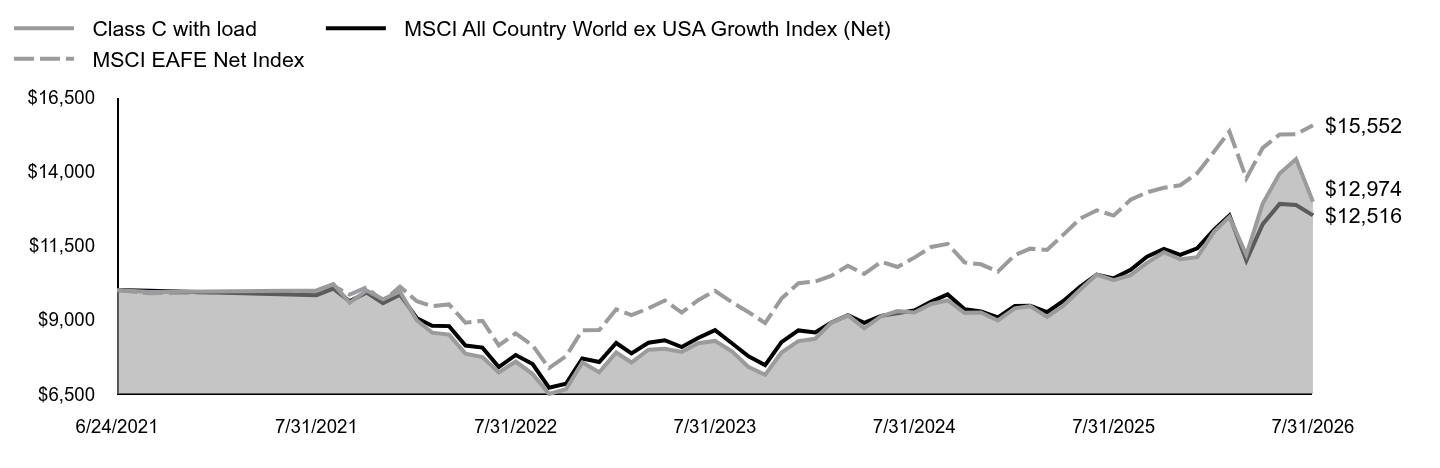 Table Summary | Class C with load | MSCI All Country World ex USA Growth Index (Net) | MSCI EAFE Net Index |
|---|
6/24/2021 | $10,000 | $10,000 | $10,000 |
|---|
6/30/2021 | $9,934 | $9,981 | $9,893 |
|---|
7/31/2021 | $9,987 | $9,830 | $9,967 |
|---|
8/31/2021 | $10,198 | $10,052 | $10,143 |
|---|
9/30/2021 | $9,577 | $9,620 | $9,849 |
|---|
10/31/2021 | $9,987 | $9,918 | $10,091 |
|---|
11/30/2021 | $9,689 | $9,560 | $9,621 |
|---|
12/31/2021 | $9,954 | $9,847 | $10,114 |
|---|
1/31/2022 | $8,982 | $9,053 | $9,625 |
|---|
2/28/2022 | $8,566 | $8,801 | $9,455 |
|---|
3/31/2022 | $8,500 | $8,787 | $9,516 |
|---|
4/30/2022 | $7,859 | $8,133 | $8,900 |
|---|
5/31/2022 | $7,746 | $8,063 | $8,967 |
|---|
6/30/2022 | $7,224 | $7,406 | $8,135 |
|---|
7/31/2022 | $7,594 | $7,814 | $8,540 |
|---|
8/31/2022 | $7,171 | $7,509 | $8,135 |
|---|
9/30/2022 | $6,504 | $6,712 | $7,374 |
|---|
10/31/2022 | $6,662 | $6,844 | $7,770 |
|---|
11/30/2022 | $7,561 | $7,695 | $8,645 |
|---|
12/31/2022 | $7,231 | $7,577 | $8,652 |
|---|
1/31/2023 | $7,898 | $8,218 | $9,353 |
|---|
2/28/2023 | $7,561 | $7,867 | $9,158 |
|---|
3/31/2023 | $7,991 | $8,228 | $9,385 |
|---|
4/30/2023 | $8,024 | $8,312 | $9,650 |
|---|
5/31/2023 | $7,918 | $8,081 | $9,241 |
|---|
6/30/2023 | $8,209 | $8,388 | $9,662 |
|---|
7/31/2023 | $8,288 | $8,650 | $9,974 |
|---|
8/31/2023 | $7,938 | $8,209 | $9,592 |
|---|
9/30/2023 | $7,416 | $7,775 | $9,265 |
|---|
10/31/2023 | $7,145 | $7,473 | $8,889 |
|---|
11/30/2023 | $7,898 | $8,246 | $9,714 |
|---|
12/31/2023 | $8,282 | $8,641 | $10,230 |
|---|
1/31/2024 | $8,361 | $8,574 | $10,289 |
|---|
2/29/2024 | $8,890 | $8,902 | $10,477 |
|---|
3/31/2024 | $9,147 | $9,151 | $10,822 |
|---|
4/30/2024 | $8,718 | $8,898 | $10,545 |
|---|
5/31/2024 | $9,121 | $9,133 | $10,953 |
|---|
6/30/2024 | $9,293 | $9,218 | $10,777 |
|---|
7/31/2024 | $9,247 | $9,315 | $11,093 |
|---|
8/31/2024 | $9,531 | $9,611 | $11,453 |
|---|
9/30/2024 | $9,650 | $9,855 | $11,559 |
|---|
10/31/2024 | $9,233 | $9,354 | $10,931 |
|---|
11/30/2024 | $9,247 | $9,277 | $10,869 |
|---|
12/31/2024 | $8,976 | $9,078 | $10,621 |
|---|
1/31/2025 | $9,385 | $9,465 | $11,180 |
|---|
2/28/2025 | $9,458 | $9,472 | $11,396 |
|---|
3/31/2025 | $9,095 | $9,257 | $11,350 |
|---|
4/30/2025 | $9,478 | $9,634 | $11,870 |
|---|
5/31/2025 | $10,020 | $10,120 | $12,413 |
|---|
6/30/2025 | $10,522 | $10,521 | $12,687 |
|---|
7/31/2025 | $10,337 | $10,394 | $12,509 |
|---|
8/31/2025 | $10,502 | $10,687 | $13,042 |
|---|
9/30/2025 | $10,919 | $11,122 | $13,292 |
|---|
10/31/2025 | $11,276 | $11,390 | $13,448 |
|---|
11/30/2025 | $11,038 | $11,186 | $13,532 |
|---|
12/31/2025 | $11,110 | $11,407 | $13,937 |
|---|
1/31/2026 | $11,970 | $12,037 | $14,665 |
|---|
2/28/2026 | $12,465 | $12,515 | $15,343 |
|---|
3/31/2026 | $11,190 | $10,995 | $13,764 |
|---|
4/30/2026 | $12,915 | $12,221 | $14,790 |
|---|
5/31/2026 | $13,926 | $12,903 | $15,244 |
|---|
6/30/2026 | $14,415 | $12,868 | $15,254 |
|---|
7/31/2026 | $12,974 | $12,516 | $15,552 |
|---|
|
|
| Average Annual Return [Table Text Block] |
Table SummaryAATR | 1 Year | 5 Years | Since Inception
6/24/21 |
|---|
Class C at NAV | 25.51% | 5.37% | 5.24% |
|---|
Class C with sales charge | 24.51% | 5.37% | 5.24% |
|---|
MSCI All Country World ex USA Growth Index (Net) | 20.42% | 4.95% | 4.50% |
|---|
MSCI EAFE Net Index | 24.33% | 9.31% | 9.04% |
|---|
|
|
| Performance Inception Date |
Jun. 24, 2021
|
|
| No Deduction of Taxes [Text Block] |
The returns do not reflect the deduction of taxes that a shareholder would pay on Fund distributions or redemption of Fund shares.
|
|
| AssetsNet |
$ 6,621,278
|
|
| Holdings Count | Holding |
80
|
|
| Advisory Fees Paid, Amount |
$ 0
|
|
| InvestmentCompanyPortfolioTurnover |
99.00%
|
|
| Additional Fund Statistics [Text Block] |
Table SummaryTotal Net Assets | $6,621,278 |
|---|
# of Portfolio Holdings | 80 |
|---|
Portfolio Turnover Rate | 99% |
|---|
Total Advisory Fees Paid | $0 |
|---|
|
|
| Holdings [Text Block] |
Table SummaryPortfolio Holdings Presented by SectorFootnote Reference* | % Footnote Reference** |
|---|
Communication Services | 4.46% | Consumer Discretionary | 11.45% | Consumer Staples | 3.34% | Financials | 11.72% | Health Care | 11.10% | Industrials | 20.62% | Information Technology | 27.00% | Materials | 4.29% | Repurchase Agreements | 6.02% | Total | 100.00% | | Footnote | Description | Footnote* | A sector may comprise several industries. | Footnote** | Represents percent of total investments, which excludes derivatives. |
|
|
| Material Fund Change [Text Block] |
There were no material changes to the Fund during the reporting period. |
|
| Summary of Change Legend [Text Block] |
There were no material changes to the Fund during the reporting period.
|
|
| C000228431 |
|
|
| Shareholder Report [Line Items] |
|
|
| Fund Name |
Lord Abbett International Growth Fund
|
|
| Class Name |
Class F
|
|
| Trading Symbol |
LAFGX
|
|
| Annual or Semi-Annual Statement [Text Block] |
This annual shareholder report contains important information about the Lord Abbett International Growth Fund for the period of August 1, 2025 to July 31, 2026 (the "reporting period").
|
|
| Additional Information [Text Block] |
You can find additional information about the Fund at lordabbett.com/FundDocuments. You can also request this information by contacting us at 888-522-2388.
|
|
| Additional Information Phone Number |
888-522-2388
|
|
| Additional Information Website |
<span style="box-sizing: border-box; color: rgb(0, 0, 0); display: inline; flex-wrap: nowrap; font-size: 13.3333px; font-weight: 400; grid-area: auto; line-height: 20px; margin: 0px; overflow: visible; text-align: left; text-align-last: auto; white-space-collapse: preserve-breaks;">lordabbett.com/FundDocuments</span>
|
|
| Expenses [Text Block] |
What were the Fund costs for the reporting period?(based on a hypothetical $10,000 investment) Table SummaryClass Name | Costs of a $10,000 investment | Costs paid as a percentage of a $10,000 investment |
|---|
Class F | $79 | 0.70% |
|---|
|
|
| Expenses Paid, Amount |
$ 79
|
|
| Expense Ratio, Percent |
0.70%
|
|
| Factors Affecting Performance [Text Block] |
How did the Fund perform last year and what affected its performance?For the fiscal year ended July 31, 2026, the Fund returned 26.79%, reflecting performance at the net asset value (NAV) of Class F shares, with all distributions reinvested, compared to the 20.42% return of a securities market index with investment characteristics similar to those of the Fund, the MSCI All Country World ex USA Growth Index (Net). The Fund's broad-based securities market index, the MSCI EAFE Net Index, returned 24.33% over the same period. Markets navigated a resilient economic backdrop amid geopolitical and inflation uncertainty. Healthy consumer spending, labor markets, and corporate earnings supported the outlook, while artificial intelligence ("AI") disruption concerns and U.S.-Iran tensions drove volatility and higher energy prices. A June ceasefire stabilized oil markets, though geopolitical tensions continued to influence Treasury yields. Meanwhile, Kevin Warsh became Fed Chair, and the Fed held rates unchanged in July amid resilient economic data. Top contributors to performance: Security selection within the Information Technology sector contributed to relative performance over the period, driven by an allocation to SK Hynix, a semiconductor manufacturer. Security selection within the Financials sector also contributed to relative performance, driven by an allocation to OTP Bank, a financial services company. Top detractors from performance: Security selection within the Materials sector detracted from relative performance over the period, driven by an allocation to Heidelberg Materials, a building materials company. Security selection within the Communication Services sector also detracted from relative performance, driven by an allocation to Meta Platforms, a technology company. |
|
| Performance Past Does Not Indicate Future [Text] |
The Fund's past performance is no guarantee of future results.
|
|
| Line Graph [Table Text Block] |
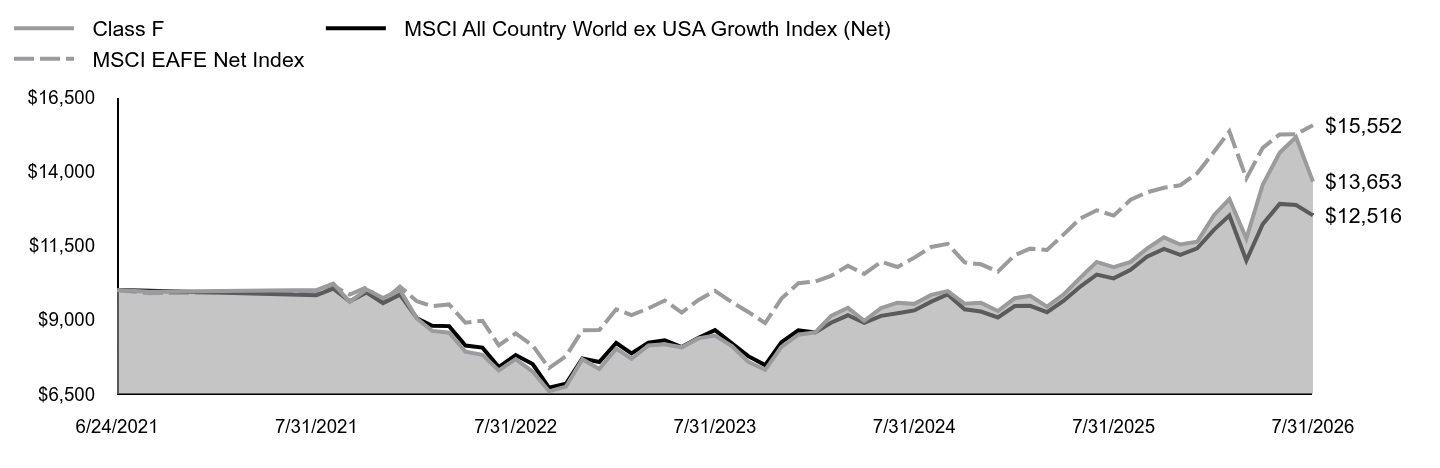 Table Summary | Class F | MSCI All Country World ex USA Growth Index (Net) | MSCI EAFE Net Index |
|---|
6/24/2021 | $10,000 | $10,000 | $10,000 |
|---|
6/30/2021 | $9,941 | $9,981 | $9,893 |
|---|
7/31/2021 | $10,000 | $9,830 | $9,967 |
|---|
8/31/2021 | $10,218 | $10,052 | $10,143 |
|---|
9/30/2021 | $9,603 | $9,620 | $9,849 |
|---|
10/31/2021 | $10,020 | $9,918 | $10,091 |
|---|
11/30/2021 | $9,736 | $9,560 | $9,621 |
|---|
12/31/2021 | $10,007 | $9,847 | $10,114 |
|---|
1/31/2022 | $9,042 | $9,053 | $9,625 |
|---|
2/28/2022 | $8,625 | $8,801 | $9,455 |
|---|
3/31/2022 | $8,566 | $8,787 | $9,516 |
|---|
4/30/2022 | $7,925 | $8,133 | $8,900 |
|---|
5/31/2022 | $7,819 | $8,063 | $8,967 |
|---|
6/30/2022 | $7,297 | $7,406 | $8,135 |
|---|
7/31/2022 | $7,673 | $7,814 | $8,540 |
|---|
8/31/2022 | $7,257 | $7,509 | $8,135 |
|---|
9/30/2022 | $6,590 | $6,712 | $7,374 |
|---|
10/31/2022 | $6,748 | $6,844 | $7,770 |
|---|
11/30/2022 | $7,673 | $7,695 | $8,645 |
|---|
12/31/2022 | $7,341 | $7,577 | $8,652 |
|---|
1/31/2023 | $8,027 | $8,218 | $9,353 |
|---|
2/28/2023 | $7,687 | $7,867 | $9,158 |
|---|
3/31/2023 | $8,133 | $8,228 | $9,385 |
|---|
4/30/2023 | $8,173 | $8,312 | $9,650 |
|---|
5/31/2023 | $8,073 | $8,081 | $9,241 |
|---|
6/30/2023 | $8,373 | $8,388 | $9,662 |
|---|
7/31/2023 | $8,466 | $8,650 | $9,974 |
|---|
8/31/2023 | $8,113 | $8,209 | $9,592 |
|---|
9/30/2023 | $7,587 | $7,775 | $9,265 |
|---|
10/31/2023 | $7,314 | $7,473 | $8,889 |
|---|
11/30/2023 | $8,087 | $8,246 | $9,714 |
|---|
12/31/2023 | $8,498 | $8,641 | $10,230 |
|---|
1/31/2024 | $8,579 | $8,574 | $10,289 |
|---|
2/29/2024 | $9,128 | $8,902 | $10,477 |
|---|
3/31/2024 | $9,403 | $9,151 | $10,822 |
|---|
4/30/2024 | $8,967 | $8,898 | $10,545 |
|---|
5/31/2024 | $9,396 | $9,133 | $10,953 |
|---|
6/30/2024 | $9,577 | $9,218 | $10,777 |
|---|
7/31/2024 | $9,537 | $9,315 | $11,093 |
|---|
8/31/2024 | $9,839 | $9,611 | $11,453 |
|---|
9/30/2024 | $9,966 | $9,855 | $11,559 |
|---|
10/31/2024 | $9,544 | $9,354 | $10,931 |
|---|
11/30/2024 | $9,571 | $9,277 | $10,869 |
|---|
12/31/2024 | $9,296 | $9,078 | $10,621 |
|---|
1/31/2025 | $9,726 | $9,465 | $11,180 |
|---|
2/28/2025 | $9,807 | $9,472 | $11,396 |
|---|
3/31/2025 | $9,444 | $9,257 | $11,350 |
|---|
4/30/2025 | $9,847 | $9,634 | $11,870 |
|---|
5/31/2025 | $10,419 | $10,120 | $12,413 |
|---|
6/30/2025 | $10,950 | $10,521 | $12,687 |
|---|
7/31/2025 | $10,769 | $10,394 | $12,509 |
|---|
8/31/2025 | $10,950 | $10,687 | $13,042 |
|---|
9/30/2025 | $11,394 | $11,122 | $13,292 |
|---|
10/31/2025 | $11,778 | $11,390 | $13,448 |
|---|
11/30/2025 | $11,536 | $11,186 | $13,532 |
|---|
12/31/2025 | $11,629 | $11,407 | $13,937 |
|---|
1/31/2026 | $12,533 | $12,037 | $14,665 |
|---|
2/28/2026 | $13,066 | $12,515 | $15,343 |
|---|
3/31/2026 | $11,737 | $10,995 | $13,764 |
|---|
4/30/2026 | $13,552 | $12,221 | $14,790 |
|---|
5/31/2026 | $14,625 | $12,903 | $15,244 |
|---|
6/30/2026 | $15,157 | $12,868 | $15,254 |
|---|
7/31/2026 | $13,653 | $12,516 | $15,552 |
|---|
|
|
| Average Annual Return [Table Text Block] |
Table SummaryAATR | 1 Year | 5 Years | Since Inception
6/24/21 |
|---|
Class F at NAV | 26.79% | 6.43% | 6.29% |
|---|
MSCI All Country World ex USA Growth Index (Net) | 20.42% | 4.95% | 4.50% |
|---|
MSCI EAFE Net Index | 24.33% | 9.31% | 9.04% |
|---|
|
|
| Performance Inception Date |
Jun. 24, 2021
|
|
| No Deduction of Taxes [Text Block] |
The returns do not reflect the deduction of taxes that a shareholder would pay on Fund distributions or redemption of Fund shares.
|
|
| AssetsNet |
$ 6,621,278
|
|
| Holdings Count | Holding |
80
|
|
| Advisory Fees Paid, Amount |
$ 0
|
|
| InvestmentCompanyPortfolioTurnover |
99.00%
|
|
| Additional Fund Statistics [Text Block] |
Table SummaryTotal Net Assets | $6,621,278 |
|---|
# of Portfolio Holdings | 80 |
|---|
Portfolio Turnover Rate | 99% |
|---|
Total Advisory Fees Paid | $0 |
|---|
|
|
| Holdings [Text Block] |
Table SummaryPortfolio Holdings Presented by SectorFootnote Reference* | % Footnote Reference** |
|---|
Communication Services | 4.46% | Consumer Discretionary | 11.45% | Consumer Staples | 3.34% | Financials | 11.72% | Health Care | 11.10% | Industrials | 20.62% | Information Technology | 27.00% | Materials | 4.29% | Repurchase Agreements | 6.02% | Total | 100.00% | | Footnote | Description | Footnote* | A sector may comprise several industries. | Footnote** | Represents percent of total investments, which excludes derivatives. |
|
|
| Material Fund Change [Text Block] |
There were no material changes to the Fund during the reporting period. |
|
| Summary of Change Legend [Text Block] |
There were no material changes to the Fund during the reporting period.
|
|
| C000228430 |
|
|
| Shareholder Report [Line Items] |
|
|
| Fund Name |
Lord Abbett International Growth Fund
|
|
| Class Name |
Class F3
|
|
| Trading Symbol |
LOAGX
|
|
| Annual or Semi-Annual Statement [Text Block] |
This annual shareholder report contains important information about the Lord Abbett International Growth Fund for the period of August 1, 2025 to July 31, 2026 (the "reporting period").
|
|
| Additional Information [Text Block] |
You can find additional information about the Fund at lordabbett.com/FundDocuments. You can also request this information by contacting us at 888-522-2388.
|
|
| Additional Information Phone Number |
888-522-2388
|
|
| Additional Information Website |
<span style="box-sizing: border-box; color: rgb(0, 0, 0); display: inline; flex-wrap: nowrap; font-size: 13.3333px; font-weight: 400; grid-area: auto; line-height: 20px; margin: 0px; overflow: visible; text-align: left; text-align-last: auto; white-space-collapse: preserve-breaks;">lordabbett.com/FundDocuments</span>
|
|
| Expenses [Text Block] |
What were the Fund costs for the reporting period?(based on a hypothetical $10,000 investment) Table SummaryClass Name | Costs of a $10,000 investment | Costs paid as a percentage of a $10,000 investment |
|---|
Class F3 | $75 | 0.66% |
|---|
|
|
| Expenses Paid, Amount |
$ 75
|
|
| Expense Ratio, Percent |
0.66%
|
|
| Factors Affecting Performance [Text Block] |
How did the Fund perform last year and what affected its performance?For the fiscal year ended July 31, 2026, the Fund returned 26.84%, reflecting performance at the net asset value (NAV) of Class F3 shares, with all distributions reinvested, compared to the 20.42% return of a securities market index with investment characteristics similar to those of the Fund, the MSCI All Country World ex USA Growth Index (Net). The Fund's broad-based securities market index, the MSCI EAFE Net Index, returned 24.33% over the same period. Markets navigated a resilient economic backdrop amid geopolitical and inflation uncertainty. Healthy consumer spending, labor markets, and corporate earnings supported the outlook, while artificial intelligence ("AI") disruption concerns and U.S.-Iran tensions drove volatility and higher energy prices. A June ceasefire stabilized oil markets, though geopolitical tensions continued to influence Treasury yields. Meanwhile, Kevin Warsh became Fed Chair, and the Fed held rates unchanged in July amid resilient economic data. Top contributors to performance: Security selection within the Information Technology sector contributed to relative performance over the period, driven by an allocation to SK Hynix, a semiconductor manufacturer. Security selection within the Financials sector also contributed to relative performance, driven by an allocation to OTP Bank, a financial services company. Top detractors from performance: Security selection within the Materials sector detracted from relative performance over the period, driven by an allocation to Heidelberg Materials, a building materials company. Security selection within the Communication Services sector also detracted from relative performance, driven by an allocation to Meta Platforms, a technology company. |
|
| Performance Past Does Not Indicate Future [Text] |
The Fund's past performance is no guarantee of future results.
|
|
| Line Graph [Table Text Block] |
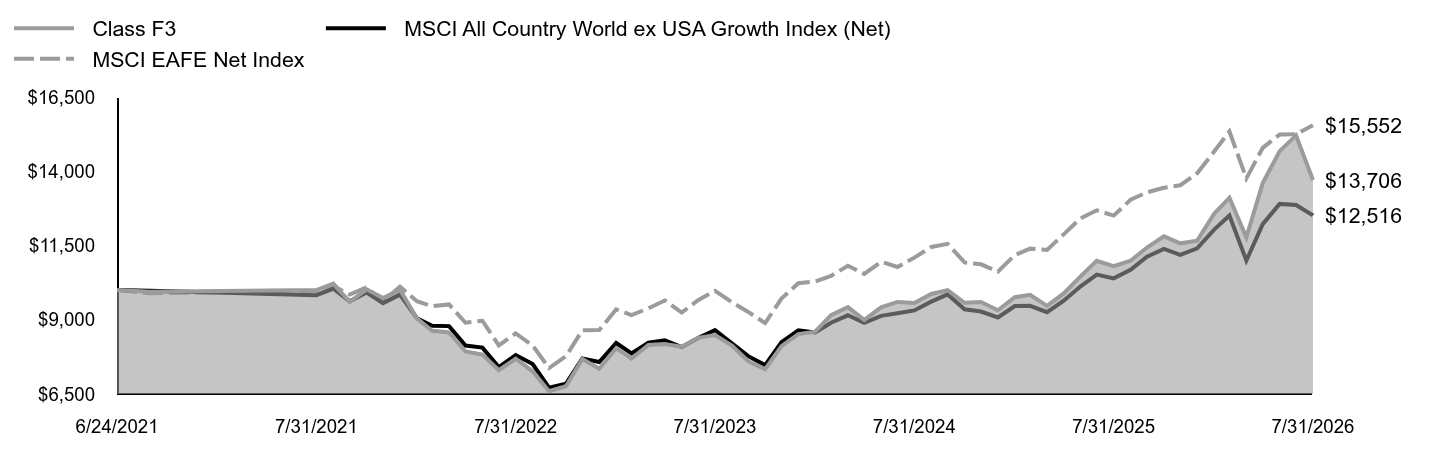 Table Summary | Class F3 | MSCI All Country World ex USA Growth Index (Net) | MSCI EAFE Net Index |
|---|
6/24/2021 | $10,000 | $10,000 | $10,000 |
|---|
6/30/2021 | $9,941 | $9,981 | $9,893 |
|---|
7/31/2021 | $10,000 | $9,830 | $9,967 |
|---|
8/31/2021 | $10,218 | $10,052 | $10,143 |
|---|
9/30/2021 | $9,603 | $9,620 | $9,849 |
|---|
10/31/2021 | $10,026 | $9,918 | $10,091 |
|---|
11/30/2021 | $9,736 | $9,560 | $9,621 |
|---|
12/31/2021 | $10,013 | $9,847 | $10,114 |
|---|
1/31/2022 | $9,048 | $9,053 | $9,625 |
|---|
2/28/2022 | $8,632 | $8,801 | $9,455 |
|---|
3/31/2022 | $8,572 | $8,787 | $9,516 |
|---|
4/30/2022 | $7,931 | $8,133 | $8,900 |
|---|
5/31/2022 | $7,826 | $8,063 | $8,967 |
|---|
6/30/2022 | $7,303 | $7,406 | $8,135 |
|---|
7/31/2022 | $7,687 | $7,814 | $8,540 |
|---|
8/31/2022 | $7,264 | $7,509 | $8,135 |
|---|
9/30/2022 | $6,596 | $6,712 | $7,374 |
|---|
10/31/2022 | $6,761 | $6,844 | $7,770 |
|---|
11/30/2022 | $7,680 | $7,695 | $8,645 |
|---|
12/31/2022 | $7,350 | $7,577 | $8,652 |
|---|
1/31/2023 | $8,044 | $8,218 | $9,353 |
|---|
2/28/2023 | $7,697 | $7,867 | $9,158 |
|---|
3/31/2023 | $8,151 | $8,228 | $9,385 |
|---|
4/30/2023 | $8,184 | $8,312 | $9,650 |
|---|
5/31/2023 | $8,091 | $8,081 | $9,241 |
|---|
6/30/2023 | $8,391 | $8,388 | $9,662 |
|---|
7/31/2023 | $8,484 | $8,650 | $9,974 |
|---|
8/31/2023 | $8,131 | $8,209 | $9,592 |
|---|
9/30/2023 | $7,604 | $7,775 | $9,265 |
|---|
10/31/2023 | $7,337 | $7,473 | $8,889 |
|---|
11/30/2023 | $8,111 | $8,246 | $9,714 |
|---|
12/31/2023 | $8,519 | $8,641 | $10,230 |
|---|
1/31/2024 | $8,600 | $8,574 | $10,289 |
|---|
2/29/2024 | $9,158 | $8,902 | $10,477 |
|---|
3/31/2024 | $9,426 | $9,151 | $10,822 |
|---|
4/30/2024 | $8,996 | $8,898 | $10,545 |
|---|
5/31/2024 | $9,420 | $9,133 | $10,953 |
|---|
6/30/2024 | $9,601 | $9,218 | $10,777 |
|---|
7/31/2024 | $9,567 | $9,315 | $11,093 |
|---|
8/31/2024 | $9,870 | $9,611 | $11,453 |
|---|
9/30/2024 | $9,997 | $9,855 | $11,559 |
|---|
10/31/2024 | $9,574 | $9,354 | $10,931 |
|---|
11/30/2024 | $9,601 | $9,277 | $10,869 |
|---|
12/31/2024 | $9,321 | $9,078 | $10,621 |
|---|
1/31/2025 | $9,760 | $9,465 | $11,180 |
|---|
2/28/2025 | $9,841 | $9,472 | $11,396 |
|---|
3/31/2025 | $9,470 | $9,257 | $11,350 |
|---|
4/30/2025 | $9,881 | $9,634 | $11,870 |
|---|
5/31/2025 | $10,455 | $10,120 | $12,413 |
|---|
6/30/2025 | $10,988 | $10,521 | $12,687 |
|---|
7/31/2025 | $10,806 | $10,394 | $12,509 |
|---|
8/31/2025 | $10,988 | $10,687 | $13,042 |
|---|
9/30/2025 | $11,434 | $11,122 | $13,292 |
|---|
10/31/2025 | $11,812 | $11,390 | $13,448 |
|---|
11/30/2025 | $11,575 | $11,186 | $13,532 |
|---|
12/31/2025 | $11,667 | $11,407 | $13,937 |
|---|
1/31/2026 | $12,575 | $12,037 | $14,665 |
|---|
2/28/2026 | $13,110 | $12,515 | $15,343 |
|---|
3/31/2026 | $11,775 | $10,995 | $13,764 |
|---|
4/30/2026 | $13,604 | $12,221 | $14,790 |
|---|
5/31/2026 | $14,682 | $12,903 | $15,244 |
|---|
6/30/2026 | $15,210 | $12,868 | $15,254 |
|---|
7/31/2026 | $13,706 | $12,516 | $15,552 |
|---|
|
|
| Average Annual Return [Table Text Block] |
Table SummaryAATR | 1 Year | 5 Years | Since Inception
6/24/21 |
|---|
Class F3 at NAV | 26.84% | 6.51% | 6.37% |
|---|
MSCI All Country World ex USA Growth Index (Net) | 20.42% | 4.95% | 4.50% |
|---|
MSCI EAFE Net Index | 24.33% | 9.31% | 9.04% |
|---|
|
|
| Performance Inception Date |
Jun. 24, 2021
|
|
| No Deduction of Taxes [Text Block] |
The returns do not reflect the deduction of taxes that a shareholder would pay on Fund distributions or redemption of Fund shares.
|
|
| AssetsNet |
$ 6,621,278
|
|
| Holdings Count | Holding |
80
|
|
| Advisory Fees Paid, Amount |
$ 0
|
|
| InvestmentCompanyPortfolioTurnover |
99.00%
|
|
| Additional Fund Statistics [Text Block] |
Table SummaryTotal Net Assets | $6,621,278 |
|---|
# of Portfolio Holdings | 80 |
|---|
Portfolio Turnover Rate | 99% |
|---|
Total Advisory Fees Paid | $0 |
|---|
|
|
| Holdings [Text Block] |
Table SummaryPortfolio Holdings Presented by SectorFootnote Reference* | % Footnote Reference** |
|---|
Communication Services | 4.46% | Consumer Discretionary | 11.45% | Consumer Staples | 3.34% | Financials | 11.72% | Health Care | 11.10% | Industrials | 20.62% | Information Technology | 27.00% | Materials | 4.29% | Repurchase Agreements | 6.02% | Total | 100.00% | | Footnote | Description | Footnote* | A sector may comprise several industries. | Footnote** | Represents percent of total investments, which excludes derivatives. |
|
|
| Material Fund Change [Text Block] |
There were no material changes to the Fund during the reporting period. |
|
| Summary of Change Legend [Text Block] |
There were no material changes to the Fund during the reporting period.
|
|
| C000228429 |
|
|
| Shareholder Report [Line Items] |
|
|
| Fund Name |
Lord Abbett International Growth Fund
|
|
| Class Name |
Class I
|
|
| Trading Symbol |
LIAGX
|
|
| Annual or Semi-Annual Statement [Text Block] |
This annual shareholder report contains important information about the Lord Abbett International Growth Fund for the period of August 1, 2025 to July 31, 2026 (the "reporting period").
|
|
| Additional Information [Text Block] |
You can find additional information about the Fund at lordabbett.com/FundDocuments. You can also request this information by contacting us at 888-522-2388.
|
|
| Additional Information Phone Number |
888-522-2388
|
|
| Additional Information Website |
<span style="box-sizing: border-box; color: rgb(0, 0, 0); display: inline; flex-wrap: nowrap; font-size: 13.3333px; font-weight: 400; grid-area: auto; line-height: 20px; margin: 0px; overflow: visible; text-align: left; text-align-last: auto; white-space-collapse: preserve-breaks;">lordabbett.com/FundDocuments</span>
|
|
| Expenses [Text Block] |
What were the Fund costs for the reporting period?(based on a hypothetical $10,000 investment) Table SummaryClass Name | Costs of a $10,000 investment | Costs paid as a percentage of a $10,000 investment |
|---|
Class I | $79 | 0.70% |
|---|
|
|
| Expenses Paid, Amount |
$ 79
|
|
| Expense Ratio, Percent |
0.70%
|
|
| Factors Affecting Performance [Text Block] |
How did the Fund perform last year and what affected its performance?For the fiscal year ended July 31, 2026, the Fund returned 26.73%, reflecting performance at the net asset value (NAV) of Class I shares, with all distributions reinvested, compared to the 20.42% return of a securities market index with investment characteristics similar to those of the Fund, the MSCI All Country World ex USA Growth Index (Net). The Fund's broad-based securities market index, the MSCI EAFE Net Index, returned 24.33% over the same period. Markets navigated a resilient economic backdrop amid geopolitical and inflation uncertainty. Healthy consumer spending, labor markets, and corporate earnings supported the outlook, while artificial intelligence ("AI") disruption concerns and U.S.-Iran tensions drove volatility and higher energy prices. A June ceasefire stabilized oil markets, though geopolitical tensions continued to influence Treasury yields. Meanwhile, Kevin Warsh became Fed Chair, and the Fed held rates unchanged in July amid resilient economic data. Top contributors to performance: Security selection within the Information Technology sector contributed to relative performance over the period, driven by an allocation to SK Hynix, a semiconductor manufacturer. Security selection within the Financials sector also contributed to relative performance, driven by an allocation to OTP Bank, a financial services company. Top detractors from performance: Security selection within the Materials sector detracted from relative performance over the period, driven by an allocation to Heidelberg Materials, a building materials company. Security selection within the Communication Services sector also detracted from relative performance, driven by an allocation to Meta Platforms, a technology company. |
|
| Performance Past Does Not Indicate Future [Text] |
The Fund's past performance is no guarantee of future results.
|
|
| Line Graph [Table Text Block] |
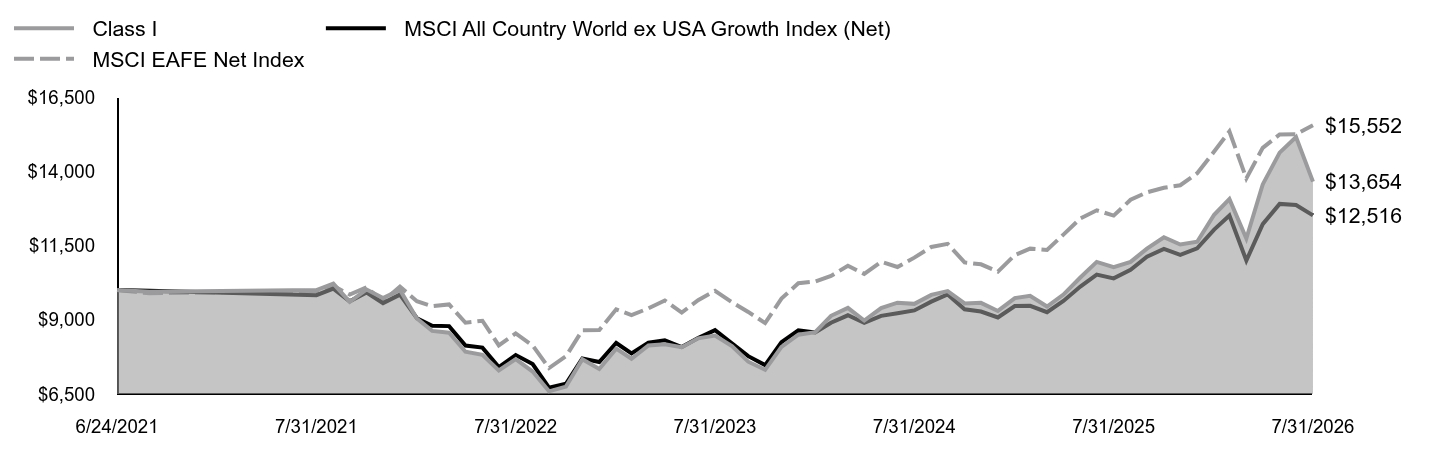 Table Summary | Class I | MSCI All Country World ex USA Growth Index (Net) | MSCI EAFE Net Index |
|---|
6/24/2021 | $10,000 | $10,000 | $10,000 |
|---|
6/30/2021 | $9,941 | $9,981 | $9,893 |
|---|
7/31/2021 | $10,000 | $9,830 | $9,967 |
|---|
8/31/2021 | $10,218 | $10,052 | $10,143 |
|---|
9/30/2021 | $9,603 | $9,620 | $9,849 |
|---|
10/31/2021 | $10,020 | $9,918 | $10,091 |
|---|
11/30/2021 | $9,736 | $9,560 | $9,621 |
|---|
12/31/2021 | $10,007 | $9,847 | $10,114 |
|---|
1/31/2022 | $9,042 | $9,053 | $9,625 |
|---|
2/28/2022 | $8,625 | $8,801 | $9,455 |
|---|
3/31/2022 | $8,566 | $8,787 | $9,516 |
|---|
4/30/2022 | $7,925 | $8,133 | $8,900 |
|---|
5/31/2022 | $7,819 | $8,063 | $8,967 |
|---|
6/30/2022 | $7,297 | $7,406 | $8,135 |
|---|
7/31/2022 | $7,673 | $7,814 | $8,540 |
|---|
8/31/2022 | $7,257 | $7,509 | $8,135 |
|---|
9/30/2022 | $6,590 | $6,712 | $7,374 |
|---|
10/31/2022 | $6,748 | $6,844 | $7,770 |
|---|
11/30/2022 | $7,673 | $7,695 | $8,645 |
|---|
12/31/2022 | $7,341 | $7,577 | $8,652 |
|---|
1/31/2023 | $8,028 | $8,218 | $9,353 |
|---|
2/28/2023 | $7,688 | $7,867 | $9,158 |
|---|
3/31/2023 | $8,135 | $8,228 | $9,385 |
|---|
4/30/2023 | $8,175 | $8,312 | $9,650 |
|---|
5/31/2023 | $8,075 | $8,081 | $9,241 |
|---|
6/30/2023 | $8,375 | $8,388 | $9,662 |
|---|
7/31/2023 | $8,468 | $8,650 | $9,974 |
|---|
8/31/2023 | $8,115 | $8,209 | $9,592 |
|---|
9/30/2023 | $7,588 | $7,775 | $9,265 |
|---|
10/31/2023 | $7,315 | $7,473 | $8,889 |
|---|
11/30/2023 | $8,088 | $8,246 | $9,714 |
|---|
12/31/2023 | $8,496 | $8,641 | $10,230 |
|---|
1/31/2024 | $8,583 | $8,574 | $10,289 |
|---|
2/29/2024 | $9,134 | $8,902 | $10,477 |
|---|
3/31/2024 | $9,402 | $9,151 | $10,822 |
|---|
4/30/2024 | $8,973 | $8,898 | $10,545 |
|---|
5/31/2024 | $9,396 | $9,133 | $10,953 |
|---|
6/30/2024 | $9,577 | $9,218 | $10,777 |
|---|
7/31/2024 | $9,537 | $9,315 | $11,093 |
|---|
8/31/2024 | $9,839 | $9,611 | $11,453 |
|---|
9/30/2024 | $9,967 | $9,855 | $11,559 |
|---|
10/31/2024 | $9,550 | $9,354 | $10,931 |
|---|
11/30/2024 | $9,570 | $9,277 | $10,869 |
|---|
12/31/2024 | $9,297 | $9,078 | $10,621 |
|---|
1/31/2025 | $9,729 | $9,465 | $11,180 |
|---|
2/28/2025 | $9,810 | $9,472 | $11,396 |
|---|
3/31/2025 | $9,446 | $9,257 | $11,350 |
|---|
4/30/2025 | $9,850 | $9,634 | $11,870 |
|---|
5/31/2025 | $10,424 | $10,120 | $12,413 |
|---|
6/30/2025 | $10,950 | $10,521 | $12,687 |
|---|
7/31/2025 | $10,775 | $10,394 | $12,509 |
|---|
8/31/2025 | $10,950 | $10,687 | $13,042 |
|---|
9/30/2025 | $11,395 | $11,122 | $13,292 |
|---|
10/31/2025 | $11,780 | $11,390 | $13,448 |
|---|
11/30/2025 | $11,537 | $11,186 | $13,532 |
|---|
12/31/2025 | $11,629 | $11,407 | $13,937 |
|---|
1/31/2026 | $12,537 | $12,037 | $14,665 |
|---|
2/28/2026 | $13,065 | $12,515 | $15,343 |
|---|
3/31/2026 | $11,738 | $10,995 | $13,764 |
|---|
4/30/2026 | $13,560 | $12,221 | $14,790 |
|---|
5/31/2026 | $14,630 | $12,903 | $15,244 |
|---|
6/30/2026 | $15,158 | $12,868 | $15,254 |
|---|
7/31/2026 | $13,654 | $12,516 | $15,552 |
|---|
|
|
| Average Annual Return [Table Text Block] |
Table SummaryAATR | 1 Year | 5 Years | Since Inception
6/24/21 |
|---|
Class I at NAV | 26.73% | 6.43% | 6.30% |
|---|
MSCI All Country World ex USA Growth Index (Net) | 20.42% | 4.95% | 4.50% |
|---|
MSCI EAFE Net Index | 24.33% | 9.31% | 9.04% |
|---|
|
|
| Performance Inception Date |
Jun. 24, 2021
|
|
| No Deduction of Taxes [Text Block] |
The returns do not reflect the deduction of taxes that a shareholder would pay on Fund distributions or redemption of Fund shares.
|
|
| AssetsNet |
$ 6,621,278
|
|
| Holdings Count | Holding |
80
|
|
| Advisory Fees Paid, Amount |
$ 0
|
|
| InvestmentCompanyPortfolioTurnover |
99.00%
|
|
| Additional Fund Statistics [Text Block] |
Table SummaryTotal Net Assets | $6,621,278 |
|---|
# of Portfolio Holdings | 80 |
|---|
Portfolio Turnover Rate | 99% |
|---|
Total Advisory Fees Paid | $0 |
|---|
|
|
| Holdings [Text Block] |
Table SummaryPortfolio Holdings Presented by SectorFootnote Reference* | % Footnote Reference** |
|---|
Communication Services | 4.46% | Consumer Discretionary | 11.45% | Consumer Staples | 3.34% | Financials | 11.72% | Health Care | 11.10% | Industrials | 20.62% | Information Technology | 27.00% | Materials | 4.29% | Repurchase Agreements | 6.02% | Total | 100.00% | | Footnote | Description | Footnote* | A sector may comprise several industries. | Footnote** | Represents percent of total investments, which excludes derivatives. |
|
|
| Material Fund Change [Text Block] |
There were no material changes to the Fund during the reporting period. |
|
| Summary of Change Legend [Text Block] |
There were no material changes to the Fund during the reporting period.
|
|
| C000228427 |
|
|
| Shareholder Report [Line Items] |
|
|
| Fund Name |
Lord Abbett International Growth Fund
|
|
| Class Name |
Class R3
|
|
| Trading Symbol |
LRAGX
|
|
| Annual or Semi-Annual Statement [Text Block] |
This annual shareholder report contains important information about the Lord Abbett International Growth Fund for the period of August 1, 2025 to July 31, 2026 (the "reporting period").
|
|
| Additional Information [Text Block] |
You can find additional information about the Fund at lordabbett.com/FundDocuments. You can also request this information by contacting us at 888-522-2388.
|
|
| Additional Information Phone Number |
888-522-2388
|
|
| Additional Information Website |
<span style="box-sizing: border-box; color: rgb(0, 0, 0); display: inline; flex-wrap: nowrap; font-size: 13.3333px; font-weight: 400; grid-area: auto; line-height: 20px; margin: 0px; overflow: visible; text-align: left; text-align-last: auto; white-space-collapse: preserve-breaks;">lordabbett.com/FundDocuments</span>
|
|
| Expenses [Text Block] |
What were the Fund costs for the reporting period?(based on a hypothetical $10,000 investment) Table SummaryClass Name | Costs of a $10,000 investment | Costs paid as a percentage of a $10,000 investment |
|---|
Class R3 | $136 | 1.20% |
|---|
|
|
| Expenses Paid, Amount |
$ 136
|
|
| Expense Ratio, Percent |
1.20%
|
|
| Factors Affecting Performance [Text Block] |
How did the Fund perform last year and what affected its performance?For the fiscal year ended July 31, 2026, the Fund returned 26.15%, reflecting performance at the net asset value (NAV) of Class R3 shares, with all distributions reinvested, compared to the 20.42% return of a securities market index with investment characteristics similar to those of the Fund, the MSCI All Country World ex USA Growth Index (Net). The Fund's broad-based securities market index, the MSCI EAFE Net Index, returned 24.33% over the same period. Markets navigated a resilient economic backdrop amid geopolitical and inflation uncertainty. Healthy consumer spending, labor markets, and corporate earnings supported the outlook, while artificial intelligence ("AI") disruption concerns and U.S.-Iran tensions drove volatility and higher energy prices. A June ceasefire stabilized oil markets, though geopolitical tensions continued to influence Treasury yields. Meanwhile, Kevin Warsh became Fed Chair, and the Fed held rates unchanged in July amid resilient economic data. Top contributors to performance: Security selection within the Information Technology sector contributed to relative performance over the period, driven by an allocation to SK Hynix, a semiconductor manufacturer. Security selection within the Financials sector also contributed to relative performance, driven by an allocation to OTP Bank, a financial services company. Top detractors from performance: Security selection within the Materials sector detracted from relative performance over the period, driven by an allocation to Heidelberg Materials, a building materials company. Security selection within the Communication Services sector also detracted from relative performance, driven by an allocation to Meta Platforms, a technology company. |
|
| Performance Past Does Not Indicate Future [Text] |
The Fund's past performance is no guarantee of future results.
|
|
| Line Graph [Table Text Block] |
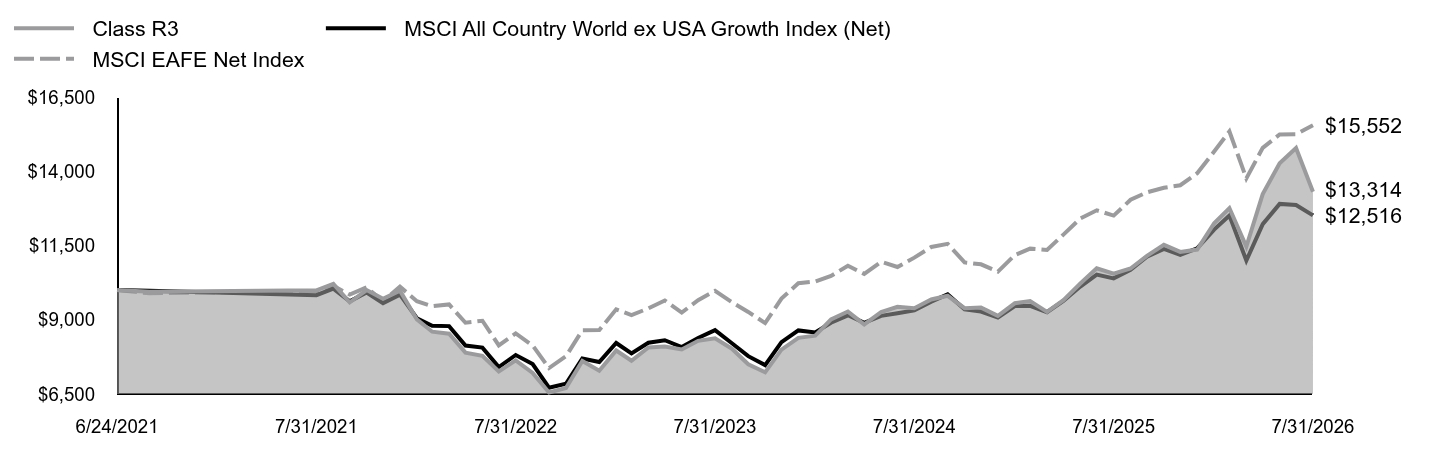 Table Summary | Class R3 | MSCI All Country World ex USA Growth Index (Net) | MSCI EAFE Net Index |
|---|
6/24/2021 | $10,000 | $10,000 | $10,000 |
|---|
6/30/2021 | $9,941 | $9,981 | $9,893 |
|---|
7/31/2021 | $9,993 | $9,830 | $9,967 |
|---|
8/31/2021 | $10,212 | $10,052 | $10,143 |
|---|
9/30/2021 | $9,590 | $9,620 | $9,849 |
|---|
10/31/2021 | $10,000 | $9,918 | $10,091 |
|---|
11/30/2021 | $9,709 | $9,560 | $9,621 |
|---|
12/31/2021 | $9,980 | $9,847 | $10,114 |
|---|
1/31/2022 | $9,015 | $9,053 | $9,625 |
|---|
2/28/2022 | $8,599 | $8,801 | $9,455 |
|---|
3/31/2022 | $8,533 | $8,787 | $9,516 |
|---|
4/30/2022 | $7,892 | $8,133 | $8,900 |
|---|
5/31/2022 | $7,786 | $8,063 | $8,967 |
|---|
6/30/2022 | $7,257 | $7,406 | $8,135 |
|---|
7/31/2022 | $7,634 | $7,814 | $8,540 |
|---|
8/31/2022 | $7,211 | $7,509 | $8,135 |
|---|
9/30/2022 | $6,550 | $6,712 | $7,374 |
|---|
10/31/2022 | $6,702 | $6,844 | $7,770 |
|---|
11/30/2022 | $7,614 | $7,695 | $8,645 |
|---|
12/31/2022 | $7,283 | $7,577 | $8,652 |
|---|
1/31/2023 | $7,966 | $8,218 | $9,353 |
|---|
2/28/2023 | $7,621 | $7,867 | $9,158 |
|---|
3/31/2023 | $8,066 | $8,228 | $9,385 |
|---|
4/30/2023 | $8,099 | $8,312 | $9,650 |
|---|
5/31/2023 | $8,000 | $8,081 | $9,241 |
|---|
6/30/2023 | $8,291 | $8,388 | $9,662 |
|---|
7/31/2023 | $8,378 | $8,650 | $9,974 |
|---|
8/31/2023 | $8,026 | $8,209 | $9,592 |
|---|
9/30/2023 | $7,502 | $7,775 | $9,265 |
|---|
10/31/2023 | $7,230 | $7,473 | $8,889 |
|---|
11/30/2023 | $7,993 | $8,246 | $9,714 |
|---|
12/31/2023 | $8,393 | $8,641 | $10,230 |
|---|
1/31/2024 | $8,466 | $8,574 | $10,289 |
|---|
2/29/2024 | $9,011 | $8,902 | $10,477 |
|---|
3/31/2024 | $9,277 | $9,151 | $10,822 |
|---|
4/30/2024 | $8,845 | $8,898 | $10,545 |
|---|
5/31/2024 | $9,257 | $9,133 | $10,953 |
|---|
6/30/2024 | $9,437 | $9,218 | $10,777 |
|---|
7/31/2024 | $9,390 | $9,315 | $11,093 |
|---|
8/31/2024 | $9,683 | $9,611 | $11,453 |
|---|
9/30/2024 | $9,809 | $9,855 | $11,559 |
|---|
10/31/2024 | $9,390 | $9,354 | $10,931 |
|---|
11/30/2024 | $9,410 | $9,277 | $10,869 |
|---|
12/31/2024 | $9,131 | $9,078 | $10,621 |
|---|
1/31/2025 | $9,556 | $9,465 | $11,180 |
|---|
2/28/2025 | $9,630 | $9,472 | $11,396 |
|---|
3/31/2025 | $9,264 | $9,257 | $11,350 |
|---|
4/30/2025 | $9,663 | $9,634 | $11,870 |
|---|
5/31/2025 | $10,221 | $10,120 | $12,413 |
|---|
6/30/2025 | $10,734 | $10,521 | $12,687 |
|---|
7/31/2025 | $10,554 | $10,394 | $12,509 |
|---|
8/31/2025 | $10,727 | $10,687 | $13,042 |
|---|
9/30/2025 | $11,153 | $11,122 | $13,292 |
|---|
10/31/2025 | $11,525 | $11,390 | $13,448 |
|---|
11/30/2025 | $11,286 | $11,186 | $13,532 |
|---|
12/31/2025 | $11,365 | $11,407 | $13,937 |
|---|
1/31/2026 | $12,250 | $12,037 | $14,665 |
|---|
2/28/2026 | $12,762 | $12,515 | $15,343 |
|---|
3/31/2026 | $11,465 | $10,995 | $13,764 |
|---|
4/30/2026 | $13,234 | $12,221 | $14,790 |
|---|
5/31/2026 | $14,272 | $12,903 | $15,244 |
|---|
6/30/2026 | $14,784 | $12,868 | $15,254 |
|---|
7/31/2026 | $13,314 | $12,516 | $15,552 |
|---|
|
|
| Average Annual Return [Table Text Block] |
Table SummaryAATR | 1 Year | 5 Years | Since Inception
6/24/21 |
|---|
Class R3 at NAV | 26.15% | 5.91% | 5.77% |
|---|
MSCI All Country World ex USA Growth Index (Net) | 20.42% | 4.95% | 4.50% |
|---|
MSCI EAFE Net Index | 24.33% | 9.31% | 9.04% |
|---|
|
|
| Performance Inception Date |
Jun. 24, 2021
|
|
| No Deduction of Taxes [Text Block] |
The returns do not reflect the deduction of taxes that a shareholder would pay on Fund distributions or redemption of Fund shares.
|
|
| AssetsNet |
$ 6,621,278
|
|
| Holdings Count | Holding |
80
|
|
| Advisory Fees Paid, Amount |
$ 0
|
|
| InvestmentCompanyPortfolioTurnover |
99.00%
|
|
| Additional Fund Statistics [Text Block] |
Table SummaryTotal Net Assets | $6,621,278 |
|---|
# of Portfolio Holdings | 80 |
|---|
Portfolio Turnover Rate | 99% |
|---|
Total Advisory Fees Paid | $0 |
|---|
|
|
| Holdings [Text Block] |
Table SummaryPortfolio Holdings Presented by SectorFootnote Reference* | % Footnote Reference** |
|---|
Communication Services | 4.46% | Consumer Discretionary | 11.45% | Consumer Staples | 3.34% | Financials | 11.72% | Health Care | 11.10% | Industrials | 20.62% | Information Technology | 27.00% | Materials | 4.29% | Repurchase Agreements | 6.02% | Total | 100.00% | | Footnote | Description | Footnote* | A sector may comprise several industries. | Footnote** | Represents percent of total investments, which excludes derivatives. |
|
|
| Material Fund Change [Text Block] |
There were no material changes to the Fund during the reporting period. |
|
| Summary of Change Legend [Text Block] |
There were no material changes to the Fund during the reporting period.
|
|
| C000228426 |
|
|
| Shareholder Report [Line Items] |
|
|
| Fund Name |
Lord Abbett International Growth Fund
|
|
| Class Name |
Class R4
|
|
| Trading Symbol |
LASGX
|
|
| Annual or Semi-Annual Statement [Text Block] |
This annual shareholder report contains important information about the Lord Abbett International Growth Fund for the period of August 1, 2025 to July 31, 2026 (the "reporting period").
|
|
| Additional Information [Text Block] |
You can find additional information about the Fund at lordabbett.com/FundDocuments. You can also request this information by contacting us at 888-522-2388.
|
|
| Additional Information Phone Number |
888-522-2388
|
|
| Additional Information Website |
<span style="box-sizing: border-box; color: rgb(0, 0, 0); display: inline; flex-wrap: nowrap; font-size: 13.3333px; font-weight: 400; grid-area: auto; line-height: 20px; margin: 0px; overflow: visible; text-align: left; text-align-last: auto; white-space-collapse: preserve-breaks;">lordabbett.com/FundDocuments</span>
|
|
| Expenses [Text Block] |
What were the Fund costs for the reporting period?(based on a hypothetical $10,000 investment) Table SummaryClass Name | Costs of a $10,000 investment | Costs paid as a percentage of a $10,000 investment |
|---|
Class R4 | $108 | 0.95% |
|---|
|
|
| Expenses Paid, Amount |
$ 108
|
|
| Expense Ratio, Percent |
0.95%
|
|
| Factors Affecting Performance [Text Block] |
How did the Fund perform last year and what affected its performance?For the fiscal year ended July 31, 2026, the Fund returned 26.44%, reflecting performance at the net asset value (NAV) of Class R4 shares, with all distributions reinvested, compared to the 20.42% return of a securities market index with investment characteristics similar to those of the Fund, the MSCI All Country World ex USA Growth Index (Net). The Fund's broad-based securities market index, the MSCI EAFE Net Index, returned 24.33% over the same period. Markets navigated a resilient economic backdrop amid geopolitical and inflation uncertainty. Healthy consumer spending, labor markets, and corporate earnings supported the outlook, while artificial intelligence ("AI") disruption concerns and U.S.-Iran tensions drove volatility and higher energy prices. A June ceasefire stabilized oil markets, though geopolitical tensions continued to influence Treasury yields. Meanwhile, Kevin Warsh became Fed Chair, and the Fed held rates unchanged in July amid resilient economic data. Top contributors to performance: Security selection within the Information Technology sector contributed to relative performance over the period, driven by an allocation to SK Hynix, a semiconductor manufacturer. Security selection within the Financials sector also contributed to relative performance, driven by an allocation to OTP Bank, a financial services company. Top detractors from performance: Security selection within the Materials sector detracted from relative performance over the period, driven by an allocation to Heidelberg Materials, a building materials company. Security selection within the Communication Services sector also detracted from relative performance, driven by an allocation to Meta Platforms, a technology company. |
|
| Performance Past Does Not Indicate Future [Text] |
The Fund's past performance is no guarantee of future results.
|
|
| Line Graph [Table Text Block] |
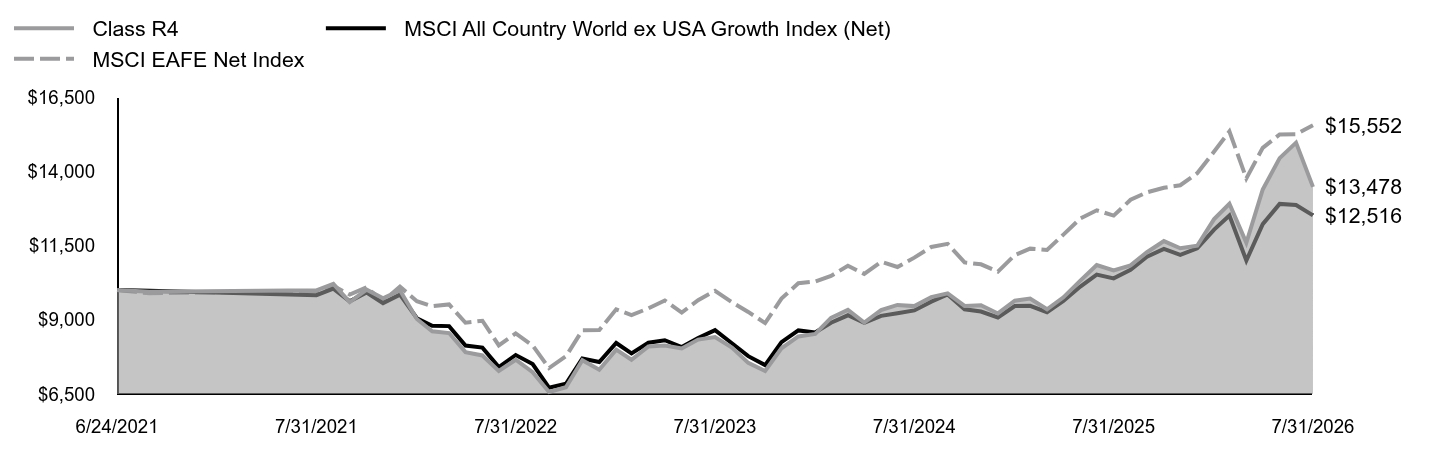 Table Summary | Class R4 | MSCI All Country World ex USA Growth Index (Net) | MSCI EAFE Net Index |
|---|
6/24/2021 | $10,000 | $10,000 | $10,000 |
|---|
6/30/2021 | $9,941 | $9,981 | $9,893 |
|---|
7/31/2021 | $9,993 | $9,830 | $9,967 |
|---|
8/31/2021 | $10,212 | $10,052 | $10,143 |
|---|
9/30/2021 | $9,597 | $9,620 | $9,849 |
|---|
10/31/2021 | $10,013 | $9,918 | $10,091 |
|---|
11/30/2021 | $9,722 | $9,560 | $9,621 |
|---|
12/31/2021 | $9,993 | $9,847 | $10,114 |
|---|
1/31/2022 | $9,028 | $9,053 | $9,625 |
|---|
2/28/2022 | $8,612 | $8,801 | $9,455 |
|---|
3/31/2022 | $8,553 | $8,787 | $9,516 |
|---|
4/30/2022 | $7,911 | $8,133 | $8,900 |
|---|
5/31/2022 | $7,799 | $8,063 | $8,967 |
|---|
6/30/2022 | $7,277 | $7,406 | $8,135 |
|---|
7/31/2022 | $7,654 | $7,814 | $8,540 |
|---|
8/31/2022 | $7,237 | $7,509 | $8,135 |
|---|
9/30/2022 | $6,570 | $6,712 | $7,374 |
|---|
10/31/2022 | $6,728 | $6,844 | $7,770 |
|---|
11/30/2022 | $7,640 | $7,695 | $8,645 |
|---|
12/31/2022 | $7,316 | $7,577 | $8,652 |
|---|
1/31/2023 | $7,994 | $8,218 | $9,353 |
|---|
2/28/2023 | $7,655 | $7,867 | $9,158 |
|---|
3/31/2023 | $8,100 | $8,228 | $9,385 |
|---|
4/30/2023 | $8,134 | $8,312 | $9,650 |
|---|
5/31/2023 | $8,034 | $8,081 | $9,241 |
|---|
6/30/2023 | $8,333 | $8,388 | $9,662 |
|---|
7/31/2023 | $8,420 | $8,650 | $9,974 |
|---|
8/31/2023 | $8,067 | $8,209 | $9,592 |
|---|
9/30/2023 | $7,548 | $7,775 | $9,265 |
|---|
10/31/2023 | $7,276 | $7,473 | $8,889 |
|---|
11/30/2023 | $8,040 | $8,246 | $9,714 |
|---|
12/31/2023 | $8,439 | $8,641 | $10,230 |
|---|
1/31/2024 | $8,526 | $8,574 | $10,289 |
|---|
2/29/2024 | $9,067 | $8,902 | $10,477 |
|---|
3/31/2024 | $9,334 | $9,151 | $10,822 |
|---|
4/30/2024 | $8,906 | $8,898 | $10,545 |
|---|
5/31/2024 | $9,327 | $9,133 | $10,953 |
|---|
6/30/2024 | $9,501 | $9,218 | $10,777 |
|---|
7/31/2024 | $9,461 | $9,315 | $11,093 |
|---|
8/31/2024 | $9,762 | $9,611 | $11,453 |
|---|
9/30/2024 | $9,889 | $9,855 | $11,559 |
|---|
10/31/2024 | $9,468 | $9,354 | $10,931 |
|---|
11/30/2024 | $9,488 | $9,277 | $10,869 |
|---|
12/31/2024 | $9,214 | $9,078 | $10,621 |
|---|
1/31/2025 | $9,642 | $9,465 | $11,180 |
|---|
2/28/2025 | $9,716 | $9,472 | $11,396 |
|---|
3/31/2025 | $9,354 | $9,257 | $11,350 |
|---|
4/30/2025 | $9,756 | $9,634 | $11,870 |
|---|
5/31/2025 | $10,318 | $10,120 | $12,413 |
|---|
6/30/2025 | $10,841 | $10,521 | $12,687 |
|---|
7/31/2025 | $10,660 | $10,394 | $12,509 |
|---|
8/31/2025 | $10,834 | $10,687 | $13,042 |
|---|
9/30/2025 | $11,276 | $11,122 | $13,292 |
|---|
10/31/2025 | $11,651 | $11,390 | $13,448 |
|---|
11/30/2025 | $11,410 | $11,186 | $13,532 |
|---|
12/31/2025 | $11,494 | $11,407 | $13,937 |
|---|
1/31/2026 | $12,392 | $12,037 | $14,665 |
|---|
2/28/2026 | $12,908 | $12,515 | $15,343 |
|---|
3/31/2026 | $11,594 | $10,995 | $13,764 |
|---|
4/30/2026 | $13,391 | $12,221 | $14,790 |
|---|
5/31/2026 | $14,444 | $12,903 | $15,244 |
|---|
6/30/2026 | $14,967 | $12,868 | $15,254 |
|---|
7/31/2026 | $13,478 | $12,516 | $15,552 |
|---|
|
|
| Average Annual Return [Table Text Block] |
Table SummaryAATR | 1 Year | 5 Years | Since Inception
6/24/21 |
|---|
Class R4 at NAV | 26.44% | 6.17% | 6.03% |
|---|
MSCI All Country World ex USA Growth Index (Net) | 20.42% | 4.95% | 4.50% |
|---|
MSCI EAFE Net Index | 24.33% | 9.31% | 9.04% |
|---|
|
|
| Performance Inception Date |
Jun. 24, 2021
|
|
| No Deduction of Taxes [Text Block] |
The returns do not reflect the deduction of taxes that a shareholder would pay on Fund distributions or redemption of Fund shares.
|
|
| AssetsNet |
$ 6,621,278
|
|
| Holdings Count | Holding |
80
|
|
| Advisory Fees Paid, Amount |
$ 0
|
|
| InvestmentCompanyPortfolioTurnover |
99.00%
|
|
| Additional Fund Statistics [Text Block] |
Table SummaryTotal Net Assets | $6,621,278 |
|---|
# of Portfolio Holdings | 80 |
|---|
Portfolio Turnover Rate | 99% |
|---|
Total Advisory Fees Paid | $0 |
|---|
|
|
| Holdings [Text Block] |
Table SummaryPortfolio Holdings Presented by SectorFootnote Reference* | % Footnote Reference** |
|---|
Communication Services | 4.46% | Consumer Discretionary | 11.45% | Consumer Staples | 3.34% | Financials | 11.72% | Health Care | 11.10% | Industrials | 20.62% | Information Technology | 27.00% | Materials | 4.29% | Repurchase Agreements | 6.02% | Total | 100.00% | | Footnote | Description | Footnote* | A sector may comprise several industries. | Footnote** | Represents percent of total investments, which excludes derivatives. |
|
|
| Material Fund Change [Text Block] |
There were no material changes to the Fund during the reporting period. |
|
| Summary of Change Legend [Text Block] |
There were no material changes to the Fund during the reporting period.
|
|
| C000228425 |
|
|
| Shareholder Report [Line Items] |
|
|
| Fund Name |
Lord Abbett International Growth Fund
|
|
| Class Name |
Class R5
|
|
| Trading Symbol |
LTAGX
|
|
| Annual or Semi-Annual Statement [Text Block] |
This annual shareholder report contains important information about the Lord Abbett International Growth Fund for the period of August 1, 2025 to July 31, 2026 (the "reporting period").
|
|
| Additional Information [Text Block] |
You can find additional information about the Fund at lordabbett.com/FundDocuments. You can also request this information by contacting us at 888-522-2388.
|
|
| Additional Information Phone Number |
888-522-2388
|
|
| Additional Information Website |
<span style="box-sizing: border-box; color: rgb(0, 0, 0); display: inline; flex-wrap: nowrap; font-size: 13.3333px; font-weight: 400; grid-area: auto; line-height: 20px; margin: 0px; overflow: visible; text-align: left; text-align-last: auto; white-space-collapse: preserve-breaks;">lordabbett.com/FundDocuments</span>
|
|
| Expenses [Text Block] |
What were the Fund costs for the reporting period?(based on a hypothetical $10,000 investment) Table SummaryClass Name | Costs of a $10,000 investment | Costs paid as a percentage of a $10,000 investment |
|---|
Class R5 | $79 | 0.70% |
|---|
|
|
| Expenses Paid, Amount |
$ 79
|
|
| Expense Ratio, Percent |
0.70%
|
|
| Factors Affecting Performance [Text Block] |
How did the Fund perform last year and what affected its performance?For the fiscal year ended July 31, 2026, the Fund returned 26.72%, reflecting performance at the net asset value (NAV) of Class R5 shares, with all distributions reinvested, compared to the 20.42% return of a securities market index with investment characteristics similar to those of the Fund, the MSCI All Country World ex USA Growth Index (Net). The Fund's broad-based securities market index, the MSCI EAFE Net Index, returned 24.33% over the same period. Markets navigated a resilient economic backdrop amid geopolitical and inflation uncertainty. Healthy consumer spending, labor markets, and corporate earnings supported the outlook, while artificial intelligence ("AI") disruption concerns and U.S.-Iran tensions drove volatility and higher energy prices. A June ceasefire stabilized oil markets, though geopolitical tensions continued to influence Treasury yields. Meanwhile, Kevin Warsh became Fed Chair, and the Fed held rates unchanged in July amid resilient economic data. Top contributors to performance: Security selection within the Information Technology sector contributed to relative performance over the period, driven by an allocation to SK Hynix, a semiconductor manufacturer. Security selection within the Financials sector also contributed to relative performance, driven by an allocation to OTP Bank, a financial services company. Top detractors from performance: Security selection within the Materials sector detracted from relative performance over the period, driven by an allocation to Heidelberg Materials, a building materials company. Security selection within the Communication Services sector also detracted from relative performance, driven by an allocation to Meta Platforms, a technology company. |
|
| Performance Past Does Not Indicate Future [Text] |
The Fund's past performance is no guarantee of future results.
|
|
| Line Graph [Table Text Block] |
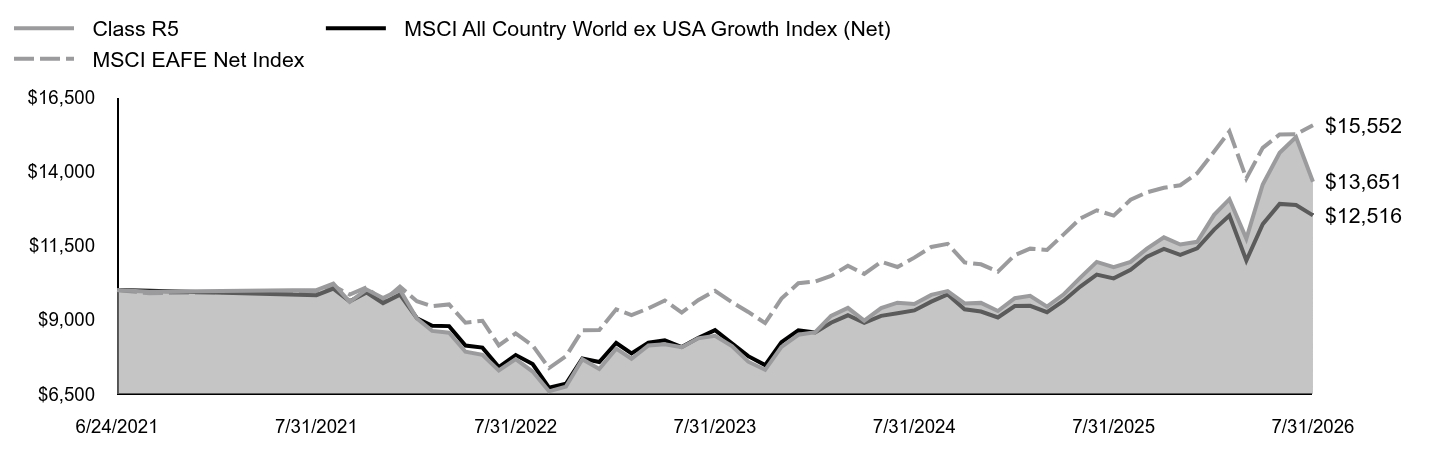 Table Summary | Class R5 | MSCI All Country World ex USA Growth Index (Net) | MSCI EAFE Net Index |
|---|
6/24/2021 | $10,000 | $10,000 | $10,000 |
|---|
6/30/2021 | $9,941 | $9,981 | $9,893 |
|---|
7/31/2021 | $10,000 | $9,830 | $9,967 |
|---|
8/31/2021 | $10,218 | $10,052 | $10,143 |
|---|
9/30/2021 | $9,603 | $9,620 | $9,849 |
|---|
10/31/2021 | $10,020 | $9,918 | $10,091 |
|---|
11/30/2021 | $9,736 | $9,560 | $9,621 |
|---|
12/31/2021 | $10,007 | $9,847 | $10,114 |
|---|
1/31/2022 | $9,042 | $9,053 | $9,625 |
|---|
2/28/2022 | $8,625 | $8,801 | $9,455 |
|---|
3/31/2022 | $8,566 | $8,787 | $9,516 |
|---|
4/30/2022 | $7,925 | $8,133 | $8,900 |
|---|
5/31/2022 | $7,819 | $8,063 | $8,967 |
|---|
6/30/2022 | $7,297 | $7,406 | $8,135 |
|---|
7/31/2022 | $7,673 | $7,814 | $8,540 |
|---|
8/31/2022 | $7,257 | $7,509 | $8,135 |
|---|
9/30/2022 | $6,590 | $6,712 | $7,374 |
|---|
10/31/2022 | $6,748 | $6,844 | $7,770 |
|---|
11/30/2022 | $7,673 | $7,695 | $8,645 |
|---|
12/31/2022 | $7,341 | $7,577 | $8,652 |
|---|
1/31/2023 | $8,028 | $8,218 | $9,353 |
|---|
2/28/2023 | $7,688 | $7,867 | $9,158 |
|---|
3/31/2023 | $8,135 | $8,228 | $9,385 |
|---|
4/30/2023 | $8,175 | $8,312 | $9,650 |
|---|
5/31/2023 | $8,075 | $8,081 | $9,241 |
|---|
6/30/2023 | $8,375 | $8,388 | $9,662 |
|---|
7/31/2023 | $8,462 | $8,650 | $9,974 |
|---|
8/31/2023 | $8,115 | $8,209 | $9,592 |
|---|
9/30/2023 | $7,588 | $7,775 | $9,265 |
|---|
10/31/2023 | $7,315 | $7,473 | $8,889 |
|---|
11/30/2023 | $8,088 | $8,246 | $9,714 |
|---|
12/31/2023 | $8,495 | $8,641 | $10,230 |
|---|
1/31/2024 | $8,582 | $8,574 | $10,289 |
|---|
2/29/2024 | $9,132 | $8,902 | $10,477 |
|---|
3/31/2024 | $9,401 | $9,151 | $10,822 |
|---|
4/30/2024 | $8,971 | $8,898 | $10,545 |
|---|
5/31/2024 | $9,394 | $9,133 | $10,953 |
|---|
6/30/2024 | $9,576 | $9,218 | $10,777 |
|---|
7/31/2024 | $9,535 | $9,315 | $11,093 |
|---|
8/31/2024 | $9,838 | $9,611 | $11,453 |
|---|
9/30/2024 | $9,965 | $9,855 | $11,559 |
|---|
10/31/2024 | $9,549 | $9,354 | $10,931 |
|---|
11/30/2024 | $9,569 | $9,277 | $10,869 |
|---|
12/31/2024 | $9,296 | $9,078 | $10,621 |
|---|
1/31/2025 | $9,728 | $9,465 | $11,180 |
|---|
2/28/2025 | $9,809 | $9,472 | $11,396 |
|---|
3/31/2025 | $9,444 | $9,257 | $11,350 |
|---|
4/30/2025 | $9,849 | $9,634 | $11,870 |
|---|
5/31/2025 | $10,422 | $10,120 | $12,413 |
|---|
6/30/2025 | $10,949 | $10,521 | $12,687 |
|---|
7/31/2025 | $10,773 | $10,394 | $12,509 |
|---|
8/31/2025 | $10,949 | $10,687 | $13,042 |
|---|
9/30/2025 | $11,394 | $11,122 | $13,292 |
|---|
10/31/2025 | $11,778 | $11,390 | $13,448 |
|---|
11/30/2025 | $11,536 | $11,186 | $13,532 |
|---|
12/31/2025 | $11,627 | $11,407 | $13,937 |
|---|
1/31/2026 | $12,534 | $12,037 | $14,665 |
|---|
2/28/2026 | $13,062 | $12,515 | $15,343 |
|---|
3/31/2026 | $11,735 | $10,995 | $13,764 |
|---|
4/30/2026 | $13,557 | $12,221 | $14,790 |
|---|
5/31/2026 | $14,627 | $12,903 | $15,244 |
|---|
6/30/2026 | $15,155 | $12,868 | $15,254 |
|---|
7/31/2026 | $13,651 | $12,516 | $15,552 |
|---|
|
|
| Average Annual Return [Table Text Block] |
Table SummaryAATR | 1 Year | 5 Years | Since Inception
6/24/21 |
|---|
Class R5 at NAV | 26.72% | 6.42% | 6.29% |
|---|
MSCI All Country World ex USA Growth Index (Net) | 20.42% | 4.95% | 4.50% |
|---|
MSCI EAFE Net Index | 24.33% | 9.31% | 9.04% |
|---|
|
|
| Performance Inception Date |
Jun. 24, 2021
|
|
| No Deduction of Taxes [Text Block] |
The returns do not reflect the deduction of taxes that a shareholder would pay on Fund distributions or redemption of Fund shares.
|
|
| AssetsNet |
$ 6,621,278
|
|
| Holdings Count | Holding |
80
|
|
| Advisory Fees Paid, Amount |
$ 0
|
|
| InvestmentCompanyPortfolioTurnover |
99.00%
|
|
| Additional Fund Statistics [Text Block] |
Table SummaryTotal Net Assets | $6,621,278 |
|---|
# of Portfolio Holdings | 80 |
|---|
Portfolio Turnover Rate | 99% |
|---|
Total Advisory Fees Paid | $0 |
|---|
|
|
| Holdings [Text Block] |
Table SummaryPortfolio Holdings Presented by SectorFootnote Reference* | % Footnote Reference** |
|---|
Communication Services | 4.46% | Consumer Discretionary | 11.45% | Consumer Staples | 3.34% | Financials | 11.72% | Health Care | 11.10% | Industrials | 20.62% | Information Technology | 27.00% | Materials | 4.29% | Repurchase Agreements | 6.02% | Total | 100.00% | | Footnote | Description | Footnote* | A sector may comprise several industries. | Footnote** | Represents percent of total investments, which excludes derivatives. |
|
|
| Material Fund Change [Text Block] |
There were no material changes to the Fund during the reporting period. |
|
| Summary of Change Legend [Text Block] |
There were no material changes to the Fund during the reporting period.
|
|
| C000228424 |
|
|
| Shareholder Report [Line Items] |
|
|
| Fund Name |
Lord Abbett International Growth Fund
|
|
| Class Name |
Class R6
|
|
| Trading Symbol |
LAVGX
|
|
| Annual or Semi-Annual Statement [Text Block] |
This annual shareholder report contains important information about the Lord Abbett International Growth Fund for the period of August 1, 2025 to July 31, 2026 (the "reporting period").
|
|
| Additional Information [Text Block] |
You can find additional information about the Fund at lordabbett.com/FundDocuments. You can also request this information by contacting us at 888-522-2388.
|
|
| Additional Information Phone Number |
888-522-2388
|
|
| Additional Information Website |
<span style="box-sizing: border-box; color: rgb(0, 0, 0); display: inline; flex-wrap: nowrap; font-size: 13.3333px; font-weight: 400; grid-area: auto; line-height: 20px; margin: 0px; overflow: visible; text-align: left; text-align-last: auto; white-space-collapse: preserve-breaks;">lordabbett.com/FundDocuments</span>
|
|
| Expenses [Text Block] |
What were the Fund costs for the reporting period?(based on a hypothetical $10,000 investment) Table SummaryClass Name | Costs of a $10,000 investment | Costs paid as a percentage of a $10,000 investment |
|---|
Class R6 | $74 | 0.65% |
|---|
|
|
| Expenses Paid, Amount |
$ 74
|
|
| Expense Ratio, Percent |
0.65%
|
|
| Factors Affecting Performance [Text Block] |
How did the Fund perform last year and what affected its performance?For the fiscal year ended July 31, 2026, the Fund returned 26.78%, reflecting performance at the net asset value (NAV) of Class R6 shares, with all distributions reinvested, compared to the 20.42% return of a securities market index with investment characteristics similar to those of the Fund, the MSCI All Country World ex USA Growth Index (Net). The Fund's broad-based securities market index, the MSCI EAFE Net Index, returned 24.33% over the same period. Markets navigated a resilient economic backdrop amid geopolitical and inflation uncertainty. Healthy consumer spending, labor markets, and corporate earnings supported the outlook, while artificial intelligence ("AI") disruption concerns and U.S.-Iran tensions drove volatility and higher energy prices. A June ceasefire stabilized oil markets, though geopolitical tensions continued to influence Treasury yields. Meanwhile, Kevin Warsh became Fed Chair, and the Fed held rates unchanged in July amid resilient economic data. Top contributors to performance: Security selection within the Information Technology sector contributed to relative performance over the period, driven by an allocation to SK Hynix, a semiconductor manufacturer. Security selection within the Financials sector also contributed to relative performance, driven by an allocation to OTP Bank, a financial services company. Top detractors from performance: Security selection within the Materials sector detracted from relative performance over the period, driven by an allocation to Heidelberg Materials, a building materials company. Security selection within the Communication Services sector also detracted from relative performance, driven by an allocation to Meta Platforms, a technology company. |
|
| Performance Past Does Not Indicate Future [Text] |
The Fund's past performance is no guarantee of future results.
|
|
| Line Graph [Table Text Block] |
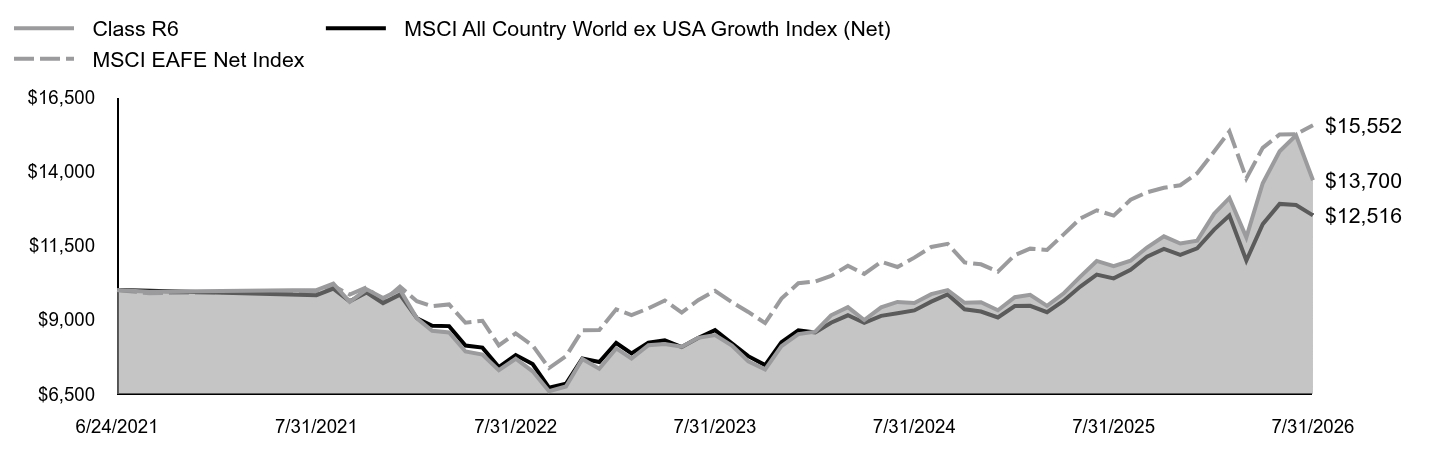 Table Summary | Class R6 | MSCI All Country World ex USA Growth Index (Net) | MSCI EAFE Net Index |
|---|
6/24/2021 | $10,000 | $10,000 | $10,000 |
|---|
6/30/2021 | $9,941 | $9,981 | $9,893 |
|---|
7/31/2021 | $10,000 | $9,830 | $9,967 |
|---|
8/31/2021 | $10,218 | $10,052 | $10,143 |
|---|
9/30/2021 | $9,603 | $9,620 | $9,849 |
|---|
10/31/2021 | $10,026 | $9,918 | $10,091 |
|---|
11/30/2021 | $9,736 | $9,560 | $9,621 |
|---|
12/31/2021 | $10,013 | $9,847 | $10,114 |
|---|
1/31/2022 | $9,048 | $9,053 | $9,625 |
|---|
2/28/2022 | $8,632 | $8,801 | $9,455 |
|---|
3/31/2022 | $8,572 | $8,787 | $9,516 |
|---|
4/30/2022 | $7,931 | $8,133 | $8,900 |
|---|
5/31/2022 | $7,826 | $8,063 | $8,967 |
|---|
6/30/2022 | $7,303 | $7,406 | $8,135 |
|---|
7/31/2022 | $7,687 | $7,814 | $8,540 |
|---|
8/31/2022 | $7,264 | $7,509 | $8,135 |
|---|
9/30/2022 | $6,596 | $6,712 | $7,374 |
|---|
10/31/2022 | $6,755 | $6,844 | $7,770 |
|---|
11/30/2022 | $7,680 | $7,695 | $8,645 |
|---|
12/31/2022 | $7,350 | $7,577 | $8,652 |
|---|
1/31/2023 | $8,037 | $8,218 | $9,353 |
|---|
2/28/2023 | $7,697 | $7,867 | $9,158 |
|---|
3/31/2023 | $8,144 | $8,228 | $9,385 |
|---|
4/30/2023 | $8,184 | $8,312 | $9,650 |
|---|
5/31/2023 | $8,091 | $8,081 | $9,241 |
|---|
6/30/2023 | $8,391 | $8,388 | $9,662 |
|---|
7/31/2023 | $8,484 | $8,650 | $9,974 |
|---|
8/31/2023 | $8,131 | $8,209 | $9,592 |
|---|
9/30/2023 | $7,604 | $7,775 | $9,265 |
|---|
10/31/2023 | $7,330 | $7,473 | $8,889 |
|---|
11/30/2023 | $8,111 | $8,246 | $9,714 |
|---|
12/31/2023 | $8,519 | $8,641 | $10,230 |
|---|
1/31/2024 | $8,600 | $8,574 | $10,289 |
|---|
2/29/2024 | $9,151 | $8,902 | $10,477 |
|---|
3/31/2024 | $9,426 | $9,151 | $10,822 |
|---|
4/30/2024 | $8,990 | $8,898 | $10,545 |
|---|
5/31/2024 | $9,420 | $9,133 | $10,953 |
|---|
6/30/2024 | $9,601 | $9,218 | $10,777 |
|---|
7/31/2024 | $9,568 | $9,315 | $11,093 |
|---|
8/31/2024 | $9,863 | $9,611 | $11,453 |
|---|
9/30/2024 | $9,998 | $9,855 | $11,559 |
|---|
10/31/2024 | $9,574 | $9,354 | $10,931 |
|---|
11/30/2024 | $9,594 | $9,277 | $10,869 |
|---|
12/31/2024 | $9,321 | $9,078 | $10,621 |
|---|
1/31/2025 | $9,760 | $9,465 | $11,180 |
|---|
2/28/2025 | $9,841 | $9,472 | $11,396 |
|---|
3/31/2025 | $9,470 | $9,257 | $11,350 |
|---|
4/30/2025 | $9,882 | $9,634 | $11,870 |
|---|
5/31/2025 | $10,455 | $10,120 | $12,413 |
|---|
6/30/2025 | $10,982 | $10,521 | $12,687 |
|---|
7/31/2025 | $10,806 | $10,394 | $12,509 |
|---|
8/31/2025 | $10,988 | $10,687 | $13,042 |
|---|
9/30/2025 | $11,434 | $11,122 | $13,292 |
|---|
10/31/2025 | $11,812 | $11,390 | $13,448 |
|---|
11/30/2025 | $11,569 | $11,186 | $13,532 |
|---|
12/31/2025 | $11,667 | $11,407 | $13,937 |
|---|
1/31/2026 | $12,575 | $12,037 | $14,665 |
|---|
2/28/2026 | $13,104 | $12,515 | $15,343 |
|---|
3/31/2026 | $11,776 | $10,995 | $13,764 |
|---|
4/30/2026 | $13,598 | $12,221 | $14,790 |
|---|
5/31/2026 | $14,676 | $12,903 | $15,244 |
|---|
6/30/2026 | $15,211 | $12,868 | $15,254 |
|---|
7/31/2026 | $13,700 | $12,516 | $15,552 |
|---|
|
|
| Average Annual Return [Table Text Block] |
Table SummaryAATR | 1 Year | 5 Years | Since Inception
6/24/21 |
|---|
Class R6 at NAV | 26.78% | 6.50% | 6.37% |
|---|
MSCI All Country World ex USA Growth Index (Net) | 20.42% | 4.95% | 4.50% |
|---|
MSCI EAFE Net Index | 24.33% | 9.31% | 9.04% |
|---|
|
|
| Performance Inception Date |
Jun. 24, 2021
|
|
| No Deduction of Taxes [Text Block] |
The returns do not reflect the deduction of taxes that a shareholder would pay on Fund distributions or redemption of Fund shares.
|
|
| AssetsNet |
$ 6,621,278
|
|
| Holdings Count | Holding |
80
|
|
| Advisory Fees Paid, Amount |
$ 0
|
|
| InvestmentCompanyPortfolioTurnover |
99.00%
|
|
| Additional Fund Statistics [Text Block] |
Table SummaryTotal Net Assets | $6,621,278 |
|---|
# of Portfolio Holdings | 80 |
|---|
Portfolio Turnover Rate | 99% |
|---|
Total Advisory Fees Paid | $0 |
|---|
|
|
| Holdings [Text Block] |
Table SummaryPortfolio Holdings Presented by SectorFootnote Reference* | % Footnote Reference** |
|---|
Communication Services | 4.46% | Consumer Discretionary | 11.45% | Consumer Staples | 3.34% | Financials | 11.72% | Health Care | 11.10% | Industrials | 20.62% | Information Technology | 27.00% | Materials | 4.29% | Repurchase Agreements | 6.02% | Total | 100.00% | | Footnote | Description | Footnote* | A sector may comprise several industries. | Footnote** | Represents percent of total investments, which excludes derivatives. |
|
|
| Material Fund Change [Text Block] |
There were no material changes to the Fund during the reporting period. |
|
| Summary of Change Legend [Text Block] |
There were no material changes to the Fund during the reporting period.
|
|
| C000218936 |
|
|
| Shareholder Report [Line Items] |
|
|
| Fund Name |
Lord Abbett Short Duration High Yield Fund
|
|
| Class Name |
Class A
|
|
| Trading Symbol |
LSYAX
|
|
| Annual or Semi-Annual Statement [Text Block] |
This annual shareholder report contains important information about the Lord Abbett Short Duration High Yield Fund for the period of August 1, 2025 to July 31, 2026 (the "reporting period").
|
|
| Additional Information [Text Block] |
You can find additional information about the Fund at lordabbett.com/FundDocuments. You can also request this information by contacting us at 888-522-2388.
|
|
| Material Fund Change Notice [Text Block] |
This report describes changes to the Fund that occurred during the reporting period.
|
|
| Additional Information Phone Number |
888-522-2388
|
|
| Additional Information Website |
<span style="box-sizing: border-box; color: rgb(0, 0, 0); display: inline; flex-wrap: nowrap; font-size: 13.3333px; font-weight: 400; grid-area: auto; line-height: 20px; margin: 0px; overflow: visible; text-align: left; text-align-last: auto; white-space-collapse: preserve-breaks;">lordabbett.com/FundDocuments</span>
|
|
| Expenses [Text Block] |
What were the Fund costs for the reporting period?(based on a hypothetical $10,000 investment) Table SummaryClass Name | Costs of a $10,000 investment | Costs paid as a percentage of a $10,000 investment |
|---|
Class A | $68 | 0.66% |
|---|
|
|
| Expenses Paid, Amount |
$ 68
|
|
| Expense Ratio, Percent |
0.66%
|
|
| Factors Affecting Performance [Text Block] |
How did the Fund perform last year and what affected its performance?For the fiscal year ended July 31, 2026, the Fund returned 5.74%, reflecting performance at the net asset value (NAV) of Class A shares, with all distributions reinvested, compared to the 5.56% return of a securities market index with investment characteristics similar to those of the Fund, the ICE BofA High Yield U.S. Corporate Cash Pay BB-B (1-5yrs) Index. The Fund's broad-based securities market index, the Bloomberg U.S. Aggregate Bond Index, returned 2.71% over the same period. Over the period, U.S. fixed income markets were supported by resilient economic growth, solid consumer spending, healthy corporate earnings and continued investment, particularly in artificial intelligence. Markets also faced meaningful headwinds from rising inflation pressures and heightened geopolitical tensions, including the escalation of conflict between the U.S. and Iran and its impact on energy prices. During the fiscal year, these developments contributed to periods of elevated volatility and shifting expectations for Federal Reserve policy. Despite these challenges, credit markets remained broadly constructive, supported by resilient corporate fundamentals and continued demand for income. Top contributors to performance: Security selection within the Energy, Capital Goods and Healthcare sectors contributed to relative performance. Credit selection within BB-rated bonds also contributed to relative performance. Allocation to convertible bonds also contributed to relative performance. Top detractors from performance: Credit selection within Basic Industry, Retail and Automotive sectors detracted from relative performance. Allocation to bank loans also detracted from relative performance. |
|
| Performance Past Does Not Indicate Future [Text] |
The Fund's past performance is no guarantee of future results.
|
|
| Line Graph [Table Text Block] |
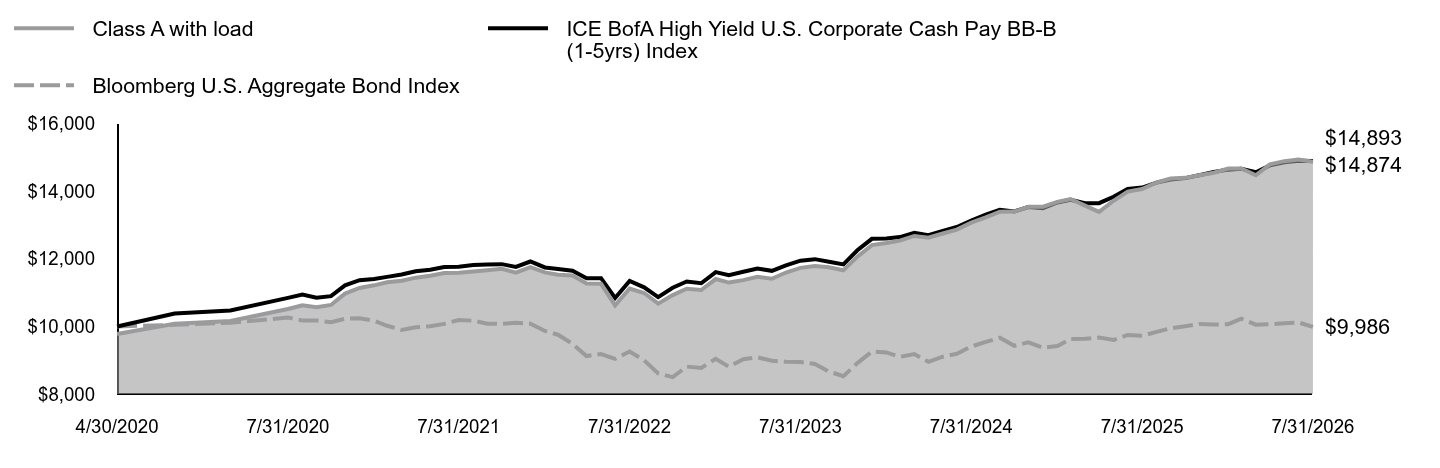 Table Summary | Class A with load | ICE BofA High Yield U.S. Corporate Cash Pay BB-B (1-5yrs) Index | Bloomberg U.S. Aggregate Bond Index |
|---|
4/30/2020 | $9,776 | $10,000 | $10,000 |
|---|
5/31/2020 | $10,080 | $10,381 | $10,047 |
|---|
6/30/2020 | $10,163 | $10,474 | $10,110 |
|---|
7/31/2020 | $10,515 | $10,846 | $10,261 |
|---|
8/31/2020 | $10,627 | $10,941 | $10,178 |
|---|
9/30/2020 | $10,571 | $10,851 | $10,172 |
|---|
10/31/2020 | $10,636 | $10,896 | $10,127 |
|---|
11/30/2020 | $10,972 | $11,216 | $10,226 |
|---|
12/31/2020 | $11,138 | $11,367 | $10,240 |
|---|
1/31/2021 | $11,216 | $11,404 | $10,167 |
|---|
2/28/2021 | $11,305 | $11,467 | $10,020 |
|---|
3/31/2021 | $11,354 | $11,538 | $9,895 |
|---|
4/30/2021 | $11,443 | $11,635 | $9,973 |
|---|
5/31/2021 | $11,501 | $11,675 | $10,006 |
|---|
6/30/2021 | $11,583 | $11,761 | $10,076 |
|---|
7/31/2021 | $11,589 | $11,764 | $10,189 |
|---|
8/31/2021 | $11,626 | $11,815 | $10,169 |
|---|
9/30/2021 | $11,665 | $11,832 | $10,081 |
|---|
10/31/2021 | $11,703 | $11,843 | $10,079 |
|---|
11/30/2021 | $11,592 | $11,760 | $10,108 |
|---|
12/31/2021 | $11,754 | $11,921 | $10,083 |
|---|
1/31/2022 | $11,599 | $11,745 | $9,865 |
|---|
2/28/2022 | $11,529 | $11,700 | $9,755 |
|---|
3/31/2022 | $11,507 | $11,650 | $9,484 |
|---|
4/30/2022 | $11,272 | $11,427 | $9,124 |
|---|
5/31/2022 | $11,261 | $11,428 | $9,183 |
|---|
6/30/2022 | $10,623 | $10,843 | $9,039 |
|---|
7/31/2022 | $11,121 | $11,344 | $9,260 |
|---|
8/31/2022 | $10,989 | $11,158 | $8,998 |
|---|
9/30/2022 | $10,675 | $10,869 | $8,610 |
|---|
10/31/2022 | $10,928 | $11,145 | $8,498 |
|---|
11/30/2022 | $11,117 | $11,330 | $8,811 |
|---|
12/31/2022 | $11,077 | $11,278 | $8,771 |
|---|
1/31/2023 | $11,402 | $11,606 | $9,041 |
|---|
2/28/2023 | $11,298 | $11,518 | $8,807 |
|---|
3/31/2023 | $11,371 | $11,618 | $9,031 |
|---|
4/30/2023 | $11,468 | $11,712 | $9,085 |
|---|
5/31/2023 | $11,411 | $11,645 | $8,986 |
|---|
6/30/2023 | $11,595 | $11,805 | $8,954 |
|---|
7/31/2023 | $11,733 | $11,947 | $8,948 |
|---|
8/31/2023 | $11,786 | $11,991 | $8,891 |
|---|
9/30/2023 | $11,753 | $11,916 | $8,665 |
|---|
10/31/2023 | $11,662 | $11,836 | $8,528 |
|---|
11/30/2023 | $12,065 | $12,253 | $8,914 |
|---|
12/31/2023 | $12,407 | $12,592 | $9,256 |
|---|
1/31/2024 | $12,468 | $12,605 | $9,230 |
|---|
2/29/2024 | $12,540 | $12,645 | $9,100 |
|---|
3/31/2024 | $12,678 | $12,770 | $9,184 |
|---|
4/30/2024 | $12,624 | $12,702 | $8,952 |
|---|
5/31/2024 | $12,751 | $12,826 | $9,104 |
|---|
6/30/2024 | $12,865 | $12,942 | $9,190 |
|---|
7/31/2024 | $13,071 | $13,135 | $9,405 |
|---|
8/31/2024 | $13,227 | $13,310 | $9,540 |
|---|
9/30/2024 | $13,395 | $13,450 | $9,667 |
|---|
10/31/2024 | $13,400 | $13,401 | $9,428 |
|---|
11/30/2024 | $13,540 | $13,534 | $9,527 |
|---|
12/31/2024 | $13,542 | $13,500 | $9,371 |
|---|
1/31/2025 | $13,686 | $13,668 | $9,421 |
|---|
2/28/2025 | $13,772 | $13,750 | $9,628 |
|---|
3/31/2025 | $13,574 | $13,644 | $9,632 |
|---|
4/30/2025 | $13,388 | $13,649 | $9,670 |
|---|
5/31/2025 | $13,719 | $13,838 | $9,601 |
|---|
6/30/2025 | $13,991 | $14,066 | $9,748 |
|---|
7/31/2025 | $14,067 | $14,109 | $9,723 |
|---|
8/31/2025 | $14,260 | $14,258 | $9,839 |
|---|
9/30/2025 | $14,378 | $14,349 | $9,946 |
|---|
10/31/2025 | $14,397 | $14,389 | $10,008 |
|---|
11/30/2025 | $14,476 | $14,474 | $10,071 |
|---|
12/31/2025 | $14,550 | $14,570 | $10,056 |
|---|
1/31/2026 | $14,673 | $14,640 | $10,066 |
|---|
2/28/2026 | $14,677 | $14,664 | $10,231 |
|---|
3/31/2026 | $14,474 | $14,563 | $10,051 |
|---|
4/30/2026 | $14,796 | $14,767 | $10,062 |
|---|
5/31/2026 | $14,891 | $14,859 | $10,094 |
|---|
6/30/2026 | $14,937 | $14,901 | $10,118 |
|---|
7/31/2026 | $14,874 | $14,893 | $9,986 |
|---|
|
|
| Average Annual Return [Table Text Block] |
Table SummaryAATR | 1 Year | 5 Years | Since Inception
4/30/20 |
|---|
Class A at NAV | 5.74% | 5.12% | 6.94% |
|---|
Class A with sales charge | 3.31% | 4.65% | 6.56% |
|---|
ICE BofA High Yield U.S. Corporate Cash Pay BB-B (1-5yrs) Index | 5.56% | 4.83% | 6.58% |
|---|
Bloomberg U.S. Aggregate Bond Index | 2.71% | (0.40%) | (0.02%) |
|---|
|
|
| Performance Inception Date |
Apr. 30, 2020
|
|
| No Deduction of Taxes [Text Block] |
The returns do not reflect the deduction of taxes that a shareholder would pay on Fund distributions or redemption of Fund shares.
|
|
| AssetsNet |
$ 10,701,227,755
|
|
| Holdings Count | Holding |
681
|
|
| Advisory Fees Paid, Amount |
$ 30,195,663
|
|
| InvestmentCompanyPortfolioTurnover |
92.00%
|
|
| Additional Fund Statistics [Text Block] |
Table SummaryTotal Net Assets | $10,701,227,755 |
|---|
# of Portfolio Holdings | 681 |
|---|
Portfolio Turnover Rate | 92% |
|---|
Total Advisory Fees Paid | $30,195,663 |
|---|
|
|
| Holdings [Text Block] |
Table SummaryPortfolio Holdings Presented by Portfolio Allocation | %Footnote Reference* |
|---|
Asset-Backed Securities | 1.14% | Common Stocks | 0.03% | Convertible Bonds | 2.88% | Convertible Preferred Stocks | 0.23% | Corporate Bonds | 86.17% | Floating Rate Loans | 3.71% | Foreign Government Obligations | 0.15% | Government Sponsored Enterprises Collateralized Mortgage Obligations | 0.55% | Non-Agency Commercial Mortgage-Backed Securities | 0.22% | Preferred Stocks | 0.02% | Warrants | 0.00%Footnote Reference** | Money Market FundsFootnote Reference† | 4.41% | Time DepositsFootnote Reference† | 0.49% | Total | 100.00% | | Footnote | Description | Footnote* | Represents percent of total investments, which excludes derivatives. | Footnote** | Amount is less than 0.01% | Footnote† | Securities were purchased with the cash collateral from loaned securities. |
|
|
| Material Fund Change [Text Block] |
This is a summary of certain changes to the Fund that occurred during the reporting period, except as otherwise noted. For more information contact 888-522-2388. Effective December 1, 2025, the Fund's Expense Limitation Agreement expired and was not renewed. Prior to that date, the Adviser contractually agreed to limit total net annual operating expenses, excluding 12b-1 fees and acquired fund fees and expenses, interest-related expenses, taxes, expenses related to litigation and potential litigation, and extraordinary expenses, to an annual rate of 0.45%. |
|
| Material Fund Change Expenses [Text Block] |
Effective December 1, 2025, the Fund's Expense Limitation Agreement expired and was not renewed. Prior to that date, the Adviser contractually agreed to limit total net annual operating expenses, excluding 12b-1 fees and acquired fund fees and expenses, interest-related expenses, taxes, expenses related to litigation and potential litigation, and extraordinary expenses, to an annual rate of 0.45%.
|
|
| Summary of Change Legend [Text Block] |
This is a summary of certain changes to the Fund that occurred during the reporting period, except as otherwise noted. For more information contact 888-522-2388.
|
|
| Updated Prospectus Phone Number |
888-522-2388
|
|
| C000218940 |
|
|
| Shareholder Report [Line Items] |
|
|
| Fund Name |
Lord Abbett Short Duration High Yield Fund
|
|
| Class Name |
Class C
|
|
| Trading Symbol |
LSYCX
|
|
| Annual or Semi-Annual Statement [Text Block] |
This annual shareholder report contains important information about the Lord Abbett Short Duration High Yield Fund for the period of August 1, 2025 to July 31, 2026 (the "reporting period").
|
|
| Additional Information [Text Block] |
You can find additional information about the Fund at lordabbett.com/FundDocuments. You can also request this information by contacting us at 888-522-2388.
|
|
| Material Fund Change Notice [Text Block] |
This report describes changes to the Fund that occurred during the reporting period.
|
|
| Additional Information Phone Number |
888-522-2388
|
|
| Additional Information Website |
<span style="box-sizing: border-box; color: rgb(0, 0, 0); display: inline; flex-wrap: nowrap; font-size: 13.3333px; font-weight: 400; grid-area: auto; line-height: 20px; margin: 0px; overflow: visible; text-align: left; text-align-last: auto; white-space-collapse: preserve-breaks;">lordabbett.com/FundDocuments</span>
|
|
| Expenses [Text Block] |
What were the Fund costs for the reporting period?(based on a hypothetical $10,000 investment) Table SummaryClass Name | Costs of a $10,000 investment | Costs paid as a percentage of a $10,000 investment |
|---|
Class C | $141 | 1.38% |
|---|
|
|
| Expenses Paid, Amount |
$ 141
|
|
| Expense Ratio, Percent |
1.38%
|
|
| Factors Affecting Performance [Text Block] |
How did the Fund perform last year and what affected its performance?For the fiscal year ended July 31, 2026, the Fund returned 4.99%, reflecting performance at the net asset value (NAV) of Class C shares, with all distributions reinvested, compared to the 5.56% return of a securities market index with investment characteristics similar to those of the Fund, the ICE BofA High Yield U.S. Corporate Cash Pay BB-B (1-5yrs) Index. The Fund's broad-based securities market index, the Bloomberg U.S. Aggregate Bond Index, returned 2.71% over the same period. Over the period, U.S. fixed income markets were supported by resilient economic growth, solid consumer spending, healthy corporate earnings and continued investment, particularly in artificial intelligence. Markets also faced meaningful headwinds from rising inflation pressures and heightened geopolitical tensions, including the escalation of conflict between the U.S. and Iran and its impact on energy prices. During the fiscal year, these developments contributed to periods of elevated volatility and shifting expectations for Federal Reserve policy. Despite these challenges, credit markets remained broadly constructive, supported by resilient corporate fundamentals and continued demand for income. Top contributors to performance: Security selection within the Energy, Capital Goods and Healthcare sectors contributed to relative performance. Credit selection within BB-rated bonds also contributed to relative performance. Allocation to convertible bonds also contributed to relative performance. Top detractors from performance: Credit selection within Basic Industry, Retail and Automotive sectors detracted from relative performance. Allocation to bank loans also detracted from relative performance. |
|
| Performance Past Does Not Indicate Future [Text] |
The Fund's past performance is no guarantee of future results.
|
|
| Line Graph [Table Text Block] |
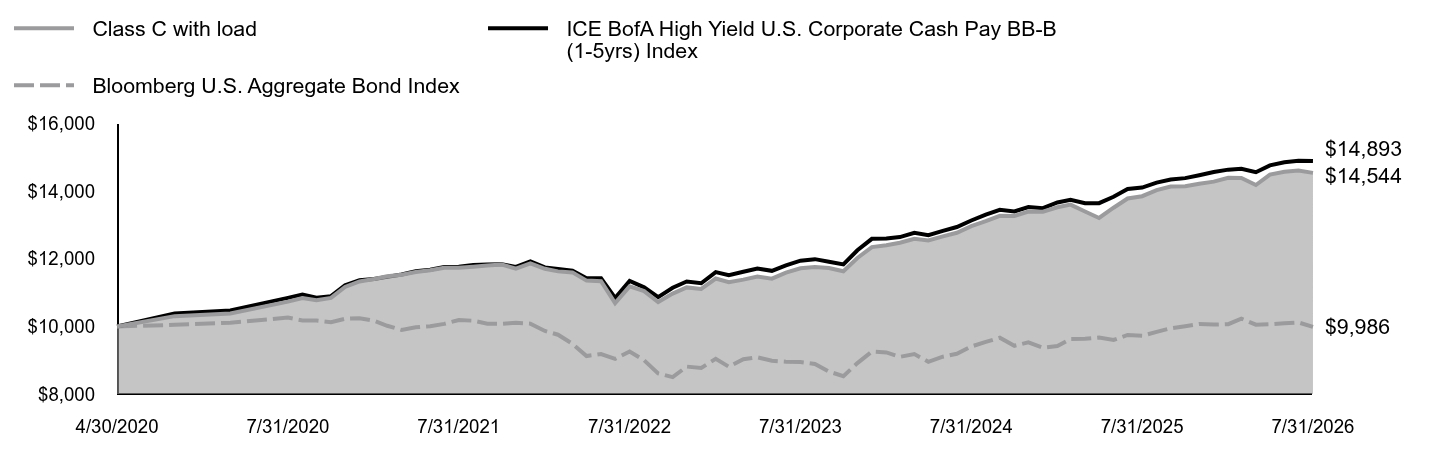 Table Summary | Class C with load | ICE BofA High Yield U.S. Corporate Cash Pay BB-B (1-5yrs) Index | Bloomberg U.S. Aggregate Bond Index |
|---|
4/30/2020 | $10,000 | $10,000 | $10,000 |
|---|
5/31/2020 | $10,304 | $10,381 | $10,047 |
|---|
6/30/2020 | $10,382 | $10,474 | $10,110 |
|---|
7/31/2020 | $10,734 | $10,846 | $10,261 |
|---|
8/31/2020 | $10,842 | $10,941 | $10,178 |
|---|
9/30/2020 | $10,777 | $10,851 | $10,172 |
|---|
10/31/2020 | $10,845 | $10,896 | $10,127 |
|---|
11/30/2020 | $11,169 | $11,216 | $10,226 |
|---|
12/31/2020 | $11,331 | $11,367 | $10,240 |
|---|
1/31/2021 | $11,403 | $11,404 | $10,167 |
|---|
2/28/2021 | $11,487 | $11,467 | $10,020 |
|---|
3/31/2021 | $11,529 | $11,538 | $9,895 |
|---|
4/30/2021 | $11,611 | $11,635 | $9,973 |
|---|
5/31/2021 | $11,663 | $11,675 | $10,006 |
|---|
6/30/2021 | $11,739 | $11,761 | $10,076 |
|---|
7/31/2021 | $11,737 | $11,764 | $10,189 |
|---|
8/31/2021 | $11,768 | $11,815 | $10,169 |
|---|
9/30/2021 | $11,800 | $11,832 | $10,081 |
|---|
10/31/2021 | $11,831 | $11,843 | $10,079 |
|---|
11/30/2021 | $11,712 | $11,760 | $10,108 |
|---|
12/31/2021 | $11,869 | $11,921 | $10,083 |
|---|
1/31/2022 | $11,705 | $11,745 | $9,865 |
|---|
2/28/2022 | $11,629 | $11,700 | $9,755 |
|---|
3/31/2022 | $11,599 | $11,650 | $9,484 |
|---|
4/30/2022 | $11,356 | $11,427 | $9,124 |
|---|
5/31/2022 | $11,338 | $11,428 | $9,183 |
|---|
6/30/2022 | $10,690 | $10,843 | $9,039 |
|---|
7/31/2022 | $11,184 | $11,344 | $9,260 |
|---|
8/31/2022 | $11,045 | $11,158 | $8,998 |
|---|
9/30/2022 | $10,723 | $10,869 | $8,610 |
|---|
10/31/2022 | $10,971 | $11,145 | $8,498 |
|---|
11/30/2022 | $11,155 | $11,330 | $8,811 |
|---|
12/31/2022 | $11,109 | $11,278 | $8,771 |
|---|
1/31/2023 | $11,417 | $11,606 | $9,041 |
|---|
2/28/2023 | $11,307 | $11,518 | $8,807 |
|---|
3/31/2023 | $11,386 | $11,618 | $9,031 |
|---|
4/30/2023 | $11,476 | $11,712 | $9,085 |
|---|
5/31/2023 | $11,413 | $11,645 | $8,986 |
|---|
6/30/2023 | $11,590 | $11,805 | $8,954 |
|---|
7/31/2023 | $11,722 | $11,947 | $8,948 |
|---|
8/31/2023 | $11,757 | $11,991 | $8,891 |
|---|
9/30/2023 | $11,730 | $11,916 | $8,665 |
|---|
10/31/2023 | $11,632 | $11,836 | $8,528 |
|---|
11/30/2023 | $12,027 | $12,253 | $8,914 |
|---|
12/31/2023 | $12,348 | $12,592 | $9,256 |
|---|
1/31/2024 | $12,401 | $12,605 | $9,230 |
|---|
2/29/2024 | $12,478 | $12,645 | $9,100 |
|---|
3/31/2024 | $12,595 | $12,770 | $9,184 |
|---|
4/30/2024 | $12,547 | $12,702 | $8,952 |
|---|
5/31/2024 | $12,665 | $12,826 | $9,104 |
|---|
6/30/2024 | $12,771 | $12,942 | $9,190 |
|---|
7/31/2024 | $12,968 | $13,135 | $9,405 |
|---|
8/31/2024 | $13,115 | $13,310 | $9,540 |
|---|
9/30/2024 | $13,273 | $13,450 | $9,667 |
|---|
10/31/2024 | $13,269 | $13,401 | $9,428 |
|---|
11/30/2024 | $13,400 | $13,534 | $9,527 |
|---|
12/31/2024 | $13,394 | $13,500 | $9,371 |
|---|
1/31/2025 | $13,528 | $13,668 | $9,421 |
|---|
2/28/2025 | $13,605 | $13,750 | $9,628 |
|---|
3/31/2025 | $13,401 | $13,644 | $9,632 |
|---|
4/30/2025 | $13,209 | $13,649 | $9,670 |
|---|
5/31/2025 | $13,513 | $13,838 | $9,601 |
|---|
6/30/2025 | $13,787 | $14,066 | $9,748 |
|---|
7/31/2025 | $13,854 | $14,109 | $9,723 |
|---|
8/31/2025 | $14,034 | $14,258 | $9,839 |
|---|
9/30/2025 | $14,142 | $14,349 | $9,946 |
|---|
10/31/2025 | $14,151 | $14,389 | $10,008 |
|---|
11/30/2025 | $14,221 | $14,474 | $10,071 |
|---|
12/31/2025 | $14,285 | $14,570 | $10,056 |
|---|
1/31/2026 | $14,398 | $14,640 | $10,066 |
|---|
2/28/2026 | $14,393 | $14,664 | $10,231 |
|---|
3/31/2026 | $14,185 | $14,563 | $10,051 |
|---|
4/30/2026 | $14,493 | $14,767 | $10,062 |
|---|
5/31/2026 | $14,577 | $14,859 | $10,094 |
|---|
6/30/2026 | $14,614 | $14,901 | $10,118 |
|---|
7/31/2026 | $14,544 | $14,893 | $9,986 |
|---|
|
|
| Average Annual Return [Table Text Block] |
Table SummaryAATR | 1 Year | 5 Years | Since Inception
4/30/20 |
|---|
Class C at NAV | 4.99% | 4.38% | 6.18% |
|---|
Class C with sales charge | 4.01% | 4.38% | 6.18% |
|---|
ICE BofA High Yield U.S. Corporate Cash Pay BB-B (1-5yrs) Index | 5.56% | 4.83% | 6.58% |
|---|
Bloomberg U.S. Aggregate Bond Index | 2.71% | (0.40%) | (0.02%) |
|---|
|
|
| Performance Inception Date |
Apr. 30, 2020
|
|
| No Deduction of Taxes [Text Block] |
The returns do not reflect the deduction of taxes that a shareholder would pay on Fund distributions or redemption of Fund shares.
|
|
| AssetsNet |
$ 10,701,227,755
|
|
| Holdings Count | Holding |
681
|
|
| Advisory Fees Paid, Amount |
$ 30,195,663
|
|
| InvestmentCompanyPortfolioTurnover |
92.00%
|
|
| Additional Fund Statistics [Text Block] |
Table SummaryTotal Net Assets | $10,701,227,755 |
|---|
# of Portfolio Holdings | 681 |
|---|
Portfolio Turnover Rate | 92% |
|---|
Total Advisory Fees Paid | $30,195,663 |
|---|
|
|
| Holdings [Text Block] |
Table SummaryPortfolio Holdings Presented by Portfolio Allocation | %Footnote Reference* |
|---|
Asset-Backed Securities | 1.14% | Common Stocks | 0.03% | Convertible Bonds | 2.88% | Convertible Preferred Stocks | 0.23% | Corporate Bonds | 86.17% | Floating Rate Loans | 3.71% | Foreign Government Obligations | 0.15% | Government Sponsored Enterprises Collateralized Mortgage Obligations | 0.55% | Non-Agency Commercial Mortgage-Backed Securities | 0.22% | Preferred Stocks | 0.02% | Warrants | 0.00%Footnote Reference** | Money Market FundsFootnote Reference† | 4.41% | Time DepositsFootnote Reference† | 0.49% | Total | 100.00% | | Footnote | Description | Footnote* | Represents percent of total investments, which excludes derivatives. | Footnote** | Amount is less than 0.01% | Footnote† | Securities were purchased with the cash collateral from loaned securities. |
|
|
| Material Fund Change [Text Block] |
This is a summary of certain changes to the Fund that occurred during the reporting period, except as otherwise noted. For more information contact 888-522-2388. Effective December 1, 2025, the Fund's Expense Limitation Agreement expired and was not renewed. Prior to that date, the Adviser contractually agreed to limit total net annual operating expenses, excluding 12b-1 fees and acquired fund fees and expenses, interest-related expenses, taxes, expenses related to litigation and potential litigation, and extraordinary expenses, to an annual rate of 0.45%. |
|
| Material Fund Change Expenses [Text Block] |
Effective December 1, 2025, the Fund's Expense Limitation Agreement expired and was not renewed. Prior to that date, the Adviser contractually agreed to limit total net annual operating expenses, excluding 12b-1 fees and acquired fund fees and expenses, interest-related expenses, taxes, expenses related to litigation and potential litigation, and extraordinary expenses, to an annual rate of 0.45%.
|
|
| Summary of Change Legend [Text Block] |
This is a summary of certain changes to the Fund that occurred during the reporting period, except as otherwise noted. For more information contact 888-522-2388.
|
|
| Updated Prospectus Phone Number |
888-522-2388
|
|
| C000218939 |
|
|
| Shareholder Report [Line Items] |
|
|
| Fund Name |
Lord Abbett Short Duration High Yield Fund
|
|
| Class Name |
Class F
|
|
| Trading Symbol |
LSYFX
|
|
| Annual or Semi-Annual Statement [Text Block] |
This annual shareholder report contains important information about the Lord Abbett Short Duration High Yield Fund for the period of August 1, 2025 to July 31, 2026 (the "reporting period").
|
|
| Additional Information [Text Block] |
You can find additional information about the Fund at lordabbett.com/FundDocuments. You can also request this information by contacting us at 888-522-2388.
|
|
| Material Fund Change Notice [Text Block] |
This report describes changes to the Fund that occurred during the reporting period.
|
|
| Additional Information Phone Number |
888-522-2388
|
|
| Additional Information Website |
<span style="box-sizing: border-box; color: rgb(0, 0, 0); display: inline; flex-wrap: nowrap; font-size: 13.3333px; font-weight: 400; grid-area: auto; line-height: 20px; margin: 0px; overflow: visible; text-align: left; text-align-last: auto; white-space-collapse: preserve-breaks;">lordabbett.com/FundDocuments</span>
|
|
| Expenses [Text Block] |
What were the Fund costs for the reporting period?(based on a hypothetical $10,000 investment) Table SummaryClass Name | Costs of a $10,000 investment | Costs paid as a percentage of a $10,000 investment |
|---|
Class F | $54 | 0.52% |
|---|
|
|
| Expenses Paid, Amount |
$ 54
|
|
| Expense Ratio, Percent |
0.52%
|
|
| Factors Affecting Performance [Text Block] |
How did the Fund perform last year and what affected its performance?For the fiscal year ended July 31, 2026, the Fund returned 5.87%, reflecting performance at the net asset value (NAV) of Class F shares, with all distributions reinvested, compared to the 5.56% return of a securities market index with investment characteristics similar to those of the Fund, the ICE BofA High Yield U.S. Corporate Cash Pay BB-B (1-5yrs) Index. The Fund's broad-based securities market index, the Bloomberg U.S. Aggregate Bond Index, returned 2.71% over the same period. Over the period, U.S. fixed income markets were supported by resilient economic growth, solid consumer spending, healthy corporate earnings and continued investment, particularly in artificial intelligence. Markets also faced meaningful headwinds from rising inflation pressures and heightened geopolitical tensions, including the escalation of conflict between the U.S. and Iran and its impact on energy prices. During the fiscal year, these developments contributed to periods of elevated volatility and shifting expectations for Federal Reserve policy. Despite these challenges, credit markets remained broadly constructive, supported by resilient corporate fundamentals and continued demand for income. Top contributors to performance: Security selection within the Energy, Capital Goods and Healthcare sectors contributed to relative performance. Credit selection within BB-rated bonds also contributed to relative performance. Allocation to convertible bonds also contributed to relative performance. Top detractors from performance: Credit selection within Basic Industry, Retail and Automotive sectors detracted from relative performance. Allocation to bank loans also detracted from relative performance. |
|
| Performance Past Does Not Indicate Future [Text] |
The Fund's past performance is no guarantee of future results.
|
|
| Line Graph [Table Text Block] |
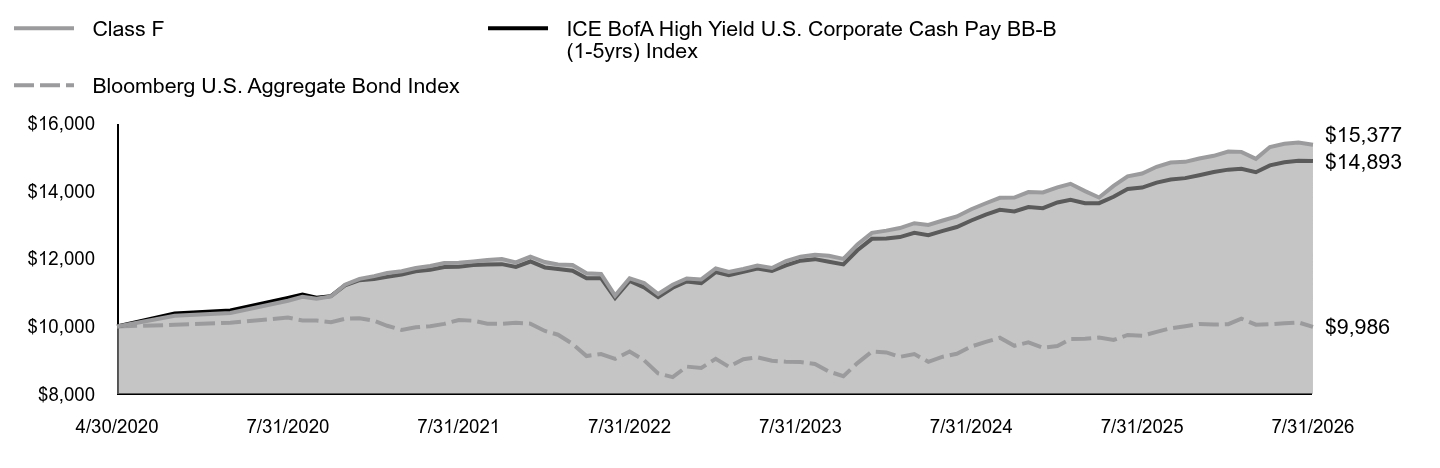 Table Summary | Class F | ICE BofA High Yield U.S. Corporate Cash Pay BB-B (1-5yrs) Index | Bloomberg U.S. Aggregate Bond Index |
|---|
4/30/2020 | $10,000 | $10,000 | $10,000 |
|---|
5/31/2020 | $10,313 | $10,381 | $10,047 |
|---|
6/30/2020 | $10,400 | $10,474 | $10,110 |
|---|
7/31/2020 | $10,761 | $10,846 | $10,261 |
|---|
8/31/2020 | $10,878 | $10,941 | $10,178 |
|---|
9/30/2020 | $10,822 | $10,851 | $10,172 |
|---|
10/31/2020 | $10,890 | $10,896 | $10,127 |
|---|
11/30/2020 | $11,235 | $11,216 | $10,226 |
|---|
12/31/2020 | $11,407 | $11,367 | $10,240 |
|---|
1/31/2021 | $11,489 | $11,404 | $10,167 |
|---|
2/28/2021 | $11,582 | $11,467 | $10,020 |
|---|
3/31/2021 | $11,634 | $11,538 | $9,895 |
|---|
4/30/2021 | $11,727 | $11,635 | $9,973 |
|---|
5/31/2021 | $11,789 | $11,675 | $10,006 |
|---|
6/30/2021 | $11,875 | $11,761 | $10,076 |
|---|
7/31/2021 | $11,883 | $11,764 | $10,189 |
|---|
8/31/2021 | $11,924 | $11,815 | $10,169 |
|---|
9/30/2021 | $11,966 | $11,832 | $10,081 |
|---|
10/31/2021 | $11,996 | $11,843 | $10,079 |
|---|
11/30/2021 | $11,895 | $11,760 | $10,108 |
|---|
12/31/2021 | $12,063 | $11,921 | $10,083 |
|---|
1/31/2022 | $11,905 | $11,745 | $9,865 |
|---|
2/28/2022 | $11,836 | $11,700 | $9,755 |
|---|
3/31/2022 | $11,815 | $11,650 | $9,484 |
|---|
4/30/2022 | $11,575 | $11,427 | $9,124 |
|---|
5/31/2022 | $11,555 | $11,428 | $9,183 |
|---|
6/30/2022 | $10,913 | $10,843 | $9,039 |
|---|
7/31/2022 | $11,426 | $11,344 | $9,260 |
|---|
8/31/2022 | $11,281 | $11,158 | $8,998 |
|---|
9/30/2022 | $10,960 | $10,869 | $8,610 |
|---|
10/31/2022 | $11,233 | $11,145 | $8,498 |
|---|
11/30/2022 | $11,418 | $11,330 | $8,811 |
|---|
12/31/2022 | $11,390 | $11,278 | $8,771 |
|---|
1/31/2023 | $11,715 | $11,606 | $9,041 |
|---|
2/28/2023 | $11,610 | $11,518 | $8,807 |
|---|
3/31/2023 | $11,699 | $11,618 | $9,031 |
|---|
4/30/2023 | $11,799 | $11,712 | $9,085 |
|---|
5/31/2023 | $11,731 | $11,645 | $8,986 |
|---|
6/30/2023 | $11,934 | $11,805 | $8,954 |
|---|
7/31/2023 | $12,066 | $11,947 | $8,948 |
|---|
8/31/2023 | $12,123 | $11,991 | $8,891 |
|---|
9/30/2023 | $12,091 | $11,916 | $8,665 |
|---|
10/31/2023 | $11,999 | $11,836 | $8,528 |
|---|
11/30/2023 | $12,428 | $12,253 | $8,914 |
|---|
12/31/2023 | $12,770 | $12,592 | $9,256 |
|---|
1/31/2024 | $12,835 | $12,605 | $9,230 |
|---|
2/29/2024 | $12,911 | $12,645 | $9,100 |
|---|
3/31/2024 | $13,055 | $12,770 | $9,184 |
|---|
4/30/2024 | $13,001 | $12,702 | $8,952 |
|---|
5/31/2024 | $13,134 | $12,826 | $9,104 |
|---|
6/30/2024 | $13,254 | $12,942 | $9,190 |
|---|
7/31/2024 | $13,469 | $13,135 | $9,405 |
|---|
8/31/2024 | $13,646 | $13,310 | $9,540 |
|---|
9/30/2024 | $13,807 | $13,450 | $9,667 |
|---|
10/31/2024 | $13,815 | $13,401 | $9,428 |
|---|
11/30/2024 | $13,976 | $13,534 | $9,527 |
|---|
12/31/2024 | $13,966 | $13,500 | $9,371 |
|---|
1/31/2025 | $14,117 | $13,668 | $9,421 |
|---|
2/28/2025 | $14,222 | $13,750 | $9,628 |
|---|
3/31/2025 | $14,005 | $13,644 | $9,632 |
|---|
4/30/2025 | $13,815 | $13,649 | $9,670 |
|---|
5/31/2025 | $14,160 | $13,838 | $9,601 |
|---|
6/30/2025 | $14,443 | $14,066 | $9,748 |
|---|
7/31/2025 | $14,524 | $14,109 | $9,723 |
|---|
8/31/2025 | $14,725 | $14,258 | $9,839 |
|---|
9/30/2025 | $14,850 | $14,349 | $9,946 |
|---|
10/31/2025 | $14,871 | $14,389 | $10,008 |
|---|
11/30/2025 | $14,971 | $14,474 | $10,071 |
|---|
12/31/2025 | $15,049 | $14,570 | $10,056 |
|---|
1/31/2026 | $15,178 | $14,640 | $10,066 |
|---|
2/28/2026 | $15,166 | $14,664 | $10,231 |
|---|
3/31/2026 | $14,958 | $14,563 | $10,051 |
|---|
4/30/2026 | $15,308 | $14,767 | $10,062 |
|---|
5/31/2026 | $15,407 | $14,859 | $10,094 |
|---|
6/30/2026 | $15,441 | $14,901 | $10,118 |
|---|
7/31/2026 | $15,377 | $14,893 | $9,986 |
|---|
|
|
| Average Annual Return [Table Text Block] |
Table SummaryAATR | 1 Year | 5 Years | Since Inception
4/30/20 |
|---|
Class F at NAV | 5.87% | 5.29% | 7.12% |
|---|
ICE BofA High Yield U.S. Corporate Cash Pay BB-B (1-5yrs) Index | 5.56% | 4.83% | 6.58% |
|---|
Bloomberg U.S. Aggregate Bond Index | 2.71% | (0.40%) | (0.02%) |
|---|
|
|
| Performance Inception Date |
Apr. 30, 2020
|
|
| No Deduction of Taxes [Text Block] |
The returns do not reflect the deduction of taxes that a shareholder would pay on Fund distributions or redemption of Fund shares.
|
|
| AssetsNet |
$ 10,701,227,755
|
|
| Holdings Count | Holding |
681
|
|
| Advisory Fees Paid, Amount |
$ 30,195,663
|
|
| InvestmentCompanyPortfolioTurnover |
92.00%
|
|
| Additional Fund Statistics [Text Block] |
Table SummaryTotal Net Assets | $10,701,227,755 |
|---|
# of Portfolio Holdings | 681 |
|---|
Portfolio Turnover Rate | 92% |
|---|
Total Advisory Fees Paid | $30,195,663 |
|---|
|
|
| Holdings [Text Block] |
Table SummaryPortfolio Holdings Presented by Portfolio Allocation | %Footnote Reference* |
|---|
Asset-Backed Securities | 1.14% | Common Stocks | 0.03% | Convertible Bonds | 2.88% | Convertible Preferred Stocks | 0.23% | Corporate Bonds | 86.17% | Floating Rate Loans | 3.71% | Foreign Government Obligations | 0.15% | Government Sponsored Enterprises Collateralized Mortgage Obligations | 0.55% | Non-Agency Commercial Mortgage-Backed Securities | 0.22% | Preferred Stocks | 0.02% | Warrants | 0.00%Footnote Reference** | Money Market FundsFootnote Reference† | 4.41% | Time DepositsFootnote Reference† | 0.49% | Total | 100.00% | | Footnote | Description | Footnote* | Represents percent of total investments, which excludes derivatives. | Footnote** | Amount is less than 0.01% | Footnote† | Securities were purchased with the cash collateral from loaned securities. |
|
|
| Material Fund Change [Text Block] |
This is a summary of certain changes to the Fund that occurred during the reporting period, except as otherwise noted. For more information contact 888-522-2388. Effective December 1, 2025, the 0.10% distribution fee waiver on Class F shares expired, and the Fund's Expense Limitation Agreement expired and was not renewed. Prior to that date, the Adviser contractually agreed to limit total net annual operating expenses, excluding 12b-1 fees and acquired fund fees and expenses, interest-related expenses, taxes, expenses related to litigation and potential litigation, and extraordinary expenses, to an annual rate of 0.45%. |
|
| Material Fund Change Expenses [Text Block] |
Effective December 1, 2025, the 0.10% distribution fee waiver on Class F shares expired, and the Fund's Expense Limitation Agreement expired and was not renewed. Prior to that date, the Adviser contractually agreed to limit total net annual operating expenses, excluding 12b-1 fees and acquired fund fees and expenses, interest-related expenses, taxes, expenses related to litigation and potential litigation, and extraordinary expenses, to an annual rate of 0.45%.
|
|
| Summary of Change Legend [Text Block] |
This is a summary of certain changes to the Fund that occurred during the reporting period, except as otherwise noted. For more information contact 888-522-2388.
|
|
| Updated Prospectus Phone Number |
888-522-2388
|
|
| C000218938 |
|
|
| Shareholder Report [Line Items] |
|
|
| Fund Name |
Lord Abbett Short Duration High Yield Fund
|
|
| Class Name |
Class F3
|
|
| Trading Symbol |
LSYNX
|
|
| Annual or Semi-Annual Statement [Text Block] |
This annual shareholder report contains important information about the Lord Abbett Short Duration High Yield Fund for the period of August 1, 2025 to July 31, 2026 (the "reporting period").
|
|
| Additional Information [Text Block] |
You can find additional information about the Fund at lordabbett.com/FundDocuments. You can also request this information by contacting us at 888-522-2388.
|
|
| Material Fund Change Notice [Text Block] |
This report describes changes to the Fund that occurred during the reporting period.
|
|
| Additional Information Phone Number |
888-522-2388
|
|
| Additional Information Website |
<span style="box-sizing: border-box; color: rgb(0, 0, 0); display: inline; flex-wrap: nowrap; font-size: 13.3333px; font-weight: 400; grid-area: auto; line-height: 20px; margin: 0px; overflow: visible; text-align: left; text-align-last: auto; white-space-collapse: preserve-breaks;">lordabbett.com/FundDocuments</span>
|
|
| Expenses [Text Block] |
What were the Fund costs for the reporting period?(based on a hypothetical $10,000 investment) Table SummaryClass Name | Costs of a $10,000 investment | Costs paid as a percentage of a $10,000 investment |
|---|
Class F3 | $38 | 0.37% |
|---|
|
|
| Expenses Paid, Amount |
$ 38
|
|
| Expense Ratio, Percent |
0.37%
|
|
| Factors Affecting Performance [Text Block] |
How did the Fund perform last year and what affected its performance?For the fiscal year ended July 31, 2026, the Fund returned 6.04%, reflecting performance at the net asset value (NAV) of Class F3 shares, with all distributions reinvested, compared to the 5.56% return of a securities market index with investment characteristics similar to those of the Fund, the ICE BofA High Yield U.S. Corporate Cash Pay BB-B (1-5yrs) Index. The Fund's broad-based securities market index, the Bloomberg U.S. Aggregate Bond Index, returned 2.71% over the same period. Over the period, U.S. fixed income markets were supported by resilient economic growth, solid consumer spending, healthy corporate earnings and continued investment, particularly in artificial intelligence. Markets also faced meaningful headwinds from rising inflation pressures and heightened geopolitical tensions, including the escalation of conflict between the U.S. and Iran and its impact on energy prices. During the fiscal year, these developments contributed to periods of elevated volatility and shifting expectations for Federal Reserve policy. Despite these challenges, credit markets remained broadly constructive, supported by resilient corporate fundamentals and continued demand for income. Top contributors to performance: Security selection within the Energy, Capital Goods and Healthcare sectors contributed to relative performance. Credit selection within BB-rated bonds also contributed to relative performance. Allocation to convertible bonds also contributed to relative performance. Top detractors from performance: Credit selection within Basic Industry, Retail and Automotive sectors detracted from relative performance. Allocation to bank loans also detracted from relative performance. |
|
| Performance Past Does Not Indicate Future [Text] |
The Fund's past performance is no guarantee of future results.
|
|
| Line Graph [Table Text Block] |
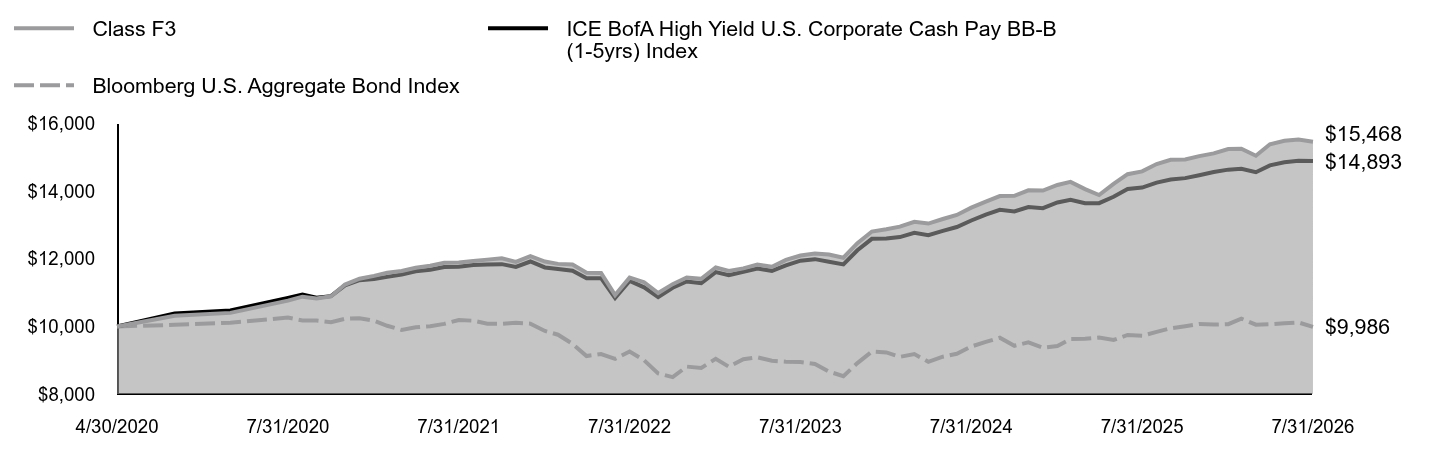 Table Summary | Class F3 | ICE BofA High Yield U.S. Corporate Cash Pay BB-B (1-5yrs) Index | Bloomberg U.S. Aggregate Bond Index |
|---|
4/30/2020 | $10,000 | $10,000 | $10,000 |
|---|
5/31/2020 | $10,314 | $10,381 | $10,047 |
|---|
6/30/2020 | $10,401 | $10,474 | $10,110 |
|---|
7/31/2020 | $10,763 | $10,846 | $10,261 |
|---|
8/31/2020 | $10,880 | $10,941 | $10,178 |
|---|
9/30/2020 | $10,825 | $10,851 | $10,172 |
|---|
10/31/2020 | $10,893 | $10,896 | $10,127 |
|---|
11/30/2020 | $11,239 | $11,216 | $10,226 |
|---|
12/31/2020 | $11,411 | $11,367 | $10,240 |
|---|
1/31/2021 | $11,495 | $11,404 | $10,167 |
|---|
2/28/2021 | $11,589 | $11,467 | $10,020 |
|---|
3/31/2021 | $11,641 | $11,538 | $9,895 |
|---|
4/30/2021 | $11,735 | $11,635 | $9,973 |
|---|
5/31/2021 | $11,798 | $11,675 | $10,006 |
|---|
6/30/2021 | $11,884 | $11,761 | $10,076 |
|---|
7/31/2021 | $11,893 | $11,764 | $10,189 |
|---|
8/31/2021 | $11,935 | $11,815 | $10,169 |
|---|
9/30/2021 | $11,977 | $11,832 | $10,081 |
|---|
10/31/2021 | $12,019 | $11,843 | $10,079 |
|---|
11/30/2021 | $11,908 | $11,760 | $10,108 |
|---|
12/31/2021 | $12,077 | $11,921 | $10,083 |
|---|
1/31/2022 | $11,920 | $11,745 | $9,865 |
|---|
2/28/2022 | $11,851 | $11,700 | $9,755 |
|---|
3/31/2022 | $11,830 | $11,650 | $9,484 |
|---|
4/30/2022 | $11,591 | $11,427 | $9,124 |
|---|
5/31/2022 | $11,582 | $11,428 | $9,183 |
|---|
6/30/2022 | $10,929 | $10,843 | $9,039 |
|---|
7/31/2022 | $11,443 | $11,344 | $9,260 |
|---|
8/31/2022 | $11,309 | $11,158 | $8,998 |
|---|
9/30/2022 | $10,988 | $10,869 | $8,610 |
|---|
10/31/2022 | $11,251 | $11,145 | $8,498 |
|---|
11/30/2022 | $11,447 | $11,330 | $8,811 |
|---|
12/31/2022 | $11,408 | $11,278 | $8,771 |
|---|
1/31/2023 | $11,746 | $11,606 | $9,041 |
|---|
2/28/2023 | $11,641 | $11,518 | $8,807 |
|---|
3/31/2023 | $11,718 | $11,618 | $9,031 |
|---|
4/30/2023 | $11,832 | $11,712 | $9,085 |
|---|
5/31/2023 | $11,764 | $11,645 | $8,986 |
|---|
6/30/2023 | $11,968 | $11,805 | $8,954 |
|---|
7/31/2023 | $12,100 | $11,947 | $8,948 |
|---|
8/31/2023 | $12,158 | $11,991 | $8,891 |
|---|
9/30/2023 | $12,126 | $11,916 | $8,665 |
|---|
10/31/2023 | $12,034 | $11,836 | $8,528 |
|---|
11/30/2023 | $12,465 | $12,253 | $8,914 |
|---|
12/31/2023 | $12,808 | $12,592 | $9,256 |
|---|
1/31/2024 | $12,874 | $12,605 | $9,230 |
|---|
2/29/2024 | $12,952 | $12,645 | $9,100 |
|---|
3/31/2024 | $13,097 | $12,770 | $9,184 |
|---|
4/30/2024 | $13,044 | $12,702 | $8,952 |
|---|
5/31/2024 | $13,179 | $12,826 | $9,104 |
|---|
6/30/2024 | $13,300 | $12,942 | $9,190 |
|---|
7/31/2024 | $13,516 | $13,135 | $9,405 |
|---|
8/31/2024 | $13,695 | $13,310 | $9,540 |
|---|
9/30/2024 | $13,858 | $13,450 | $9,667 |
|---|
10/31/2024 | $13,866 | $13,401 | $9,428 |
|---|
11/30/2024 | $14,029 | $13,534 | $9,527 |
|---|
12/31/2024 | $14,020 | $13,500 | $9,371 |
|---|
1/31/2025 | $14,187 | $13,668 | $9,421 |
|---|
2/28/2025 | $14,279 | $13,750 | $9,628 |
|---|
3/31/2025 | $14,063 | $13,644 | $9,632 |
|---|
4/30/2025 | $13,888 | $13,649 | $9,670 |
|---|
5/31/2025 | $14,220 | $13,838 | $9,601 |
|---|
6/30/2025 | $14,505 | $14,066 | $9,748 |
|---|
7/31/2025 | $14,588 | $14,109 | $9,723 |
|---|
8/31/2025 | $14,805 | $14,258 | $9,839 |
|---|
9/30/2025 | $14,932 | $14,349 | $9,946 |
|---|
10/31/2025 | $14,939 | $14,389 | $10,008 |
|---|
11/30/2025 | $15,040 | $14,474 | $10,071 |
|---|
12/31/2025 | $15,121 | $14,570 | $10,056 |
|---|
1/31/2026 | $15,252 | $14,640 | $10,066 |
|---|
2/28/2026 | $15,259 | $14,664 | $10,231 |
|---|
3/31/2026 | $15,052 | $14,563 | $10,051 |
|---|
4/30/2026 | $15,391 | $14,767 | $10,062 |
|---|
5/31/2026 | $15,493 | $14,859 | $10,094 |
|---|
6/30/2026 | $15,529 | $14,901 | $10,118 |
|---|
7/31/2026 | $15,468 | $14,893 | $9,986 |
|---|
|
|
| Average Annual Return [Table Text Block] |
Table SummaryAATR | 1 Year | 5 Years | Since Inception
4/30/20 |
|---|
Class F3 at NAV | 6.04% | 5.40% | 7.23% |
|---|
ICE BofA High Yield U.S. Corporate Cash Pay BB-B (1-5yrs) Index | 5.56% | 4.83% | 6.58% |
|---|
Bloomberg U.S. Aggregate Bond Index | 2.71% | (0.40%) | (0.02%) |
|---|
|
|
| Performance Inception Date |
Apr. 30, 2020
|
|
| No Deduction of Taxes [Text Block] |
The returns do not reflect the deduction of taxes that a shareholder would pay on Fund distributions or redemption of Fund shares.
|
|
| AssetsNet |
$ 10,701,227,755
|
|
| Holdings Count | Holding |
681
|
|
| Advisory Fees Paid, Amount |
$ 30,195,663
|
|
| InvestmentCompanyPortfolioTurnover |
92.00%
|
|
| Additional Fund Statistics [Text Block] |
Table SummaryTotal Net Assets | $10,701,227,755 |
|---|
# of Portfolio Holdings | 681 |
|---|
Portfolio Turnover Rate | 92% |
|---|
Total Advisory Fees Paid | $30,195,663 |
|---|
|
|
| Holdings [Text Block] |
Table SummaryPortfolio Holdings Presented by Portfolio Allocation | %Footnote Reference* |
|---|
Asset-Backed Securities | 1.14% | Common Stocks | 0.03% | Convertible Bonds | 2.88% | Convertible Preferred Stocks | 0.23% | Corporate Bonds | 86.17% | Floating Rate Loans | 3.71% | Foreign Government Obligations | 0.15% | Government Sponsored Enterprises Collateralized Mortgage Obligations | 0.55% | Non-Agency Commercial Mortgage-Backed Securities | 0.22% | Preferred Stocks | 0.02% | Warrants | 0.00%Footnote Reference** | Money Market FundsFootnote Reference† | 4.41% | Time DepositsFootnote Reference† | 0.49% | Total | 100.00% | | Footnote | Description | Footnote* | Represents percent of total investments, which excludes derivatives. | Footnote** | Amount is less than 0.01% | Footnote† | Securities were purchased with the cash collateral from loaned securities. |
|
|
| Material Fund Change [Text Block] |
This is a summary of certain changes to the Fund that occurred during the reporting period, except as otherwise noted. For more information contact 888-522-2388. Effective December 1, 2025, the Fund's Expense Limitation Agreement expired and was not renewed. Prior to that date, the Adviser contractually agreed to limit total net annual operating expenses, excluding 12b-1 fees and acquired fund fees and expenses, interest-related expenses, taxes, expenses related to litigation and potential litigation, and extraordinary expenses, to an annual rate of 0.37%. |
|
| Material Fund Change Expenses [Text Block] |
Effective December 1, 2025, the Fund's Expense Limitation Agreement expired and was not renewed. Prior to that date, the Adviser contractually agreed to limit total net annual operating expenses, excluding 12b-1 fees and acquired fund fees and expenses, interest-related expenses, taxes, expenses related to litigation and potential litigation, and extraordinary expenses, to an annual rate of 0.37%.
|
|
| Summary of Change Legend [Text Block] |
This is a summary of certain changes to the Fund that occurred during the reporting period, except as otherwise noted. For more information contact 888-522-2388.
|
|
| Updated Prospectus Phone Number |
888-522-2388
|
|
| C000218937 |
|
|
| Shareholder Report [Line Items] |
|
|
| Fund Name |
Lord Abbett Short Duration High Yield Fund
|
|
| Class Name |
Class I
|
|
| Trading Symbol |
LSYIX
|
|
| Annual or Semi-Annual Statement [Text Block] |
This annual shareholder report contains important information about the Lord Abbett Short Duration High Yield Fund for the period of August 1, 2025 to July 31, 2026 (the "reporting period").
|
|
| Additional Information [Text Block] |
You can find additional information about the Fund at lordabbett.com/FundDocuments. You can also request this information by contacting us at 888-522-2388.
|
|
| Material Fund Change Notice [Text Block] |
This report describes changes to the Fund that occurred during the reporting period.
|
|
| Additional Information Phone Number |
888-522-2388
|
|
| Additional Information Website |
<span style="box-sizing: border-box; color: rgb(0, 0, 0); display: inline; flex-wrap: nowrap; font-size: 13.3333px; font-weight: 400; grid-area: auto; line-height: 20px; margin: 0px; overflow: visible; text-align: left; text-align-last: auto; white-space-collapse: preserve-breaks;">lordabbett.com/FundDocuments</span>
|
|
| Expenses [Text Block] |
What were the Fund costs for the reporting period?(based on a hypothetical $10,000 investment) Table SummaryClass Name | Costs of a $10,000 investment | Costs paid as a percentage of a $10,000 investment |
|---|
Class I | $47 | 0.46% |
|---|
|
|
| Expenses Paid, Amount |
$ 47
|
|
| Expense Ratio, Percent |
0.46%
|
|
| Factors Affecting Performance [Text Block] |
How did the Fund perform last year and what affected its performance?For the fiscal year ended July 31, 2026, the Fund returned 5.94%, reflecting performance at the net asset value (NAV) of Class I shares, with all distributions reinvested, compared to the 5.56% return of a securities market index with investment characteristics similar to those of the Fund, the ICE BofA High Yield U.S. Corporate Cash Pay BB-B (1-5yrs) Index. The Fund's broad-based securities market index, the Bloomberg U.S. Aggregate Bond Index, returned 2.71% over the same period. Over the period, U.S. fixed income markets were supported by resilient economic growth, solid consumer spending, healthy corporate earnings and continued investment, particularly in artificial intelligence. Markets also faced meaningful headwinds from rising inflation pressures and heightened geopolitical tensions, including the escalation of conflict between the U.S. and Iran and its impact on energy prices. During the fiscal year, these developments contributed to periods of elevated volatility and shifting expectations for Federal Reserve policy. Despite these challenges, credit markets remained broadly constructive, supported by resilient corporate fundamentals and continued demand for income. Top contributors to performance: Security selection within the Energy, Capital Goods and Healthcare sectors contributed to relative performance. Credit selection within BB-rated bonds also contributed to relative performance. Allocation to convertible bonds also contributed to relative performance. Top detractors from performance: Credit selection within Basic Industry, Retail and Automotive sectors detracted from relative performance. Allocation to bank loans also detracted from relative performance. |
|
| Performance Past Does Not Indicate Future [Text] |
The Fund's past performance is no guarantee of future results.
|
|
| Line Graph [Table Text Block] |
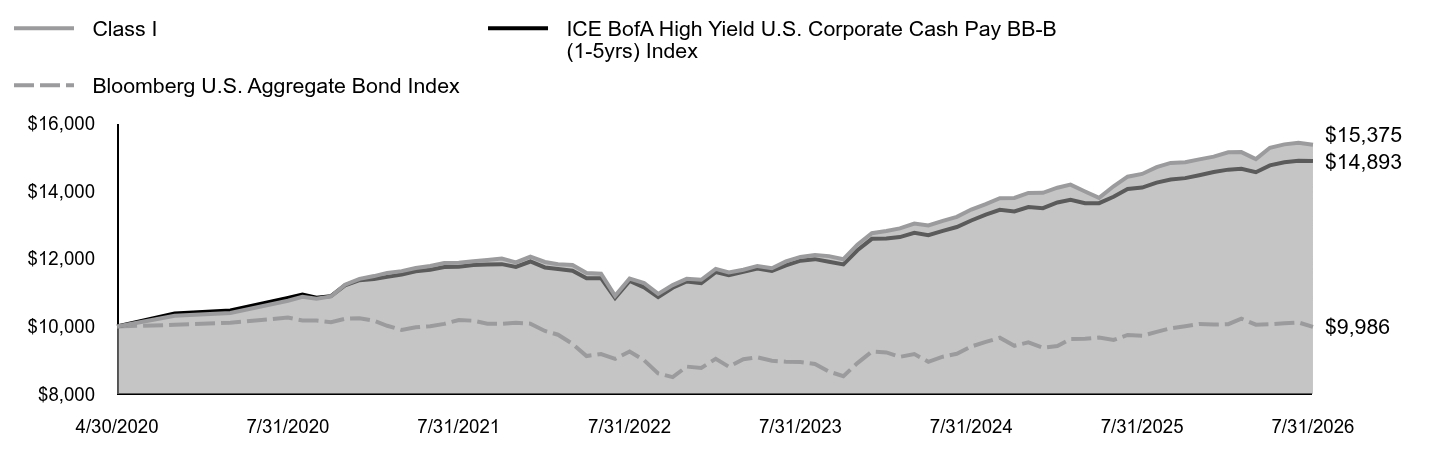 Table Summary | Class I | ICE BofA High Yield U.S. Corporate Cash Pay BB-B (1-5yrs) Index | Bloomberg U.S. Aggregate Bond Index |
|---|
4/30/2020 | $10,000 | $10,000 | $10,000 |
|---|
5/31/2020 | $10,313 | $10,381 | $10,047 |
|---|
6/30/2020 | $10,400 | $10,474 | $10,110 |
|---|
7/31/2020 | $10,761 | $10,846 | $10,261 |
|---|
8/31/2020 | $10,878 | $10,941 | $10,178 |
|---|
9/30/2020 | $10,822 | $10,851 | $10,172 |
|---|
10/31/2020 | $10,890 | $10,896 | $10,127 |
|---|
11/30/2020 | $11,235 | $11,216 | $10,226 |
|---|
12/31/2020 | $11,408 | $11,367 | $10,240 |
|---|
1/31/2021 | $11,490 | $11,404 | $10,167 |
|---|
2/28/2021 | $11,584 | $11,467 | $10,020 |
|---|
3/31/2021 | $11,636 | $11,538 | $9,895 |
|---|
4/30/2021 | $11,729 | $11,635 | $9,973 |
|---|
5/31/2021 | $11,791 | $11,675 | $10,006 |
|---|
6/30/2021 | $11,877 | $11,761 | $10,076 |
|---|
7/31/2021 | $11,885 | $11,764 | $10,189 |
|---|
8/31/2021 | $11,926 | $11,815 | $10,169 |
|---|
9/30/2021 | $11,968 | $11,832 | $10,081 |
|---|
10/31/2021 | $12,009 | $11,843 | $10,079 |
|---|
11/30/2021 | $11,897 | $11,760 | $10,108 |
|---|
12/31/2021 | $12,066 | $11,921 | $10,083 |
|---|
1/31/2022 | $11,908 | $11,745 | $9,865 |
|---|
2/28/2022 | $11,839 | $11,700 | $9,755 |
|---|
3/31/2022 | $11,817 | $11,650 | $9,484 |
|---|
4/30/2022 | $11,578 | $11,427 | $9,124 |
|---|
5/31/2022 | $11,558 | $11,428 | $9,183 |
|---|
6/30/2022 | $10,904 | $10,843 | $9,039 |
|---|
7/31/2022 | $11,417 | $11,344 | $9,260 |
|---|
8/31/2022 | $11,283 | $11,158 | $8,998 |
|---|
9/30/2022 | $10,962 | $10,869 | $8,610 |
|---|
10/31/2022 | $11,224 | $11,145 | $8,498 |
|---|
11/30/2022 | $11,408 | $11,330 | $8,811 |
|---|
12/31/2022 | $11,381 | $11,278 | $8,771 |
|---|
1/31/2023 | $11,705 | $11,606 | $9,041 |
|---|
2/28/2023 | $11,600 | $11,518 | $8,807 |
|---|
3/31/2023 | $11,677 | $11,618 | $9,031 |
|---|
4/30/2023 | $11,790 | $11,712 | $9,085 |
|---|
5/31/2023 | $11,722 | $11,645 | $8,986 |
|---|
6/30/2023 | $11,925 | $11,805 | $8,954 |
|---|
7/31/2023 | $12,057 | $11,947 | $8,948 |
|---|
8/31/2023 | $12,113 | $11,991 | $8,891 |
|---|
9/30/2023 | $12,081 | $11,916 | $8,665 |
|---|
10/31/2023 | $11,989 | $11,836 | $8,528 |
|---|
11/30/2023 | $12,418 | $12,253 | $8,914 |
|---|
12/31/2023 | $12,760 | $12,592 | $9,256 |
|---|
1/31/2024 | $12,825 | $12,605 | $9,230 |
|---|
2/29/2024 | $12,901 | $12,645 | $9,100 |
|---|
3/31/2024 | $13,045 | $12,770 | $9,184 |
|---|
4/30/2024 | $12,991 | $12,702 | $8,952 |
|---|
5/31/2024 | $13,124 | $12,826 | $9,104 |
|---|
6/30/2024 | $13,244 | $12,942 | $9,190 |
|---|
7/31/2024 | $13,459 | $13,135 | $9,405 |
|---|
8/31/2024 | $13,622 | $13,310 | $9,540 |
|---|
9/30/2024 | $13,797 | $13,450 | $9,667 |
|---|
10/31/2024 | $13,804 | $13,401 | $9,428 |
|---|
11/30/2024 | $13,951 | $13,534 | $9,527 |
|---|
12/31/2024 | $13,955 | $13,500 | $9,371 |
|---|
1/31/2025 | $14,106 | $13,668 | $9,421 |
|---|
2/28/2025 | $14,197 | $13,750 | $9,628 |
|---|
3/31/2025 | $13,994 | $13,644 | $9,632 |
|---|
4/30/2025 | $13,804 | $13,649 | $9,670 |
|---|
5/31/2025 | $14,149 | $13,838 | $9,601 |
|---|
6/30/2025 | $14,432 | $14,066 | $9,748 |
|---|
7/31/2025 | $14,513 | $14,109 | $9,723 |
|---|
8/31/2025 | $14,714 | $14,258 | $9,839 |
|---|
9/30/2025 | $14,839 | $14,349 | $9,946 |
|---|
10/31/2025 | $14,860 | $14,389 | $10,008 |
|---|
11/30/2025 | $14,944 | $14,474 | $10,071 |
|---|
12/31/2025 | $15,024 | $14,570 | $10,056 |
|---|
1/31/2026 | $15,154 | $14,640 | $10,066 |
|---|
2/28/2026 | $15,159 | $14,664 | $10,231 |
|---|
3/31/2026 | $14,951 | $14,563 | $10,051 |
|---|
4/30/2026 | $15,288 | $14,767 | $10,062 |
|---|
5/31/2026 | $15,388 | $14,859 | $10,094 |
|---|
6/30/2026 | $15,438 | $14,901 | $10,118 |
|---|
7/31/2026 | $15,375 | $14,893 | $9,986 |
|---|
|
|
| Average Annual Return [Table Text Block] |
Table SummaryAATR | 1 Year | 5 Years | Since Inception
4/30/20 |
|---|
Class I at NAV | 5.94% | 5.28% | 7.12% |
|---|
ICE BofA High Yield U.S. Corporate Cash Pay BB-B (1-5yrs) Index | 5.56% | 4.83% | 6.58% |
|---|
Bloomberg U.S. Aggregate Bond Index | 2.71% | (0.40%) | (0.02%) |
|---|
|
|
| Performance Inception Date |
Apr. 30, 2020
|
|
| No Deduction of Taxes [Text Block] |
The returns do not reflect the deduction of taxes that a shareholder would pay on Fund distributions or redemption of Fund shares.
|
|
| AssetsNet |
$ 10,701,227,755
|
|
| Holdings Count | Holding |
681
|
|
| Advisory Fees Paid, Amount |
$ 30,195,663
|
|
| InvestmentCompanyPortfolioTurnover |
92.00%
|
|
| Additional Fund Statistics [Text Block] |
Table SummaryTotal Net Assets | $10,701,227,755 |
|---|
# of Portfolio Holdings | 681 |
|---|
Portfolio Turnover Rate | 92% |
|---|
Total Advisory Fees Paid | $30,195,663 |
|---|
|
|
| Holdings [Text Block] |
Table SummaryPortfolio Holdings Presented by Portfolio Allocation | %Footnote Reference* |
|---|
Asset-Backed Securities | 1.14% | Common Stocks | 0.03% | Convertible Bonds | 2.88% | Convertible Preferred Stocks | 0.23% | Corporate Bonds | 86.17% | Floating Rate Loans | 3.71% | Foreign Government Obligations | 0.15% | Government Sponsored Enterprises Collateralized Mortgage Obligations | 0.55% | Non-Agency Commercial Mortgage-Backed Securities | 0.22% | Preferred Stocks | 0.02% | Warrants | 0.00%Footnote Reference** | Money Market FundsFootnote Reference† | 4.41% | Time DepositsFootnote Reference† | 0.49% | Total | 100.00% | | Footnote | Description | Footnote* | Represents percent of total investments, which excludes derivatives. | Footnote** | Amount is less than 0.01% | Footnote† | Securities were purchased with the cash collateral from loaned securities. |
|
|
| Material Fund Change [Text Block] |
This is a summary of certain changes to the Fund that occurred during the reporting period, except as otherwise noted. For more information contact 888-522-2388. Effective December 1, 2025, the Fund's Expense Limitation Agreement expired and was not renewed. Prior to that date, the Adviser contractually agreed to limit total net annual operating expenses, excluding 12b-1 fees and acquired fund fees and expenses, interest-related expenses, taxes, expenses related to litigation and potential litigation, and extraordinary expenses, to an annual rate of 0.45%. |
|
| Material Fund Change Expenses [Text Block] |
Effective December 1, 2025, the Fund's Expense Limitation Agreement expired and was not renewed. Prior to that date, the Adviser contractually agreed to limit total net annual operating expenses, excluding 12b-1 fees and acquired fund fees and expenses, interest-related expenses, taxes, expenses related to litigation and potential litigation, and extraordinary expenses, to an annual rate of 0.45%.
|
|
| Summary of Change Legend [Text Block] |
This is a summary of certain changes to the Fund that occurred during the reporting period, except as otherwise noted. For more information contact 888-522-2388.
|
|
| Updated Prospectus Phone Number |
888-522-2388
|
|
| C000218935 |
|
|
| Shareholder Report [Line Items] |
|
|
| Fund Name |
Lord Abbett Short Duration High Yield Fund
|
|
| Class Name |
Class R3
|
|
| Trading Symbol |
LSYQX
|
|
| Annual or Semi-Annual Statement [Text Block] |
This annual shareholder report contains important information about the Lord Abbett Short Duration High Yield Fund for the period of August 1, 2025 to July 31, 2026 (the "reporting period").
|
|
| Additional Information [Text Block] |
You can find additional information about the Fund at lordabbett.com/FundDocuments. You can also request this information by contacting us at 888-522-2388.
|
|
| Material Fund Change Notice [Text Block] |
This report describes changes to the Fund that occurred during the reporting period.
|
|
| Additional Information Phone Number |
888-522-2388
|
|
| Additional Information Website |
<span style="box-sizing: border-box; color: rgb(0, 0, 0); display: inline; flex-wrap: nowrap; font-size: 13.3333px; font-weight: 400; grid-area: auto; line-height: 20px; margin: 0px; overflow: visible; text-align: left; text-align-last: auto; white-space-collapse: preserve-breaks;">lordabbett.com/FundDocuments</span>
|
|
| Expenses [Text Block] |
What were the Fund costs for the reporting period?(based on a hypothetical $10,000 investment) Table SummaryClass Name | Costs of a $10,000 investment | Costs paid as a percentage of a $10,000 investment |
|---|
Class R3 | $99 | 0.96% |
|---|
|
|
| Expenses Paid, Amount |
$ 99
|
|
| Expense Ratio, Percent |
0.96%
|
|
| Factors Affecting Performance [Text Block] |
How did the Fund perform last year and what affected its performance?For the fiscal year ended July 31, 2026, the Fund returned 5.42%, reflecting performance at the net asset value (NAV) of Class R3 shares, with all distributions reinvested, compared to the 5.56% return of a securities market index with investment characteristics similar to those of the Fund, the ICE BofA High Yield U.S. Corporate Cash Pay BB-B (1-5yrs) Index. The Fund's broad-based securities market index, the Bloomberg U.S. Aggregate Bond Index, returned 2.71% over the same period. Over the period, U.S. fixed income markets were supported by resilient economic growth, solid consumer spending, healthy corporate earnings and continued investment, particularly in artificial intelligence. Markets also faced meaningful headwinds from rising inflation pressures and heightened geopolitical tensions, including the escalation of conflict between the U.S. and Iran and its impact on energy prices. During the fiscal year, these developments contributed to periods of elevated volatility and shifting expectations for Federal Reserve policy. Despite these challenges, credit markets remained broadly constructive, supported by resilient corporate fundamentals and continued demand for income. Top contributors to performance: Security selection within the Energy, Capital Goods and Healthcare sectors contributed to relative performance. Credit selection within BB-rated bonds also contributed to relative performance. Allocation to convertible bonds also contributed to relative performance. Top detractors from performance: Credit selection within Basic Industry, Retail and Automotive sectors detracted from relative performance. Allocation to bank loans also detracted from relative performance. |
|
| Performance Past Does Not Indicate Future [Text] |
The Fund's past performance is no guarantee of future results.
|
|
| Line Graph [Table Text Block] |
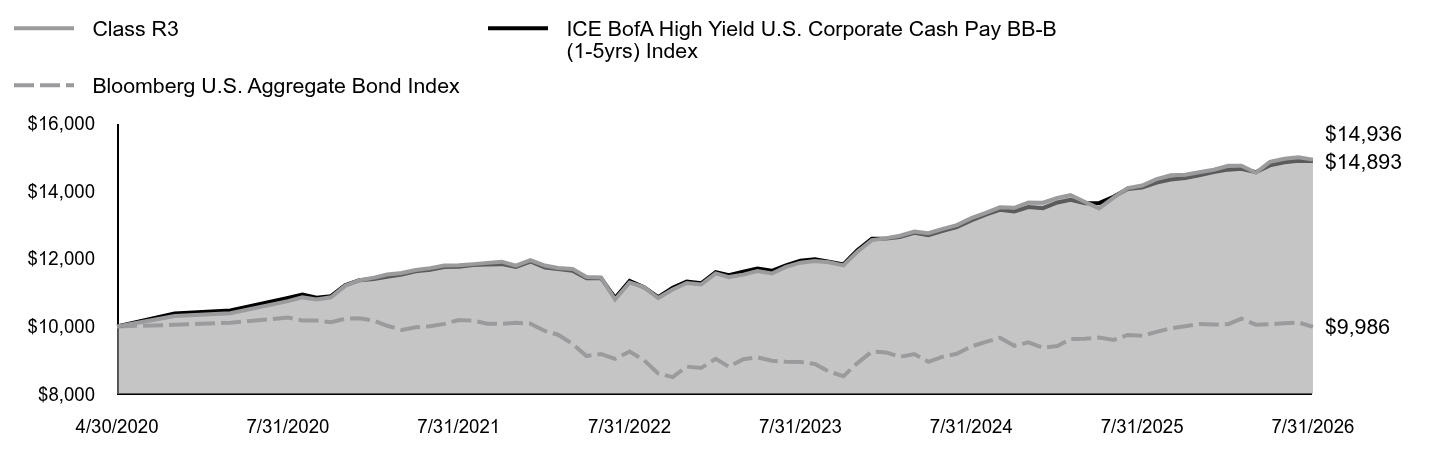 Table Summary | Class R3 | ICE BofA High Yield U.S. Corporate Cash Pay BB-B (1-5yrs) Index | Bloomberg U.S. Aggregate Bond Index |
|---|
4/30/2020 | $10,000 | $10,000 | $10,000 |
|---|
5/31/2020 | $10,309 | $10,381 | $10,047 |
|---|
6/30/2020 | $10,391 | $10,474 | $10,110 |
|---|
7/31/2020 | $10,748 | $10,846 | $10,261 |
|---|
8/31/2020 | $10,859 | $10,941 | $10,178 |
|---|
9/30/2020 | $10,799 | $10,851 | $10,172 |
|---|
10/31/2020 | $10,862 | $10,896 | $10,127 |
|---|
11/30/2020 | $11,201 | $11,216 | $10,226 |
|---|
12/31/2020 | $11,368 | $11,367 | $10,240 |
|---|
1/31/2021 | $11,445 | $11,404 | $10,167 |
|---|
2/28/2021 | $11,534 | $11,467 | $10,020 |
|---|
3/31/2021 | $11,581 | $11,538 | $9,895 |
|---|
4/30/2021 | $11,668 | $11,635 | $9,973 |
|---|
5/31/2021 | $11,725 | $11,675 | $10,006 |
|---|
6/30/2021 | $11,805 | $11,761 | $10,076 |
|---|
7/31/2021 | $11,809 | $11,764 | $10,189 |
|---|
8/31/2021 | $11,844 | $11,815 | $10,169 |
|---|
9/30/2021 | $11,881 | $11,832 | $10,081 |
|---|
10/31/2021 | $11,917 | $11,843 | $10,079 |
|---|
11/30/2021 | $11,801 | $11,760 | $10,108 |
|---|
12/31/2021 | $11,963 | $11,921 | $10,083 |
|---|
1/31/2022 | $11,802 | $11,745 | $9,865 |
|---|
2/28/2022 | $11,729 | $11,700 | $9,755 |
|---|
3/31/2022 | $11,703 | $11,650 | $9,484 |
|---|
4/30/2022 | $11,462 | $11,427 | $9,124 |
|---|
5/31/2022 | $11,448 | $11,428 | $9,183 |
|---|
6/30/2022 | $10,797 | $10,843 | $9,039 |
|---|
7/31/2022 | $11,300 | $11,344 | $9,260 |
|---|
8/31/2022 | $11,163 | $11,158 | $8,998 |
|---|
9/30/2022 | $10,841 | $10,869 | $8,610 |
|---|
10/31/2022 | $11,095 | $11,145 | $8,498 |
|---|
11/30/2022 | $11,285 | $11,330 | $8,811 |
|---|
12/31/2022 | $11,241 | $11,278 | $8,771 |
|---|
1/31/2023 | $11,568 | $11,606 | $9,041 |
|---|
2/28/2023 | $11,460 | $11,518 | $8,807 |
|---|
3/31/2023 | $11,532 | $11,618 | $9,031 |
|---|
4/30/2023 | $11,639 | $11,712 | $9,085 |
|---|
5/31/2023 | $11,566 | $11,645 | $8,986 |
|---|
6/30/2023 | $11,762 | $11,805 | $8,954 |
|---|
7/31/2023 | $11,887 | $11,947 | $8,948 |
|---|
8/31/2023 | $11,938 | $11,991 | $8,891 |
|---|
9/30/2023 | $11,901 | $11,916 | $8,665 |
|---|
10/31/2023 | $11,806 | $11,836 | $8,528 |
|---|
11/30/2023 | $12,210 | $12,253 | $8,914 |
|---|
12/31/2023 | $12,554 | $12,592 | $9,256 |
|---|
1/31/2024 | $12,613 | $12,605 | $9,230 |
|---|
2/29/2024 | $12,683 | $12,645 | $9,100 |
|---|
3/31/2024 | $12,806 | $12,770 | $9,184 |
|---|
4/30/2024 | $12,761 | $12,702 | $8,952 |
|---|
5/31/2024 | $12,886 | $12,826 | $9,104 |
|---|
6/30/2024 | $12,998 | $12,942 | $9,190 |
|---|
7/31/2024 | $13,203 | $13,135 | $9,405 |
|---|
8/31/2024 | $13,358 | $13,310 | $9,540 |
|---|
9/30/2024 | $13,524 | $13,450 | $9,667 |
|---|
10/31/2024 | $13,512 | $13,401 | $9,428 |
|---|
11/30/2024 | $13,664 | $13,534 | $9,527 |
|---|
12/31/2024 | $13,663 | $13,500 | $9,371 |
|---|
1/31/2025 | $13,804 | $13,668 | $9,421 |
|---|
2/28/2025 | $13,888 | $13,750 | $9,628 |
|---|
3/31/2025 | $13,684 | $13,644 | $9,632 |
|---|
4/30/2025 | $13,494 | $13,649 | $9,670 |
|---|
5/31/2025 | $13,810 | $13,838 | $9,601 |
|---|
6/30/2025 | $14,095 | $14,066 | $9,748 |
|---|
7/31/2025 | $14,168 | $14,109 | $9,723 |
|---|
8/31/2025 | $14,358 | $14,258 | $9,839 |
|---|
9/30/2025 | $14,474 | $14,349 | $9,946 |
|---|
10/31/2025 | $14,488 | $14,389 | $10,008 |
|---|
11/30/2025 | $14,565 | $14,474 | $10,071 |
|---|
12/31/2025 | $14,636 | $14,570 | $10,056 |
|---|
1/31/2026 | $14,756 | $14,640 | $10,066 |
|---|
2/28/2026 | $14,756 | $14,664 | $10,231 |
|---|
3/31/2026 | $14,548 | $14,563 | $10,051 |
|---|
4/30/2026 | $14,869 | $14,767 | $10,062 |
|---|
5/31/2026 | $14,960 | $14,859 | $10,094 |
|---|
6/30/2026 | $15,003 | $14,901 | $10,118 |
|---|
7/31/2026 | $14,936 | $14,893 | $9,986 |
|---|
|
|
| Average Annual Return [Table Text Block] |
Table SummaryAATR | 1 Year | 5 Years | Since Inception
4/30/20 |
|---|
Class R3 at NAV | 5.42% | 4.81% | 6.63% |
|---|
ICE BofA High Yield U.S. Corporate Cash Pay BB-B (1-5yrs) Index | 5.56% | 4.83% | 6.58% |
|---|
Bloomberg U.S. Aggregate Bond Index | 2.71% | (0.40%) | (0.02%) |
|---|
|
|
| Performance Inception Date |
Apr. 30, 2020
|
|
| No Deduction of Taxes [Text Block] |
The returns do not reflect the deduction of taxes that a shareholder would pay on Fund distributions or redemption of Fund shares.
|
|
| AssetsNet |
$ 10,701,227,755
|
|
| Holdings Count | Holding |
681
|
|
| Advisory Fees Paid, Amount |
$ 30,195,663
|
|
| InvestmentCompanyPortfolioTurnover |
92.00%
|
|
| Additional Fund Statistics [Text Block] |
Table SummaryTotal Net Assets | $10,701,227,755 |
|---|
# of Portfolio Holdings | 681 |
|---|
Portfolio Turnover Rate | 92% |
|---|
Total Advisory Fees Paid | $30,195,663 |
|---|
|
|
| Holdings [Text Block] |
Table SummaryPortfolio Holdings Presented by Portfolio Allocation | %Footnote Reference* |
|---|
Asset-Backed Securities | 1.14% | Common Stocks | 0.03% | Convertible Bonds | 2.88% | Convertible Preferred Stocks | 0.23% | Corporate Bonds | 86.17% | Floating Rate Loans | 3.71% | Foreign Government Obligations | 0.15% | Government Sponsored Enterprises Collateralized Mortgage Obligations | 0.55% | Non-Agency Commercial Mortgage-Backed Securities | 0.22% | Preferred Stocks | 0.02% | Warrants | 0.00%Footnote Reference** | Money Market FundsFootnote Reference† | 4.41% | Time DepositsFootnote Reference† | 0.49% | Total | 100.00% | | Footnote | Description | Footnote* | Represents percent of total investments, which excludes derivatives. | Footnote** | Amount is less than 0.01% | Footnote† | Securities were purchased with the cash collateral from loaned securities. |
|
|
| Material Fund Change [Text Block] |
This is a summary of certain changes to the Fund that occurred during the reporting period, except as otherwise noted. For more information contact 888-522-2388. Effective December 1, 2025, the Fund's Expense Limitation Agreement expired and was not renewed. Prior to that date, the Adviser contractually agreed to limit total net annual operating expenses, excluding 12b-1 fees and acquired fund fees and expenses, interest-related expenses, taxes, expenses related to litigation and potential litigation, and extraordinary expenses, to an annual rate of 0.45%. |
|
| Material Fund Change Expenses [Text Block] |
Effective December 1, 2025, the Fund's Expense Limitation Agreement expired and was not renewed. Prior to that date, the Adviser contractually agreed to limit total net annual operating expenses, excluding 12b-1 fees and acquired fund fees and expenses, interest-related expenses, taxes, expenses related to litigation and potential litigation, and extraordinary expenses, to an annual rate of 0.45%.
|
|
| Summary of Change Legend [Text Block] |
This is a summary of certain changes to the Fund that occurred during the reporting period, except as otherwise noted. For more information contact 888-522-2388.
|
|
| Updated Prospectus Phone Number |
888-522-2388
|
|
| C000218934 |
|
|
| Shareholder Report [Line Items] |
|
|
| Fund Name |
Lord Abbett Short Duration High Yield Fund
|
|
| Class Name |
Class R4
|
|
| Trading Symbol |
LSYSX
|
|
| Annual or Semi-Annual Statement [Text Block] |
This annual shareholder report contains important information about the Lord Abbett Short Duration High Yield Fund for the period of August 1, 2025 to July 31, 2026 (the "reporting period").
|
|
| Additional Information [Text Block] |
You can find additional information about the Fund at lordabbett.com/FundDocuments. You can also request this information by contacting us at 888-522-2388.
|
|
| Material Fund Change Notice [Text Block] |
This report describes changes to the Fund that occurred during the reporting period.
|
|
| Additional Information Phone Number |
888-522-2388
|
|
| Additional Information Website |
<span style="box-sizing: border-box; color: rgb(0, 0, 0); display: inline; flex-wrap: nowrap; font-size: 13.3333px; font-weight: 400; grid-area: auto; line-height: 20px; margin: 0px; overflow: visible; text-align: left; text-align-last: auto; white-space-collapse: preserve-breaks;">lordabbett.com/FundDocuments</span>
|
|
| Expenses [Text Block] |
What were the Fund costs for the reporting period?(based on a hypothetical $10,000 investment) Table SummaryClass Name | Costs of a $10,000 investment | Costs paid as a percentage of a $10,000 investment |
|---|
Class R4 | $72 | 0.70% |
|---|
|
|
| Expenses Paid, Amount |
$ 72
|
|
| Expense Ratio, Percent |
0.70%
|
|
| Factors Affecting Performance [Text Block] |
How did the Fund perform last year and what affected its performance?For the fiscal year ended July 31, 2026, the Fund returned 5.67%, reflecting performance at the net asset value (NAV) of Class R4 shares, with all distributions reinvested, compared to the 5.56% return of a securities market index with investment characteristics similar to those of the Fund, the ICE BofA High Yield U.S. Corporate Cash Pay BB-B (1-5yrs) Index. The Fund's broad-based securities market index, the Bloomberg U.S. Aggregate Bond Index, returned 2.71% over the same period. Over the period, U.S. fixed income markets were supported by resilient economic growth, solid consumer spending, healthy corporate earnings and continued investment, particularly in artificial intelligence. Markets also faced meaningful headwinds from rising inflation pressures and heightened geopolitical tensions, including the escalation of conflict between the U.S. and Iran and its impact on energy prices. During the fiscal year, these developments contributed to periods of elevated volatility and shifting expectations for Federal Reserve policy. Despite these challenges, credit markets remained broadly constructive, supported by resilient corporate fundamentals and continued demand for income. Top contributors to performance: Security selection within the Energy, Capital Goods and Healthcare sectors contributed to relative performance. Credit selection within BB-rated bonds also contributed to relative performance. Allocation to convertible bonds also contributed to relative performance. Top detractors from performance: Credit selection within Basic Industry, Retail and Automotive sectors detracted from relative performance. Allocation to bank loans also detracted from relative performance. |
|
| Performance Past Does Not Indicate Future [Text] |
The Fund's past performance is no guarantee of future results.
|
|
| Line Graph [Table Text Block] |
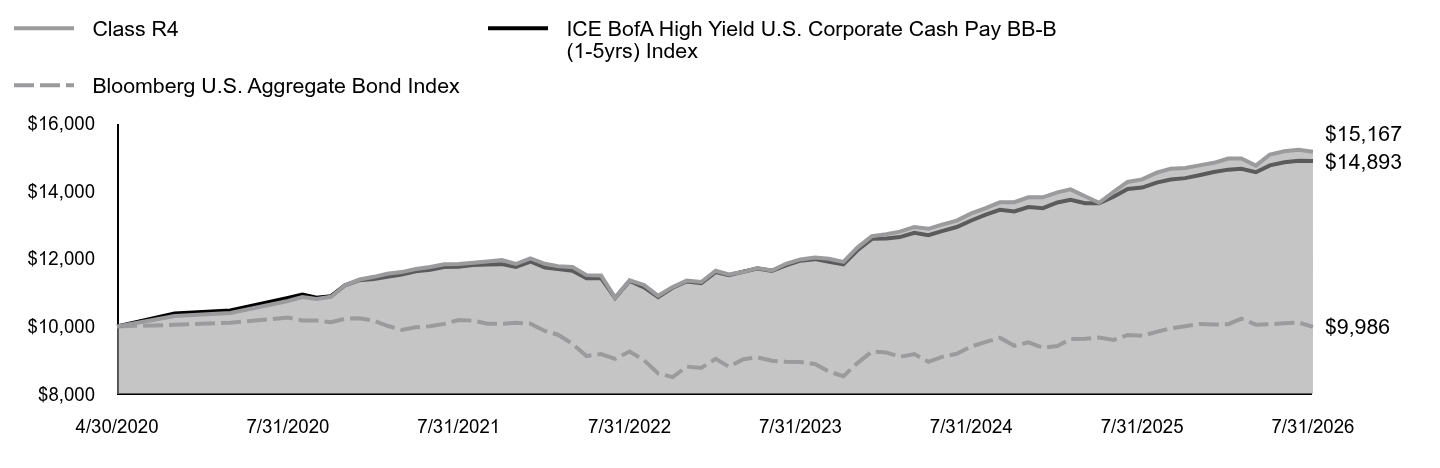 Table Summary | Class R4 | ICE BofA High Yield U.S. Corporate Cash Pay BB-B (1-5yrs) Index | Bloomberg U.S. Aggregate Bond Index |
|---|
4/30/2020 | $10,000 | $10,000 | $10,000 |
|---|
5/31/2020 | $10,311 | $10,381 | $10,047 |
|---|
6/30/2020 | $10,395 | $10,474 | $10,110 |
|---|
7/31/2020 | $10,754 | $10,846 | $10,261 |
|---|
8/31/2020 | $10,869 | $10,941 | $10,178 |
|---|
9/30/2020 | $10,810 | $10,851 | $10,172 |
|---|
10/31/2020 | $10,876 | $10,896 | $10,127 |
|---|
11/30/2020 | $11,218 | $11,216 | $10,226 |
|---|
12/31/2020 | $11,388 | $11,367 | $10,240 |
|---|
1/31/2021 | $11,468 | $11,404 | $10,167 |
|---|
2/28/2021 | $11,559 | $11,467 | $10,020 |
|---|
3/31/2021 | $11,608 | $11,538 | $9,895 |
|---|
4/30/2021 | $11,698 | $11,635 | $9,973 |
|---|
5/31/2021 | $11,757 | $11,675 | $10,006 |
|---|
6/30/2021 | $11,840 | $11,761 | $10,076 |
|---|
7/31/2021 | $11,846 | $11,764 | $10,189 |
|---|
8/31/2021 | $11,884 | $11,815 | $10,169 |
|---|
9/30/2021 | $11,923 | $11,832 | $10,081 |
|---|
10/31/2021 | $11,962 | $11,843 | $10,079 |
|---|
11/30/2021 | $11,847 | $11,760 | $10,108 |
|---|
12/31/2021 | $12,013 | $11,921 | $10,083 |
|---|
1/31/2022 | $11,854 | $11,745 | $9,865 |
|---|
2/28/2022 | $11,782 | $11,700 | $9,755 |
|---|
3/31/2022 | $11,759 | $11,650 | $9,484 |
|---|
4/30/2022 | $11,518 | $11,427 | $9,124 |
|---|
5/31/2022 | $11,507 | $11,428 | $9,183 |
|---|
6/30/2022 | $10,855 | $10,843 | $9,039 |
|---|
7/31/2022 | $11,363 | $11,344 | $9,260 |
|---|
8/31/2022 | $11,228 | $11,158 | $8,998 |
|---|
9/30/2022 | $10,907 | $10,869 | $8,610 |
|---|
10/31/2022 | $11,165 | $11,145 | $8,498 |
|---|
11/30/2022 | $11,357 | $11,330 | $8,811 |
|---|
12/31/2022 | $11,316 | $11,278 | $8,771 |
|---|
1/31/2023 | $11,648 | $11,606 | $9,041 |
|---|
2/28/2023 | $11,541 | $11,518 | $8,807 |
|---|
3/31/2023 | $11,616 | $11,618 | $9,031 |
|---|
4/30/2023 | $11,726 | $11,712 | $9,085 |
|---|
5/31/2023 | $11,655 | $11,645 | $8,986 |
|---|
6/30/2023 | $11,855 | $11,805 | $8,954 |
|---|
7/31/2023 | $11,983 | $11,947 | $8,948 |
|---|
8/31/2023 | $12,038 | $11,991 | $8,891 |
|---|
9/30/2023 | $12,003 | $11,916 | $8,665 |
|---|
10/31/2023 | $11,910 | $11,836 | $8,528 |
|---|
11/30/2023 | $12,333 | $12,253 | $8,914 |
|---|
12/31/2023 | $12,669 | $12,592 | $9,256 |
|---|
1/31/2024 | $12,731 | $12,605 | $9,230 |
|---|
2/29/2024 | $12,805 | $12,645 | $9,100 |
|---|
3/31/2024 | $12,944 | $12,770 | $9,184 |
|---|
4/30/2024 | $12,889 | $12,702 | $8,952 |
|---|
5/31/2024 | $13,018 | $12,826 | $9,104 |
|---|
6/30/2024 | $13,133 | $12,942 | $9,190 |
|---|
7/31/2024 | $13,344 | $13,135 | $9,405 |
|---|
8/31/2024 | $13,503 | $13,310 | $9,540 |
|---|
9/30/2024 | $13,673 | $13,450 | $9,667 |
|---|
10/31/2024 | $13,677 | $13,401 | $9,428 |
|---|
11/30/2024 | $13,820 | $13,534 | $9,527 |
|---|
12/31/2024 | $13,821 | $13,500 | $9,371 |
|---|
1/31/2025 | $13,968 | $13,668 | $9,421 |
|---|
2/28/2025 | $14,055 | $13,750 | $9,628 |
|---|
3/31/2025 | $13,852 | $13,644 | $9,632 |
|---|
4/30/2025 | $13,661 | $13,649 | $9,670 |
|---|
5/31/2025 | $13,984 | $13,838 | $9,601 |
|---|
6/30/2025 | $14,276 | $14,066 | $9,748 |
|---|
7/31/2025 | $14,353 | $14,109 | $9,723 |
|---|
8/31/2025 | $14,549 | $14,258 | $9,839 |
|---|
9/30/2025 | $14,669 | $14,349 | $9,946 |
|---|
10/31/2025 | $14,687 | $14,389 | $10,008 |
|---|
11/30/2025 | $14,767 | $14,474 | $10,071 |
|---|
12/31/2025 | $14,842 | $14,570 | $10,056 |
|---|
1/31/2026 | $14,967 | $14,640 | $10,066 |
|---|
2/28/2026 | $14,968 | $14,664 | $10,231 |
|---|
3/31/2026 | $14,760 | $14,563 | $10,051 |
|---|
4/30/2026 | $15,088 | $14,767 | $10,062 |
|---|
5/31/2026 | $15,184 | $14,859 | $10,094 |
|---|
6/30/2026 | $15,231 | $14,901 | $10,118 |
|---|
7/31/2026 | $15,167 | $14,893 | $9,986 |
|---|
|
|
| Average Annual Return [Table Text Block] |
Table SummaryAATR | 1 Year | 5 Years | Since Inception
4/30/20 |
|---|
Class R4 at NAV | 5.67% | 5.07% | 6.89% |
|---|
ICE BofA High Yield U.S. Corporate Cash Pay BB-B (1-5yrs) Index | 5.56% | 4.83% | 6.58% |
|---|
Bloomberg U.S. Aggregate Bond Index | 2.71% | (0.40%) | (0.02%) |
|---|
|
|
| Performance Inception Date |
Apr. 30, 2020
|
|
| No Deduction of Taxes [Text Block] |
The returns do not reflect the deduction of taxes that a shareholder would pay on Fund distributions or redemption of Fund shares.
|
|
| AssetsNet |
$ 10,701,227,755
|
|
| Holdings Count | Holding |
681
|
|
| Advisory Fees Paid, Amount |
$ 30,195,663
|
|
| InvestmentCompanyPortfolioTurnover |
92.00%
|
|
| Additional Fund Statistics [Text Block] |
Table SummaryTotal Net Assets | $10,701,227,755 |
|---|
# of Portfolio Holdings | 681 |
|---|
Portfolio Turnover Rate | 92% |
|---|
Total Advisory Fees Paid | $30,195,663 |
|---|
|
|
| Holdings [Text Block] |
Table SummaryPortfolio Holdings Presented by Portfolio Allocation | %Footnote Reference* |
|---|
Asset-Backed Securities | 1.14% | Common Stocks | 0.03% | Convertible Bonds | 2.88% | Convertible Preferred Stocks | 0.23% | Corporate Bonds | 86.17% | Floating Rate Loans | 3.71% | Foreign Government Obligations | 0.15% | Government Sponsored Enterprises Collateralized Mortgage Obligations | 0.55% | Non-Agency Commercial Mortgage-Backed Securities | 0.22% | Preferred Stocks | 0.02% | Warrants | 0.00%Footnote Reference** | Money Market FundsFootnote Reference† | 4.41% | Time DepositsFootnote Reference† | 0.49% | Total | 100.00% | | Footnote | Description | Footnote* | Represents percent of total investments, which excludes derivatives. | Footnote** | Amount is less than 0.01% | Footnote† | Securities were purchased with the cash collateral from loaned securities. |
|
|
| Material Fund Change [Text Block] |
This is a summary of certain changes to the Fund that occurred during the reporting period, except as otherwise noted. For more information contact 888-522-2388. Effective December 1, 2025, the Fund's Expense Limitation Agreement expired and was not renewed. Prior to that date, the Adviser contractually agreed to limit total net annual operating expenses, excluding 12b-1 fees and acquired fund fees and expenses, interest-related expenses, taxes, expenses related to litigation and potential litigation, and extraordinary expenses, to an annual rate of 0.45%. |
|
| Material Fund Change Expenses [Text Block] |
Effective December 1, 2025, the Fund's Expense Limitation Agreement expired and was not renewed. Prior to that date, the Adviser contractually agreed to limit total net annual operating expenses, excluding 12b-1 fees and acquired fund fees and expenses, interest-related expenses, taxes, expenses related to litigation and potential litigation, and extraordinary expenses, to an annual rate of 0.45%.
|
|
| Summary of Change Legend [Text Block] |
This is a summary of certain changes to the Fund that occurred during the reporting period, except as otherwise noted. For more information contact 888-522-2388.
|
|
| Updated Prospectus Phone Number |
888-522-2388
|
|
| C000218933 |
|
|
| Shareholder Report [Line Items] |
|
|
| Fund Name |
Lord Abbett Short Duration High Yield Fund
|
|
| Class Name |
Class R5
|
|
| Trading Symbol |
LSYTX
|
|
| Annual or Semi-Annual Statement [Text Block] |
This annual shareholder report contains important information about the Lord Abbett Short Duration High Yield Fund for the period of August 1, 2025 to July 31, 2026 (the "reporting period").
|
|
| Additional Information [Text Block] |
You can find additional information about the Fund at lordabbett.com/FundDocuments. You can also request this information by contacting us at 888-522-2388.
|
|
| Material Fund Change Notice [Text Block] |
This report describes changes to the Fund that occurred during the reporting period.
|
|
| Additional Information Phone Number |
888-522-2388
|
|
| Additional Information Website |
<span style="box-sizing: border-box; color: rgb(0, 0, 0); display: inline; flex-wrap: nowrap; font-size: 13.3333px; font-weight: 400; grid-area: auto; line-height: 20px; margin: 0px; overflow: visible; text-align: left; text-align-last: auto; white-space-collapse: preserve-breaks;">lordabbett.com/FundDocuments</span>
|
|
| Expenses [Text Block] |
What were the Fund costs for the reporting period?(based on a hypothetical $10,000 investment) Table SummaryClass Name | Costs of a $10,000 investment | Costs paid as a percentage of a $10,000 investment |
|---|
Class R5 | $47 | 0.46% |
|---|
|
|
| Expenses Paid, Amount |
$ 47
|
|
| Expense Ratio, Percent |
0.46%
|
|
| Factors Affecting Performance [Text Block] |
How did the Fund perform last year and what affected its performance?For the fiscal year ended July 31, 2026, the Fund returned 5.94%, reflecting performance at the net asset value (NAV) of Class R5 shares, with all distributions reinvested, compared to the 5.56% return of a securities market index with investment characteristics similar to those of the Fund, the ICE BofA High Yield U.S. Corporate Cash Pay BB-B (1-5yrs) Index. The Fund's broad-based securities market index, the Bloomberg U.S. Aggregate Bond Index, returned 2.71% over the same period. Over the period, U.S. fixed income markets were supported by resilient economic growth, solid consumer spending, healthy corporate earnings and continued investment, particularly in artificial intelligence. Markets also faced meaningful headwinds from rising inflation pressures and heightened geopolitical tensions, including the escalation of conflict between the U.S. and Iran and its impact on energy prices. During the fiscal year, these developments contributed to periods of elevated volatility and shifting expectations for Federal Reserve policy. Despite these challenges, credit markets remained broadly constructive, supported by resilient corporate fundamentals and continued demand for income. Top contributors to performance: Security selection within the Energy, Capital Goods and Healthcare sectors contributed to relative performance. Credit selection within BB-rated bonds also contributed to relative performance. Allocation to convertible bonds also contributed to relative performance. Top detractors from performance: Credit selection within Basic Industry, Retail and Automotive sectors detracted from relative performance. Allocation to bank loans also detracted from relative performance. |
|
| Performance Past Does Not Indicate Future [Text] |
The Fund's past performance is no guarantee of future results.
|
|
| Line Graph [Table Text Block] |
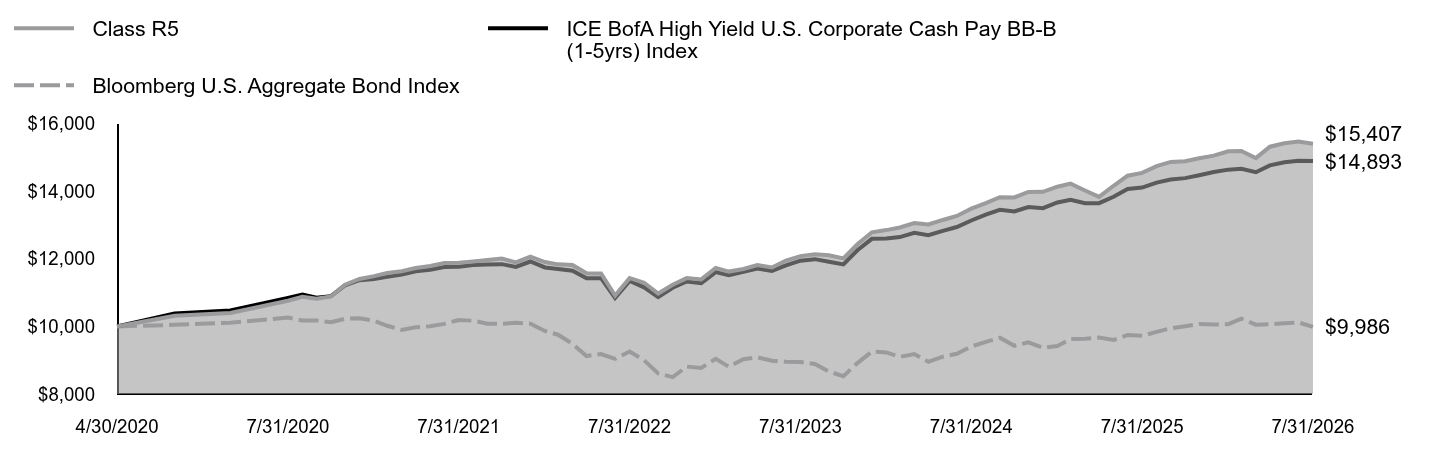 Table Summary | Class R5 | ICE BofA High Yield U.S. Corporate Cash Pay BB-B (1-5yrs) Index | Bloomberg U.S. Aggregate Bond Index |
|---|
4/30/2020 | $10,000 | $10,000 | $10,000 |
|---|
5/31/2020 | $10,313 | $10,381 | $10,047 |
|---|
6/30/2020 | $10,399 | $10,474 | $10,110 |
|---|
7/31/2020 | $10,761 | $10,846 | $10,261 |
|---|
8/31/2020 | $10,878 | $10,941 | $10,178 |
|---|
9/30/2020 | $10,821 | $10,851 | $10,172 |
|---|
10/31/2020 | $10,889 | $10,896 | $10,127 |
|---|
11/30/2020 | $11,234 | $11,216 | $10,226 |
|---|
12/31/2020 | $11,406 | $11,367 | $10,240 |
|---|
1/31/2021 | $11,489 | $11,404 | $10,167 |
|---|
2/28/2021 | $11,582 | $11,467 | $10,020 |
|---|
3/31/2021 | $11,634 | $11,538 | $9,895 |
|---|
4/30/2021 | $11,727 | $11,635 | $9,973 |
|---|
5/31/2021 | $11,789 | $11,675 | $10,006 |
|---|
6/30/2021 | $11,874 | $11,761 | $10,076 |
|---|
7/31/2021 | $11,883 | $11,764 | $10,189 |
|---|
8/31/2021 | $11,923 | $11,815 | $10,169 |
|---|
9/30/2021 | $11,965 | $11,832 | $10,081 |
|---|
10/31/2021 | $12,007 | $11,843 | $10,079 |
|---|
11/30/2021 | $11,895 | $11,760 | $10,108 |
|---|
12/31/2021 | $12,063 | $11,921 | $10,083 |
|---|
1/31/2022 | $11,906 | $11,745 | $9,865 |
|---|
2/28/2022 | $11,837 | $11,700 | $9,755 |
|---|
3/31/2022 | $11,816 | $11,650 | $9,484 |
|---|
4/30/2022 | $11,576 | $11,427 | $9,124 |
|---|
5/31/2022 | $11,568 | $11,428 | $9,183 |
|---|
6/30/2022 | $10,915 | $10,843 | $9,039 |
|---|
7/31/2022 | $11,428 | $11,344 | $9,260 |
|---|
8/31/2022 | $11,294 | $11,158 | $8,998 |
|---|
9/30/2022 | $10,973 | $10,869 | $8,610 |
|---|
10/31/2022 | $11,235 | $11,145 | $8,498 |
|---|
11/30/2022 | $11,431 | $11,330 | $8,811 |
|---|
12/31/2022 | $11,392 | $11,278 | $8,771 |
|---|
1/31/2023 | $11,728 | $11,606 | $9,041 |
|---|
2/28/2023 | $11,623 | $11,518 | $8,807 |
|---|
3/31/2023 | $11,701 | $11,618 | $9,031 |
|---|
4/30/2023 | $11,814 | $11,712 | $9,085 |
|---|
5/31/2023 | $11,745 | $11,645 | $8,986 |
|---|
6/30/2023 | $11,949 | $11,805 | $8,954 |
|---|
7/31/2023 | $12,081 | $11,947 | $8,948 |
|---|
8/31/2023 | $12,138 | $11,991 | $8,891 |
|---|
9/30/2023 | $12,106 | $11,916 | $8,665 |
|---|
10/31/2023 | $12,015 | $11,836 | $8,528 |
|---|
11/30/2023 | $12,431 | $12,253 | $8,914 |
|---|
12/31/2023 | $12,786 | $12,592 | $9,256 |
|---|
1/31/2024 | $12,851 | $12,605 | $9,230 |
|---|
2/29/2024 | $12,927 | $12,645 | $9,100 |
|---|
3/31/2024 | $13,058 | $12,770 | $9,184 |
|---|
4/30/2024 | $13,017 | $12,702 | $8,952 |
|---|
5/31/2024 | $13,151 | $12,826 | $9,104 |
|---|
6/30/2024 | $13,270 | $12,942 | $9,190 |
|---|
7/31/2024 | $13,486 | $13,135 | $9,405 |
|---|
8/31/2024 | $13,649 | $13,310 | $9,540 |
|---|
9/30/2024 | $13,824 | $13,450 | $9,667 |
|---|
10/31/2024 | $13,818 | $13,401 | $9,428 |
|---|
11/30/2024 | $13,979 | $13,534 | $9,527 |
|---|
12/31/2024 | $13,983 | $13,500 | $9,371 |
|---|
1/31/2025 | $14,135 | $13,668 | $9,421 |
|---|
2/28/2025 | $14,226 | $13,750 | $9,628 |
|---|
3/31/2025 | $14,023 | $13,644 | $9,632 |
|---|
4/30/2025 | $13,833 | $13,649 | $9,670 |
|---|
5/31/2025 | $14,163 | $13,838 | $9,601 |
|---|
6/30/2025 | $14,462 | $14,066 | $9,748 |
|---|
7/31/2025 | $14,543 | $14,109 | $9,723 |
|---|
8/31/2025 | $14,744 | $14,258 | $9,839 |
|---|
9/30/2025 | $14,869 | $14,349 | $9,946 |
|---|
10/31/2025 | $14,891 | $14,389 | $10,008 |
|---|
11/30/2025 | $14,975 | $14,474 | $10,071 |
|---|
12/31/2025 | $15,055 | $14,570 | $10,056 |
|---|
1/31/2026 | $15,184 | $14,640 | $10,066 |
|---|
2/28/2026 | $15,190 | $14,664 | $10,231 |
|---|
3/31/2026 | $14,983 | $14,563 | $10,051 |
|---|
4/30/2026 | $15,319 | $14,767 | $10,062 |
|---|
5/31/2026 | $15,420 | $14,859 | $10,094 |
|---|
6/30/2026 | $15,470 | $14,901 | $10,118 |
|---|
7/31/2026 | $15,407 | $14,893 | $9,986 |
|---|
|
|
| Average Annual Return [Table Text Block] |
Table SummaryAATR | 1 Year | 5 Years | Since Inception
4/30/20 |
|---|
Class R5 at NAV | 5.94% | 5.33% | 7.16% |
|---|
ICE BofA High Yield U.S. Corporate Cash Pay BB-B (1-5yrs) Index | 5.56% | 4.83% | 6.58% |
|---|
Bloomberg U.S. Aggregate Bond Index | 2.71% | (0.40%) | (0.02%) |
|---|
|
|
| Performance Inception Date |
Apr. 30, 2020
|
|
| No Deduction of Taxes [Text Block] |
The returns do not reflect the deduction of taxes that a shareholder would pay on Fund distributions or redemption of Fund shares.
|
|
| AssetsNet |
$ 10,701,227,755
|
|
| Holdings Count | Holding |
681
|
|
| Advisory Fees Paid, Amount |
$ 30,195,663
|
|
| InvestmentCompanyPortfolioTurnover |
92.00%
|
|
| Additional Fund Statistics [Text Block] |
Table SummaryTotal Net Assets | $10,701,227,755 |
|---|
# of Portfolio Holdings | 681 |
|---|
Portfolio Turnover Rate | 92% |
|---|
Total Advisory Fees Paid | $30,195,663 |
|---|
|
|
| Holdings [Text Block] |
Table SummaryPortfolio Holdings Presented by Portfolio Allocation | %Footnote Reference* |
|---|
Asset-Backed Securities | 1.14% | Common Stocks | 0.03% | Convertible Bonds | 2.88% | Convertible Preferred Stocks | 0.23% | Corporate Bonds | 86.17% | Floating Rate Loans | 3.71% | Foreign Government Obligations | 0.15% | Government Sponsored Enterprises Collateralized Mortgage Obligations | 0.55% | Non-Agency Commercial Mortgage-Backed Securities | 0.22% | Preferred Stocks | 0.02% | Warrants | 0.00%Footnote Reference** | Money Market FundsFootnote Reference† | 4.41% | Time DepositsFootnote Reference† | 0.49% | Total | 100.00% | | Footnote | Description | Footnote* | Represents percent of total investments, which excludes derivatives. | Footnote** | Amount is less than 0.01% | Footnote† | Securities were purchased with the cash collateral from loaned securities. |
|
|
| Material Fund Change [Text Block] |
This is a summary of certain changes to the Fund that occurred during the reporting period, except as otherwise noted. For more information contact 888-522-2388. Effective December 1, 2025, the Fund's Expense Limitation Agreement expired and was not renewed. Prior to that date, the Adviser contractually agreed to limit total net annual operating expenses, excluding 12b-1 fees and acquired fund fees and expenses, interest-related expenses, taxes, expenses related to litigation and potential litigation, and extraordinary expenses, to an annual rate of 0.45%. |
|
| Material Fund Change Expenses [Text Block] |
Effective December 1, 2025, the Fund's Expense Limitation Agreement expired and was not renewed. Prior to that date, the Adviser contractually agreed to limit total net annual operating expenses, excluding 12b-1 fees and acquired fund fees and expenses, interest-related expenses, taxes, expenses related to litigation and potential litigation, and extraordinary expenses, to an annual rate of 0.45%.
|
|
| Summary of Change Legend [Text Block] |
This is a summary of certain changes to the Fund that occurred during the reporting period, except as otherwise noted. For more information contact 888-522-2388.
|
|
| Updated Prospectus Phone Number |
888-522-2388
|
|
| C000218932 |
|
|
| Shareholder Report [Line Items] |
|
|
| Fund Name |
Lord Abbett Short Duration High Yield Fund
|
|
| Class Name |
Class R6
|
|
| Trading Symbol |
LSYUX
|
|
| Annual or Semi-Annual Statement [Text Block] |
This annual shareholder report contains important information about the Lord Abbett Short Duration High Yield Fund for the period of August 1, 2025 to July 31, 2026 (the "reporting period").
|
|
| Additional Information [Text Block] |
You can find additional information about the Fund at lordabbett.com/FundDocuments. You can also request this information by contacting us at 888-522-2388.
|
|
| Material Fund Change Notice [Text Block] |
This report describes changes to the Fund that occurred during the reporting period.
|
|
| Additional Information Phone Number |
888-522-2388
|
|
| Additional Information Website |
<span style="box-sizing: border-box; color: rgb(0, 0, 0); display: inline; flex-wrap: nowrap; font-size: 13.3333px; font-weight: 400; grid-area: auto; line-height: 20px; margin: 0px; overflow: visible; text-align: left; text-align-last: auto; white-space-collapse: preserve-breaks;">lordabbett.com/FundDocuments</span>
|
|
| Expenses [Text Block] |
What were the Fund costs for the reporting period?(based on a hypothetical $10,000 investment) Table SummaryClass Name | Costs of a $10,000 investment | Costs paid as a percentage of a $10,000 investment |
|---|
Class R6 | $38 | 0.37% |
|---|
|
|
| Expenses Paid, Amount |
$ 38
|
|
| Expense Ratio, Percent |
0.37%
|
|
| Factors Affecting Performance [Text Block] |
How did the Fund perform last year and what affected its performance?For the fiscal year ended July 31, 2026, the Fund returned 5.93%, reflecting performance at the net asset value (NAV) of Class R6 shares, with all distributions reinvested, compared to the 5.56% return of a securities market index with investment characteristics similar to those of the Fund, the ICE BofA High Yield U.S. Corporate Cash Pay BB-B (1-5yrs) Index. The Fund's broad-based securities market index, the Bloomberg U.S. Aggregate Bond Index, returned 2.71% over the same period. Over the period, U.S. fixed income markets were supported by resilient economic growth, solid consumer spending, healthy corporate earnings and continued investment, particularly in artificial intelligence. Markets also faced meaningful headwinds from rising inflation pressures and heightened geopolitical tensions, including the escalation of conflict between the U.S. and Iran and its impact on energy prices. During the fiscal year, these developments contributed to periods of elevated volatility and shifting expectations for Federal Reserve policy. Despite these challenges, credit markets remained broadly constructive, supported by resilient corporate fundamentals and continued demand for income. Top contributors to performance: Security selection within the Energy, Capital Goods and Healthcare sectors contributed to relative performance. Credit selection within BB-rated bonds also contributed to relative performance. Allocation to convertible bonds also contributed to relative performance. Top detractors from performance: Credit selection within Basic Industry, Retail and Automotive sectors detracted from relative performance. Allocation to bank loans also detracted from relative performance. |
|
| Performance Past Does Not Indicate Future [Text] |
The Fund's past performance is no guarantee of future results.
|
|
| Line Graph [Table Text Block] |
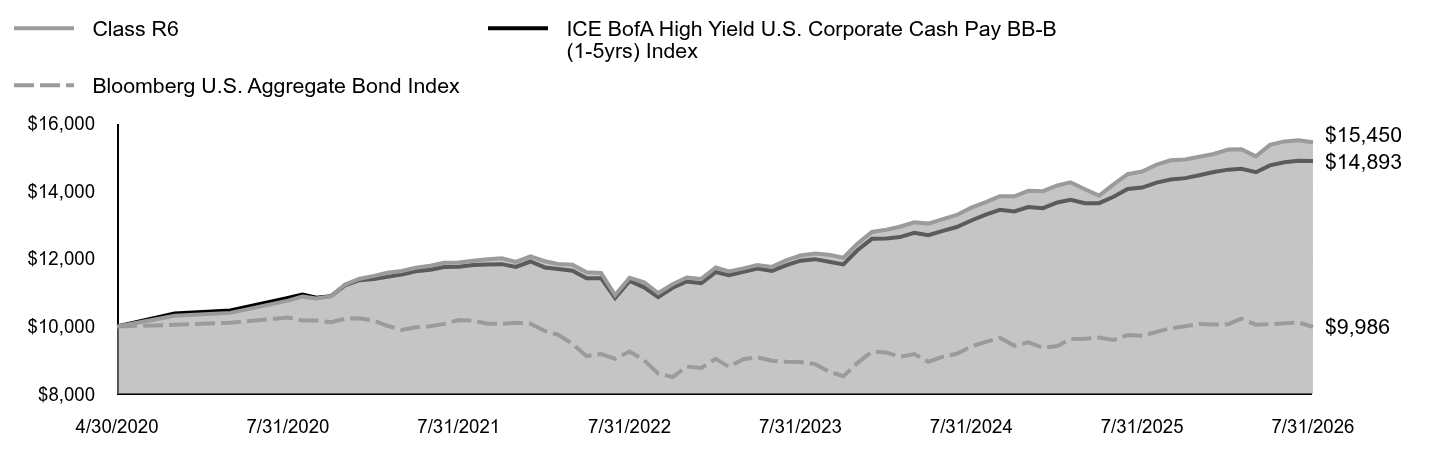 Table Summary | Class R6 | ICE BofA High Yield U.S. Corporate Cash Pay BB-B (1-5yrs) Index | Bloomberg U.S. Aggregate Bond Index |
|---|
4/30/2020 | $10,000 | $10,000 | $10,000 |
|---|
5/31/2020 | $10,314 | $10,381 | $10,047 |
|---|
6/30/2020 | $10,401 | $10,474 | $10,110 |
|---|
7/31/2020 | $10,763 | $10,846 | $10,261 |
|---|
8/31/2020 | $10,881 | $10,941 | $10,178 |
|---|
9/30/2020 | $10,825 | $10,851 | $10,172 |
|---|
10/31/2020 | $10,894 | $10,896 | $10,127 |
|---|
11/30/2020 | $11,239 | $11,216 | $10,226 |
|---|
12/31/2020 | $11,412 | $11,367 | $10,240 |
|---|
1/31/2021 | $11,495 | $11,404 | $10,167 |
|---|
2/28/2021 | $11,589 | $11,467 | $10,020 |
|---|
3/31/2021 | $11,642 | $11,538 | $9,895 |
|---|
4/30/2021 | $11,735 | $11,635 | $9,973 |
|---|
5/31/2021 | $11,798 | $11,675 | $10,006 |
|---|
6/30/2021 | $11,884 | $11,761 | $10,076 |
|---|
7/31/2021 | $11,894 | $11,764 | $10,189 |
|---|
8/31/2021 | $11,946 | $11,815 | $10,169 |
|---|
9/30/2021 | $11,988 | $11,832 | $10,081 |
|---|
10/31/2021 | $12,019 | $11,843 | $10,079 |
|---|
11/30/2021 | $11,908 | $11,760 | $10,108 |
|---|
12/31/2021 | $12,076 | $11,921 | $10,083 |
|---|
1/31/2022 | $11,930 | $11,745 | $9,865 |
|---|
2/28/2022 | $11,850 | $11,700 | $9,755 |
|---|
3/31/2022 | $11,829 | $11,650 | $9,484 |
|---|
4/30/2022 | $11,601 | $11,427 | $9,124 |
|---|
5/31/2022 | $11,581 | $11,428 | $9,183 |
|---|
6/30/2022 | $10,927 | $10,843 | $9,039 |
|---|
7/31/2022 | $11,441 | $11,344 | $9,260 |
|---|
8/31/2022 | $11,307 | $11,158 | $8,998 |
|---|
9/30/2022 | $10,987 | $10,869 | $8,610 |
|---|
10/31/2022 | $11,249 | $11,145 | $8,498 |
|---|
11/30/2022 | $11,446 | $11,330 | $8,811 |
|---|
12/31/2022 | $11,407 | $11,278 | $8,771 |
|---|
1/31/2023 | $11,744 | $11,606 | $9,041 |
|---|
2/28/2023 | $11,627 | $11,518 | $8,807 |
|---|
3/31/2023 | $11,717 | $11,618 | $9,031 |
|---|
4/30/2023 | $11,818 | $11,712 | $9,085 |
|---|
5/31/2023 | $11,762 | $11,645 | $8,986 |
|---|
6/30/2023 | $11,954 | $11,805 | $8,954 |
|---|
7/31/2023 | $12,099 | $11,947 | $8,948 |
|---|
8/31/2023 | $12,156 | $11,991 | $8,891 |
|---|
9/30/2023 | $12,124 | $11,916 | $8,665 |
|---|
10/31/2023 | $12,033 | $11,836 | $8,528 |
|---|
11/30/2023 | $12,450 | $12,253 | $8,914 |
|---|
12/31/2023 | $12,794 | $12,592 | $9,256 |
|---|
1/31/2024 | $12,860 | $12,605 | $9,230 |
|---|
2/29/2024 | $12,950 | $12,645 | $9,100 |
|---|
3/31/2024 | $13,082 | $12,770 | $9,184 |
|---|
4/30/2024 | $13,043 | $12,702 | $8,952 |
|---|
5/31/2024 | $13,177 | $12,826 | $9,104 |
|---|
6/30/2024 | $13,298 | $12,942 | $9,190 |
|---|
7/31/2024 | $13,515 | $13,135 | $9,405 |
|---|
8/31/2024 | $13,680 | $13,310 | $9,540 |
|---|
9/30/2024 | $13,856 | $13,450 | $9,667 |
|---|
10/31/2024 | $13,851 | $13,401 | $9,428 |
|---|
11/30/2024 | $14,013 | $13,534 | $9,527 |
|---|
12/31/2024 | $14,004 | $13,500 | $9,371 |
|---|
1/31/2025 | $14,171 | $13,668 | $9,421 |
|---|
2/28/2025 | $14,263 | $13,750 | $9,628 |
|---|
3/31/2025 | $14,061 | $13,644 | $9,632 |
|---|
4/30/2025 | $13,872 | $13,649 | $9,670 |
|---|
5/31/2025 | $14,203 | $13,838 | $9,601 |
|---|
6/30/2025 | $14,504 | $14,066 | $9,748 |
|---|
7/31/2025 | $14,586 | $14,109 | $9,723 |
|---|
8/31/2025 | $14,789 | $14,258 | $9,839 |
|---|
9/30/2025 | $14,915 | $14,349 | $9,946 |
|---|
10/31/2025 | $14,938 | $14,389 | $10,008 |
|---|
11/30/2025 | $15,023 | $14,474 | $10,071 |
|---|
12/31/2025 | $15,104 | $14,570 | $10,056 |
|---|
1/31/2026 | $15,235 | $14,640 | $10,066 |
|---|
2/28/2026 | $15,242 | $14,664 | $10,231 |
|---|
3/31/2026 | $15,035 | $14,563 | $10,051 |
|---|
4/30/2026 | $15,374 | $14,767 | $10,062 |
|---|
5/31/2026 | $15,476 | $14,859 | $10,094 |
|---|
6/30/2026 | $15,512 | $14,901 | $10,118 |
|---|
7/31/2026 | $15,450 | $14,893 | $9,986 |
|---|
|
|
| Average Annual Return [Table Text Block] |
Table SummaryAATR | 1 Year | 5 Years | Since Inception
4/30/20 |
|---|
Class R6 at NAV | 5.93% | 5.37% | 7.21% |
|---|
ICE BofA High Yield U.S. Corporate Cash Pay BB-B (1-5yrs) Index | 5.56% | 4.83% | 6.58% |
|---|
Bloomberg U.S. Aggregate Bond Index | 2.71% | (0.40%) | (0.02%) |
|---|
|
|
| Performance Inception Date |
Apr. 30, 2020
|
|
| No Deduction of Taxes [Text Block] |
The returns do not reflect the deduction of taxes that a shareholder would pay on Fund distributions or redemption of Fund shares.
|
|
| AssetsNet |
$ 10,701,227,755
|
|
| Holdings Count | Holding |
681
|
|
| Advisory Fees Paid, Amount |
$ 30,195,663
|
|
| InvestmentCompanyPortfolioTurnover |
92.00%
|
|
| Additional Fund Statistics [Text Block] |
Table SummaryTotal Net Assets | $10,701,227,755 |
|---|
# of Portfolio Holdings | 681 |
|---|
Portfolio Turnover Rate | 92% |
|---|
Total Advisory Fees Paid | $30,195,663 |
|---|
|
|
| Holdings [Text Block] |
Table SummaryPortfolio Holdings Presented by Portfolio Allocation | %Footnote Reference* |
|---|
Asset-Backed Securities | 1.14% | Common Stocks | 0.03% | Convertible Bonds | 2.88% | Convertible Preferred Stocks | 0.23% | Corporate Bonds | 86.17% | Floating Rate Loans | 3.71% | Foreign Government Obligations | 0.15% | Government Sponsored Enterprises Collateralized Mortgage Obligations | 0.55% | Non-Agency Commercial Mortgage-Backed Securities | 0.22% | Preferred Stocks | 0.02% | Warrants | 0.00%Footnote Reference** | Money Market FundsFootnote Reference† | 4.41% | Time DepositsFootnote Reference† | 0.49% | Total | 100.00% | | Footnote | Description | Footnote* | Represents percent of total investments, which excludes derivatives. | Footnote** | Amount is less than 0.01% | Footnote† | Securities were purchased with the cash collateral from loaned securities. |
|
|
| Material Fund Change [Text Block] |
This is a summary of certain changes to the Fund that occurred during the reporting period, except as otherwise noted. For more information contact 888-522-2388. Effective December 1, 2025, the Fund's Expense Limitation Agreement expired and was not renewed. Prior to that date, the Adviser contractually agreed to limit total net annual operating expenses, excluding 12b-1 fees and acquired fund fees and expenses, interest-related expenses, taxes, expenses related to litigation and potential litigation, and extraordinary expenses, to an annual rate of 0.37%. |
|
| Material Fund Change Expenses [Text Block] |
Effective December 1, 2025, the Fund's Expense Limitation Agreement expired and was not renewed. Prior to that date, the Adviser contractually agreed to limit total net annual operating expenses, excluding 12b-1 fees and acquired fund fees and expenses, interest-related expenses, taxes, expenses related to litigation and potential litigation, and extraordinary expenses, to an annual rate of 0.37%.
|
|
| Summary of Change Legend [Text Block] |
This is a summary of certain changes to the Fund that occurred during the reporting period, except as otherwise noted. For more information contact 888-522-2388.
|
|
| Updated Prospectus Phone Number |
888-522-2388
|
|
|
|