
MINERAL INDUSTRY ADVISORY Sound Mining International SA (Proprietary) Limited Directorate: Vaughn Duke, Nicholas Weeks, Rochelle Blunden Sound Mining House, 2A Fifth Avenue, Rivonia, 2128, South Africa | Tel: +27 (0) 11 234 7152 | Reg No.: 2007/020184/07 soundmining.co.za TECHNICAL REPORT SUMMARY FAR WEST GOLD RECOVERIES (PROPRIETARY) LIMITED Prepared for: Far West Gold Recoveries (Proprietary) Limited, Cycad House, Building 17, Constantia Office Park, Cnr 14th Avenue and Hendrik Potgieter Road, Weltevredenpark, 1709 Document No.: PR/SMI/1684/26 Effective date: June 30, 2026 Document date: October 2, 2026 Exhibit 96.1 Far West Gold Recoveries (Proprietary) Limited Document No: PR/SMI/1684/26 2 Table of Contents 1. Executive Summary .............................................................................................................................................. 6 1.1. Introduction ...................................................................................................................................................... 6 1.2. History .............................................................................................................................................................. 9 1.3. Geological Setting .......................................................................................................................................... 10 1.4. Exploration ..................................................................................................................................................... 14 1.5. Metallurgical Testing ...................................................................................................................................... 15 1.6. Mineral Resource Estimation ......................................................................................................................... 15 1.7. Mineral Reserve Estimates ............................................................................................................................ 16 1.8. Mine Design and Mine Plan ........................................................................................................................... 17 1.9. Process and Recovery Methods .................................................................................................................... 19 1.10. Infrastructure .................................................................................................................................................. 19 1.11. Market Studies ............................................................................................................................................... 21 1.12. Environmental Permitting and Liability ........................................................................................................... 22 1.13. Capital Expenditure and Operating Costs ...................................................................................................... 23 1.14. Economic Assessment ................................................................................................................................... 24 1.15. Concluding Comments ................................................................................................................................... 27 2. Introduction ......................................................................................................................................................... 28 2.1. Corporate Structure and Compliance ............................................................................................................. 28 2.2. Purpose and Terms of Reference .................................................................................................................. 29 2.3. Qualified Persons Declaration and Qualifications .......................................................................................... 29 2.4. Units, Currencies and Survey Coordinate System ......................................................................................... 31 2.5. Political and Economic Climate ...................................................................................................................... 31 2.6. Minerals Industry ............................................................................................................................................ 31 3. Property Description ........................................................................................................................................... 33 3.1. Property Location ........................................................................................................................................... 33 3.2. Legal Tenure and Permitting .......................................................................................................................... 34 3.3. Material Agreements, Access and Surface Rights ......................................................................................... 34 3.3.1. Exchange Agreement ................................................................................................................................ 34 3.3.2. Use and Access Agreement ...................................................................................................................... 35 3.4. Permitting ....................................................................................................................................................... 35 3.4.1. Driefontein Operational Area ..................................................................................................................... 36 3.4.2. Kloof Operational Area .............................................................................................................................. 36 3.5. Water Use Licenses ....................................................................................................................................... 37 3.6. Other Permitting Requirements ...................................................................................................................... 37 3.7. Royalties ........................................................................................................................................................ 38 3.8. Liabilities ........................................................................................................................................................ 38 3.9. Concluding Comments ................................................................................................................................... 38 4. Accessibility, Climate, Local Resources, Infrastructure and Physiography ......................................................... 39 5. History ................................................................................................................................................................. 43 6. Geological Setting, Mineralization and Deposit ................................................................................................... 46 6.1. Regional Setting, Mineralization and Deposit ................................................................................................. 46 6.2. Local Geological Setting, Deposit and Mineralization .................................................................................... 48 6.3. Property Geology, Deposit and Mineralization ............................................................................................... 50 7. Exploration .......................................................................................................................................................... 53 7.1. Methods and Databases ................................................................................................................................ 53 7.2. Geophysical Characterization ........................................................................................................................ 53 7.3. Geo-hydrological Characterization ................................................................................................................. 53 7.4. Geotechnical Characterization ....................................................................................................................... 53 7.5. Surveying ....................................................................................................................................................... 53 7.6. Drilling ............................................................................................................................................................ 54 7.7. Exploration Budget ......................................................................................................................................... 55 8. Sample Preparation, Analysis and Security ........................................................................................................ 56 8.1. Sampling Method ........................................................................................................................................... 56 8.2. Sample Security ............................................................................................................................................. 57 8.3. Analytical Laboratories ................................................................................................................................... 57 8.4. Analytical Procedures .................................................................................................................................... 57 8.5. Bulk Density ................................................................................................................................................... 58 8.6. Concluding Comments ................................................................................................................................... 58 9. Data Verification .................................................................................................................................................. 59 9.1. Quality Assurance and Quality Control .......................................................................................................... 59 9.2. Independent Verification ................................................................................................................................ 59 10. Mineral Processing and Metallurgical Testing ..................................................................................................... 60 Far West Gold Recoveries (Proprietary) Limited Document No: PR/SMI/1684/26 3 10.1. Metallurgical Test Work .................................................................................................................................. 60 10.2. Recovery Optimization ................................................................................................................................... 61 10.3. Concluding Comments ................................................................................................................................... 62 11. Mineral Resource Estimates ............................................................................................................................... 63 11.1. Geological Models and Interpretation ............................................................................................................. 63 11.2. Estimation Methodology ................................................................................................................................. 63 11.3. Mineral Resource Classification ..................................................................................................................... 64 11.4. Mineral Resource Verification ........................................................................................................................ 65 11.5. Cross-sections and Grade Distribution ........................................................................................................... 66 11.6. Reasonable and Realistic Prospects for Economic Extraction ....................................................................... 74 11.7. Mineral Resource Estimation ......................................................................................................................... 74 11.8. Additional Mineral Resources......................................................................................................................... 75 11.9. Concluding Comments ................................................................................................................................... 75 12. Mineral Reserve Estimates ................................................................................................................................. 76 12.1. Risk to the Mineral Reserve Estimate ............................................................................................................ 77 13. Mining Method .................................................................................................................................................... 79 13.1. Mining Plan and Layout .................................................................................................................................. 82 13.2. Modifying Factors and Mining Schedule ........................................................................................................ 82 13.3. Cut-off Grade ................................................................................................................................................. 84 13.4. Mining Contractor ........................................................................................................................................... 84 13.5. Concluding Comments ................................................................................................................................... 84 14. Process and Recovery Methods ......................................................................................................................... 86 14.1. Existing DP2 Processing Facility .................................................................................................................... 86 14.2. Expansion of DP2 .......................................................................................................................................... 88 14.3. Concluding Comments ................................................................................................................................... 90 15. Infrastructure ....................................................................................................................................................... 91 15.1. Tailings Deposition ......................................................................................................................................... 92 15.2. Regional Tailings Storage Facility Design ...................................................................................................... 93 15.2.1. Design Criteria and Basis of Design .......................................................................................................... 93 15.2.2. Facility Layout and Storage Configuration ................................................................................................. 95 15.2.3. Water Management and Environmental Controls ...................................................................................... 97 15.2.4. Construction Status and Implementation ................................................................................................... 98 15.3. Technical Studies - Water .............................................................................................................................. 98 15.3.1. Concluding Comments ............................................................................................................................ 100 15.4. Technical Studies - Power............................................................................................................................ 100 15.4.1. Concluding Comment .............................................................................................................................. 101 15.5. Technical Studies - Pipelines and Pumping ................................................................................................. 101 15.5.1. Concluding Comments ............................................................................................................................ 102 16. Gold Market ...................................................................................................................................................... 103 16.1. Gold Price Trends ........................................................................................................................................ 103 16.2. Exchange Rate Forecast .............................................................................................................................. 104 16.3. Global Demand ............................................................................................................................................ 105 16.4. Global Supply ............................................................................................................................................... 105 16.5. Concluding Comments ................................................................................................................................. 106 17. Environmental Studies, Permitting, or Agreements with Local Individuals or Groups ....................................... 107 17.1. Permitting Status .......................................................................................................................................... 107 17.1.1. The National Environmental Management Act ........................................................................................ 107 17.1.2. National Environmental Waste Management Act .................................................................................... 108 17.1.3. National Water Act .................................................................................................................................. 108 17.2. Environmental Considerations ..................................................................................................................... 109 17.3. Social and Political Considerations .............................................................................................................. 110 17.3.1. Discussions with Local Individuals or Groups .......................................................................................... 110 17.4. Environmental Closure Liability Estimate ..................................................................................................... 112 17.4.1. Basis of the Closure Liability Estimate .................................................................................................... 112 17.4.2. Quantum of the Closure Liability ............................................................................................................. 112 17.5. Concluding Comments ................................................................................................................................. 114 18. Capital and Operating Costs ............................................................................................................................. 115 18.1. Capital Expenditure ...................................................................................................................................... 115 18.2. Operating Costs ........................................................................................................................................... 117 18.3. Concluding Comments ................................................................................................................................. 117 19. Economic Assessment ...................................................................................................................................... 118 19.1. Revenue Forecast ........................................................................................................................................ 118 19.2. Cashflows..................................................................................................................................................... 119 19.3. Sensitivities .................................................................................................................................................. 120 Far West Gold Recoveries (Proprietary) Limited Document No: PR/SMI/1684/26 4 19.4. Concluding Comments ................................................................................................................................. 121 20. Adjacent Properties ........................................................................................................................................... 122 21. Other Relevant Data and Information ............................................................................................................... 123 21.1. South African Minerals Policy and Legislative Framework ........................................................................... 123 21.1.1. South African Legislative Framework ...................................................................................................... 124 21.2. Changes to South African Minerals Policy and Legislative Framework ........................................................ 127 21.2.1. Requirement of a Mining Right ................................................................................................................ 127 21.2.2. BEE and Transformation Regime ............................................................................................................ 128 21.2.3. Beneficiation ............................................................................................................................................ 128 22. Interpretations and Conclusions........................................................................................................................ 129 23. References ....................................................................................................................................................... 130 24. Reliance on Information Provided by the Registrant ......................................................................................... 139 25. Qualified Persons Disclosure Consent .............................................................................................................. 140 25.1. Date and Signature Page ............................................................................................................................. 141 Appendix A: Cashflow Model .......................................................................................................................................... 142 List of Figures Figure 1: DRDGOLD Corporate Structure ......................................................................................................................... 29 Figure 2: Location of the FWGR Operations ..................................................................................................................... 33 Figure 3: FWGR Operations .............................................................................................................................................. 34 Figure 4: Sibanye Gold Mining Rights ............................................................................................................................... 36 Figure 5: Topography of Southern Africa .......................................................................................................................... 39 Figure 6: Topography Map of FWGR ................................................................................................................................ 40 Figure 7: Climate and Rainfall of South Africa ................................................................................................................... 41 Figure 8: Vegetation of South Africa ................................................................................................................................. 42 Figure 9: Regional Geological Setting of the Witwatersrand Supergroup ......................................................................... 47 Figure 10: Geology of the Witwatersrand Basin ................................................................................................................ 48 Figure 11: Witwatersrand Supergroup Stratigraphic Section ............................................................................................. 49 Figure 12: Property Geology ............................................................................................................................................. 52 Figure 13: Cross-Sections and Grade Distribution - Driefontein 5 TSF ............................................................................. 67 Figure 14: Cross-Sections and Grade Distribution - Driefontein 3 TSF ............................................................................. 68 Figure 15: Cross-Sections and Grade Distribution - Kloof 1 TSF ...................................................................................... 69 Figure 16: Cross-Sections and Grade Distribution - Kloof 2 TSF ...................................................................................... 70 Figure 17: Cross-Sections and Grade Distribution - Libanon TSF .................................................................................... 71 Figure 18: Cross-Sections and Grade Distribution - Venterspost North TSF .................................................................... 72 Figure 19: Cross-Sections and Grade Distributions - Venterspost South TSF .................................................................. 73 Figure 20: Mining Methodology ......................................................................................................................................... 80 Figure 21: Mining Widths................................................................................................................................................... 80 Figure 22: Mining Sequencing ........................................................................................................................................... 82 Figure 23: DP2 Block Plan ................................................................................................................................................ 88 Figure 24: Driefontein 4 TSF Location and Infrastructure ................................................................................................. 91 Figure 25: RTSF Footprint ................................................................................................................................................. 96 Figure 26: TSF Location, Make-up Water Shafts, Processing Plants and Pipeline Layouts ............................................. 99 List of Tables Table 1: Personal Inspection ............................................................................................................................................. 31 Table 2: Historical Development of FWGR ........................................................................................................................ 44 Table 3: Dry Densities used by Other Re-treatment Companies for the Witwatersrand Operations ................................. 58 Table 4: Full Diagnostic Leach Results on Un-milled Feed Samples ................................................................................ 60 Table 5: Driefontein 5 TSF Feed Sample Assay by Size................................................................................................... 60 Table 6: Driefontein 3 TSF Feed Sample Assay by Size................................................................................................... 61 Table 7: Summary of Process Recovery Potential ............................................................................................................ 61 Table 8: Data Interrogated per TSF .................................................................................................................................. 65 Table 9: Variogram Parameters ........................................................................................................................................ 66 Table 10: Measured Mineral Resource Estimate Inclusive of Mineral Reserves for FWGR as at June 30, 2026 ............. 75 Table 11: S-K 1300 Compliant Mineral Reserve Estimate as at June 30, 2026 ................................................................ 76 Table 12: Scheduled RoM Production ............................................................................................................................... 83 Table 13: Calculated Cut-off Grades ................................................................................................................................. 84 Table 14: Mining Equipment Planned for each TSF .......................................................................................................... 84 Table 15: RTSF Design Basis Summary ........................................................................................................................... 94 Table 16: Underground Water Sources ............................................................................................................................. 99 Table 17: Power Requirements for FWGR Operations ................................................................................................... 100 Table 18: Eskom Points of Delivery ................................................................................................................................ 101

Far West Gold Recoveries (Proprietary) Limited Document No: PR/SMI/1684/26 5 Table 19: Existing Pipeline and Pumping Infrastructure .................................................................................................. 102 Table 20: Additional Pipeline and Pumping Infrastructure ............................................................................................... 102 Table 21: Above Ground Gold Stocks in 2025 ................................................................................................................ 103 Table 22: Long Term Consensus Forecasts in Nominal Terms ...................................................................................... 104 Table 23: Global Gold Production ................................................................................................................................... 105 Table 24: Required Environmental Legislation and the Status for the Driefontein Mining Area ...................................... 108 Table 25: Activities for Phase 2 Requiring a Waste Management License (WML) .......................................................... 108 Table 26: Current Closure Cost Estimates for FWGR ..................................................................................................... 113 Table 27: Capital Expenditure Estimate as at June 30, 2026 .......................................................................................... 115 Table 28: Implementation Progress post 2023 ................................................................................................................ 116 Table 29: Operating Cost Estimate as at June 30, 2026 ................................................................................................. 117 Table 30: Economic Assumptions ................................................................................................................................... 118 Table 31: Sensitivity of Post-tax NPV .............................................................................................................................. 120 Table 32: Sensitivity of Gold Price .................................................................................................................................. 120 Table 33: Sensitivity of the Discount Rate ....................................................................................................................... 121 Table 34: Impact of UFR Inclusion .................................................................................................................................. 121 Table 35: TRS Data and Information Sources ................................................................................................................. 130 Table 36: Glossary and Abbreviations............................................................................................................................. 132 Table 37: QP Area of Responsibility and Disclosure Consent ......................................................................................... 140 List of Graphs Graph 1: LoM Production Forecast ................................................................................................................................... 83 Graph 2: Actual Production of DP2 for FY2020 to FY2026 ............................................................................................... 86 Graph 3: Actual Plant Recovery for DP2 versus Forecast Recovery for FY2020 to FY2026 ............................................ 87 Graph 4: Gold Price Historical Trendline ......................................................................................................................... 103 Graph 5: Exchange Rate Historical Trendline ................................................................................................................. 104 Graph 6: Global Gold Demand from 2015 to 2025 .......................................................................................................... 105 Graph 7: Global Gold Supply from 2015 to 2025 ............................................................................................................ 106 Graph 8: Capital Expenditure Forecast ........................................................................................................................... 116 Graph 9: Operating Cost Forecast .................................................................................................................................. 117 Graph 10: Gold Sales Forecast ....................................................................................................................................... 119 Graph 11: Post-Tax Discounted Cashflows..................................................................................................................... 119 Graph 12: Sensitivity to Expected Revenue and Costs ................................................................................................... 120 List of Photographs Photograph 1: Monitor Gun ............................................................................................................................................... 79 Photograph 2: Monitor Gun in Operation ........................................................................................................................... 81 Far West Gold Recoveries (Proprietary) Limited Document No: PR/SMI/1684/26 6 1. EXECUTIVE SUMMARY 1.1. Introduction DRDGOLD Limited (DRDGOLD), which has a primary listing on the Johannesburg Stock Exchange (JSE) and a secondary listing on the New York Stock Exchange (NYSE), is an established gold tailings retreatment company located near Johannesburg, South Africa. The company’s business is to profitably reclaim tailings from dormant surface Tailings Storage Facilities (TSFs). DRDGOLD has arranged its operations into two wholly owned entities covering their East Rand (east of Johannesburg) and far West Rand (far west of Johannesburg) businesses. The East Rand operations are run by Ergo Mining (Proprietary) Limited (Ergo) and the West Rand operations by Far West Gold Recoveries (Proprietary) Limited (FWGR). FWGR currently owns seven TSFs on the West Rand between Roodepoort and Carletonville, approximately 70km southwest of Johannesburg (Figure A). There are an additional three TSFs which are to be transferred from Sibanye Gold (Proprietary) Limited (Sibanye Gold) to FWGR once no longer required by the existing operations (Available TSFs). Numerous other TSFs are potentially available in the area for future reclamation (Target TSFs). Figure A: Location of the FWGR Operations Source: Sound Mining, 2023 This Technical Report Summary (TRS) was prepared by Sound Mining International SA (Proprietary) Limited (Sound Mining) for DRDGOLD as the registrant. It was compiled by Qualified Persons (QPs) in line with the Securities and Exchange Commission (SEC) requirements, Regulation S-K 1300. It presents the Mineral Resources and Mineral Reserves of FWGR as at June 30, 2026. Far West Gold Recoveries (Proprietary) Limited Document No: PR/SMI/1684/26 7 The QP has relied on information provided by FWGR with respect to legal matters (Item 3), environmental or social and labor planning aspects (Item 17) and economic assumptions (Item 19). The qualified persons, Mr. Nicholas Weeks (Mineral Resources), Mr. Vaughn Duke (Mineral Reserves) and Mr. Willem de Frey (Environmental, Social and Governance) have reviewed the exploration database; the geological block models; the processing plant design and costing; mine plans, production scheduling, infrastructure; legal tenure, permitting, environmental and social compliance status and the latest assessment of the environmental rehabilitation liabilities required for eventual closure of the operation. The information was used to substantiate confidence in the Mineral Resource and Mineral Reserve estimates and then incorporated into a Discounted Cashflow (DCF) Model for an economic assessment of the viability of the Mineral Reserves. The assets held by FWGR were acquired from Sibanye Gold, a subsidiary of Sibanye Stillwater Limited (Sibanye- Stillwater), in a transaction which was concluded in July 2018 in which common law ownership was established over various TSFs containing the Mineral Resources and Mineral Reserves. FWGR conducts its activities inter alia in accordance with Environmental Approvals and the provisions of the Mine Health and Safety regulations. A Use and Access Agreement with Sibanye Gold articulates the various rights, permits and licenses held by Sibanye Gold in terms of which FWGR operates, pending the transfer to FWGR of those that are transferable. The FWGR operations are presented in Table A. Table A: FWGR Assets Asset Type Asset Location TSFs Driefontein 3 Driefontein Mining Right area Driefontein 5 Kloof 1 Kloof Mining Right area Libanon Venterspost North Venterspost South Kloof 2 Depositional TSF Driefontein 4 Northeast of Driefontein Mining Right area Land for Phase 2 RTSF and Land Southeast of the Kloof Mining Right area; Located on: Farm Cardoville 647IQ; Re Ptn 6 Farm Cardoville 364 IQ; Ptn 8 of Ptn 6 of Farm Cardoville 364IQ; Ptn 13 of Ptn1 of Farm Cardoville IQ; Ptn 50 Farm Kalbasfontein 365IQ; Re Ptn 3 Farm Cardoville 364; Re Ptn 5 of Ptn 3 Farm Cardoville 364IQ; and Ptn 11 Farm Cardoville 364IQ Operating Surface Gold Processing Plants DP2 Located on: Farm Blyvooruitzicht 116IQ Portion (Ptn) 6; and Farm Driefontein 113IQ Remainder (Re) of Ptn 1 Pilot plant Located at: Driefontein 1 processing plant Access Rights Access to water from the Driefontein 10 shaft and Kloof 10 shaft, for the purposes of hydro-mining Located within the Driefontein and Kloof Mining Right areas Installation, supply, distribution and maintenance of power supply Driefontein 1 gold plant Located at Driefontein 1 processing plant Source: FWGR, 2026 Far West Gold Recoveries (Proprietary) Limited Document No: PR/SMI/1684/26 8 A review of the environmental permitting concluded that the necessary permitting requirements are in place or are being proactively addressed. Sufficient provision is included to address the rehabilitation liabilities associated with the above assets. The QPs are satisfied that FWGR has the legal right to reclaim and process the TSFs forming part of the operation. The operations are not subject to royalty payments. The initial phase of FWGR’s long-term growth strategy involved upgrading the Driefontein Plant 2 (DP2) to process tailings material from the hydro-mining of Driefontein 5 TSF at approximately 500ktpm. Phase 2 is planned to start in mid-2027, after the expansion of DP2 to a processing capacity of 1.2Mtpm. Current arisings will continue to report to the Driefontein 4 depositional TSF at 500ktpm until commissioning of a Regional Tailings Storage Facility (RTSF). Upon commencement of deposition to the RTSF, currently scheduled for mid-2027, deposition to the Driefontein 4 TSF will end. The RTSF will have sufficient storage capacity to also accommodate new arisings at a rate of 2.4Mtpm from the mining of available TSFs in the area well into the future. The operation’s infrastructure and current TSFs lie across two mining rights which stretch from Westonaria to Carletonville (Figure B). Figure B: FWGR Operations Source: Sound Mining, 2023 The TSFs are located at elevations between 1,570mamsl and 1,720mamsl in an area that is typical of a mature landscape with gentle rolling undulations and shallow sided river valleys. The area enjoys warm to hot, moist summers and cool dry winters with an average ambient temperature of 20°C. The operation experiences some 571mm of rain each year, with most of it occurring during summer in the form of thunderstorms. Most of the area

Far West Gold Recoveries (Proprietary) Limited Document No: PR/SMI/1684/26 9 comprises disturbed grazing land and minor crop production. The area is well serviced with schools, medical facilities, a rail network, power, water and other supporting infrastructure. Both tarred and gravel roads are used to commute between farms and mines, as well as to and from urban centers. 1.2. History Gold and uranium mining operations commenced in the late 1800s in the Witwatersrand Basin goldfields of South Africa and have resulted in the accumulation of substantial amounts of surface TSFs and other mine residues. The possible re-treatment of TSFs in the West Rand area has a long and complex history with Gold Fields Limited (Gold Fields), Rand Uranium Limited (Rand Uranium), Harmony Gold Mining Company Limited (Harmony), Gold One International Limited (Gold One) and Sibanye Gold completing a number of parallel, independent studies relating to the retreatment of these TSFs, with an approximate eighteen-year history of metallurgical test work. Prior to 2009, Gold Fields embarked on a project known as the West Wits Project (WWP) aimed at retreating several TSFs on its four mining complexes: Kloof, Driefontein, Venterspost and South Deep to recover gold, uranium and sulfur and storing the tailings on a new Central Tailings Storage Facility (CTSF). Similarly, Rand Uranium had embarked on the Cooke Uranium Project (CUP), which endeavored to treat the Cooke TSF for gold, uranium and sulfur. The two independent projects had similar operational and environmental mandates, within a 25km radius of each other. In 2009, Gold Fields and Rand Uranium evaluated the potential synergy of an integrated retreatment plan for TSFs located within the South Deep, Cooke, Kloof, Driefontein and Venterspost mining complexes. In 2012, Gold One acquired Rand Uranium and in the same year acquired the Ezulwini Mining Company (Proprietary) Limited (Ezulwini). During the same year Gold One revived the tailings retreatment project and Gold Fields entered into a joint venture (JV) partnership with Gold One to investigate the economic viability of concurrently reprocessing current arisings and historical tailings from a number of sites situated in the greater West Rand area. A scoping study was concluded in 2012. In early 2013, Gold Fields unbundled its Kloof and Driefontein Complex and Beatrix gold mines in the Free State Province to create a separate entity in Sibanye Gold and listed Sibanye Gold as a fully independent company on both the JSE and the NYSE stock exchanges. Subsequently, in October 2013, Sibanye Gold purchased the interest held by Gold One in Rand Uranium and Ezulwini. The Gold One assets, which became part of Sibanye Gold, included the Cooke operations (underground mining and surface reclamation operations) for gold and uranium production. This transaction gave Sibanye Gold control of a substantial portion of the surface mineral resources in the region. A Preliminary Feasibility Study (PFS) was completed in 2013 and confirmed that there is a significant opportunity to extract value from the surface Mineral Resources. Subsequently, a number of Definitive Feasibility Studies (DFSs) have been completed on various combinations of TSFs. Sibanye Gold’s TSF reclamation assets were housed in a special purpose vehicle (SPV) called West Rand Tailings Retreatment Project (WRTRP). In 2018, Sibanye Gold exchanged its SPV for an equity interest in DRDGOLD. The project was subsequently renamed FWGR and became wholly owned by DRDGOLD. In mid-2018, FWGR initiated Phase 1 of its reclamation operations, and has since reclaimed the bulk of the material from the first TSF in the Life-of-Mine (LoM) Plan. In 2023, FWGR commenced the execution of their Phase 2 project and started construction on the RTSF and expansion of the DP2 Plant. Far West Gold Recoveries (Proprietary) Limited Document No: PR/SMI/1684/26 10 In 2026, FWGR acquired the Kloof 2 TSF as a part of the exchange agreement. The transfer of the Kloof 2 TSF added approximately 67Mt to the FWGR Mineral Resource and Mineral Reserve and extended the estimated LoM by approximately four years. 1.3. Geological Setting The assets of FWGR are derived from the West Rand Goldfield of the gold-bearing, late Archaean (2.7Ga to 3.2Ga), Witwatersrand Supergroup (Witwatersrand Basin). The Witwatersrand Basin is a roughly oval-shaped sedimentary basin, filled with approximately 14,000m of sedimentary and subordinate volcanic units, of which only small portions outcrop to the south and west of Johannesburg (Figure C). Figure C: Regional Geological Setting of the Witwatersrand Supergroup Source: Sound Mining, 2023 Far West Gold Recoveries (Proprietary) Limited Document No: PR/SMI/1684/26 11 The basin hosts vast auriferous and uraniferous deposits which have been grouped into geographically distinct sub- basins or goldfields, which are separated by stratigraphy where no economic mineralization has been discovered (Figure D). Figure D: Local Geological Setting Source: Sound Mining, 2023 Recent studies consider the deposition in the Witwatersrand sediments to have taken place along the interface between a fluvial system and a major body of still water or an inland sea. Specifically, this body of water is considered to be a retro-arc-foreland basin which formed in response to crustal thickening on the northern edge of the Kaapvaal Craton, during a collision with the Zimbabwe Craton to the north. Far West Gold Recoveries (Proprietary) Limited Document No: PR/SMI/1684/26 12 The varying stratigraphic position of the narrow, 0.1m to 2.0m thick quartz-pebble conglomerate reefs are interpreted to represent major, diachronous, entry points of coarse-grained sediment into the basin. Complex patterns of syn-depositional faulting and folding have caused significant variations in sediment thickness and sub- vertical to over-folded reef structures are characteristic of the basin margins. Later faulting and folding of the sequence determined which parts of the Witwatersrand Basin remained buried, as well as the depth extent of mineable horizons, relative to the present-day surface. The TSFs to be reclaimed are located in the Western Witwatersrand Basin, within the West Rand and Carletonville goldfields. The TSFs contain the processed waste from the mining of auriferous and uraniferous ores from Driefontein, Kloof, Libanon and Venterspost underground mining operations. The mining operations have targeted different reefs and as a result the TSFs have developed from the following: • the Driefontein TSFs comprise primarily processed VCR, CLR and Middelvlei Reef; • the Kloof TSFs comprise primarily processed VCR, Middelvlei Reef and to a lesser extent the Kloof Reef; • the Venterspost TSFs comprise primarily processed Middelvlei Reef and VCR; and • the Libanon TSFs comprises material from the VCR, Libanon Reef, Kloof Reef and Middelvlei Reef.
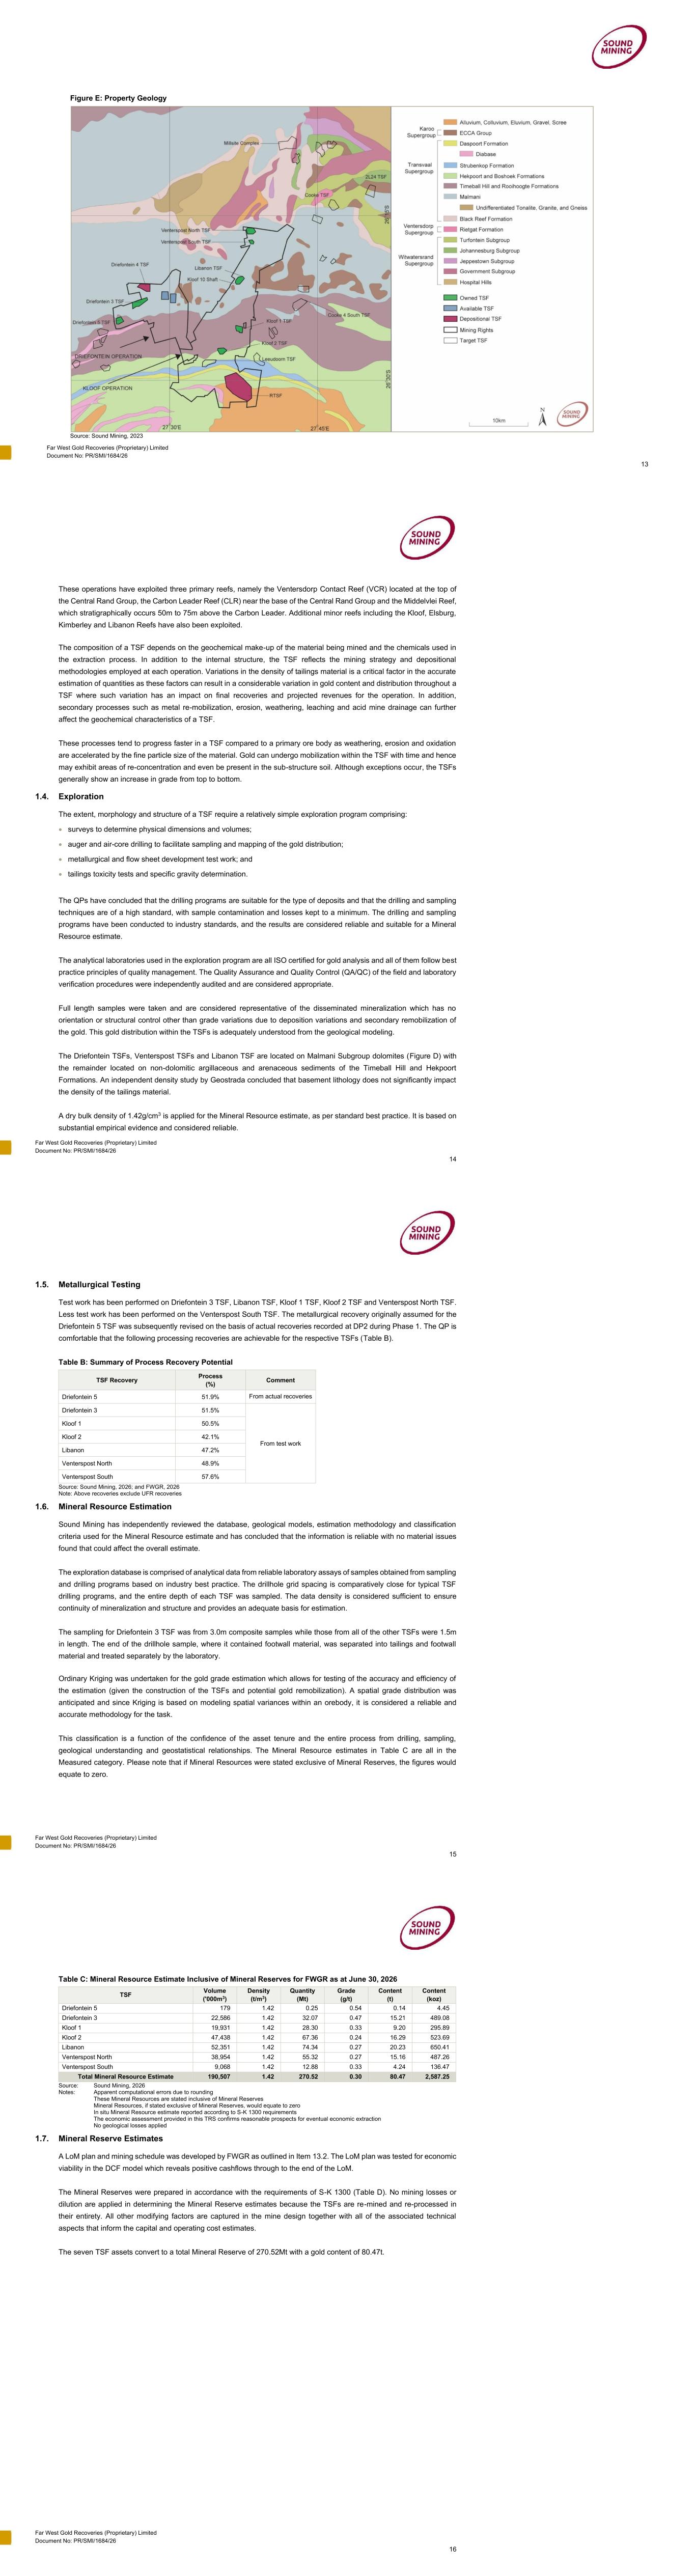
Far West Gold Recoveries (Proprietary) Limited Document No: PR/SMI/1684/26 13 Figure E: Property Geology Source: Sound Mining, 2023 Far West Gold Recoveries (Proprietary) Limited Document No: PR/SMI/1684/26 14 These operations have exploited three primary reefs, namely the Ventersdorp Contact Reef (VCR) located at the top of the Central Rand Group, the Carbon Leader Reef (CLR) near the base of the Central Rand Group and the Middelvlei Reef, which stratigraphically occurs 50m to 75m above the Carbon Leader. Additional minor reefs including the Kloof, Elsburg, Kimberley and Libanon Reefs have also been exploited. The composition of a TSF depends on the geochemical make-up of the material being mined and the chemicals used in the extraction process. In addition to the internal structure, the TSF reflects the mining strategy and depositional methodologies employed at each operation. Variations in the density of tailings material is a critical factor in the accurate estimation of quantities as these factors can result in a considerable variation in gold content and distribution throughout a TSF where such variation has an impact on final recoveries and projected revenues for the operation. In addition, secondary processes such as metal re-mobilization, erosion, weathering, leaching and acid mine drainage can further affect the geochemical characteristics of a TSF. These processes tend to progress faster in a TSF compared to a primary ore body as weathering, erosion and oxidation are accelerated by the fine particle size of the material. Gold can undergo mobilization within the TSF with time and hence may exhibit areas of re-concentration and even be present in the sub-structure soil. Although exceptions occur, the TSFs generally show an increase in grade from top to bottom. 1.4. Exploration The extent, morphology and structure of a TSF require a relatively simple exploration program comprising: • surveys to determine physical dimensions and volumes; • auger and air-core drilling to facilitate sampling and mapping of the gold distribution; • metallurgical and flow sheet development test work; and • tailings toxicity tests and specific gravity determination. The QPs have concluded that the drilling programs are suitable for the type of deposits and that the drilling and sampling techniques are of a high standard, with sample contamination and losses kept to a minimum. The drilling and sampling programs have been conducted to industry standards, and the results are considered reliable and suitable for a Mineral Resource estimate. The analytical laboratories used in the exploration program are all ISO certified for gold analysis and all of them follow best practice principles of quality management. The Quality Assurance and Quality Control (QA/QC) of the field and laboratory verification procedures were independently audited and are considered appropriate. Full length samples were taken and are considered representative of the disseminated mineralization which has no orientation or structural control other than grade variations due to deposition variations and secondary remobilization of the gold. This gold distribution within the TSFs is adequately understood from the geological modeling. The Driefontein TSFs, Venterspost TSFs and Libanon TSF are located on Malmani Subgroup dolomites (Figure D) with the remainder located on non-dolomitic argillaceous and arenaceous sediments of the Timeball Hill and Hekpoort Formations. An independent density study by Geostrada concluded that basement lithology does not significantly impact the density of the tailings material. A dry bulk density of 1.42g/cm3 is applied for the Mineral Resource estimate, as per standard best practice. It is based on substantial empirical evidence and considered reliable. Far West Gold Recoveries (Proprietary) Limited Document No: PR/SMI/1684/26 15 1.5. Metallurgical Testing Test work has been performed on Driefontein 3 TSF, Libanon TSF, Kloof 1 TSF, Kloof 2 TSF and Venterspost North TSF. Less test work has been performed on the Venterspost South TSF. The metallurgical recovery originally assumed for the Driefontein 5 TSF was subsequently revised on the basis of actual recoveries recorded at DP2 during Phase 1. The QP is comfortable that the following processing recoveries are achievable for the respective TSFs (Table B). Table B: Summary of Process Recovery Potential TSF Recovery Process (%) Comment Driefontein 5 51.9% From actual recoveries Driefontein 3 51.5% From test work Kloof 1 50.5% Kloof 2 42.1% Libanon 47.2% Venterspost North 48.9% Venterspost South 57.6% Source: Sound Mining, 2026; and FWGR, 2026 Note: Above recoveries exclude UFR recoveries 1.6. Mineral Resource Estimation Sound Mining has independently reviewed the database, geological models, estimation methodology and classification criteria used for the Mineral Resource estimate and has concluded that the information is reliable with no material issues found that could affect the overall estimate. The exploration database is comprised of analytical data from reliable laboratory assays of samples obtained from sampling and drilling programs based on industry best practice. The drillhole grid spacing is comparatively close for typical TSF drilling programs, and the entire depth of each TSF was sampled. The data density is considered sufficient to ensure continuity of mineralization and structure and provides an adequate basis for estimation. The sampling for Driefontein 3 TSF was from 3.0m composite samples while those from all of the other TSFs were 1.5m in length. The end of the drillhole sample, where it contained footwall material, was separated into tailings and footwall material and treated separately by the laboratory. Ordinary Kriging was undertaken for the gold grade estimation which allows for testing of the accuracy and efficiency of the estimation (given the construction of the TSFs and potential gold remobilization). A spatial grade distribution was anticipated and since Kriging is based on modeling spatial variances within an orebody, it is considered a reliable and accurate methodology for the task. This classification is a function of the confidence of the asset tenure and the entire process from drilling, sampling, geological understanding and geostatistical relationships. The Mineral Resource estimates in Table C are all in the Measured category. Please note that if Mineral Resources were stated exclusive of Mineral Reserves, the figures would equate to zero. Far West Gold Recoveries (Proprietary) Limited Document No: PR/SMI/1684/26 16 Table C: Mineral Resource Estimate Inclusive of Mineral Reserves for FWGR as at June 30, 2026 TSF Volume ('000m3) Density (t/m3) Quantity (Mt) Grade (g/t) Content (t) Content (koz) Driefontein 5 179 1.42 0.25 0.54 0.14 4.45 Driefontein 3 22,586 1.42 32.07 0.47 15.21 489.08 Kloof 1 19,931 1.42 28.30 0.33 9.20 295.89 Kloof 2 47,438 1.42 67.36 0.24 16.29 523.69 Libanon 52,351 1.42 74.34 0.27 20.23 650.41 Venterspost North 38,954 1.42 55.32 0.27 15.16 487.26 Venterspost South 9,068 1.42 12.88 0.33 4.24 136.47 Total Mineral Resource Estimate 190,507 1.42 270.52 0.30 80.47 2,587.25 Source: Sound Mining, 2026 Notes: Apparent computational errors due to rounding These Mineral Resources are stated inclusive of Mineral Reserves Mineral Resources, if stated exclusive of Mineral Reserves, would equate to zero In situ Mineral Resource estimate reported according to S-K 1300 requirements The economic assessment provided in this TRS confirms reasonable prospects for eventual economic extraction No geological losses applied 1.7. Mineral Reserve Estimates A LoM plan and mining schedule was developed by FWGR as outlined in Item 13.2. The LoM plan was tested for economic viability in the DCF model which reveals positive cashflows through to the end of the LoM. The Mineral Reserves were prepared in accordance with the requirements of S-K 1300 (Table D). No mining losses or dilution are applied in determining the Mineral Reserve estimates because the TSFs are re-mined and re-processed in their entirety. All other modifying factors are captured in the mine design together with all of the associated technical aspects that inform the capital and operating cost estimates. The seven TSF assets convert to a total Mineral Reserve of 270.52Mt with a gold content of 80.47t.

Far West Gold Recoveries (Proprietary) Limited Document No: PR/SMI/1684/26 17 Table D: S-K 1300 Compliant Mineral Reserve Estimate as at June 30, 2026 TSF Volume ('000m3) Density (t/m3) Quantity (Mt) Grade (g/t) Content (t) Content (koz) Driefontein 5 179 1.42 0.25 0.54 0.14 4 Driefontein 3 22,586 1.42 32.07 0.47 15.21 489 Kloof 1 19,931 1.42 28.30 0.33 9.20 296 Kloof 2 47,438 1.42 67.36 0.24 16.29 524 Libanon 52,351 1.42 74.34 0.27 20.23 650 Venterspost North 38,954 1.42 55.32 0.27 15.16 488 Total Proved Mineral Reserve 181,439 1.42 257.64 0.30 76.23 2,451 Venterspost South 9,068 1.42 12.88 0.33 4.24 136 Total Probable Mineral Reserve 9,068 1.42 12.88 0.33 4.24 136 Total Mineral Reserve Estimate 190,507 1.42 270.52 0.30 80.47 2,587 Source: Sound Mining, 2026 Notes: Apparent computational errors due to rounding and are not considered significant Mineral Reserves are reported using a dry density of 1.42t/m3 and at the head grade on delivery to the plant The Mineral Reserves constitute the feed to the gold plants The Mineral Reserves are stated at a price of ZAR2,155,461/kg A cut-off grade of 0.14g/t is applicable to the FWGR LoM plan Although stated separately, the Mineral Resources are inclusive of Mineral Reserves Venterspost South TSF is classified as a Probable Mineral Reserve due to some uncertainty regarding the processing recovery Uranium has been excluded in the Mineral Reserve estimate as it is not being recovered by FWGR Grade and quantity measurements are reported in metric units (Mt) rounded to two decimal places The input studies are to a level of accuracy of –5%, +15% The Mineral Reserve estimates contained herein may be subject to legal, political, environmental or other risks that could materially affect the potential development of such Mineral Reserves 1.8. Mine Design and Mine Plan FWGR exploits TSFs through hydro-mining using high-pressure jets of water to dislodge tailings material or move sediment for transportation as a slurry to processing plants. The hydro-mining removes the tailings material from the top of a TSF to the natural ground level in 15m layers (Figure F). Figure F: Mining Methodology Source: Sound Mining, 2023 A safe bench height is dependent upon the stability of the material, which is influenced by the phreatic surface within a dump. The TSFs have been dormant for a number of years and so the phreatic surface is generally well below the surface Far West Gold Recoveries (Proprietary) Limited Document No: PR/SMI/1684/26 18 of the dumps. The drilling program to define the Mineral Resource did not encounter saturated zones or phreatic surfaces and so the risk of slope failure or liquefaction is low. Horizontal benches of 100m to 200m, inclusive of the face angles (45° to 50°), are created to maintain safe working distances between simultaneous operations at different bench elevations (Figure G). Figure G: Mining Widths Source: Sound Mining, 2023 All hydro-mining and the re-deposition of tailings are outsourced to competent and experienced service providers. The hydro-mining performance assumptions used for the LoM planning are based on the current reclamation operations where the method has been successfully “tried and tested”. The operating cost and capital expenditure assumptions are supported by actual operational figures rather than being only based on computations from “zero based” cost models or feasibility studies. Similarly, the equipment requirements, manning complements and necessary supporting infrastructure, in terms of water and power supply, are well understood by FWGR. There have been no untested technical assumptions made with regards to mining design criteria. The cost and maintenance of the mining equipment, and employees are paid for by the mining contractors. The pipeline and pumping design and associated capital expenditure estimate has been undertaken by independent specialists familiar with the mining operations. Specific mining schedules were developed for each TSF based on the grade distribution of the Mineral Resource block models. These schedules were integrated into a production plan that exhausts FWGR’s current Mineral Reserves (Graph A). Far West Gold Recoveries (Proprietary) Limited Document No: PR/SMI/1684/26 19 Graph A: LoM Production Forecast Source: Sound Mining, 2026 Sound Mining is satisfied that the LoM schedule is reasonable and appropriate for the operation. The hydraulic mining operation is not suited for selective mining, other than where broad sections of TSFs can be rejected, but the mine planning and scheduling has shown that this is unnecessary. No geotechnical constraints have been applied and hydrological aspects affecting the surface deposits are not significant to the operation. The mining contractor provides its own equipment (i.e., “mining units”), and so no provision has been made in the initial capital estimate for mining equipment. 1.9. Process and Recovery Methods Sound Mining is of the opinion that sufficient test work is available to support the metallurgical performance anticipated for the processing facilities. The LoM plan relies on the currently operating DP2 processing plant (~600ktpm) and an expansion thereof to 1,200ktpm. FWGR’s Phase 1 entailed a modification and refurbishment of the old DP2 plant to accommodate a nameplate throughput of 600ktpm. Based on bench-scale metallurgical test work, the QP has adopted a conservative UFR recovery of 10% for the economic assessment. This recovery represents the expected additional gold recovered from the CIL tailings stream through the implementation of the AZTEC UpFlow Reactor (UFR) technology and has been applied to material with a minimum tailings grade of 0.14 g/t. The 10% UFR recovery assumption has been included in the base case economic assessment, with the impact of lower and higher recovery outcomes evaluated through sensitivity analysis. A detailed design to double the throughput to 1.2Mtpm was prepared by external specialists with appropriate capital cost estimates. These were reviewed by Sound Mining and are considered to be appropriate and in-line with industry standards. 1.10. Infrastructure Sound Mining has inspected the existing infrastructure. The QP is of the opinion that this infrastructure has been correctly planned, properly installed, is fully functional, and well maintained. - 500 1 000 1 500 2 000 2 500 3 000 - 2 000 4 000 6 000 8 000 10 000 12 000 14 000 16 000 2 0 2 7 2 0 2 8 2 0 2 9 2 0 3 0 2 0 3 1 2 0 3 2 2 0 3 3 2 0 3 4 2 0 3 5 2 0 3 6 2 0 3 7 2 0 3 8 2 0 3 9 2 0 4 0 2 0 4 1 2 0 4 2 2 0 4 3 2 0 4 4 2 0 4 5 2 0 4 6 G o ld R e co v e re d ( k g ) T o n s ( M t) Driefontein No 5 TSF Driefontein No 3 TSF Libanon TSF Kloof 1 TSF Kloof 2 TSF Venterspost South TSF Venterspost North TSF Recovered Gold Far West Gold Recoveries (Proprietary) Limited Document No: PR/SMI/1684/26 20 Electricity is currently supplied from Eskom’s 132kV and 44kV grid to various Sibanye Gold owned gold mines in the vicinity of FWGR’s operations. The power requirement of FWGR remains within the current surplus capacity to the Driefontein, Kloof and Cooke mining complexes. Power supply remains a material risk to all mining operations in South Africa including FWGR’s operations. A closed water system has been designed to avoid having to treat water or having to discharge into surface water courses (Figure H). Figure H: TSF Location, Make-up Water Shafts, Processing Plants and Pipeline Layouts Source: Sound Mining, 2026 Water is pumped from underground workings at Kloof 10 shaft and Driefontein 10 shaft, and the consumption from these shafts will not exceed the pumping rates approved in the respective water use licenses (WULs). Water will also be reclaimed from the RTSF in due course and Sound Mining is satisfied that there will be more than enough water to meet the requirements of the operation as currently planned. The hydro-mining, reprocessing and re-deposition of tailings material requires a network of pipes. Slurry pipelines will be needed from the hydro-mining sites at the TSFs to DP2 and tailings pipelines from DP2 to the respective deposition facilities. High pressure water pipelines are necessary to supply the mining operations while separate low-pressure water

Far West Gold Recoveries (Proprietary) Limited Document No: PR/SMI/1684/26 21 pipes are needed for returning water to DP2 from water dams at the various TSFs. These have all been adequately designed and included in the LoM planning. A large regional tailings storage facility (RTSF) is being constructed to ensure adequate storage facilities for the long-term deposition of all tailings arising from FWGR operations. It is located on Transvaal Supergroup lithology (Figure D), to mitigate any risk of dolomite related sink holes. The design and cost estimate is for a storage capacity of 800Mt and a potential disposal rate of up to 2.4Mtpm. It will eventually cover an area of approximately 1,000ha with a final top surface area of around 600ha at a maximum height of 100m. The selected site of approximately 1,300ha is shown in Figure I. Figure I: RTSF Footprint Source: FWGR, 2026 The permitting for this site has been approved based on a design around a geomembrane barrier. New arisings will continue to be deposited on the Driefontein 4 TSF, until the RTSF is ready to receive new arisings. 1.11. Market Studies Gold is a precious metal, refined and sold as bullion on the international market. It is traded globally on financial markets almost continuously and traditionally used for jewelry, bartering or storing wealth. Aside from the gold holdings of central banks, current uses of gold include jewelry, private investment, dentistry, medicine and technology (Table E). Far West Gold Recoveries (Proprietary) Limited Document No: PR/SMI/1684/26 22 Table E: Above Ground Gold Stocks in 2025 Description Quantity (kt) Contribution (%) Jewelry 99.7 45.2 Private Investment 51.0 23.1 Bank Holdings 38.6 17.5 Other 31.4 14.2 Source: GoldHub, 2026 It is noted that all gold produced by DRDGOLD is sold directly to South African bullion banks at prevailing market prices denominated in South African Rand (ZAR). 1.12. Environmental Permitting and Liability A review of environmental status was undertaken by an independent environmental specialist. The authorizations required for the “listed activities” under NEMA, NEM: WA, NEM: AQA and NWA were reviewed in detail. EIA, EMPrs and environmental authorizations exist for the Kloof and Driefontein mining areas. Areas requiring amendments have been cited. Environmental permitting is underway and at an appropriate stage for the planned expansions. There is enough time for approval of amendment applications, and no fatal flaw exists from a compliance perspective. Some heritage and culturally significant areas have been identified, and these are accommodated in the construction plans. The activities of FWGR already contribute to the socio-economic environment on the West Rand. The operation contributes to the national GDP and provides long-term positive impacts in terms of employment, skills development, local procurement of goods and services, as well as local and regional economic development. The Social Impact Assessment notes that informal settlements in close proximity to the operation may pose a risk in terms of community stability. This has, however, improved through quarterly meetings facilitated by the FWGR Environmental Department. Sound Mining believes that these concerns can be managed. The closure liability is assessed annually to maintain environmental compliance. These constitute the quantum of the financial obligation and guarantees required by the Department of Mineral and Petroleum Resources (DMPR). They have been determined on both an “unscheduled” and “scheduled” basis. The unscheduled estimate is based on the costs of rehabilitating the TSFs in their present state without any mining activity having taken place. The disclosure to the DMPR and the quantum of financial guarantees required is based on the unscheduled estimate. The closure liability bank guarantees under Regulation 7 of the NEMA Financial Provision Regulations (2015) must ensure that the financial provision is, at any given time, equal to the sum of the actual costs of implementing the plans for a period of at least ten years forthwith (this includes the annual rehabilitation, final, decommissioning and closure plans). This figure is required to be updated annually and adjusted. In the case of the FWGR the annual updates will show reduced amounts as the tailing’s facilities decrease to only footprint rehabilitation. The scheduled estimate assumes that mining takes place and that the final rehabilitation will be confined to rehabilitation of the TSF footprints and the RTSF. Guardrisk has issued financial guarantees in favor of the DMPR of ZAR481.9 M. An amount of ZAR634.0 M is also invested in Guardrisk Cell Captive under a ring-fenced environmental rehabilitation policy. The financial guarantees and funds held with the Guardrisk Cell Captive (June 30, 2026) are sufficient to cover the 2026 estimated unscheduled liability of ZAR468.24 M as estimated for the operation. Far West Gold Recoveries (Proprietary) Limited Document No: PR/SMI/1684/26 23 1.13. Capital Expenditure and Operating Costs The capital and operating cost estimates used to examine the economic viability of the estimated Mineral Reserves were informed by current operations or appropriate study work, and where necessary, previous estimates have been appropriately inflated to June 2026 real terms. Sound Mining has included a 15% contingency on all costs to reflect a level of confidence between –5%, +15%. A Stay-in-Business (SiB) provision amounting to 2% of annual operating costs has been added to the capital forecast to cover maintenance and equipment replacement costs across the operation. The Guardrisk Cell Captive insurance policy exceeds the current environmental liability, and so no additional provision has been made in the capital estimate. Graph B presents the annual capital expenditure forecast for the operation. Graph B: Capital Expenditure Forecast Source: Sound Mining, 2026 The RTSF is scheduled to be ready in mid-2027, and the remaining capital expenditure is largely earmarked for piping and pumping infrastructure. The operating cost estimate (Table F) has been informed by the actual costs currently incurred by the operation. Economies of scale were taken into consideration for estimating the budget appropriate to an increase in throughput. Table F: Operating Cost Estimate as at June 30, 2026 Description Phase 1 (ZAR/t) Phase 2 (ZAR/t) Salaries and Wages 19.60 13.98 Contractors 15.28 10.76 Reagents 29.39 33.45 Other Engineering Stores 11.06 10.97 Electricity 22.16 40.46 Water 0.48 0.66 Machine Hire 4.18 2.29 Other 17.57 6.11 Other Corporate Costs 7.26 3.32 Contingency (15%) 19.05 18.30 Totals 146.02 140.32 Source: Sound Mining, 2026; and FWGR, 2026 - 500 1 000 1 500 2 000 2 500 2 0 2 7 2 0 2 8 2 0 2 9 2 0 3 0 2 0 3 1 2 0 3 2 2 0 3 3 2 0 3 4 2 0 3 5 2 0 3 6 2 0 3 7 2 0 3 8 2 0 3 9 2 0 4 0 2 0 4 1 2 0 4 2 C a p it a l E x p e n d it u re ( Z A R M ) Direct Capital Expenditure Indirect Capital Expenditure Capital Contingency Far West Gold Recoveries (Proprietary) Limited Document No: PR/SMI/1684/26 24 1.14. Economic Assessment A DCF modeling approach was adopted to examine the economic viability of the Mineral Reserves as stated. It was generated in June 2026 real South African Rand (ZAR) terms and is based on the revenue forecast, associated capital and operating cost forecasts. The DCF model assumes a 100% equity-based business. It does not consider the effect of working capital changes and relies on appropriate and reasonable economic assumptions (Table G). Table G: Inputs to the DCF Model Description Unit Quantum Key Terms Discount Rate % 10.9 SIB/Replacement Capital (% of Operating Costs) % 2 Company Tax % 33- (165 / (100*Operating Profit/Net Revenue)) Royalties % 0 Contingency % 15% Exchange Rate ZAR/USD 16.30 Price per Troy Ounce USD/oz 4,114 Price Per Kg ZAR/kg 2,155,461 Source: Sound Mining, 2026; and FWGR, 2026 The assets are part of the ongoing business of FWGR, which is not subject to the Mineral and Petroleum Resources Royalty Act, 2008 (Act No. 28 of 2008) and so the royalty formula for unrefined metals was not included in the revenue determination. The following processing recovery assumptions are supported by test work and current plant performance data: • 51.9% for Driefontein 5 TSF material; • 51.5% for Driefontein 3 TSF material; • 50.5% for Kloof 1 TSF material; • 42.1% for Kloof 2 TSF material; • 47.2% Libanon TSF material; • 48.9% for Venterspost North TSF material; and • 57.6% for Venterspost South TSF material. The revenue forecast relies on a real gold price of ZAR2,155,461/kg (i.e., USD4,114/oz at ZAR16.30/USD). Taxes would be determined using the gold mining tax formula with all unredeemed capital taken into account. These are applied to the material from the respective TSFs to compute the amount of gold sold. The expansion of DP2 facilitates an increase in gold sales over time (Graph C).

Far West Gold Recoveries (Proprietary) Limited Document No: PR/SMI/1684/26 25 Graph C: Gold Sales Forecast Source: Sound Mining, 2026 The operations could continue beyond 2046 if the available TSFs are eventually incorporated into the operation. At this stage, the economic assessment has only considered the depletion of the TSFs that comprise the current Mineral Reserves. The QP considers the inputs to the DCF model to constitute a level of accuracy of -5%, +15%. Graph D presents the post-tax cashflow for an operation that excludes the benefits that would eventually be derived from the available TSFs. Graph D: Post-tax Discounted Cashflows Source: Sound Mining, 2026 The cumulative post-tax cashflows over the LoM remain positive. When assuming a discount rate of 10.9% for the unleveraged operation, a Net Present Value (NPV) of ZAR15.97 billion is computed. - 500 1 000 1 500 2 000 2 500 3 000 2 0 2 7 2 0 2 8 2 0 2 9 2 0 3 0 2 0 3 1 2 0 3 2 2 0 3 3 2 0 3 4 2 0 3 5 2 0 3 6 2 0 3 7 2 0 3 8 2 0 3 9 2 0 4 0 2 0 4 1 2 0 4 2 2 0 4 3 2 0 4 4 2 0 4 5 2 0 4 6 G o ld S o ld ( k g ) - 5 000 10 000 15 000 20 000 25 000 30 000 35 000 40 000 - 500 1 000 1 500 2 000 2 500 3 000 3 500 2 0 2 7 2 0 2 8 2 0 2 9 2 0 3 0 2 0 3 1 2 0 3 2 2 0 3 3 2 0 3 4 2 0 3 5 2 0 3 6 2 0 3 7 2 0 3 8 2 0 3 9 2 0 4 0 2 0 4 1 2 0 4 2 2 0 4 3 2 0 4 4 2 0 4 5 2 0 4 6 2 0 4 7 Z A R M Free Cashflow After Tax Cumulative Free Cashflow After Tax Far West Gold Recoveries (Proprietary) Limited Document No: PR/SMI/1684/26 26 The achievability of the LoM plans, budgets and forecasts are subject to certain technical or economic risks and accordingly have been assessed against upside or downside changes of between -20% and +20%. The consequential potential impacts are presented in Table H and are illustrated graphically in Graph E. Table H: Sensitivity of Post-tax NPV Variance NPV10 (ZAR Billion) 80% 90% 100% 110% 120% Revenue 10.21 13.09 15.97 18.84 21.72 Capital Expenditure 18.10 17.03 15.97 14.90 13.83 Operating Costs 16.40 16.18 15.97 15.75 15.54 Source: Sound Mining, 2026 Graph E shows that changes to the revenue forecast will impact margins the most. Graph E: Revenue and Costs Sensitivity Source: Sound Mining, 2026 Table I shows the materiality of changes in the gold price. Table I: Sensitivity of Gold Price Gold Price ZAR/kg 800,000 1,200,000 1,600,000 2,000,000 2,100,000 2,300,000 NPV10 (ZAR Million) (3,563) 3,131 8,499 13,891 15,226 17,896 Source: Sound Mining, 2026 The operation is economically viable above a gold price of ZAR992,201/kg. The impact of changes to the operating cost forecast is materially less, and any variance in capital expenditure being relatively insensitive. As a final sensitivity, the QP has tested the impact of FWGR employing an Up-flow Reactor to improve on overall plant recoveries (Table J). Table J: Impact of UFR Inclusion UFR Recovery 0.0% 3.0% 6.0% 9.0% 12.0% 15.0% NPV10 (ZAR Billion) 13.63 14.33 15.03 15.73 16.43 17.13 Source: Sound Mining, 2026 - 5 000 10 000 15 000 20 000 25 000 80% 90% 100% 110% 120% N P V ( Z A R M ) Revenue Operating Costs Capital Expenditure Far West Gold Recoveries (Proprietary) Limited Document No: PR/SMI/1684/26 27 1.15. Concluding Comments The drilling, sampling, analytical processes and governance of the exploration programs are appropriate and in-line with industry best practice. They are considered to be of high confidence. The density used to determine quantities from volumes has been determined from both in situ measured values and empirical data and is considered reliable. The QPs conclude that the estimations are based on a suitable database of code compliant information. Despite the usual existence of environmental, political, social and infrastructural risks the QP’s are satisfied that the FWGR operation is a relatively low risk business in the context of the broader South African mining industry. FWGR’s legal tenure is underpinned by the amended EMPs and access and usage rights to exploit the moveable assets. The assets held by FWGR were acquired from Sibanye Gold (Proprietary) Limited, a subsidiary of Sibanye Stillwater Limited, in a transaction in which common law ownership was established over the various TSFs containing the Mineral Resources and Mineral Reserves. A Use and Access Agreement with Sibanye Gold articulates the various rights, permits and licenses held by Sibanye Gold in terms of which FWGR operates, pending the transfer to FWGR of those that are transferable. FWGR conducts its activities inter alia in accordance with Environmental Approvals (EAs) and the provisions of the Mine Health and Safety Act and regulations. The land on which the RTSF is being constructed has been secured by FWGR. TSFs constructed from the tailings of Witwatersrand gold mining operations have been successfully and economically exploited for several decades and the geotechnical and geometallurgical characteristics are well understood from experience and from test work on the FWGR assets themselves. Notwithstanding the risks identified herein, which can be managed, no material factors of a geotechnical or geometallurgical nature, for example, have been identified that would have a significant effect on the prospects for eventual economic extraction. The DP2 plant has performed in-line with expectations and the construction for its expansion to 1.2Mtpm is based on representative and adequate metallurgical test work. The mass balance for the plant is appropriate. Scrutiny of the LoM plan reveals that recoveries currently being achieved coincide with expectations from metallurgical test work and that the quantities and grades reported are consistent with forecasts from the Mineral Resource estimation. Historically achievable plant gold recoveries are expected to be realized from the expanded DP2 plant with gold recoveries being principally driven by the plant feed head grade. In addition, the UFR is expected to improve recoveries, however this improvement is still to be quantified though ongoing test work. New arisings will eventually be stored in the RTSF which will have excess capacity from both a depositional rate (2.4Mtpm) and final capacity perspective (800Mt). All the necessary infrastructure requirements have been reviewed and are considered appropriate. Sound Mining endorses the design for the RTSF. The estimated capital expenditure and operational costs are supported by actual operational data from the current operations and thus considered appropriate. The operation is robust, the Mineral Reserves are economically viable, and the QP considers the LoM plan to be sufficient for the Mineral Reserve estimate. Far West Gold Recoveries (Proprietary) Limited Document No: PR/SMI/1684/26 28 2. INTRODUCTION ITEM 2 - (I); (II); (III); (IV) AND (V) DRDGOLD Limited (DRDGOLD) is a tailings retreatment company located near Johannesburg, South Africa. It has a primary listing on the Johannesburg Stock Exchange (JSE) and a secondary listing on the New York Stock Exchange (NYSE). The DRDGOLD operations are comprised of two wholly owned entities covering their East Rand (east of Johannesburg) and far West Rand (far west of Johannesburg) businesses. The East Rand operations are run by Ergo Mining (Proprietary) Limited (Ergo) and the West Rand operations by Far West Gold Recoveries (Proprietary) Limited (FWGR). FWGR reclamation assets comprise seven Tailings Storage Facilities (TSFs) reclamation assets. There are numerous TSFs, owned by third parties, potentially available in the area for future reclamation (Available TSFs). This Technical Report Summary (TRS) was prepared for DRDGOLD as the registrant and presents the latest changes to the Mineral Resources and Mineral Reserves of FWGR. This submission is DRDGOLD’s third TRS filing and reflects updates to the Mineral Resources and Mineral Reserves of FWGR since the initial TRS filing on October 28, 2022. The update reflects the transfer of the Kloof 2 TSF to FWGR in December 2025, pursuant to the exchange agreement concluded between DRDGOLD and Sibanye Gold (Proprietary) Limited (Sibanye Gold). The TSF has added 67Mt to the FWGR’s Mineral Resources and Mineral Reserves and extended the estimated Life-of-Mine (LoM) by four years. FWGR’s Mineral Resources and Mineral Reserves are derived from seven TSFs and are 100% attributable to DRDGOLD (the registrant). The submission is to the Securities and Exchange Commission (SEC) and has been compiled to align with the requirements of Subpart 1300 of Regulation S-K under the U.S. Securities Exchange Act of 1934 (Regulation S-K) and Item 601(b)(96) of Regulation S-K (Item 601(b)(96)) (S-K 1300). FWGR is progressing with a phased approach to expanding the current operations: • Phase 1 is the current operation which involved upgrading the Driefontein Processing Plant 2 (DP2) to process tailings from the closest TSF at a planned throughput of around 500ktpm. This Phase was successfully commissioned and the operation reached steady state production in 2019; and • Phase 2 involves building additional processing capacity through the expansion of DP2 to a throughput of 1.2Mtpm. The ramp up in throughput is planned to take place over three months and is expected to be completed by the first quarter of FY2028. Current arisings will continue to report to the Driefontein 4 depositional TSF at 500ktpm until commissioning of a Regional Tailings Storage Facility (RTSF). Upon commencement of deposition to the RTSF, deposition to the Driefontein 4 TSF will end. The RTSF will have sufficient storage capacity to also accommodate new arisings at a rate of 2.4Mtpm from the mining of available TSFs in the area well into the future. Examples of these include Driefontein 1 TSF and Driefontein 2 TSF, which, once decommissioned, are to be transferred to FWGR from Sibanye Gold. 2.1. Corporate Structure and Compliance Figure 1 presents DRDGOLD’s corporate structure.

Far West Gold Recoveries (Proprietary) Limited Document No: PR/SMI/1684/26 29 Figure 1: DRDGOLD Corporate Structure Source: DRDGOLD, 2026 Sibanye Gold owns a 50.1% shareholding of DRDGOLD. Non-public ownership of DRDGOLD includes the shareholding of directors and prescribed officers of 0.1%. Such shareholding is classified as non-public. 2.2. Purpose and Terms of Reference FWGR commissioned Sound Mining International SA (Proprietary) Limited (Sound Mining) to compile a SEC S-K 1300 compliant TRS that describes the Mineral Resource and Mineral Reserve estimates as at June 30, 2026. The document date is October 2, 2026, and there are no material changes in the period between these dates. The Qualified Person (QP) has relied on information provided by FWGR for this purpose with respect to legal matters (Item 3), environmental or social and labor planning aspects (Item 17) and economic assumptions (Item 19). Sound Mining is an independent advisory company. The Terms of Reference (ToR) required an independent technical review of FWGR in order to identify factors of a technical and strategic nature that would influence the future viability of the Mineral Reserves. The review accords with the principles of open and transparent disclosure that are embodied in internationally accepted Codes for Corporate Governance. It has been based upon technical information supplied by FWGR and its appointed consultants. The contractual agreement with FWGR, for the preparation of the TRS, was with Sound Mining and not with the QP as an individual. The QPs provide independent opinions and conclusions throughout this TRS. The estimation of Mineral Resources and Mineral Reserves is inherently subject to some level of uncertainty and inaccuracy, because they are based on analytical results of samples that commonly represent only a small portion of a mineral deposit. The uncertainty of the estimates, where material, are explained in this TRS and are reflected in the choice of Mineral Resource and Mineral Reserve categories. 2.3. Qualified Persons Declaration and Qualifications The signatories to this TRS are qualified to express their professional opinions on the technical aspects and value of the mineral assets described. The technical and economic information provided is correct to the best of the QPs’ knowledge, having followed best endeavors. Far West Gold Recoveries (Proprietary) Limited Document No: PR/SMI/1684/26 30 The QPs responsible for this TRS and the Mineral Resource and Mineral Reserves as stated are: • Mr. V Duke is the designated QP responsible for the compilation and reporting of FWGR’s Mineral Reserves. He holds a B.Sc. Mining Engineering (Hons.) and is registered with the Engineering Council of South Africa (ECSA) (No. 940314) and is a Fellow of the Southern African Institute of Mining and Metallurgy (FSAIMM) (Membership No.: 37179). Mr. Duke has over 41 years' experience in the minerals industry and has sufficient experience that is relevant to the style of mineralization and type of deposit under consideration. The QP is recognized by ECSA located at Lake Office Park, 1st Floor, Waterview Corner Building, 2 Ernest Oppenheimer Avenue, Bruma, Johannesburg, South Africa; • Mr. N Weeks is the designated QP responsible for the compilation and reporting of FWGR’s Mineral Resources. Mr. Weeks who holds a B.Sc. (Hons.) in Geology, is registered with the South African Council for Natural Scientific Professions (Pr.Sci.Nat. No.: 155508), and the Geological Society of South Africa (GSSA) (Membership Number: 971184) located on the corner of Carlow Road and Rustenburg Road, Auckland Park, Johannesburg, South Africa. He is a principal geologist with over eight years' experience in mining, geology and consulting; and • Mr. W de Frey is the designated QP responsible for the interrogation and endorsement of the environmental and permitting requirements of FWGR. Mr. de Frey who holds a M.Sc. in Wildlife Management, is registered with the South African Council for Natural Scientific Professions (Pr.Sci.Nat. No.: 400100/02), and the Environmental Assessment Practitioners Association of South Africa (EAPASA) (Reg. No.: 2019/1842) located at 12B Centurus, Centuria Office Park, 265 Von Willich Avenue, Pretoria, Gauteng, South Africa. He is a consultant with more than thirty years’ experience in mining projects, environmental legal compliance, sustainability, construction and wildlife preservation. The QPs were assisted by the following specialists: • Mr. G. Bezuidenhout - Metallurgist; • Mr. G. de Swardt - RTSF; • Mr. T. O’Brien - Driefontein 4 TSF; • Mr. G. Ovens – Environmental and Permitting; • Mr. A. Twiggs – Exploration and Mineral Resource modeling; and • Mr. D. O'Callaghan – Exploration and Mineral Resource modeling. The QPs also relied on reports from: • DRA SA (Proprietary) Limited (DRA); • Aztec Mining Limited (Aztec); • Geo Tail (Proprietary) Limited (GTSA); and • Digby Wells Environmental (South Africa) (Proprietary) Limited (Digby Wells). Detailed references and sources of information and data contained in this TRS are presented in Item 23. The Sound Mining QPs and other specialists visited FWGR on several occasions from 2019 to 2026 and examined the operations as shown in Table 1. During the site visits, the infrastructure, TSFs, RTSF, and DP2 sites were inspected. Far West Gold Recoveries (Proprietary) Limited Document No: PR/SMI/1684/26 31 Table 1: Personal Inspection Professional Site Visit V. Duke Numerous Visits from 2019 to 2026 as a QP N. Weeks Numerous Visits from 2020 to 2026 as a QP G. Ovens Visited in 2026 G. Bezuidenhout Visited DP2 in 2026 A. Twiggs Visited Kloof 2 TSF and Driefontein 3 TSF in 2026 D. O'Callaghan Visited Kloof 2 TSF and Driefontein 3 TSF in 2026 Source: Sound Mining, 2026 2.4. Units, Currencies and Survey Coordinate System The economic assessment in this TRS has been carried out in South African Rands (ZAR). All other units used in this TRS are defined in the text or in the Glossary (Item 23). All references to tons are in metric tons; gold ounces (oz Au) are troy ounces (oz) and the conversion factor used for conversion to troy ounces is 31.10348. Unless explicitly stated, all units presented in this TRS are in the Système Internationale (SI) - i.e., metric tons (t), kilometers (km), meters (m), and centimeters (cm). Throughout the technical studies relating to the FWGR numerous acronyms have been used but for reporting purposes, the use of acronyms has been kept to a minimum, with the convention being definition of the acronym in the first usage. However, where required throughout the document the full term may be used for clarity and ease of reading. The coordinate system employed by the surface surveys at the operation is based on the Gauss Conform Projection (UTM), Hartebeeshoek 94 Datum, Ellipsoid WGS84, Central Meridian WG27. Some regional scale maps in this Technical Summary may be referenced with Latitude and Longitude coordinates for ease of reading. 2.5. Political and Economic Climate South Africa gained independence from Britain on May 31, 1961, and was declared a republic. From 1948 until 1990, the South African political and legal systems were based upon the concept of apartheid. South Africa became a constitutional democracy in 1994, and the first democratic elections brought an end to apartheid and ushered in majority rule under the African National Congress (ANC) political party, with a number of different political parties participating in the elections. South Africa continues to hold democratic, peaceful, free and fair elections. The most recent national and provincial elections were held on May 29, 2024. The ANC remained the largest political party but lost the outright parliamentary majority for the first time since 1994. Following the election, President Cyril Ramaphosa was re-elected for a second term and a Government of National Unity (GNU) was formed, which joined the ANC and a number of other political parties, including the Democratic Alliance (DA) and Inkatha Freedom Party (IFP), in a multi-party national executive. 2.6. Minerals Industry South Africa has a mature and well-established minerals industry developed from gold and diamond discoveries in the late 1800s. The country remains a globally significant producer of several commodities, ranking as the world’s largest producer of platinum group metals and chromium, and a major producer of manganese, coal, iron ore, vanadium and gold. The mining sector continues to play a critical role in the national economy, contributing approximately 6% to the GDP in recent years. GDP generated by the South African mining industry has averaged ZAR220 Billion per quarter between 1993 and 2026, reaching an all-time high of ZAR240 Billion in the fourth quarter of 2006, and a record low of ZAR147 Billion in the second quarter of 2020. One of the greatest challenges associated with the minerals and mining industry in South Africa is the political instability, concerns over the reliability of legal tenure, rising costs of labor, electricity, diesel and steel, among other costs. Labor and community unrest, driven by low wages, high unemployment, particularly among contract workers and under- resourced communities, and high crime levels, has proved problematic in recent years. These challenges can disrupt Far West Gold Recoveries (Proprietary) Limited Document No: PR/SMI/1684/26 32 mining operations, increase security and operational costs, and further exacerbate municipalities’ inability to provide adequate infrastructure and services to surrounding communities. Other important concerns for the mining industry are the effect of diseases (i.e., HIV/Aids and Covid-19) on the workforce, as well as historical and current pressures associated with South Africa’s sovereign rating. Although the South African political system remains established and broadly stable, recent political developments (formation of the GNU) have introduced a more complex and governance environment. The political risk index indicates that factors such as the country’s high degree of unionization, the potential for industrial action, persistent policy uncertainty (Item 21), and constraints related to infrastructure and economic performance continue to present risks to investors.

Far West Gold Recoveries (Proprietary) Limited Document No: PR/SMI/1684/26 33 3. PROPERTY DESCRIPTION ITEM 3 (I); (II); (III); (IV), (V) AND (VI) 3.1. Property Location The FWGR operations are located in the Gauteng province of South Africa, approximately 70km southwest of the city of Johannesburg (Figure 2). The operations can be accessed from Johannesburg by traveling for approximately one hour along tarred roads. The operations which are located between the latitudes and longitudes 26°32'34.90"S and 26°5'32.68"S, and 27°24'6.49"E and 27°49'4.84"E and cover an area of 29,577.62ha. Figure 2: Location of the FWGR Operations Source: Sound Mining, 2023 FWGR is located in an area with a long history of gold mining and as a consequence the region is disseminated with TSFs and supporting mining infrastructure. The operation’s infrastructure and current TSFs lie across two mining rights owned by Sibanye Gold which stretch from Westonaria to Carletonville (Figure 3). Far West Gold Recoveries (Proprietary) Limited Document No: PR/SMI/1684/26 34 Figure 3: FWGR Operations Source: Sound Mining, 2026 3.2. Legal Tenure and Permitting An independent environmental and permitting specialist has undertaken a review of the legal aspects of the assets. This review has been based on information provided by DRDGOLD and FWGR. DRDGOLD is a subsidiary of Sibanye Gold and FWGR operates within the extensive framework of legal tenure held by Sibanye Gold. 3.3. Material Agreements, Access and Surface Rights 3.3.1. Exchange Agreement Sibanye Gold and DRDGOLD signed an Exchange Agreement on November 22, 2017. The agreement contains terms in connection with FWGR which was established specifically to house the intended TSF reclamation activities. The agreement provided that Sibanye Gold initially obtained a 38.05% stake in DRDGOLD in exchange for the FWGR assets, with the option to increase it to 50.1% by way of a cash subscription. This option was exercised, and Sibanye Gold currently holds a 50.1% equity in DRDGOLD, meaning that Sibanye Gold is now the ultimate holding company of FWGR through its majority interest in DRDGOLD. In Exchange DRDGOLD is entitled to receive 3 TSFs, namely Driefontein 1, Driefontein 2 and Kloof 2 from Sibanye Gold when their depositional duties end. Accordingly, the Kloof 2 TSF has now transferred to FWGR in December 2025. Far West Gold Recoveries (Proprietary) Limited Document No: PR/SMI/1684/26 35 3.3.2. Use and Access Agreement A “Use and Access Agreement” signed in November 2017, grants FWGR the rights to following: • access to Kloof 10 shaft located in the Kloof Mining Right area and Driefontein 10 shaft located in the Driefontein Mining Right area for the purpose of pumping and supplying the required quantities of water to FWGR; • agreements for the installation, supply and distribution of power; • existing and proposed pipeline routes; • servitudes, wayleaves and surface right permits; and • access to the Driefontein 1 Gold Plant. The agreement stipulates that it will endure until the end of FWGR’s business and that FWGR is to give Sibanye Gold at least 18 months’ prior written notice of the anticipated end of life of the business. The surface rights agreements over both the Driefontein and Kloof Mining Rights (held by Sibanye Gold) for the TSFs and processing plant sites are adequate for the current Sibanye Gold operations and would therefore also be applicable to FWGR's operations. FWGR will secure servitudes for all of its infrastructure located on Sibanye Gold land. FWGR owns all the land on which the RTSF is being constructed, with the exception of two portions which are subject to a 99-year lease until such stage as the properties have been successfully subdivided and transferred to FWGR. FWGR has met the requirements of the Spatial Planning and Land Use Management Act, 2016 (Act No. 13 of 2016) (SPLUMA) and has successfully rezoned the land from agricultural use to that of mining. FWGR has submitted a Subdivision of Agricultural Land Act 70 of 1970 (SALA) application for the successful subdivision and consolidation of certain portions of land on which the RTSF is located. 3.4. Permitting The permitting associated with the different Mining Right (MR) areas (Figure 4) are commented below. The minerals in tailings fall outside the definition of ‘mineral’ in the Mineral and Petroleum Resources Development Act’ (MPRDA), where a MR as defined in this act is not a requirement, and the operations of FWGR are conducted in accordance with the Integrated Environmental Authorizations (IEAs) issued by the DMPR. In 2016, Sibanye Gold applied for IEAs for the West Rand Tailings Retreatment Project (WRTRP) following the applicable NEMA Environmental Impact Assessment (EIA) process, supported by the required specialist reports and Environmental Management Program reports (EMPrs). The IEAs were subsequently transferred to FWGR following approval of the transfer by the DMPR. As part of its expansion plans, FWGR will be required to make similar applications for appropriate IEAs. Far West Gold Recoveries (Proprietary) Limited Document No: PR/SMI/1684/26 36 Figure 4: Sibanye Gold Mining Rights Source: Sound Mining, 2026 3.4.1. Driefontein Operational Area The DMPR granted Sibanye Gold an EA under the 2014 EIA Regulations (GNR 983 and GNR 984) (the 2014 Regulations) on May 11, 2018. The approval is recorded in GP 30/5/1/2/3/2/1 (51) EM. This EA was transferred to FWGR in July 2023. Driefontein MR: a new order MR (GP 30/5/1/2/2/51MR) was issued in 2007 and is valid until January 2037 and covers 9,490.62ha. Sibanye Gold is entitled to mine all declared material situated within this MR and has all the necessary statutory requirements in place. 3.4.2. Kloof Operational Area In 2016, Sibanye Gold also applied for an IEA which includes a waste management license for Kloof to undertake various listed activities, which the DMPR equally granted on May 11, 2018. The grant is recorded under GP 30/5/1/2/3/2/1 (66) EM and the IEA remains valid until the end of LoM. This IEA was transferred to FWGR in January 2022. An IEA was granted to FWGR for the reclamation of the Libanon TSF GP30/5/1/1/2(000073) BP/BAR on July 15, 2026. Kloof MR: a new order MR (GP 30/5/1/2/2/66MR) issued in 2007, is valid until July 1, 2027, and covers 20,087ha. Sibanye Gold is entitled to mine all declared material falling within this MR and has all the necessary statutory requirements in place. Sibanye Gold is in the process of renewing the Kloof Mining Right in accordance with the provisions of the MPRDA.
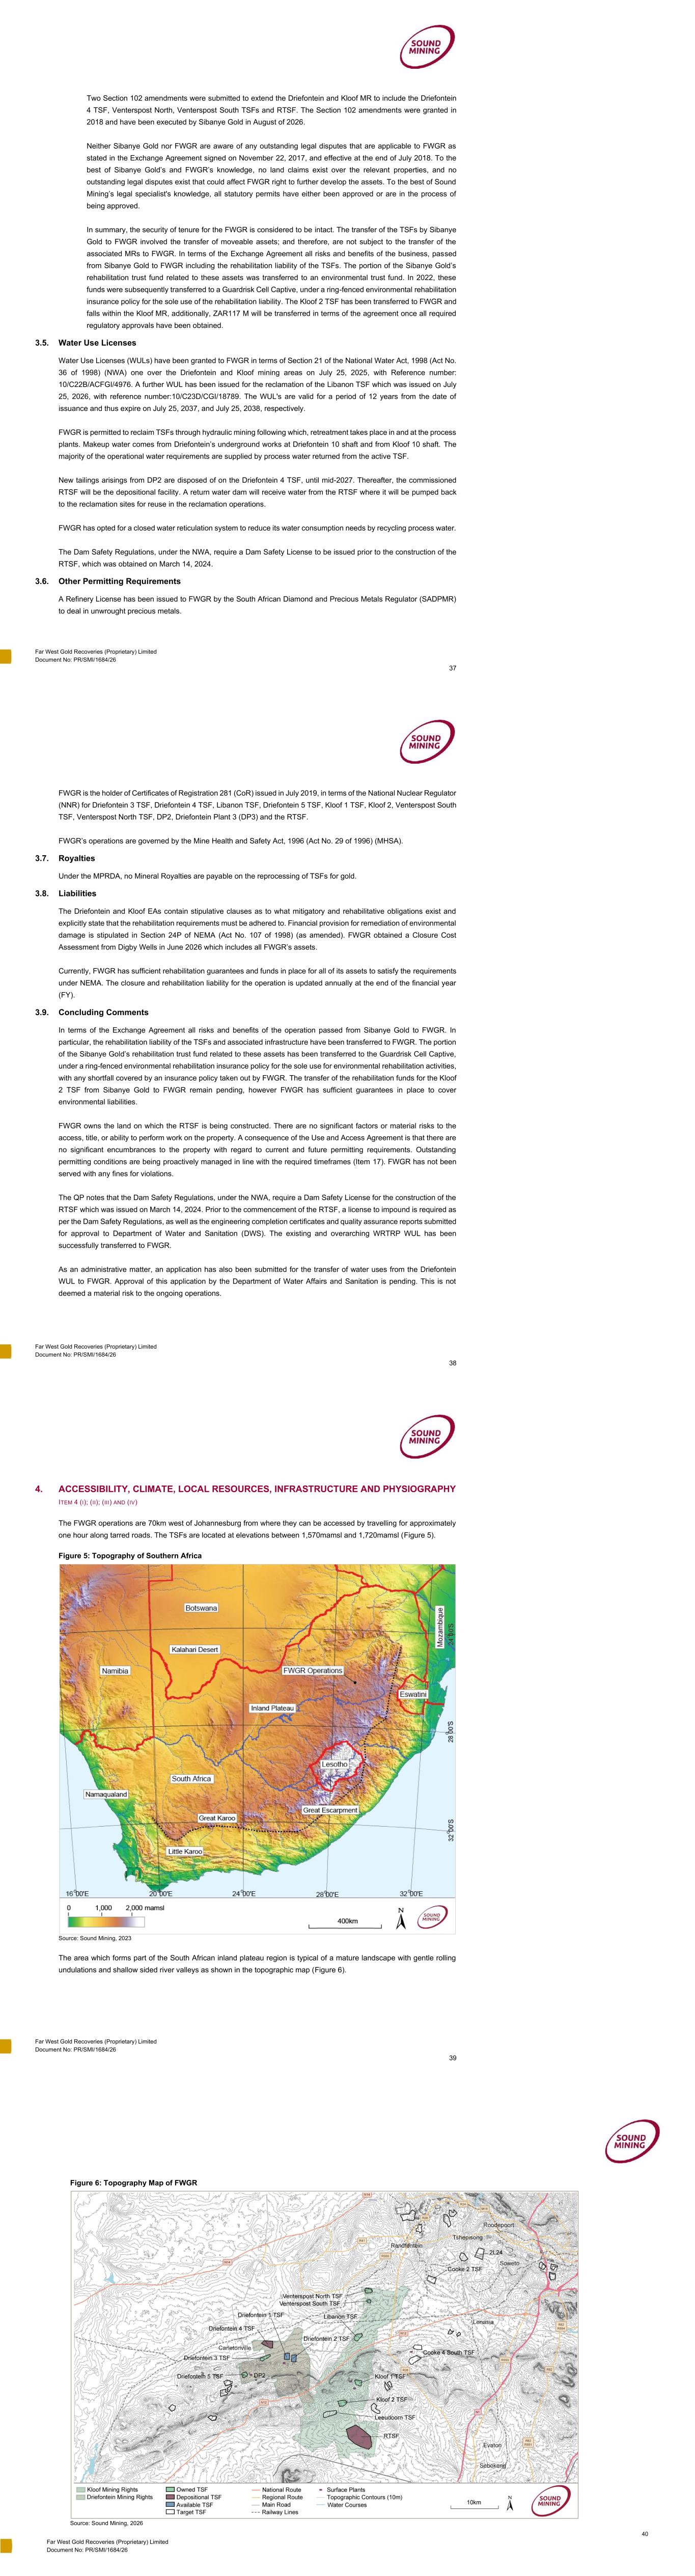
Far West Gold Recoveries (Proprietary) Limited Document No: PR/SMI/1684/26 37 Two Section 102 amendments were submitted to extend the Driefontein and Kloof MR to include the Driefontein 4 TSF, Venterspost North, Venterspost South TSFs and RTSF. The Section 102 amendments were granted in 2018 and have been executed by Sibanye Gold in August of 2026. Neither Sibanye Gold nor FWGR are aware of any outstanding legal disputes that are applicable to FWGR as stated in the Exchange Agreement signed on November 22, 2017, and effective at the end of July 2018. To the best of Sibanye Gold’s and FWGR’s knowledge, no land claims exist over the relevant properties, and no outstanding legal disputes exist that could affect FWGR right to further develop the assets. To the best of Sound Mining’s legal specialist's knowledge, all statutory permits have either been approved or are in the process of being approved. In summary, the security of tenure for the FWGR is considered to be intact. The transfer of the TSFs by Sibanye Gold to FWGR involved the transfer of moveable assets; and therefore, are not subject to the transfer of the associated MRs to FWGR. In terms of the Exchange Agreement all risks and benefits of the business, passed from Sibanye Gold to FWGR including the rehabilitation liability of the TSFs. The portion of the Sibanye Gold’s rehabilitation trust fund related to these assets was transferred to an environmental trust fund. In 2022, these funds were subsequently transferred to a Guardrisk Cell Captive, under a ring-fenced environmental rehabilitation insurance policy for the sole use of the rehabilitation liability. The Kloof 2 TSF has been transferred to FWGR and falls within the Kloof MR, additionally, ZAR117 M will be transferred in terms of the agreement once all required regulatory approvals have been obtained. 3.5. Water Use Licenses Water Use Licenses (WULs) have been granted to FWGR in terms of Section 21 of the National Water Act, 1998 (Act No. 36 of 1998) (NWA) one over the Driefontein and Kloof mining areas on July 25, 2025, with Reference number: 10/C22B/ACFGI/4976. A further WUL has been issued for the reclamation of the Libanon TSF which was issued on July 25, 2026, with reference number:10/C23D/CGI/18789. The WUL's are valid for a period of 12 years from the date of issuance and thus expire on July 25, 2037, and July 25, 2038, respectively. FWGR is permitted to reclaim TSFs through hydraulic mining following which, retreatment takes place in and at the process plants. Makeup water comes from Driefontein’s underground works at Driefontein 10 shaft and from Kloof 10 shaft. The majority of the operational water requirements are supplied by process water returned from the active TSF. New tailings arisings from DP2 are disposed of on the Driefontein 4 TSF, until mid-2027. Thereafter, the commissioned RTSF will be the depositional facility. A return water dam will receive water from the RTSF where it will be pumped back to the reclamation sites for reuse in the reclamation operations. FWGR has opted for a closed water reticulation system to reduce its water consumption needs by recycling process water. The Dam Safety Regulations, under the NWA, require a Dam Safety License to be issued prior to the construction of the RTSF, which was obtained on March 14, 2024. 3.6. Other Permitting Requirements A Refinery License has been issued to FWGR by the South African Diamond and Precious Metals Regulator (SADPMR) to deal in unwrought precious metals. Far West Gold Recoveries (Proprietary) Limited Document No: PR/SMI/1684/26 38 FWGR is the holder of Certificates of Registration 281 (CoR) issued in July 2019, in terms of the National Nuclear Regulator (NNR) for Driefontein 3 TSF, Driefontein 4 TSF, Libanon TSF, Driefontein 5 TSF, Kloof 1 TSF, Kloof 2, Venterspost South TSF, Venterspost North TSF, DP2, Driefontein Plant 3 (DP3) and the RTSF. FWGR’s operations are governed by the Mine Health and Safety Act, 1996 (Act No. 29 of 1996) (MHSA). 3.7. Royalties Under the MPRDA, no Mineral Royalties are payable on the reprocessing of TSFs for gold. 3.8. Liabilities The Driefontein and Kloof EAs contain stipulative clauses as to what mitigatory and rehabilitative obligations exist and explicitly state that the rehabilitation requirements must be adhered to. Financial provision for remediation of environmental damage is stipulated in Section 24P of NEMA (Act No. 107 of 1998) (as amended). FWGR obtained a Closure Cost Assessment from Digby Wells in June 2026 which includes all FWGR’s assets. Currently, FWGR has sufficient rehabilitation guarantees and funds in place for all of its assets to satisfy the requirements under NEMA. The closure and rehabilitation liability for the operation is updated annually at the end of the financial year (FY). 3.9. Concluding Comments In terms of the Exchange Agreement all risks and benefits of the operation passed from Sibanye Gold to FWGR. In particular, the rehabilitation liability of the TSFs and associated infrastructure have been transferred to FWGR. The portion of the Sibanye Gold’s rehabilitation trust fund related to these assets has been transferred to the Guardrisk Cell Captive, under a ring-fenced environmental rehabilitation insurance policy for the sole use for environmental rehabilitation activities, with any shortfall covered by an insurance policy taken out by FWGR. The transfer of the rehabilitation funds for the Kloof 2 TSF from Sibanye Gold to FWGR remain pending, however FWGR has sufficient guarantees in place to cover environmental liabilities. FWGR owns the land on which the RTSF is being constructed. There are no significant factors or material risks to the access, title, or ability to perform work on the property. A consequence of the Use and Access Agreement is that there are no significant encumbrances to the property with regard to current and future permitting requirements. Outstanding permitting conditions are being proactively managed in line with the required timeframes (Item 17). FWGR has not been served with any fines for violations. The QP notes that the Dam Safety Regulations, under the NWA, require a Dam Safety License for the construction of the RTSF which was issued on March 14, 2024. Prior to the commencement of the RTSF, a license to impound is required as per the Dam Safety Regulations, as well as the engineering completion certificates and quality assurance reports submitted for approval to Department of Water and Sanitation (DWS). The existing and overarching WRTRP WUL has been successfully transferred to FWGR. As an administrative matter, an application has also been submitted for the transfer of water uses from the Driefontein WUL to FWGR. Approval of this application by the Department of Water Affairs and Sanitation is pending. This is not deemed a material risk to the ongoing operations. Far West Gold Recoveries (Proprietary) Limited Document No: PR/SMI/1684/26 39 4. ACCESSIBILITY, CLIMATE, LOCAL RESOURCES, INFRASTRUCTURE AND PHYSIOGRAPHY ITEM 4 (I); (II); (III) AND (IV) The FWGR operations are 70km west of Johannesburg from where they can be accessed by travelling for approximately one hour along tarred roads. The TSFs are located at elevations between 1,570mamsl and 1,720mamsl (Figure 5). Figure 5: Topography of Southern Africa Source: Sound Mining, 2023 The area which forms part of the South African inland plateau region is typical of a mature landscape with gentle rolling undulations and shallow sided river valleys as shown in the topographic map (Figure 6). 40 Far West Gold Recoveries (Proprietary) Limited Document No: PR/SMI/1684/26 Figure 6: Topography Map of FWGR Source: Sound Mining, 2026
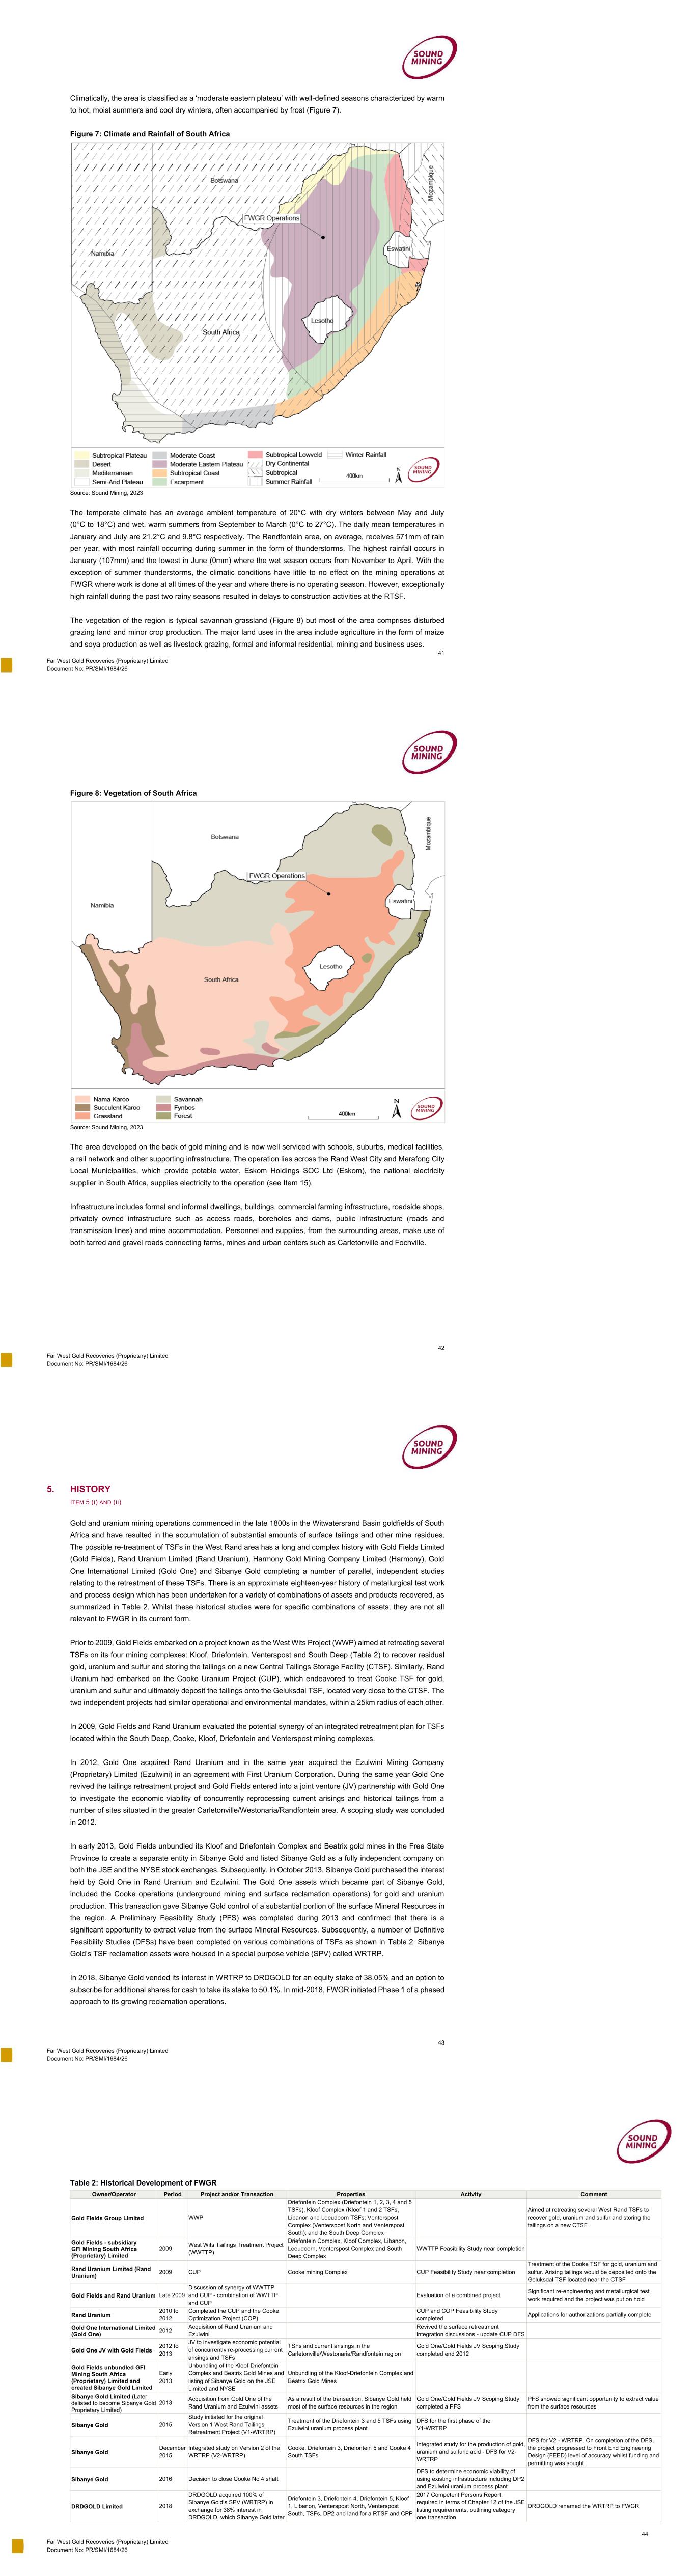
41 Far West Gold Recoveries (Proprietary) Limited Document No: PR/SMI/1684/26 Climatically, the area is classified as a ‘moderate eastern plateau’ with well-defined seasons characterized by warm to hot, moist summers and cool dry winters, often accompanied by frost (Figure 7). Figure 7: Climate and Rainfall of South Africa Source: Sound Mining, 2023 The temperate climate has an average ambient temperature of 20°C with dry winters between May and July (0°C to 18°C) and wet, warm summers from September to March (0°C to 27°C). The daily mean temperatures in January and July are 21.2°C and 9.8°C respectively. The Randfontein area, on average, receives 571mm of rain per year, with most rainfall occurring during summer in the form of thunderstorms. The highest rainfall occurs in January (107mm) and the lowest in June (0mm) where the wet season occurs from November to April. With the exception of summer thunderstorms, the climatic conditions have little to no effect on the mining operations at FWGR where work is done at all times of the year and where there is no operating season. However, exceptionally high rainfall during the past two rainy seasons resulted in delays to construction activities at the RTSF. The vegetation of the region is typical savannah grassland (Figure 8) but most of the area comprises disturbed grazing land and minor crop production. The major land uses in the area include agriculture in the form of maize and soya production as well as livestock grazing, formal and informal residential, mining and business uses. 42 Far West Gold Recoveries (Proprietary) Limited Document No: PR/SMI/1684/26 Figure 8: Vegetation of South Africa Source: Sound Mining, 2023 The area developed on the back of gold mining and is now well serviced with schools, suburbs, medical facilities, a rail network and other supporting infrastructure. The operation lies across the Rand West City and Merafong City Local Municipalities, which provide potable water. Eskom Holdings SOC Ltd (Eskom), the national electricity supplier in South Africa, supplies electricity to the operation (see Item 15). Infrastructure includes formal and informal dwellings, buildings, commercial farming infrastructure, roadside shops, privately owned infrastructure such as access roads, boreholes and dams, public infrastructure (roads and transmission lines) and mine accommodation. Personnel and supplies, from the surrounding areas, make use of both tarred and gravel roads connecting farms, mines and urban centers such as Carletonville and Fochville. 43 Far West Gold Recoveries (Proprietary) Limited Document No: PR/SMI/1684/26 5. HISTORY ITEM 5 (I) AND (II) Gold and uranium mining operations commenced in the late 1800s in the Witwatersrand Basin goldfields of South Africa and have resulted in the accumulation of substantial amounts of surface tailings and other mine residues. The possible re-treatment of TSFs in the West Rand area has a long and complex history with Gold Fields Limited (Gold Fields), Rand Uranium Limited (Rand Uranium), Harmony Gold Mining Company Limited (Harmony), Gold One International Limited (Gold One) and Sibanye Gold completing a number of parallel, independent studies relating to the retreatment of these TSFs. There is an approximate eighteen-year history of metallurgical test work and process design which has been undertaken for a variety of combinations of assets and products recovered, as summarized in Table 2. Whilst these historical studies were for specific combinations of assets, they are not all relevant to FWGR in its current form. Prior to 2009, Gold Fields embarked on a project known as the West Wits Project (WWP) aimed at retreating several TSFs on its four mining complexes: Kloof, Driefontein, Venterspost and South Deep (Table 2) to recover residual gold, uranium and sulfur and storing the tailings on a new Central Tailings Storage Facility (CTSF). Similarly, Rand Uranium had embarked on the Cooke Uranium Project (CUP), which endeavored to treat Cooke TSF for gold, uranium and sulfur and ultimately deposit the tailings onto the Geluksdal TSF, located very close to the CTSF. The two independent projects had similar operational and environmental mandates, within a 25km radius of each other. In 2009, Gold Fields and Rand Uranium evaluated the potential synergy of an integrated retreatment plan for TSFs located within the South Deep, Cooke, Kloof, Driefontein and Venterspost mining complexes. In 2012, Gold One acquired Rand Uranium and in the same year acquired the Ezulwini Mining Company (Proprietary) Limited (Ezulwini) in an agreement with First Uranium Corporation. During the same year Gold One revived the tailings retreatment project and Gold Fields entered into a joint venture (JV) partnership with Gold One to investigate the economic viability of concurrently reprocessing current arisings and historical tailings from a number of sites situated in the greater Carletonville/Westonaria/Randfontein area. A scoping study was concluded in 2012. In early 2013, Gold Fields unbundled its Kloof and Driefontein Complex and Beatrix gold mines in the Free State Province to create a separate entity in Sibanye Gold and listed Sibanye Gold as a fully independent company on both the JSE and the NYSE stock exchanges. Subsequently, in October 2013, Sibanye Gold purchased the interest held by Gold One in Rand Uranium and Ezulwini. The Gold One assets which became part of Sibanye Gold, included the Cooke operations (underground mining and surface reclamation operations) for gold and uranium production. This transaction gave Sibanye Gold control of a substantial portion of the surface Mineral Resources in the region. A Preliminary Feasibility Study (PFS) was completed during 2013 and confirmed that there is a significant opportunity to extract value from the surface Mineral Resources. Subsequently, a number of Definitive Feasibility Studies (DFSs) have been completed on various combinations of TSFs as shown in Table 2. Sibanye Gold’s TSF reclamation assets were housed in a special purpose vehicle (SPV) called WRTRP. In 2018, Sibanye Gold vended its interest in WRTRP to DRDGOLD for an equity stake of 38.05% and an option to subscribe for additional shares for cash to take its stake to 50.1%. In mid-2018, FWGR initiated Phase 1 of a phased approach to its growing reclamation operations. 44 Far West Gold Recoveries (Proprietary) Limited Document No: PR/SMI/1684/26 Table 2: Historical Development of FWGR Owner/Operator Period Project and/or Transaction Properties Activity Comment Gold Fields Group Limited WWP Driefontein Complex (Driefontein 1, 2, 3, 4 and 5 TSFs); Kloof Complex (Kloof 1 and 2 TSFs, Libanon and Leeudoorn TSFs; Venterspost Complex (Venterspost North and Venterspost South); and the South Deep Complex Aimed at retreating several West Rand TSFs to recover gold, uranium and sulfur and storing the tailings on a new CTSF Gold Fields - subsidiary GFI Mining South Africa (Proprietary) Limited 2009 West Wits Tailings Treatment Project (WWTTP) Driefontein Complex, Kloof Complex, Libanon, Leeudoorn, Venterspost Complex and South Deep Complex WWTTP Feasibility Study near completion Rand Uranium Limited (Rand Uranium) 2009 CUP Cooke mining Complex CUP Feasibility Study near completion Treatment of the Cooke TSF for gold, uranium and sulfur. Arising tailings would be deposited onto the Geluksdal TSF located near the CTSF Gold Fields and Rand Uranium Late 2009 Discussion of synergy of WWTTP and CUP - combination of WWTTP and CUP Evaluation of a combined project Significant re-engineering and metallurgical test work required and the project was put on hold Rand Uranium 2010 to 2012 Completed the CUP and the Cooke Optimization Project (COP) CUP and COP Feasibility Study completed Applications for authorizations partially complete Gold One International Limited (Gold One) 2012 Acquisition of Rand Uranium and Ezulwini Revived the surface retreatment integration discussions - update CUP DFS Gold One JV with Gold Fields 2012 to 2013 JV to investigate economic potential of concurrently re-processing current arisings and TSFs TSFs and current arisings in the Carletonville/Westonaria/Randfontein region Gold One/Gold Fields JV Scoping Study completed end 2012 Gold Fields unbundled GFI Mining South Africa (Proprietary) Limited and created Sibanye Gold Limited Early 2013 Unbundling of the Kloof-Driefontein Complex and Beatrix Gold Mines and listing of Sibanye Gold on the JSE Limited and NYSE Unbundling of the Kloof-Driefontein Complex and Beatrix Gold Mines Sibanye Gold Limited (Later delisted to become Sibanye Gold Proprietary Limited) 2013 Acquisition from Gold One of the Rand Uranium and Ezulwini assets As a result of the transaction, Sibanye Gold held most of the surface resources in the region Gold One/Gold Fields JV Scoping Study completed a PFS PFS showed significant opportunity to extract value from the surface resources Sibanye Gold 2015 Study initiated for the original Version 1 West Rand Tailings Retreatment Project (V1-WRTRP) Treatment of the Driefontein 3 and 5 TSFs using Ezulwini uranium process plant DFS for the first phase of the V1-WRTRP Sibanye Gold December 2015 Integrated study on Version 2 of the WRTRP (V2-WRTRP) Cooke, Driefontein 3, Driefontein 5 and Cooke 4 South TSFs Integrated study for the production of gold, uranium and sulfuric acid - DFS for V2- WRTRP DFS for V2 - WRTRP. On completion of the DFS, the project progressed to Front End Engineering Design (FEED) level of accuracy whilst funding and permitting was sought Sibanye Gold 2016 Decision to close Cooke No 4 shaft DFS to determine economic viability of using existing infrastructure including DP2 and Ezulwini uranium process plant DRDGOLD Limited 2018 DRDGOLD acquired 100% of Sibanye Gold’s SPV (WRTRP) in exchange for 38% interest in DRDGOLD, which Sibanye Gold later Driefontein 3, Driefontein 4, Driefontein 5, Kloof 1, Libanon, Venterspost North, Venterspost South, TSFs, DP2 and land for a RTSF and CPP 2017 Competent Persons Report, required in terms of Chapter 12 of the JSE listing requirements, outlining category one transaction DRDGOLD renamed the WRTRP to FWGR
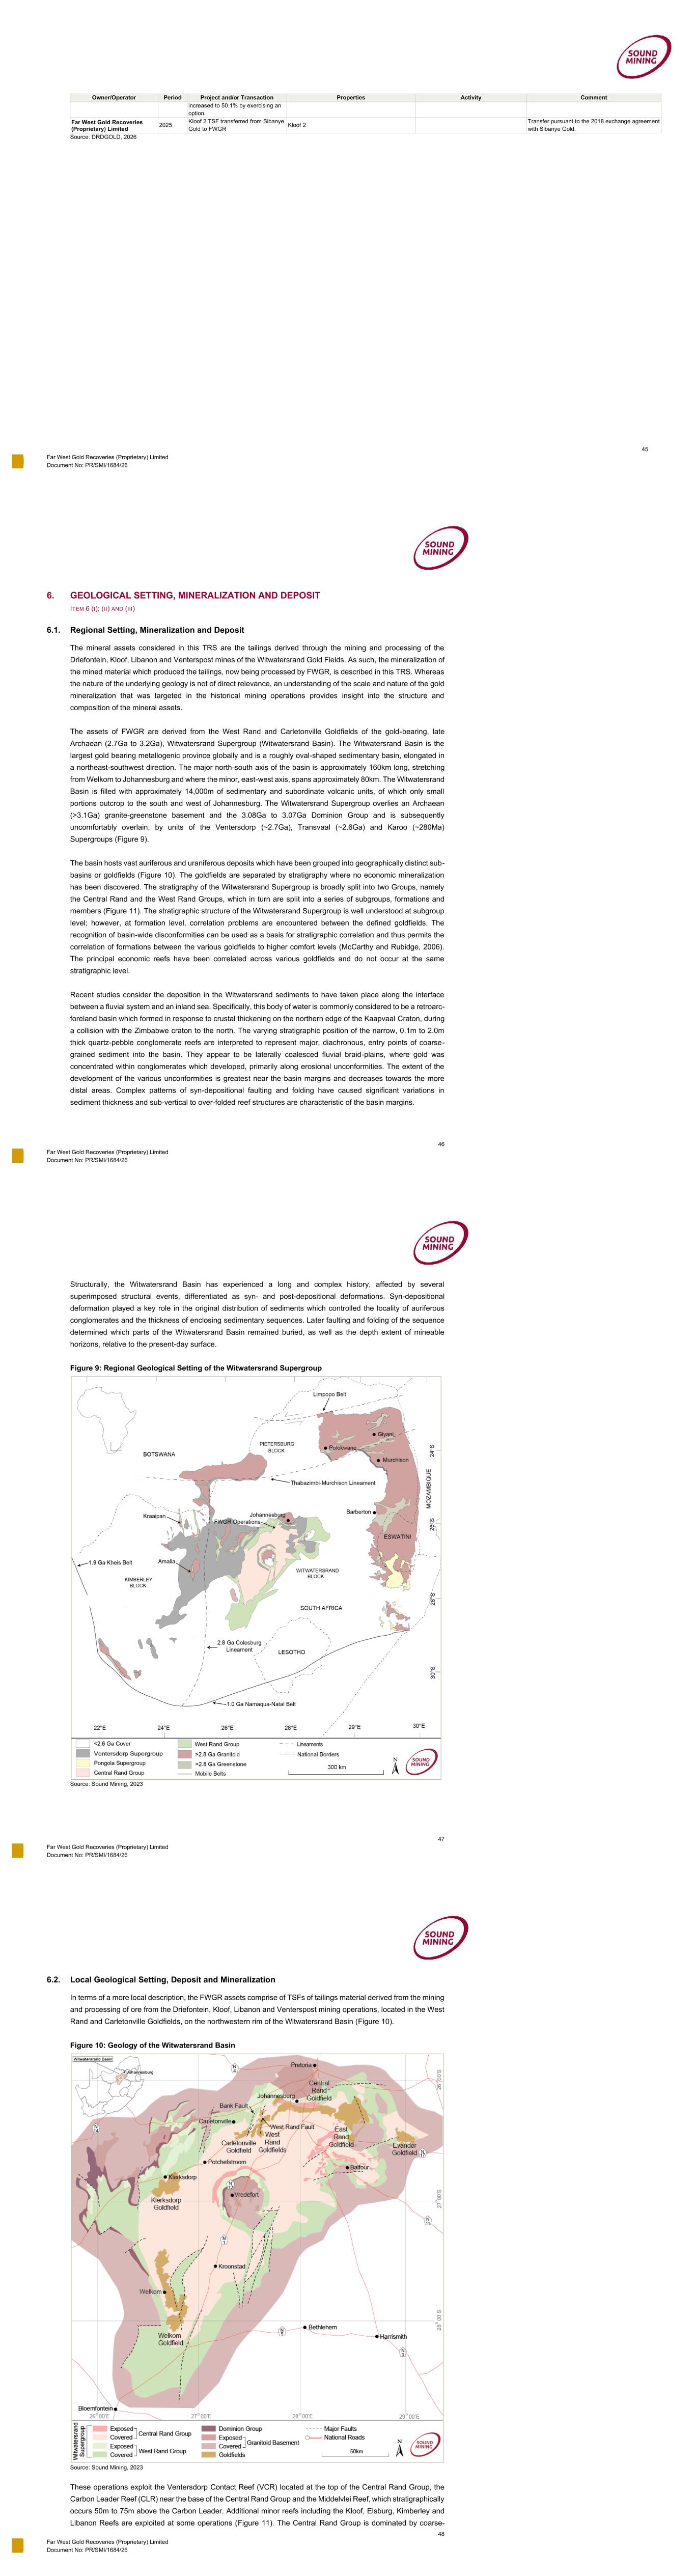
45 Far West Gold Recoveries (Proprietary) Limited Document No: PR/SMI/1684/26 Owner/Operator Period Project and/or Transaction Properties Activity Comment increased to 50.1% by exercising an option. Far West Gold Recoveries (Proprietary) Limited 2025 Kloof 2 TSF transferred from Sibanye Gold to FWGR Kloof 2 Transfer pursuant to the 2018 exchange agreement with Sibanye Gold. Source: DRDGOLD, 2026 46 Far West Gold Recoveries (Proprietary) Limited Document No: PR/SMI/1684/26 6. GEOLOGICAL SETTING, MINERALIZATION AND DEPOSIT ITEM 6 (I); (II) AND (III) 6.1. Regional Setting, Mineralization and Deposit The mineral assets considered in this TRS are the tailings derived through the mining and processing of the Driefontein, Kloof, Libanon and Venterspost mines of the Witwatersrand Gold Fields. As such, the mineralization of the mined material which produced the tailings, now being processed by FWGR, is described in this TRS. Whereas the nature of the underlying geology is not of direct relevance, an understanding of the scale and nature of the gold mineralization that was targeted in the historical mining operations provides insight into the structure and composition of the mineral assets. The assets of FWGR are derived from the West Rand and Carletonville Goldfields of the gold-bearing, late Archaean (2.7Ga to 3.2Ga), Witwatersrand Supergroup (Witwatersrand Basin). The Witwatersrand Basin is the largest gold bearing metallogenic province globally and is a roughly oval-shaped sedimentary basin, elongated in a northeast-southwest direction. The major north-south axis of the basin is approximately 160km long, stretching from Welkom to Johannesburg and where the minor, east-west axis, spans approximately 80km. The Witwatersrand Basin is filled with approximately 14,000m of sedimentary and subordinate volcanic units, of which only small portions outcrop to the south and west of Johannesburg. The Witwatersrand Supergroup overlies an Archaean (>3.1Ga) granite-greenstone basement and the 3.08Ga to 3.07Ga Dominion Group and is subsequently uncomfortably overlain, by units of the Ventersdorp (~2.7Ga), Transvaal (~2.6Ga) and Karoo (~280Ma) Supergroups (Figure 9). The basin hosts vast auriferous and uraniferous deposits which have been grouped into geographically distinct sub- basins or goldfields (Figure 10). The goldfields are separated by stratigraphy where no economic mineralization has been discovered. The stratigraphy of the Witwatersrand Supergroup is broadly split into two Groups, namely the Central Rand and the West Rand Groups, which in turn are split into a series of subgroups, formations and members (Figure 11). The stratigraphic structure of the Witwatersrand Supergroup is well understood at subgroup level; however, at formation level, correlation problems are encountered between the defined goldfields. The recognition of basin-wide disconformities can be used as a basis for stratigraphic correlation and thus permits the correlation of formations between the various goldfields to higher comfort levels (McCarthy and Rubidge, 2006). The principal economic reefs have been correlated across various goldfields and do not occur at the same stratigraphic level. Recent studies consider the deposition in the Witwatersrand sediments to have taken place along the interface between a fluvial system and an inland sea. Specifically, this body of water is commonly considered to be a retroarc- foreland basin which formed in response to crustal thickening on the northern edge of the Kaapvaal Craton, during a collision with the Zimbabwe craton to the north. The varying stratigraphic position of the narrow, 0.1m to 2.0m thick quartz-pebble conglomerate reefs are interpreted to represent major, diachronous, entry points of coarse- grained sediment into the basin. They appear to be laterally coalesced fluvial braid-plains, where gold was concentrated within conglomerates which developed, primarily along erosional unconformities. The extent of the development of the various unconformities is greatest near the basin margins and decreases towards the more distal areas. Complex patterns of syn-depositional faulting and folding have caused significant variations in sediment thickness and sub-vertical to over-folded reef structures are characteristic of the basin margins. 47 Far West Gold Recoveries (Proprietary) Limited Document No: PR/SMI/1684/26 Structurally, the Witwatersrand Basin has experienced a long and complex history, affected by several superimposed structural events, differentiated as syn- and post-depositional deformations. Syn-depositional deformation played a key role in the original distribution of sediments which controlled the locality of auriferous conglomerates and the thickness of enclosing sedimentary sequences. Later faulting and folding of the sequence determined which parts of the Witwatersrand Basin remained buried, as well as the depth extent of mineable horizons, relative to the present-day surface. Figure 9: Regional Geological Setting of the Witwatersrand Supergroup Source: Sound Mining, 2023 48 Far West Gold Recoveries (Proprietary) Limited Document No: PR/SMI/1684/26 6.2. Local Geological Setting, Deposit and Mineralization In terms of a more local description, the FWGR assets comprise of TSFs of tailings material derived from the mining and processing of ore from the Driefontein, Kloof, Libanon and Venterspost mining operations, located in the West Rand and Carletonville Goldfields, on the northwestern rim of the Witwatersrand Basin (Figure 10). Figure 10: Geology of the Witwatersrand Basin Source: Sound Mining, 2023 These operations exploit the Ventersdorp Contact Reef (VCR) located at the top of the Central Rand Group, the Carbon Leader Reef (CLR) near the base of the Central Rand Group and the Middelvlei Reef, which stratigraphically occurs 50m to 75m above the Carbon Leader. Additional minor reefs including the Kloof, Elsburg, Kimberley and Libanon Reefs are exploited at some operations (Figure 11). The Central Rand Group is dominated by coarse-
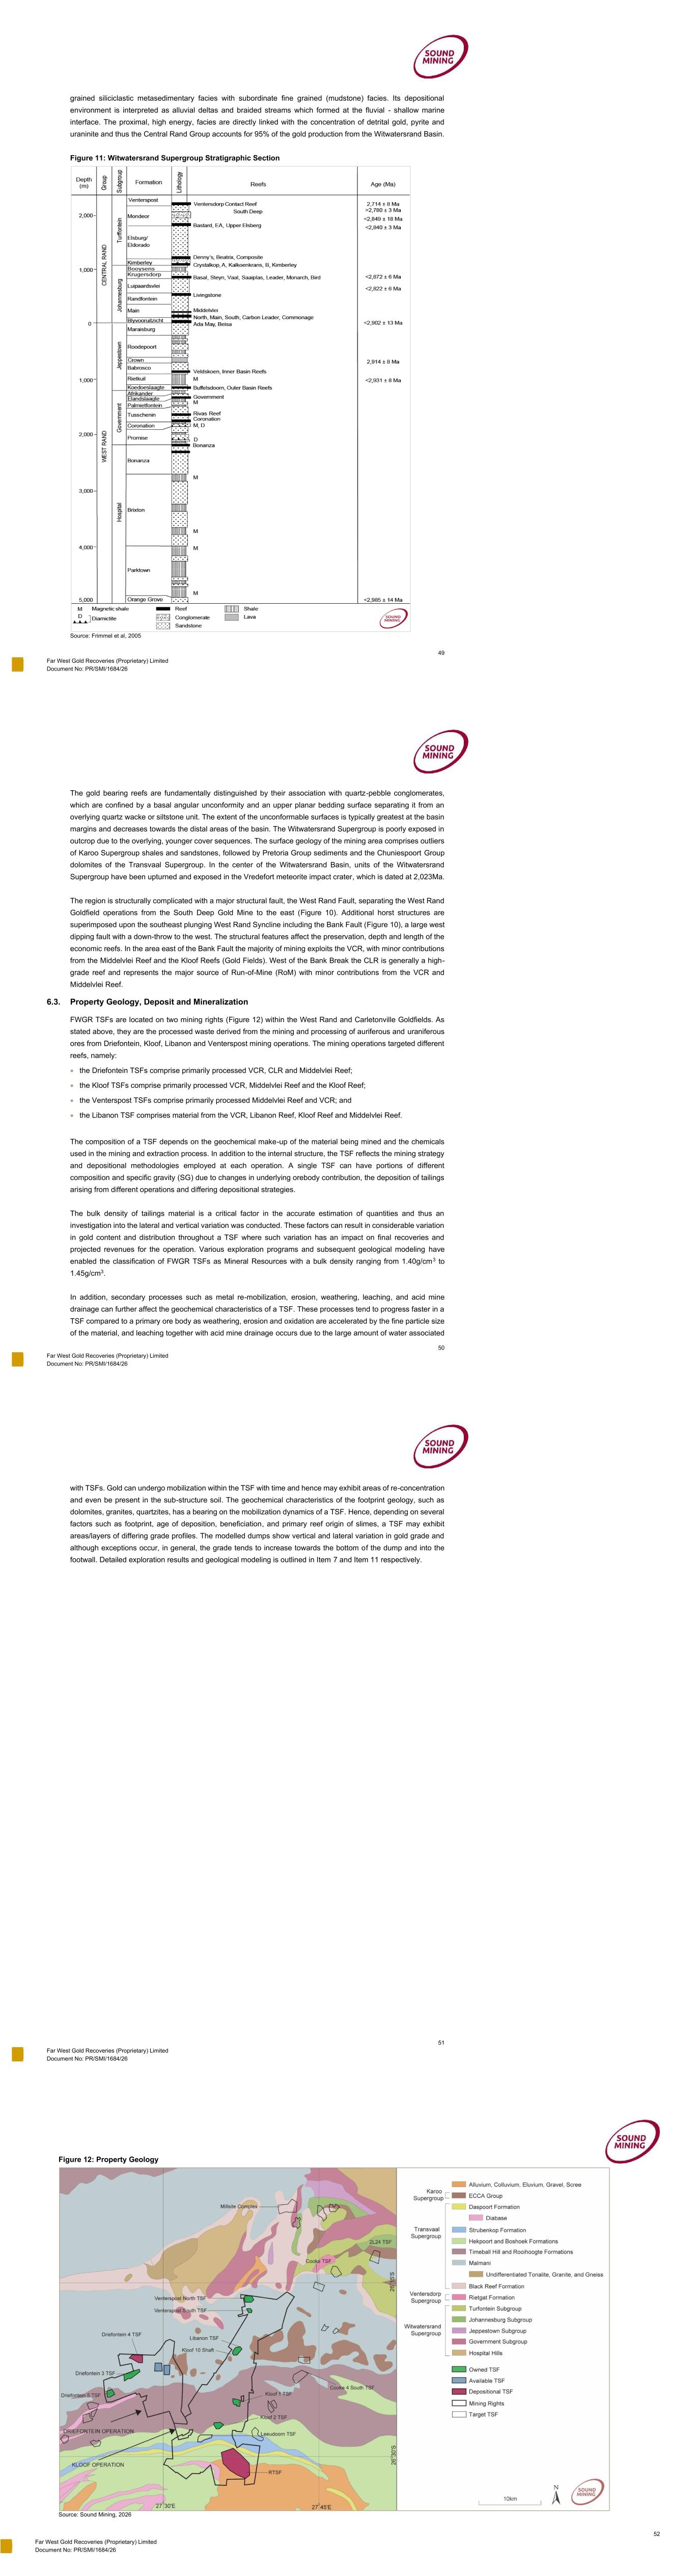
49 Far West Gold Recoveries (Proprietary) Limited Document No: PR/SMI/1684/26 grained siliciclastic metasedimentary facies with subordinate fine grained (mudstone) facies. Its depositional environment is interpreted as alluvial deltas and braided streams which formed at the fluvial - shallow marine interface. The proximal, high energy, facies are directly linked with the concentration of detrital gold, pyrite and uraninite and thus the Central Rand Group accounts for 95% of the gold production from the Witwatersrand Basin. Figure 11: Witwatersrand Supergroup Stratigraphic Section Source: Frimmel et al, 2005 50 Far West Gold Recoveries (Proprietary) Limited Document No: PR/SMI/1684/26 The gold bearing reefs are fundamentally distinguished by their association with quartz-pebble conglomerates, which are confined by a basal angular unconformity and an upper planar bedding surface separating it from an overlying quartz wacke or siltstone unit. The extent of the unconformable surfaces is typically greatest at the basin margins and decreases towards the distal areas of the basin. The Witwatersrand Supergroup is poorly exposed in outcrop due to the overlying, younger cover sequences. The surface geology of the mining area comprises outliers of Karoo Supergroup shales and sandstones, followed by Pretoria Group sediments and the Chuniespoort Group dolomites of the Transvaal Supergroup. In the center of the Witwatersrand Basin, units of the Witwatersrand Supergroup have been upturned and exposed in the Vredefort meteorite impact crater, which is dated at 2,023Ma. The region is structurally complicated with a major structural fault, the West Rand Fault, separating the West Rand Goldfield operations from the South Deep Gold Mine to the east (Figure 10). Additional horst structures are superimposed upon the southeast plunging West Rand Syncline including the Bank Fault (Figure 10), a large west dipping fault with a down-throw to the west. The structural features affect the preservation, depth and length of the economic reefs. In the area east of the Bank Fault the majority of mining exploits the VCR, with minor contributions from the Middelvlei Reef and the Kloof Reefs (Gold Fields). West of the Bank Break the CLR is generally a high- grade reef and represents the major source of Run-of-Mine (RoM) with minor contributions from the VCR and Middelvlei Reef. 6.3. Property Geology, Deposit and Mineralization FWGR TSFs are located on two mining rights (Figure 12) within the West Rand and Carletonville Goldfields. As stated above, they are the processed waste derived from the mining and processing of auriferous and uraniferous ores from Driefontein, Kloof, Libanon and Venterspost mining operations. The mining operations targeted different reefs, namely: • the Driefontein TSFs comprise primarily processed VCR, CLR and Middelvlei Reef; • the Kloof TSFs comprise primarily processed VCR, Middelvlei Reef and the Kloof Reef; • the Venterspost TSFs comprise primarily processed Middelvlei Reef and VCR; and • the Libanon TSF comprises material from the VCR, Libanon Reef, Kloof Reef and Middelvlei Reef. The composition of a TSF depends on the geochemical make-up of the material being mined and the chemicals used in the mining and extraction process. In addition to the internal structure, the TSF reflects the mining strategy and depositional methodologies employed at each operation. A single TSF can have portions of different composition and specific gravity (SG) due to changes in underlying orebody contribution, the deposition of tailings arising from different operations and differing depositional strategies. The bulk density of tailings material is a critical factor in the accurate estimation of quantities and thus an investigation into the lateral and vertical variation was conducted. These factors can result in considerable variation in gold content and distribution throughout a TSF where such variation has an impact on final recoveries and projected revenues for the operation. Various exploration programs and subsequent geological modeling have enabled the classification of FWGR TSFs as Mineral Resources with a bulk density ranging from 1.40g/cm3 to 1.45g/cm3. In addition, secondary processes such as metal re-mobilization, erosion, weathering, leaching, and acid mine drainage can further affect the geochemical characteristics of a TSF. These processes tend to progress faster in a TSF compared to a primary ore body as weathering, erosion and oxidation are accelerated by the fine particle size of the material, and leaching together with acid mine drainage occurs due to the large amount of water associated 51 Far West Gold Recoveries (Proprietary) Limited Document No: PR/SMI/1684/26 with TSFs. Gold can undergo mobilization within the TSF with time and hence may exhibit areas of re-concentration and even be present in the sub-structure soil. The geochemical characteristics of the footprint geology, such as dolomites, granites, quartzites, has a bearing on the mobilization dynamics of a TSF. Hence, depending on several factors such as footprint, age of deposition, beneficiation, and primary reef origin of slimes, a TSF may exhibit areas/layers of differing grade profiles. The modelled dumps show vertical and lateral variation in gold grade and although exceptions occur, in general, the grade tends to increase towards the bottom of the dump and into the footwall. Detailed exploration results and geological modeling is outlined in Item 7 and Item 11 respectively. 52 Far West Gold Recoveries (Proprietary) Limited Document No: PR/SMI/1684/26 Figure 12: Property Geology Source: Sound Mining, 2026

53 Far West Gold Recoveries (Proprietary) Limited Proposal No: PR/SMI/1685/26 7. EXPLORATION ITEM 7 (I); (II); (III); (IV); (V) AND (VI) 7.1. Methods and Databases The extent, morphology and structure of the TSFs is relatively simple when compared to conventional mineral deposits. Consequently, the exploration programs are also simple and straightforward. Exploration of the FWGR’s assets comprised: • auger drilling programs to permit sampling for gold content and mapping of the gold distribution undertaken in drilling campaigns by Gold Fields in 2007, 2008 and 2009 for the Driefontein, Kloof, Libanon and Venterspost TSFs; • auger drilling at the Driefontein 3 TSF to improve confidence in the distribution of gold grades within the TSF in 2026; • an auger drilling campaign was undertaken in 2009 on the lower portion of the Kloof 2 TSF. In 2026 an air-core drilling program was completed on Kloof 2 TSF to permit sampling for gold content and mapping of the gold distribution; • surveying of the borehole collars undertaken by Gold Fields in-house surveyors to determine physical dimensions and volumes verified independently by Light Detection and Ranging (LIDAR) consultants for the 2007, 2008 and 2009 drilling programs; and • surveying of the borehole collars and TSF surfaces for Driefontein 3 and Kloof 2 was independently undertaken by Geographix Surveys. The exploration data was captured in the form of Microsoft Excel files as well as the appropriate Datamine and Micromine software files. All data is independently stored by the QP’s on a secure cloud-based platform. A copy is made available to FWGR for internal use. 7.2. Geophysical Characterization No geophysical investigation of the TSFs has been undertaken as part of the exploration programs. 7.3. Geo-hydrological Characterization A geohydrological investigation of the TSFs did not form part of the exploration programs. It is not required for the determination and classification of FWGR’s Mineral Resources. The handling of surface water is described in the mining and processing Items (Item 13 and Item 14). 7.4. Geotechnical Characterization A geotechnical investigation of the TSFs did not form part of the exploration programs. It is not required for hydro-mining of the unconsolidated tailings material. The slope angles and bench widths do not pose a risk to the mine design (Item 13.1). Geotechnical assessments were performed for the design of the RTSF. The auger and air core drilling methods performed during exploration do not allow for the orientation of samples. Geotechnical characterization is not applicable to the determination and classification of FWGR’s Mineral Resources. 7.5. Surveying A detailed helicopter-based LIDAR survey was undertaken by Gold Fields in late 2008. The survey was conducted by Southern Mapping Company (Proprietary) Limited and the total area surveyed was approximately 44,000ha. The aerial survey was conducted using an aircraft mounted LIDAR system which scanned the ground below with a 70kHz laser. Digital color images were also gathered to produce color orthophotos. The survey was conducted at a height of 1,100m above datum with an image pixel size of 15cm. The vertical accuracy was 10cm and the horizontal accuracy was 20cm. The survey was calculated in Hartebeesthoek94, LO27 projection with ellipsoidal heights. The data was supplied to Gold 54 Far West Gold Recoveries (Proprietary) Limited Document No: PR/SMI/1684/26 Fields in CAPE LO27 with orthometric heights. The LIDAR survey provided surface data from which three-dimensional (3D) models of the TSFs were constructed. The Driefontein 5 TSF and Driefontein 3 TSFs were surveyed in 2004 and 2006 respectively by Gold Fields, using differential Global Positioning System (GPS) methodology. In all instances it was found that the vertical positioning of the drillhole collars were offset from the surface of the TSFs as determined from the LIDAR survey. The offset ranges from approximately 0.5m to several meters. It was assumed that the LIDAR survey was the more accurate of the two surveys and the drillhole positions were moved to intersect the top of the TSF wireframes. Recent surface surveys of the Kloof 2 TSF as well as ongoing production surveys are independently undertaken by Geographix Surveys on the Driefontein 5 and Driefontein 3 TSF’s. These surveys are undertaken using a GNSS Real Time Kinetic (RTK) approach. This data was processed to generate a high-resolution digital terrain model (DTM) and contour maps, of each TSF. The resulting topographic surface was used for volumetric calculations, reconciliations, and mine planning activities. 7.6. Drilling Historical and recent exploration programs have contributed to the current exploration database and Mineral Resource estimates. The exploration campaigns comprise: Historical programs: • a Mineral Resource estimate (Minxcon, 2008); and • Gold Fields (2007) undertook an initial drilling campaign on Driefontein 3 TSF and Driefontein 5 TSF. The Mineral Resources were reported in Minxcon (Proprietary) Limited (Minxcon) report R2008-14 (2008). The drilling continued in 2008 to cover 13 TSFs in the Kloof, Driefontein, and Venterspost areas. Recent Programs: • FWGR (April 2026) undertook an auger drilling program at the Driefontein 3 TSF; and • FWGR (May 2026) undertook an air-core drilling program at the Kloof 2 TSF. The historical drilling was completed on either a 100m × 100m or 200m × 200m grid using vertical auger drillholes, generally to depths of less than 70m. The recent program comprised an air-core drilling campaign at the Kloof 2 TSF over a 150m diagonal spacing and 200m horizontal spacing, with drillholes generally less than 50m deep. An auger drilling campaign at the Driefontein 3 TSF on a 150m × 150m grid with drillholes generally less than 25m deep. Owing to the shallow nature of the drilling, downhole surveys were considered unnecessary for all campaigns. The drilling density and sample spacing were considered sufficient to establish geological and grade continuity. Historical drilling was undertaken using portable hydraulic auger drill rigs fitted with a rotating spiral auger enclosed within a stainless-steel core barrel. The recent Kloof 2 program utilized an air-core drill rig with a dual-tube rod system to improve sample recovery and minimize contamination, while the Driefontein 3 program employed the same auger drilling methodology as the historical campaigns. Drilling was predominantly undertaken dry, with limited water used during the Kloof 2 air-core program where necessary to clear clay blockages. As the TSFs are essentially horizontally layered deposits, sample orientation was not considered relevant. Samples from all programs were logged, described and assayed using procedures considered appropriate for Mineral Resource estimation. Historical drilling was completed by Dump and Dune Drillers (Pty) Ltd and Gold Mine Sands and Slime Dam Drillers (Pty) Ltd, while the recent campaigns were completed by Torque Africa Group (Kloof 2 TSF) and Muloko 55 Far West Gold Recoveries (Proprietary) Limited Document No: PR/SMI/1684/26 Group (Driefontein 3 TSF). All contractors have demonstrated experience in drilling TSF’s and comply with industry standards. Recognizing that auger and air-core drilling within unconsolidated tailings is inherently susceptible to sample contamination, all programs were supervised by qualified geologists and undertaken in accordance with industry-standard procedures. The historical drilling methodologies were independently audited by SRK in 2008 for the Driefontein 3 TSF, Driefontein 5 TSF, Kloof 1 TSF, Libanon TSF, Venterspost North TSF and Venterspost South TSF. The 2026 drilling programs were observed by Sound Mining personnel, who confirmed that drilling and sampling were completed in accordance with industry best practice and are suitable for Mineral Resource estimation. Drilling logs were maintained for the historical campaigns, although sample photographs were not retained, which is considered appropriate given the drilling methodology employed. Overall, the historical and recent drilling programs were conducted to industry standards and provide a suitable basis for Mineral Resource estimation. The locations of the drillhole collars are shown in Figure 13 to Figure 19 and comprise 1,146 drillholes totaling approximately 74km of drilling. 7.7. Exploration Budget Numerous historical and recent exploration activities now contribute to the FWGR’s overall exploration database and it is anticipated that FWGR will continue to conduct exploration activities which are necessary to keep ahead of recoveries and to update knowledge of the content within the TSFs. Provisions for future exploration are included in the DCF model. 56 Far West Gold Recoveries (Proprietary) Limited Document No: PR/SMI/1684/26 8. SAMPLE PREPARATION, ANALYSIS AND SECURITY ITEM 8 (I); (II); (III); (IV) AND (V) 8.1. Sampling Method Auger Drilling: the auger drill comprises a rotating spiral auger drill bit encased in a stainless-steel core barrel. The core barrel comprises a 50mm drill rod and inner spiral, with the inner spiral rotating in the opposite direction to the outer casing as the tailings material is penetrated. The extension rods and spiral augers have three lengths; namely 1.5m, 3.0m and 4.5m. The typical drilling cycle comprised the following sequence, repeated until the floor of the TSF was intersected: • an initial sample was drilled with a 1.5m spiral auger/sample tube, after which the first sample was extracted; • the subsequent sample was drilled with a 3.0m auger/sample tube and the 1.5m sample extracted; • thereafter, a 4.5m spiral auger/sample tube was used and the sample extracted; and • the succeeding samples were extracted from the 4.5m spiral auger plus a 1.5m extension rod, followed by a 3.0m extension rod and then a 4.5m drill rod. The first two samples were extracted directly into new sample bags by using the drill rig to reverse the rotation of the spiral within the 1.5m and 3.0m auger/sample tubes. The sample bag was placed over the end of the tube to collect the sample following which the spiral auger and interior of the barrel were cleaned by using a cloth and a steel brush to remove the tailings material. Subsequent samples were extracted by removing the spiral auger and the sample collected in a rubber trough. The first 10cm to 15cm of the sample were discarded as they would be the most likely to have contamination and the remainder of the sample was transferred into the bag at the end of the rubber trough. The sample bag was then closed, placed in sequence and the tickets added. The sample at the floor of the TSF is collected into two separate bags containing the soil/footprint sample and the lowermost tailings sample. The entire sample was collected and consequently the full length of the TSF was sampled, ensuring representivity. No relationship exists between sample recovery and grade as the material is fine grained and the entire sample was collected so no preferential loss of fines is anticipated. Each resulting sample weighed between 2kg and 4kg and is considered suitable for the fine grain size of the tailings. No selective sampling was undertaken. The drilling sites were visited by independent consultants who concluded the sampling and management of samples by the drillers was of a high quality, well controlled and from the evaluation of the quality control data, the number of errors made by the drillers was very small. The samples were not geologically nor geotechnically logged as these criteria cannot be obtained from an auger sample. Air-Core Drilling: the air-core drill comprises a rotating three-bladed steel or tungsten drill bit attached to a dual-tube drill rod system. The drill rods consist of an outer barrel and an inner tube, through which compressed air is circulated. High- pressure air is injected down the annulus between the outer rod and inner tube, where it reaches the drill bit and facilitates cutting of the formation. The resulting tailings material is transported to surface via the inner tube, minimizing contamination and preserving sample integrity. The air-core drill string is advanced using sequential rod additions with a standard length of 3m.

57 Far West Gold Recoveries (Proprietary) Limited Document No: PR/SMI/1684/26 The typical drilling cycle comprised the following sequence, repeated until the floor of the TSF was intersected: • an initial 1.5m sample interval was drilled, after which the sample was recovered via the cyclone; • thereafter, the drill string was advanced in 3m rod increments, with samples collected at 1.5m intervals for each half- rod advance; and • this sequence was repeated, with continuous rod additions and sample recovery at 1.5m intervals, until the target depth was reached. Samples were recovered at surface via the cyclone and splitter system directly into new sample bags. For each 1.5m interval, the primary sample was collected from the splitter chute, ensuring that a representative portion of the returned tailings material was retained. Following each sample collection, the cyclone and splitter were routinely inspected and cleaned, using compressed air and manual tools where necessary, to minimize the risk of cross-contamination between successive samples. All samples were collected sequentially, with the sample bags securely closed after collection and placed in order, with corresponding sample tickets inserted to maintain chain of custody. The entire sample stream recovered from each interval was considered representative of the drilled material, with no selective sampling undertaken. The continuous nature of air- core sample return ensures that all tailings material transported to surface is included in the sample. Each resulting sample weighed between 3kg and 7kg and is considered suitable. The drilling sites were visited by the QP who concluded that the sampling and management of samples by the drillers was of a high quality, well controlled. The samples were not geologically nor geotechnically logged as these criteria cannot be obtained from an air core sample. 8.2. Sample Security The database used for the Mineral Resource estimation was thoroughly reviewed and found to be reliable. 8.3. Analytical Laboratories Five independent laboratories have been used for sample analysis, namely SGS, Set Point Laboratories (Set Point), ALS Chemex South Africa (Proprietary) Limited (ALS), Performance Laboratories (Proprietary) Limited (Performance Laboratories) and MAED Metallurgical Laboratories (MAED). All except for Performance Laboratories and MAED, are accredited by the South African National Accreditation System (SANAS) for gold assay. Set Point, ALS and MAED were independently inspected and found to follow best practice principles of quality management. They have procedures of chemical analysis and assay that meet the requirements for code compliance. They use sample preparation equipment that complies with international accepted practices and laboratory information management systems with sample tracking. Quality management systems exist with quality checks throughout the entire assay and analytical process. 8.4. Analytical Procedures Gold analysis was undertaken using standard fire assay methodology with gravimetric finish which is considered entirely appropriate for the sample type. The laboratory sample preparation was standard and includes drying, pulverizing with a disc pulverizer and manual homogenization. The final sample size submitted for assay was 500g and the likelihood of the samples being non- representative is low. 58 Far West Gold Recoveries (Proprietary) Limited Document No: PR/SMI/1684/26 8.5. Bulk Density In general, the conversion from volume to quantity in the case of mineral deposits is undertaken by the application of a density or the SG) determined experimentally on dry samples. Density is the mass per unit volume e.g., t/m3, whilst SG is the ratio of the density of a substance to the density of a reference substance (usually water); and is a unitless ratio of the mass of a substance to the mass of a reference substance for the same given volume. Wet density measurements can be undertaken for samples with moisture content. Bulk density, however is defined as the dry weight of a material per unit volume of that material. Bulk density considers both the solids and the pore space; whereas, density and SG consider only the solids. The density throughout the various TSFs will vary marginally depending on the original reefs mined. An average density of 1.42t/m3 is used because of data available to FWGR from the current operations and from recent test work performed by the RVN Group (Proprietary) Limited. This compares favorably with the average densities reported by other companies in the business of retreating Witwatersrand tailings (Table 3). Table 3: Dry Densities used by Other Re-treatment Companies for the Witwatersrand Operations Company TSF Dry Density (t/m3) Rand Uranium West Rand Operations 1.45 Anglo Gold Ashanti Vaal River Operations 1.45 Ergo Mining (Proprietary) Limited Elsburg Tailings Complex 1.42 Mintails SA West Rand Projects 1.40 Source: Sound Mining, 2023 The QP has therefore assumed a consistent density of 1.42t/m3 for the Mineral Resource estimate as at June 30, 2026. The use of a dry density in the estimation of an in situ Mineral Resource is standard best practice, and the dry density value has been applied to the Mineral Resource estimate. 8.6. Concluding Comments The QP considers the sampling method and preparation adequate for this type of mineralization. Sample security is considered adequate and the resulting database reliable. Standard analytical processes were used for sample grade determination with Quality Assurance and Quality Control (QA/QC) (Item 9) providing confidence in the results. 59 Far West Gold Recoveries (Proprietary) Limited Document No: PR/SMI/1684/26 9. DATA VERIFICATION ITEM 9 (I); (II) AND (III) 9.1. Quality Assurance and Quality Control The internal laboratory standards and blanks were inserted in every batch. Internal standards with a blind standard were used on all instruments. The laboratories undertake regular evaluation of overall performance by statistical evaluation of all QC data. The laboratory internal checking processes were independently checked and found to be standard and reliable. Several checks were undertaken on the importation of data into the Mineral Resource estimation software with no issues highlighted. Laboratory reports suggest that blanks and Certified Reference Materials (CRM) were included for every 100 samples. The CRMs submitted for the historical sampling were African Mineral Standards (AMIS) AMS0046 at 0.67g/t Au; AMIS AMS0080 at 1.14g/t Au and accredited blank AMIS AMS0069 <0.002g/t Au, while the CRMs submitted for the recent sampling were AMIS0644 at 0.151g/t Au; AMIS0805 at 0.347g/t Au and accredited blank AMIS0939 <0.002g/t Au. The spread of gold grades in the CRM is appropriate and the review of the quality control and quality assurance data concluded that 13.7% of the total population of samples (13,000 samples) were outside of the two standard deviation limits allowed and were re-analyzed. 9.2. Independent Verification The TSFs exploration programs were conducted during 2007 to 2009 with independent oversight and review provided by Minxcon, with auditing of the results by SRK Consulting (Proprietary) Limited. The overall conclusions for each drilling campaign suggests that the drilling and sampling programs were conducted to industry standards and are acceptable for a Mineral Resource estimate. The TSF volumes were independently verified by Southern Mapping Company Limited. Sound Mining has since completed an independent review of the available information and a verification of the data used for the LoM plan to exploit FWGR’s assets. This involved integrity checks on the capturing of data and interviews with the specialists involved in the original exploration programs. The 2026 exploration program was conducted under independent oversight by Sound Mining, who reviewed and monitored the drilling, sampling and data collection procedures, and confirmed that the program was carried out in accordance with industry standards and is acceptable for a Mineral Resource Estimate. Moreover, the 2026 exploration work and Mineral Resource estimate was the subject of third-party audits. The QP is satisfied with the accuracy and integrity of the data underpinning the Mineral Resource estimate. The QP is further comforted by the fact that mining of the Driefontein 5 TSF (December 2018 to current), and the Driefontein 3 TSF (June 2023 to current) has reconciled well confirming both the volume and grade estimates of the TSF. It should also be noted that the type and style of mineralization of the original reefs exploited during the establishment of the TSF assets are not relevant to the Mineral Resource estimate. 60 Far West Gold Recoveries (Proprietary) Limited Document No: PR/SMI/1684/26 10. MINERAL PROCESSING AND METALLURGICAL TESTING ITEM 10 (I); (II); (III); (IV) AND (V) 10.1. Metallurgical Test Work Metallurgical test work described here under relates to understanding the recoveries to be expected for each TSF reclaimed. The metallurgical characterization of the TSFs (i.e., Driefontein 3 TSF, Driefontein 5 TSF, Libanon TSF, Kloof 1 TSF, Kloof 2 TSF, Venterspost North TSF and Venterspost South TSF) have been informed by the results of numerous studies since 2000, which have ranged from Scoping Study to DFS levels of accuracy. The associated metallurgical test work considered various processing options including direct leach, grinding, ultra-fine grinding and flotation. Three independent laboratories were involved, namely SGS Lakefield (SA), Mintek, and Patterson & Cooke, and all three are accredited by the SANAS for gold assay. They have been independently inspected and are considered acceptable by the QP. They follow conventional best practice principles of quality management and have procedures of chemical analysis and assay that are accepted as fulfilling the requirements of compliancy demanded by modern mining companies. They use sample preparation equipment that complies with international accepted practice. They have installed well-developed laboratory information management systems with sample tracking. They have evolved quality management systems in place with quality checks through the entire assay and analytical process. The diagnostic leach results and gold deportment per size fraction of the TSFs currently being reclaimed are presented in Table 4, Table 5 and Table 6. Table 4: Full Diagnostic Leach Results on Un-milled Feed Samples Diagnostic Results Un-Milled Feed Sample Association Driefontein 3 TSF Driefontein 5 TSF (g/t Au) (% Au) (g/t Au) (% Au) Gold Available to Direct Cyanidation 0.24 54.7 0.22 52.4 Gold that is Preg-robbed Carbon-in-Leach (CIL) 0.02 3.5 0.00 0.0 Gold Associated with HCI Digestible Minerals 0.06 14.9 0.05 11.4 Gold Associated with HNO₃ Digestible Minerals 0.03 6.9 0.04 10.3 Gold Associated with Carbonaceous Matter 0.02 4.1 0.00 0.0 Gold Associated with Quartz (balance) 0.07 16.0 0.11 25.9 Total 0.43 100.0 0.41 100.0 Source: DRDGOLD, 2026 Note: Above recoveries exclude UFR recoveries Table 5: Driefontein 5 TSF Feed Sample Assay by Size Particle Size (µm) Mass (%) Cumulative Mass (% mass) Discrete Grade Au (g/t) Discrete Distribution (%) Cumulative Distribution (%) Au U3O8 S2 Au U3O8 S2 150 5.5 94.5 1.13 15.2 4.1 0.9 100.0 100.0 100.0 106 10.8 83.6 0.62 16.3 4.8 1.9 84.8 95.9 99.1 75 15.1 68.5 0.34 12.4 7.9 6.1 68.6 91.0 97.2 53 10.6 58.0 0.27 6.9 6.3 11.9 56.1 83.2 91.1 38 8.7 49.3 0.32 6.7 6.4 16.1 49.2 76.9 79.2 25 9.0 40.3 0.31 6.8 7.9 17.6 42.5 70.5 63.1 15 22.0 18.3 0.23 12.3 36.9 33.6 35.7 62.6 45.5 -15 18.3 0.53 23.4 25.7 11.9 23.4 25.7 11.9 Total 100.0 100.0 100.0 100.0 Head Grade (calculated) 0.41 Head Grade (measured) 0.41 Variance 0.70% Source: Mintek, 2015

61 Far West Gold Recoveries (Proprietary) Limited Document No: PR/SMI/1684/26 Table 6: Driefontein 3 TSF Feed Sample Assay by Size Particle Size (µm) Mass (%) Cumulative Mass (% mass) Discrete Grade Au (g/t) Discrete Distribution (%) Cumulative Distribution (%) Au U3O8 S2 Au U3O8 S2 150 5.0 95.0 1.48 18.0 5.5 0.08 100.0 100.0 100.0 106 12.9 82.0 0.39 12.2 5.9 1.8 82.0 94.5 99.2 75 17.0 65.0 0.37 15.3 8.9 7.9 69.8 88.6 97.5 53 10.5 54.6 0.34 8.6 6.8 12.6 54.5 79.8 89.5 38 8.4 46.2 0.34 6.9 6.3 16.1 45.9 72.9 76.9 25 7.8 38.4 0.27 5.1 6.1 14.7 38.9 66.7 60.7 15 24.9 13.5 0.29 17.5 40.2 38.8 33.8 60.5 46.1 -15 13.5 0.50 16.3 20.3 7.3 16.3 20.3 7.3 Total 100.0 100.0 100.0 100.0 Head Grade (calculated) 0.41 Head Grade (measured) 0.43 Variance 4.10% Source: Mintek, 2015 The presence of preg-robbers in the tailings material can be ascertained from the above results. Preg-robbing is the phenomenon whereby the gold cyanide complex, Au(CN)2, is removed from solution by the constituents of the ore. The preg-robbing components may be the carbonaceous matter present in the ore, such as wood chips, organic carbon, or other impurities, such as elemental carbon. The actual content of the preg-robbers in the samples seems to vary from 0% up to 10% in certain samples. This pattern is consistent with results from similar operations and is a function of the nature of the material being re-mined. In particular, areas on a TSF which contain organic matter and plants (i.e., side walls, reed beds etc.) will have elevated preg-robbing content. It is therefore an established practice to design a plant with a Carbon-in-Leach (CIL) system and not a Carbon-in- Pulp (CIP) system. The process design does allow for CIL to mitigate the impact of preg-robbers on recovery potential. The recoveries in Table 7 were relied on by the QP to assess economic viability. They are underpinned by the results of the test work performed to date or from actual recoveries recorded at DP2. Table 7: Summary of Process Recovery Potential TSF Process Recovery (%) Driefontein 5 51.9 Driefontein 3 51.5 Kloof 1 50.5 Kloof 2 42.1 Libanon 47.2 Venterspost North 48.9 Venterspost South 57.6 Source: Sound Mining, 2026; and FWGR, 2026 Note: Above recoveries exclude UFR recoveries 10.2. Recovery Optimization FWGR has been successful in liberating gold locked in silicates through additional grinding at DP2 because approximately 30% of the contained gold is found in the coarse fractions (>106µm). Historically the most favorable liberation on Witwatersrand Basin gold bearing ores has been achieved at grind sizes of <75µm. Both the diagnostic leach and assay by size results confirmed the need to mill the coarse fractions in order to improve recovery. 62 Far West Gold Recoveries (Proprietary) Limited Document No: PR/SMI/1684/26 FWGR continuously tests the DP2 CIL tails material to track the plants' performance and to understand where further improvement opportunities may lie. This insight prompted bench-scale test work on the benefit of using the AZTEC UpFlow Reactor (UFR) technology. UFR performance was examined for a range of carbon types and conditions, including virgin carbon, regenerated carbon, and acid-washed regenerated carbon at a baseline concentration of 50g/L. While this test work was limited, it yielded positive albeit variable results. The QP has examined these results and elected to include a preliminary and conservative recovery of 10% on the CIL tail material, to a minimum tail grade of 0.14g/t, for the assessment of economic viability. FWGR have committed capital in the LoM Plan for the inclusion of a UFR circuit, the implementation of which has already started. The decision to proceed followed positive results on the potential of the UFR technology at the Ergo operation. The benefit of including the UFR circuit will require confirmation and accordingly the QP has examined the impact of no benefit through to the assumed benefit by means of a sensitivity analysis in Item 19 of this report. Metallurgical recoveries reported elsewhere in this report exclude UFR recoveries unless explicitly stated otherwise. 10.3. Concluding Comments The recoveries used in support of the Mineral Resource and Mineral Reserve estimates are considered to be reasonable inclusive of the 10% benefit assumed from the inclusion of the UFR technology. The sensitivity analysis confirms that the Mineral Reserve estimate remains the same should UFR technology return no benefit. Bench-scale test work campaigns will need to be conducted for each TSF. Actual recoveries from the processing of the Driefontein 5 TSF material provided the QP with further confidence in that they exceeded the initial estimate for the Driefontein 5 TSF from test work, by 6%. 63 Far West Gold Recoveries (Proprietary) Limited Document No: PR/SMI/1684/26 11. MINERAL RESOURCE ESTIMATES ITEM 11 (I); (II); (III); (IV); (V); (VI) AND (VII) The Mineral Resource estimate is reported as at June 30, 2026, and includes the addition of the Kloof 2 TSF as well as the incorporation of additional exploration drilling on the Driefontein 3 TSF. Sound Mining independently updated Mineral Resource database, geological models, estimation methodology and classification criteria. Sound Mining is satisfied that the Mineral Resource estimates are based on a suitable database of reliable information and that no material issues were identified that would materially affect the overall estimates. The bulk density of 1.42t/m³, remains appropriate and has been used for the 2026 Mineral Resource estimates. Geological losses are not applied because the entire volume of a TSF will be processed once included into FWGR’s Mineral Resource base for future exploitation. 11.1. Geological Models and Interpretation TSFs constructed from the tailings of Witwatersrand gold mining operations have been successfully and economically exploited for decades and the geotechnical and geometallurgical characteristics are well understood from experience and test work on the FWGR assets themselves. Apart from the potential risks identified in Item 12.1, no factors of a geotechnical or geometallurgical nature have been identified that would have a significant effect on the prospects for eventual economic extraction. The exploration database has been demonstrated to comprise analytical data obtained from reliable laboratory assays on samples obtained from sampling and drilling programs based on industry best practice. The drillhole grid spacing is comparatively close for typical TSF drilling programs, and the entire depth of each TSF was sampled. The data density is therefore considered sufficient to assure continuity of mineralization and structure and provides an adequate basis for estimation. The exploration database was historically imported into DataMineTM Studio 3, Datamine Studio UG, Datamine Studio NPVS, Datamine Studio OP and Micromine Origin software. The 2026 modeling work was undertaken using Micromine Origin software and data validation was completed to ensure the integrity and validity of the imported data. The samples for Driefontein 3 TSF and Driefontein 5 TSFs represent 3.0m composite samples while the samples from the Kloof 1, Kloof 2, Libanon, Venterspost North, and Venterspost South TSFs were 1.5m in length. The end of the drillhole sample, where it contained footwall material, was separated into tailings and footwall material and treated separately by the laboratory. Three-dimensional wireframes were constructed from surveyed data and drillhole information. The topographic wireframe surfaces for the Driefontein 3, Driefontein 5, Kloof 1, Kloof 2, Libanon, Venterspost North and South TSFs were constructed from the survey data. The TSF base/footwall wireframe was constructed from the soil intercept depths from the drillhole data and the footprint perimeter. The wireframes comprised simple 3D representations of the volume of the TSFs and as such are not open to alternative interpretations. 11.2. Estimation Methodology Ordinary Kriging was undertaken for the gold grade estimation which allows for testing of the accuracy and efficiency of the estimation. Due to the construction of the TSFs and potential gold remobilization, a spatial grade distribution was anticipated and since Kriging is based on modeling the spatial variances within an orebody, this method was considered the most reliable and accurate. 64 Far West Gold Recoveries (Proprietary) Limited Document No: PR/SMI/1684/26 The capping of anomalously high-grade values was applied to Driefontein 3 TSF, Driefontein 5 TSF and Kloof 1 TSF These capping values were determined from the probability plots generated for each TSF. Capping in the variography stage of the estimation limits the excessive variances of the anomalously high grade from skewing the distribution away from the representative variance of the data distribution. Capping in the Kriging stage limits the zone of influence that the ultrahigh grades have on the estimation of the surrounding areas. This is considered an appropriate method of data handling. The following parameters were applied in the Kriging process: • 50m-by-50m-by-3m block size as derived from 100m-by-100m drillhole spacing and 1.5m sample lengths for Driefontein 5, Driefontein 3, Kloof 1, Kloof 2, Libanon, Venterspost North and South TSFs; • sub-cells employed at a minimum of 10m-by-10m (X and Y) for each TSF; • first search volume (SVOL1): o X and Y at approximately the variogram range; o Z search volume was in general the downhole variogram range equating to a search of 6m. Given the stratified nature of the TSFs an excessive search in the vertical direction could result in smearing of grades vertically; o minimum of 12 samples within the search volume one (SVOL1); and o maximum of 40 samples within the search volume one (SVOL1). • second search volume (SVOL2): o approximately 1.5 times the first search volume; o minimum of four samples within the search volume; and o maximum of 40 samples within the search volume. The spatial relationships of the sample grades were investigated with variograms. Both downhole and planar variograms were calculated and modelled. The aim of the downhole variograms was to determine a nugget value and the applicable vertical range of continuity, whilst the planar variogram used the nugget value determined from the downhole variogram. The anisotropy (the difference, when measured along different axes, in a material's physical or mechanical properties) for gold in each TSF was investigated. The variograms were deemed best represented by omni-directional models and the variogram parameters are shown in Table 9. The vertical (i.e., Z) range of the planar variogram model is replaced by the range determined from the downhole variogram. Where necessary (Driefontein 5 TSF and Kloof 1 TSF) both the downhole and planar variograms were conducted using top-cuts, determined from the probability plots generated for each element for each TSF. 11.3. Mineral Resource Classification The applied Mineral Resource classification is a function of the confidence of the asset tenure and consideration of the entire process from drilling, sampling, geological understanding and geostatistical relationships. FWGR’s legal tenure is secured through the necessary permitting required to access and exploit the moveable assets. The drilling, sampling, analytical processes and governance of the exploration programs have been appropriate and in-line with industry best practice and are considered to be of high confidence. The density used in the conversion from volume to tonnage has been determined from both in situ measured values and empirical data and is considered reliable.
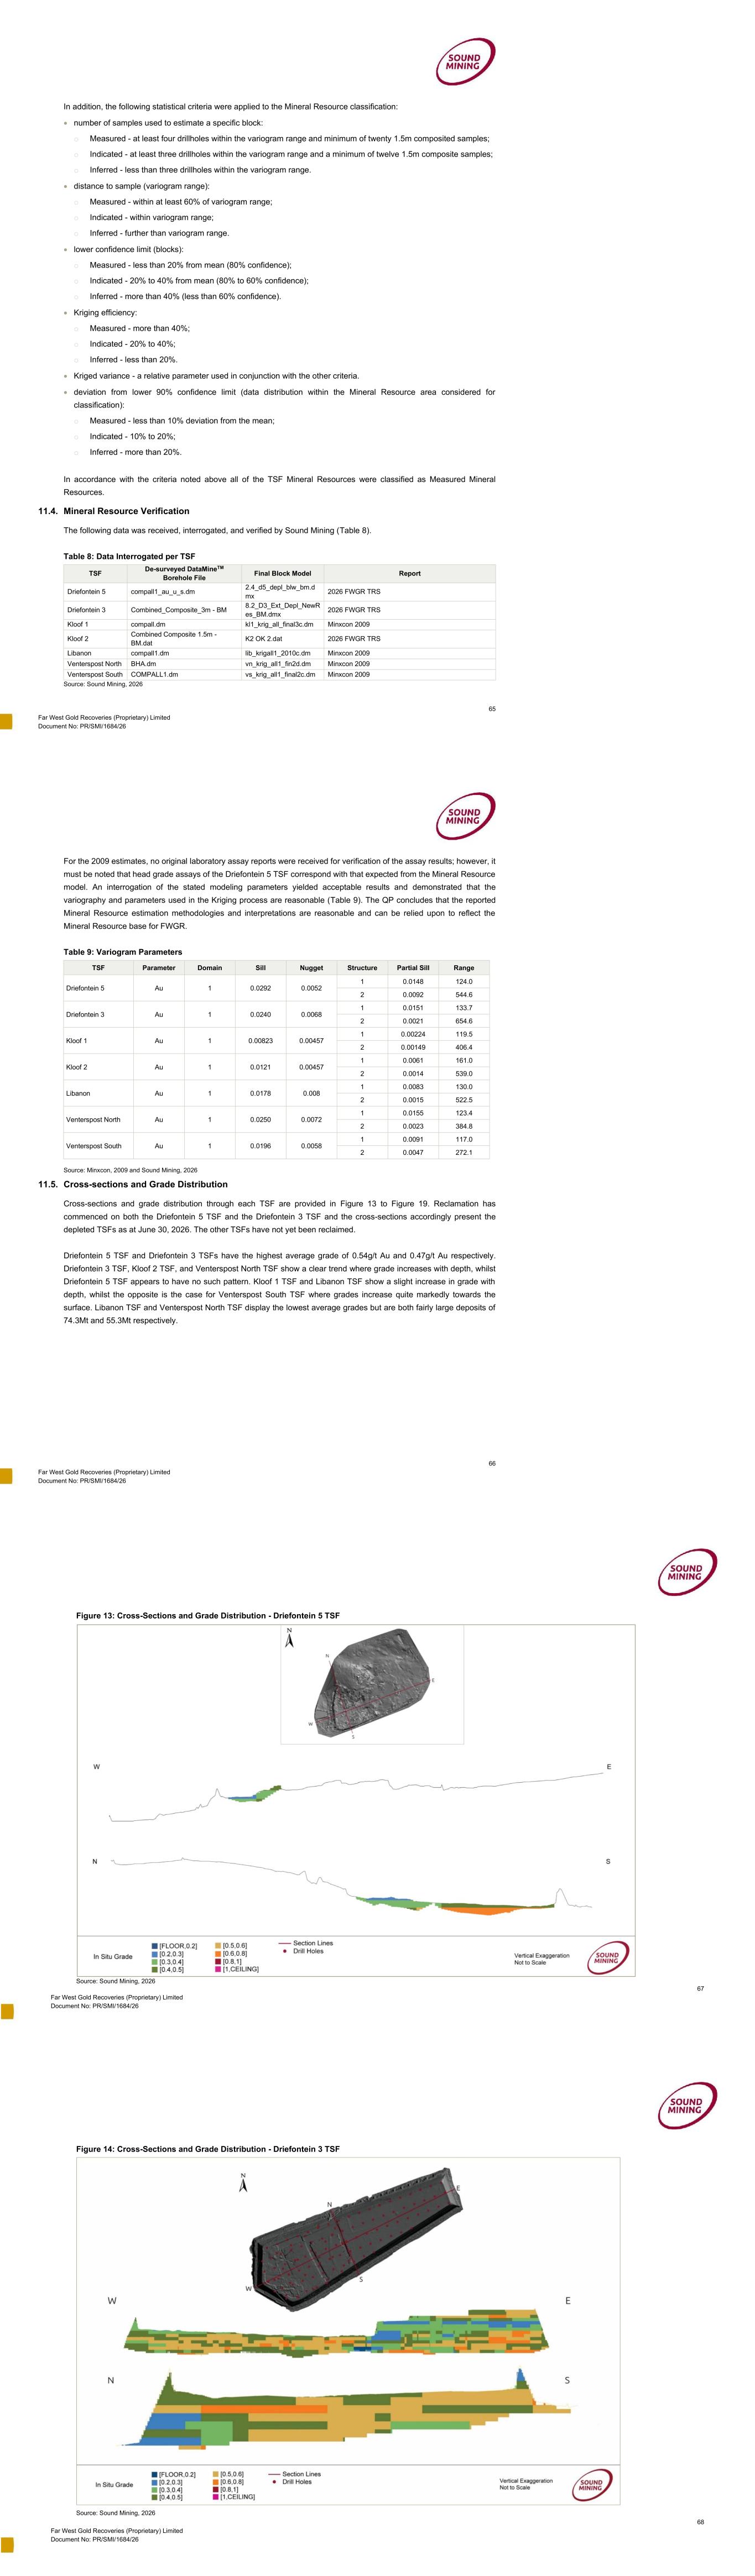
65 Far West Gold Recoveries (Proprietary) Limited Document No: PR/SMI/1684/26 In addition, the following statistical criteria were applied to the Mineral Resource classification: • number of samples used to estimate a specific block: o Measured - at least four drillholes within the variogram range and minimum of twenty 1.5m composited samples; o Indicated - at least three drillholes within the variogram range and a minimum of twelve 1.5m composite samples; o Inferred - less than three drillholes within the variogram range. • distance to sample (variogram range): o Measured - within at least 60% of variogram range; o Indicated - within variogram range; o Inferred - further than variogram range. • lower confidence limit (blocks): o Measured - less than 20% from mean (80% confidence); o Indicated - 20% to 40% from mean (80% to 60% confidence); o Inferred - more than 40% (less than 60% confidence). • Kriging efficiency: o Measured - more than 40%; o Indicated - 20% to 40%; o Inferred - less than 20%. • Kriged variance - a relative parameter used in conjunction with the other criteria. • deviation from lower 90% confidence limit (data distribution within the Mineral Resource area considered for classification): o Measured - less than 10% deviation from the mean; o Indicated - 10% to 20%; o Inferred - more than 20%. In accordance with the criteria noted above all of the TSF Mineral Resources were classified as Measured Mineral Resources. 11.4. Mineral Resource Verification The following data was received, interrogated, and verified by Sound Mining (Table 8). Table 8: Data Interrogated per TSF TSF De-surveyed DataMineTM Borehole File Final Block Model Report Driefontein 5 compall1_au_u_s.dm 2.4_d5_depl_blw_bm.d mx 2026 FWGR TRS Driefontein 3 Combined_Composite_3m - BM 8.2_D3_Ext_Depl_NewR es_BM.dmx 2026 FWGR TRS Kloof 1 compall.dm kl1_krig_all_final3c.dm Minxcon 2009 Kloof 2 Combined Composite 1.5m - BM.dat K2 OK 2.dat 2026 FWGR TRS Libanon compall1.dm lib_krigall1_2010c.dm Minxcon 2009 Venterspost North BHA.dm vn_krig_all1_fin2d.dm Minxcon 2009 Venterspost South COMPALL1.dm vs_krig_all1_final2c.dm Minxcon 2009 Source: Sound Mining, 2026 66 Far West Gold Recoveries (Proprietary) Limited Document No: PR/SMI/1684/26 For the 2009 estimates, no original laboratory assay reports were received for verification of the assay results; however, it must be noted that head grade assays of the Driefontein 5 TSF correspond with that expected from the Mineral Resource model. An interrogation of the stated modeling parameters yielded acceptable results and demonstrated that the variography and parameters used in the Kriging process are reasonable (Table 9). The QP concludes that the reported Mineral Resource estimation methodologies and interpretations are reasonable and can be relied upon to reflect the Mineral Resource base for FWGR. Table 9: Variogram Parameters TSF Parameter Domain Sill Nugget Structure Partial Sill Range Driefontein 5 Au 1 0.0292 0.0052 1 0.0148 124.0 2 0.0092 544.6 Driefontein 3 Au 1 0.0240 0.0068 1 0.0151 133.7 2 0.0021 654.6 Kloof 1 Au 1 0.00823 0.00457 1 0.00224 119.5 2 0.00149 406.4 Kloof 2 Au 1 0.0121 0.00457 1 0.0061 161.0 2 0.0014 539.0 Libanon Au 1 0.0178 0.008 1 0.0083 130.0 2 0.0015 522.5 Venterspost North Au 1 0.0250 0.0072 1 0.0155 123.4 2 0.0023 384.8 Venterspost South Au 1 0.0196 0.0058 1 0.0091 117.0 2 0.0047 272.1 Source: Minxcon, 2009 and Sound Mining, 2026 11.5. Cross-sections and Grade Distribution Cross-sections and grade distribution through each TSF are provided in Figure 13 to Figure 19. Reclamation has commenced on both the Driefontein 5 TSF and the Driefontein 3 TSF and the cross-sections accordingly present the depleted TSFs as at June 30, 2026. The other TSFs have not yet been reclaimed. Driefontein 5 TSF and Driefontein 3 TSFs have the highest average grade of 0.54g/t Au and 0.47g/t Au respectively. Driefontein 3 TSF, Kloof 2 TSF, and Venterspost North TSF show a clear trend where grade increases with depth, whilst Driefontein 5 TSF appears to have no such pattern. Kloof 1 TSF and Libanon TSF show a slight increase in grade with depth, whilst the opposite is the case for Venterspost South TSF where grades increase quite markedly towards the surface. Libanon TSF and Venterspost North TSF display the lowest average grades but are both fairly large deposits of 74.3Mt and 55.3Mt respectively. 67 Far West Gold Recoveries (Proprietary) Limited Document No: PR/SMI/1684/26 Figure 13: Cross-Sections and Grade Distribution - Driefontein 5 TSF Source: Sound Mining, 2026 68 Far West Gold Recoveries (Proprietary) Limited Document No: PR/SMI/1684/26 Figure 14: Cross-Sections and Grade Distribution - Driefontein 3 TSF Source: Sound Mining, 2026
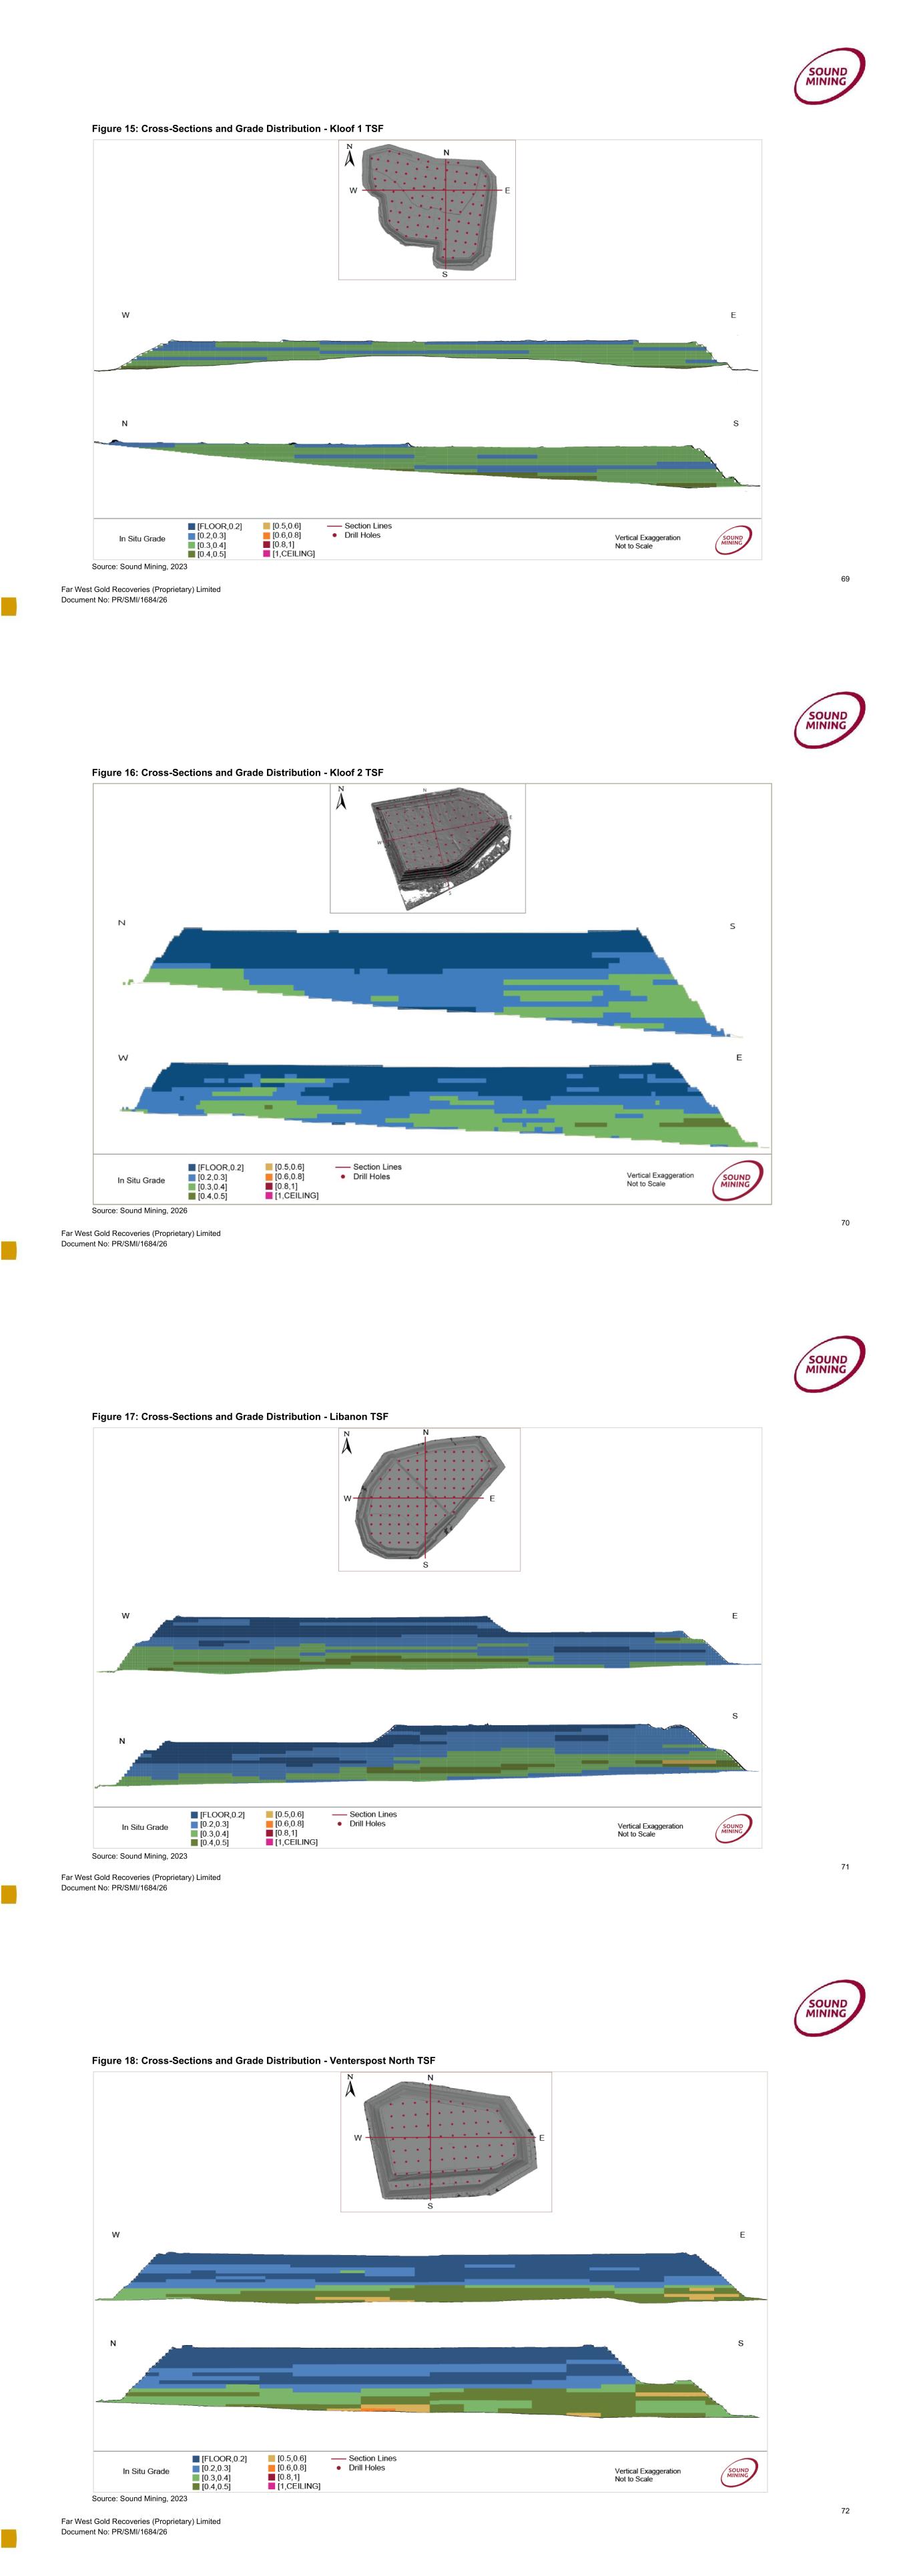
69 Far West Gold Recoveries (Proprietary) Limited Document No: PR/SMI/1684/26 Figure 15: Cross-Sections and Grade Distribution - Kloof 1 TSF Source: Sound Mining, 2023 70 Far West Gold Recoveries (Proprietary) Limited Document No: PR/SMI/1684/26 Figure 16: Cross-Sections and Grade Distribution - Kloof 2 TSF Source: Sound Mining, 2026 71 Far West Gold Recoveries (Proprietary) Limited Document No: PR/SMI/1684/26 Figure 17: Cross-Sections and Grade Distribution - Libanon TSF Source: Sound Mining, 2023 72 Far West Gold Recoveries (Proprietary) Limited Document No: PR/SMI/1684/26 Figure 18: Cross-Sections and Grade Distribution - Venterspost North TSF Source: Sound Mining, 2023
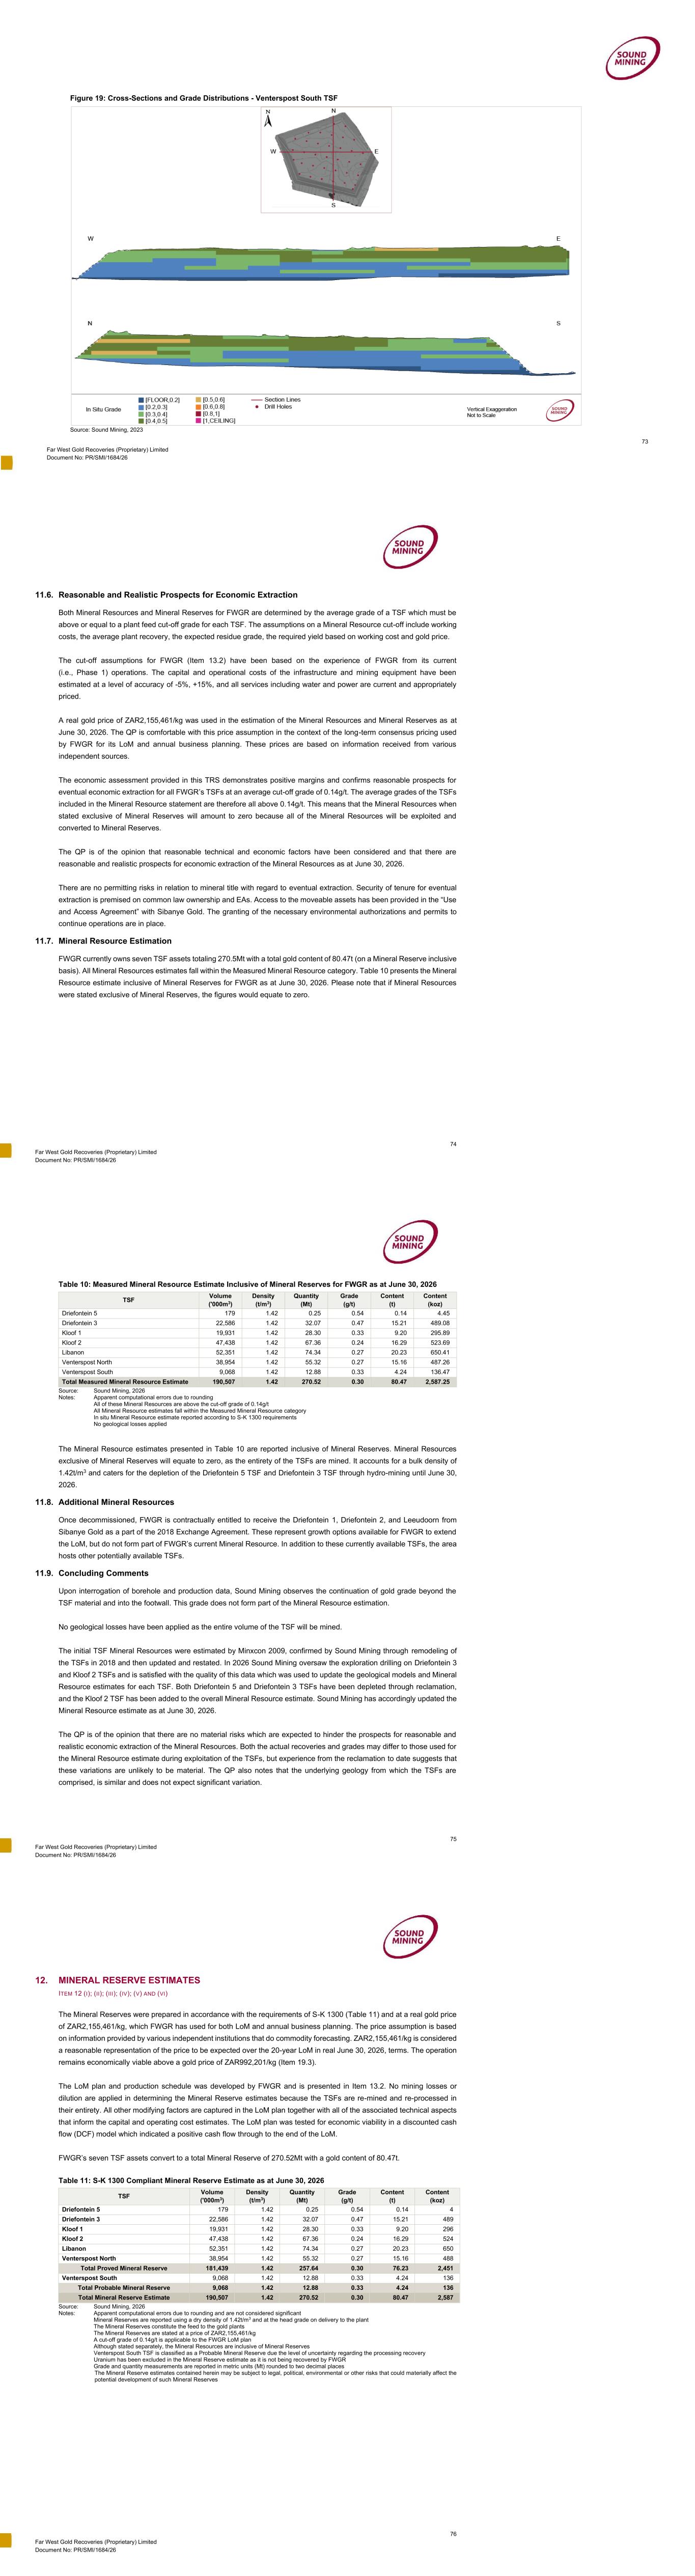
73 Far West Gold Recoveries (Proprietary) Limited Document No: PR/SMI/1684/26 Figure 19: Cross-Sections and Grade Distributions - Venterspost South TSF Source: Sound Mining, 2023 74 Far West Gold Recoveries (Proprietary) Limited Document No: PR/SMI/1684/26 11.6. Reasonable and Realistic Prospects for Economic Extraction Both Mineral Resources and Mineral Reserves for FWGR are determined by the average grade of a TSF which must be above or equal to a plant feed cut-off grade for each TSF. The assumptions on a Mineral Resource cut-off include working costs, the average plant recovery, the expected residue grade, the required yield based on working cost and gold price. The cut-off assumptions for FWGR (Item 13.2) have been based on the experience of FWGR from its current (i.e., Phase 1) operations. The capital and operational costs of the infrastructure and mining equipment have been estimated at a level of accuracy of -5%, +15%, and all services including water and power are current and appropriately priced. A real gold price of ZAR2,155,461/kg was used in the estimation of the Mineral Resources and Mineral Reserves as at June 30, 2026. The QP is comfortable with this price assumption in the context of the long-term consensus pricing used by FWGR for its LoM and annual business planning. These prices are based on information received from various independent sources. The economic assessment provided in this TRS demonstrates positive margins and confirms reasonable prospects for eventual economic extraction for all FWGR’s TSFs at an average cut-off grade of 0.14g/t. The average grades of the TSFs included in the Mineral Resource statement are therefore all above 0.14g/t. This means that the Mineral Resources when stated exclusive of Mineral Reserves will amount to zero because all of the Mineral Resources will be exploited and converted to Mineral Reserves. The QP is of the opinion that reasonable technical and economic factors have been considered and that there are reasonable and realistic prospects for economic extraction of the Mineral Resources as at June 30, 2026. There are no permitting risks in relation to mineral title with regard to eventual extraction. Security of tenure for eventual extraction is premised on common law ownership and EAs. Access to the moveable assets has been provided in the “Use and Access Agreement” with Sibanye Gold. The granting of the necessary environmental authorizations and permits to continue operations are in place. 11.7. Mineral Resource Estimation FWGR currently owns seven TSF assets totaling 270.5Mt with a total gold content of 80.47t (on a Mineral Reserve inclusive basis). All Mineral Resources estimates fall within the Measured Mineral Resource category. Table 10 presents the Mineral Resource estimate inclusive of Mineral Reserves for FWGR as at June 30, 2026. Please note that if Mineral Resources were stated exclusive of Mineral Reserves, the figures would equate to zero. 75 Far West Gold Recoveries (Proprietary) Limited Document No: PR/SMI/1684/26 Table 10: Measured Mineral Resource Estimate Inclusive of Mineral Reserves for FWGR as at June 30, 2026 TSF Volume ('000m3) Density (t/m3) Quantity (Mt) Grade (g/t) Content (t) Content (koz) Driefontein 5 179 1.42 0.25 0.54 0.14 4.45 Driefontein 3 22,586 1.42 32.07 0.47 15.21 489.08 Kloof 1 19,931 1.42 28.30 0.33 9.20 295.89 Kloof 2 47,438 1.42 67.36 0.24 16.29 523.69 Libanon 52,351 1.42 74.34 0.27 20.23 650.41 Venterspost North 38,954 1.42 55.32 0.27 15.16 487.26 Venterspost South 9,068 1.42 12.88 0.33 4.24 136.47 Total Measured Mineral Resource Estimate 190,507 1.42 270.52 0.30 80.47 2,587.25 Source: Sound Mining, 2026 Notes: Apparent computational errors due to rounding All of these Mineral Resources are above the cut-off grade of 0.14g/t All Mineral Resource estimates fall within the Measured Mineral Resource category In situ Mineral Resource estimate reported according to S-K 1300 requirements No geological losses applied The Mineral Resource estimates presented in Table 10 are reported inclusive of Mineral Reserves. Mineral Resources exclusive of Mineral Reserves will equate to zero, as the entirety of the TSFs are mined. It accounts for a bulk density of 1.42t/m3 and caters for the depletion of the Driefontein 5 TSF and Driefontein 3 TSF through hydro-mining until June 30, 2026. 11.8. Additional Mineral Resources Once decommissioned, FWGR is contractually entitled to receive the Driefontein 1, Driefontein 2, and Leeudoorn from Sibanye Gold as a part of the 2018 Exchange Agreement. These represent growth options available for FWGR to extend the LoM, but do not form part of FWGR’s current Mineral Resource. In addition to these currently available TSFs, the area hosts other potentially available TSFs. 11.9. Concluding Comments Upon interrogation of borehole and production data, Sound Mining observes the continuation of gold grade beyond the TSF material and into the footwall. This grade does not form part of the Mineral Resource estimation. No geological losses have been applied as the entire volume of the TSF will be mined. The initial TSF Mineral Resources were estimated by Minxcon 2009, confirmed by Sound Mining through remodeling of the TSFs in 2018 and then updated and restated. In 2026 Sound Mining oversaw the exploration drilling on Driefontein 3 and Kloof 2 TSFs and is satisfied with the quality of this data which was used to update the geological models and Mineral Resource estimates for each TSF. Both Driefontein 5 and Driefontein 3 TSFs have been depleted through reclamation, and the Kloof 2 TSF has been added to the overall Mineral Resource estimate. Sound Mining has accordingly updated the Mineral Resource estimate as at June 30, 2026. The QP is of the opinion that there are no material risks which are expected to hinder the prospects for reasonable and realistic economic extraction of the Mineral Resources. Both the actual recoveries and grades may differ to those used for the Mineral Resource estimate during exploitation of the TSFs, but experience from the reclamation to date suggests that these variations are unlikely to be material. The QP also notes that the underlying geology from which the TSFs are comprised, is similar and does not expect significant variation. 76 Far West Gold Recoveries (Proprietary) Limited Document No: PR/SMI/1684/26 12. MINERAL RESERVE ESTIMATES ITEM 12 (I); (II); (III); (IV); (V) AND (VI) The Mineral Reserves were prepared in accordance with the requirements of S-K 1300 (Table 11) and at a real gold price of ZAR2,155,461/kg, which FWGR has used for both LoM and annual business planning. The price assumption is based on information provided by various independent institutions that do commodity forecasting. ZAR2,155,461/kg is considered a reasonable representation of the price to be expected over the 20-year LoM in real June 30, 2026, terms. The operation remains economically viable above a gold price of ZAR992,201/kg (Item 19.3). The LoM plan and production schedule was developed by FWGR and is presented in Item 13.2. No mining losses or dilution are applied in determining the Mineral Reserve estimates because the TSFs are re-mined and re-processed in their entirety. All other modifying factors are captured in the LoM plan together with all of the associated technical aspects that inform the capital and operating cost estimates. The LoM plan was tested for economic viability in a discounted cash flow (DCF) model which indicated a positive cash flow through to the end of the LoM. FWGR’s seven TSF assets convert to a total Mineral Reserve of 270.52Mt with a gold content of 80.47t. Table 11: S-K 1300 Compliant Mineral Reserve Estimate as at June 30, 2026 TSF Volume ('000m3) Density (t/m3) Quantity (Mt) Grade (g/t) Content (t) Content (koz) Driefontein 5 179 1.42 0.25 0.54 0.14 4 Driefontein 3 22,586 1.42 32.07 0.47 15.21 489 Kloof 1 19,931 1.42 28.30 0.33 9.20 296 Kloof 2 47,438 1.42 67.36 0.24 16.29 524 Libanon 52,351 1.42 74.34 0.27 20.23 650 Venterspost North 38,954 1.42 55.32 0.27 15.16 488 Total Proved Mineral Reserve 181,439 1.42 257.64 0.30 76.23 2,451 Venterspost South 9,068 1.42 12.88 0.33 4.24 136 Total Probable Mineral Reserve 9,068 1.42 12.88 0.33 4.24 136 Total Mineral Reserve Estimate 190,507 1.42 270.52 0.30 80.47 2,587 Source: Sound Mining, 2026 Notes: Apparent computational errors due to rounding and are not considered significant Mineral Reserves are reported using a dry density of 1.42t/m3 and at the head grade on delivery to the plant The Mineral Reserves constitute the feed to the gold plants The Mineral Reserves are stated at a price of ZAR2,155,461/kg A cut-off grade of 0.14g/t is applicable to the FWGR LoM plan Although stated separately, the Mineral Resources are inclusive of Mineral Reserves Venterspost South TSF is classified as a Probable Mineral Reserve due the level of uncertainty regarding the processing recovery Uranium has been excluded in the Mineral Reserve estimate as it is not being recovered by FWGR Grade and quantity measurements are reported in metric units (Mt) rounded to two decimal places The Mineral Reserve estimates contained herein may be subject to legal, political, environmental or other risks that could materially affect the potential development of such Mineral Reserves

77 Far West Gold Recoveries (Proprietary) Limited Document No: PR/SMI/1684/26 12.1. Risk to the Mineral Reserve Estimate Uncertainties associated with the FWGR operations, and therefore the Mineral Resource and Mineral Reserve estimate, can all be mitigated. Sound Mining has not exposed any fatal flaws to the successful execution of the LoM plan, and the QP does not anticipate any material changes to the associated modifying factors. The uncertainties requiring comment in the context of their impact on these estimates are: • Mining: whilst the mining method and practices are well established and conducted by experienced hydro-miners, throughput could be affected by a variety of issues, including, but not limited to the availability of electricity and water. • Quality of the Mineral Assets: the seven TSFs that comprise the Mineral Reserve have all been adequately drilled, their likely content adequately assessed, and recovery test work satisfactorily completed. The actual recoveries will be influenced by the actual RoM grade entering DP2 and the amount of carbon (elemental and/or organic) in the RoM. This risk could be managed by blending material from different TSFs, if applicable. • Plant Performance: the management of the risk of a lower-than-expected overall throughput recovery is likely to be mitigated by implementing the UFR circuit. • RTSF Operational Risk: the QP considers the main operational risk of the RTSF to be water management. During the initial stages of operation, the presence of the basin liner and the phased implementation of the drainage system may limit the ability of incident water to drain from certain areas of the RTSF. • Delayed Commissioning of Key Infrastructure: any delays to the scheduled commissioning of the RTSF or expanded processing capacity of DP2 will impact on the proposed production forecast and anticipated revenues. Both Projects are currently progressing in accordance with the schedule and, the current LoM plan only requires RTSF by late FY2027. • Water Supply: South Africa is a relatively dry area and predictions are that dry conditions will escalate. Mining is heavily reliant on water to transport material over large distances and for processing. FWGR uses potable water for potable usage and not mining operations. Process water is secured through a combination of harvested return water from the treated tailings and dewatering from local shaft systems and local wellfields. • Power Supply: power is provided by the national power supplier, Eskom. The national power supply and distribution infrastructure is severely distressed, and this results in frequent disruptions to the power delivered to the South African mining industry. There is a curtailment agreement in place with Eskom which requires that during blackouts electricity use is to be curtailed, which is typically achieved by shutting down the milling section. Diesel generators are used to maintain critical equipment during power interruptions and facilitate a quicker restart of the plant once power is restored. Sound Mining understands that no alternative power supply arrangements are currently in place at FWGR and as such consider the threat of production losses resulting from power disruption to represent a significant production risk. • Long-term Sustainability: continued production beyond the current LoM plan and Mineral Reserve estimate relies on available TSFs that can be brought on line in the future. There is ample time for additional sampling and resource modeling to confirm their extent and content prior to production and the three currently available TSFs envisaged by FWGR’s long-term operational aspirations, are controlled by Sibanye Gold. Sound Mining do not envisage any future security of tenure complications arising from the inclusion of these TSFs in the overall LoM plan. • Extreme Weather: As a result of climate change, extreme weather events such as droughts, extreme rainfall and high wind volumes are on the increase. Specifically, the increase in intensity of events, such as thunderstorms on the Highveld, where the operations are situated, will impact operations. Major property, infrastructure and/or environmental damage as well as loss of human life could also be caused by extreme weather events. • Rising Costs: The global economic environment, geopolitical tensions and inflationary pressures world-wide have led to above inflationary increases in production costs as well as an unavailability of critical material such as reagents and critical equipment which affects production and operating costs. FWGR remains a relatively low-cost operation, however a prolonged period of high inflation will erode financial value over time. 78 Far West Gold Recoveries (Proprietary) Limited Document No: PR/SMI/1684/26 • Gold Price: FWGR takes full exposure to the gold price, and therefore a reduction in the price of gold may erode margins. • Supply Chain Risks: The operations are dependent on the reliable supply of key inputs, including cyanide, natural gas, and diesel. Supply disruptions, limited supplier availability, geopolitical events and price increases could increase operating costs and, if prolonged, reduce production. Cyanide supply risk is partly mitigated through the use of liquid cyanide and the commissioning of a briquette plant. • Regulatory Changes: The proposed Draft Mineral Resources Development Bill, 2025 may introduce additional regulatory requirements for the processing of historical tailings, including potential requirements to obtain a mining right for processing movable historical tailings. If enacted, the proposed legislation could increase regulatory requirements and costs and may restrict the ability to process tailings. For additional information regarding the Company’s risks, see Item 3D of the Form 20-F. 79 Far West Gold Recoveries (Proprietary) Limited Document No: PR/SMI/1684/26 13. MINING METHOD ITEM 13 (I); (II); (III); (IV) AND (V) The mining method is hydro-mining (or hydraulic mining), which uses high-pressure water monitors to deliver a high- pressure water jet to hydraulically repulp and mobilize tailings material within the TSFs. The water from the monitors mixes with the tailings and forms a slurry with a high solids content. The slurry flows under gravity along channels at the base of the dump to a collection sump at the lowest elevation of the bench being mined. Screens are installed to remove debris, which must be cleaned regularly to prevent an impact on the pumping operations. The monitors comprise 200mm self-propelled track monitor guns (Photograph 1), each with production rates of up to 300ktpm. They discharge approximately 500m3/hr of water at pressures up to 30bar through a variable sized nozzle depending on the hardness of the material being slurried, and can be controlled remotely by the operator. In order to minimize hydraulic pressure losses and poor reclamation gun efficiencies, water pressure is designed to reach the monitor guns at a minimum pressure of 25bar. Photograph 1: Monitor Gun Source: FWGR, 2020 The prerequisites for hydro mining are limited to the infrastructure discussed in Item 14 and Item 15. Pre-stripping and backfilling processes are not applicable to this mining method. Early forms of hydraulic mining were adapted from methods developed in the United Kingdom for the mining of primary kaolin deposits. These early attempts used a high-pressure monitor located at the base of the TSF to wash material from the base of the slope. A disadvantage of this approach is that by directing the water jet at the base of the slope, the slope is undercut and can become unstable, leading to uncontrolled slope failure. With sufficient off-set distance between the slope and the monitor and/or monitor operator, this is not necessarily a problem, however, given that many of the tailings dams that are available for reprocessing are located in urban locations, a safer system of monitor operation has subsequently been developed. The majority of tailings dams that have been mined in the last twenty years have utilized a monitor located on the upper bench of the tailings dam, directing a water jet downwards to cut a stable slope surface into the face of the TSF. This approach has been successfully applied within densely populated urban areas. It is considered 80 Far West Gold Recoveries (Proprietary) Limited Document No: PR/SMI/1684/26 safer and allows for rapid changes in slope angles to cope with any operational variances that may be encountered. The slopes usually consist of a 15m high bench with a 45º to 50º slope angle. Consistent slope angles can be maintained using the top-down hydraulic mining technique as shown in Figure 20 and Figure 21. Figure 20: Mining Methodology Source: Sound Mining, 2026 Figure 21: Mining Widths Source: Sound Mining, 2026 Increased production is achieved by the inclusion of additional units and this modular approach provides a high degree of flexibility that allows simultaneous mining at a number of points over a wide range of production rates and consequently, grade blending is readily achievable if required.

81 Far West Gold Recoveries (Proprietary) Limited Document No: PR/SMI/1684/26 The slurry density produced by the monitors is controlled by the operator. Actively moving the monitor and consistently cutting the face results in a slurry with relatively high solids content. Experience from FWGR’s ongoing operations has demonstrated that slurries with 35% to 50% solids can consistently be achieved. The monitor guns seek to maintain optimal slurry densities in the region of 1.42t/m3. The TSFs material, has a typical particle size of 70% <75µm. Relatively flat flow channels will develop with gradients in the order of 1:100m. The position of the sump will change as mining proceeds along a bench, to limit the distance between the monitor and the sump. If too far from the active face, tailings material may drop out of suspension and reduce the solids content of the slurry pumped to the plant. However, the slurry tends to flow at a natural beaching angle which is generally self-correcting. If the slope gets too steep, flow velocities increase in the channels causing erosion until the equilibrium slope is attained. If the slope is too flat the solids settle out reducing the height of the mining face until the equilibrium slope is achieved (Figure 21). A monitor gun dislodges the in-situ material which washes into slurry channels (Photograph 2). Photograph 2: Monitor Gun in Operation Source: FWGR, 2023 The slurry flows through the channel and passes through screens to remove debris which may cause blockages in the pipeline. After screening, the slurry collects in the sump and is pumped to the plant for processing. Slurry densities are maintained at approximately 1.42t/m3, for optimal pipeline performance. 82 Far West Gold Recoveries (Proprietary) Limited Document No: PR/SMI/1684/26 13.1. Mining Plan and Layout The hydro-mining and re-deposition of tailings is outsourced to competent and experienced service providers. The hydro- mining performance assumptions are based on the current operations where the method has been successfully “tried and tested”. The equipment requirements, manning complements and necessary supporting infrastructure, in terms of water and power supply, are well understood and have been accurately planned by both FWGR and their current service provider. No untested technical assumptions with regards to the mining have been made. Monitors remove the tailings material from the top of a TSF to the natural ground level in 15m layers. The monitor is positioned on the top of the working bench to direct the water jet down into the TSF. It will work the face in one direction along the front edge of the dam before returning in the opposite direction when it reaches the far end of the dam. As the mining faces advance, slurry is directed via launders to a pit pump which then transfers the slurry to a fixed transfer pump station that includes a vibrating trash screen. A stepped bench approach is planned to maintain slope stability. Horizontal benches of 100m to 200m, inclusive of the face angle, are created for safe working distances between simultaneous operations at different bench elevations. The layout is illustrated in a schematic cross-section (Figure 22). Figure 22: Mining Sequencing Source: Sound Mining, 2026 The top and second layers progress simultaneously until a safe distance (~200m) for the third 15m layer is reached, and so forth until ground level is reached and the entire TSF is reclaimed. As mining progresses and the footprint is exposed, the final layer is cleared, prepared and rehabilitated. 13.2. Modifying Factors and Mining Schedule No mining losses or dilution are applied in determining the Mineral Reserve estimates because the TSFs are re-mined and re-processed in their entirety. All other modifying factors are captured in the mine design together with all of the associated technical aspects that inform the capital and operating cost estimates. The QP has observed from on-site inspections of the mining process that FWGR also reclaims footwall material, where deemed economically viable. This practice could imply the application of an appropriate modifying factor in the derivation of Mineral Reserves when not part of the Mineral Resource estimate. FWGR are keeping suitable records to assess the materiality of this practice on the Mineral Reserve estimate and if material may be included in future Mineral Reserve estimates. 83 Far West Gold Recoveries (Proprietary) Limited Document No: PR/SMI/1684/26 Table 12 reports the production as scheduled from the TSFs. It reveals a total recovered RoM quantity of 270.52Mt at an average head grade of 0.30g/t. Table 12 also presents the average metallurgical recovery anticipated from each TSF. Table 12: Scheduled RoM Production TSF Mineral Resource Category RoM Quantity (Mt) In situ Grade (g/t Au) Recovery (%) Driefontein 5 Measured 0.25 0.54 51.9 Driefontein 3 Measured 32.07 0.47 51.5 Kloof 1 Measured 28.30 0.33 50.5 Kloof 2 Measured 67.36 0.24 42.1 Libanon Measured 74.34 0.27 47.2 Venterspost North Measured 55.32 0.27 48.9 Venterspost South Measured 12.88 0.33 57.6 Total 270.52 0.30 48.24 Source: Sound Mining, 2026; and FWGR, 2026 The reclamation sequence presents a phased approach to increasing production (Graph 1). Graph 1: LoM Production Forecast Source: Sound Mining, 2026 Graph 1 illustrates the inclusion of the Available TSFs in the longer-term. This growth strategy is aligned using the designed RTSF capacity and DP2 upgrade. - 500 1 000 1 500 2 000 2 500 3 000 - 2 000 4 000 6 000 8 000 10 000 12 000 14 000 16 000 2 0 2 7 2 0 2 8 2 0 2 9 2 0 3 0 2 0 3 1 2 0 3 2 2 0 3 3 2 0 3 4 2 0 3 5 2 0 3 6 2 0 3 7 2 0 3 8 2 0 3 9 2 0 4 0 2 0 4 1 2 0 4 2 2 0 4 3 2 0 4 4 2 0 4 5 2 0 4 6 G o ld R e co v e re d ( k g ) T o n s ( M t) Driefontein No 5 TSF Driefontein No 3 TSF Libanon TSF Kloof 1 TSF Kloof 2 TSF Venterspost South TSF Venterspost North TSF Recovered Gold 84 Far West Gold Recoveries (Proprietary) Limited Document No: PR/SMI/1684/26 13.3. Cut-off Grade A cut-off grade has been computed for each TSF considering the assumed gold price, anticipated recovery through the planned plant and the expected operating costs. The results are presented in Table 13. The cut-off grades for the respective dumps range from 0.11g/t to 0.16g/t with an average of 0.14g/t. Table 13: Calculated Cut-off Grades TSF Cut-off Grade (g/t) Driefontein 5 0.13 Driefontein 3 0.13 Kloof 1 0.13 Kloof 2 0.16 Libanon 0.14 Venterspost North 0.13 Venterspost South 0.11 Source: Sound Mining, 2026 13.4. Mining Contractor The cost and maintenance of the mining equipment at reclamation sites, employees and other operational resources are for the operating contractor’s account. They are the subject of contractual agreements with FWGR. Initial capital is not required for the mining. The equipment (i.e., monitor guns) supplied by the contractor is shown in Table 14. Table 14: Mining Equipment Planned for each TSF TSF Steady State Production (ktpm) Required Units (Number) Driefontein 5 45 1 Driefontein 3 600 2 Kloof 1 600 2 Kloof 2 600 2 Libanon 600 2 Venterspost North 600 2 Venterspost South 600 2 Source: Sound Mining, 2026 Driefontein 5 is approaching depletion and is now considered a cleanup site with an immaterial contribution to the steady state production. The mining contractor currently relies on two active mining units with a third unit in transit to the next planned set-up position. The operating cost estimate for the mining and re-deposition of tailings is supported by actual operational figures. They are presented in the working cost estimates as “contractor costs”. The capital expenditure estimates for the pipeline and pumping design to move the RoM material to the respective plants for processing and for the return of the processed material (new arisings) for re-deposition, is provided in Item 18. 13.5. Concluding Comments Hydro-mining is an existing “tried and tested” process which is well understood. The contractor is entitled to decide on various operational alternatives and to deploy capital equipment and manage costs. The QP has checked the integrity of the mine design and associated costs and is satisfied with the level of detail and accuracy of the study work completed. The selective mining of portions of a TSF is not considered an option by Sound Mining.

85 Far West Gold Recoveries (Proprietary) Limited Document No: PR/SMI/1684/26 From a health and safety perspective, hydro-mining does not create, but rather ameliorates the airborne dust problem often associated with fine tailings material. Safe bench heights are governed by the material’s strength which is influenced by the phreatic surface within a TSF. These have been dormant for many years, and the phreatic surface is generally well below the surface of the dumps. The drilling program to define the Mineral Resource did not encounter saturated zones or phreatic surfaces and so the risk of slope failure or liquefaction is considered to be low. Slope stability is however managed and the hydrological aspects affecting the TSFs are not considered significant to the operation. There is a clean/dirty water separation system with emergency paddocks to prevent any spillage or run-off from the facilities. These assist in preventing choked screens from vegetation or heavy rainstorm events, where the runoff needs to be contained prior to being pumped through the circuit back to the TSF. 86 Far West Gold Recoveries (Proprietary) Limited Document No: PR/SMI/1684/26 14. PROCESS AND RECOVERY METHODS ITEM 14 (I); (II); (III) AND (IV) An expansion of the currently operating DP2 processing plant is planned to facilitate an increase in processing throughput from the current TSF Mineral Reserve inventory. 14.1. Existing DP2 Processing Facility Phase 1 of FWGR’s long-term growth strategy required that the original DP2 be modified and refurbished to accommodate up to 600ktpm of RoM slime from the TSFs. This has been accomplished but with a throughput constraint of approximately 500ktpm imposed by the maximum deposition rate for new arisings onto the Driefontein 4 TSF. Based on current deposition rates, along with remodeling and reassessing, this TSF is due to reach its storage capacity in mid-2027. The Phase 1 work on the plant included a refurbishment of the conventional CIL plant and modifications to the milling and cyclone circuits to improve gold liberation as suggested by metallurgical test work. The existing primary ball mill design was modified to incorporate an overflow discharge rather than the grate discharge and the use of a 30mm ball charge instead of the 50mm ball size that was included in the original mill design. This improved contact between grinding media and gold ore particles for increased grinding efficiency in gold liberation. A new 45m diameter hi-rate thickener was also installed. The achievable grind of 70% <75µm proved to be satisfactory for current gold recoveries, however, closed circuit milling with cyclones was introduced for an improved grind of between 75% and 80% <75µm to improve the liberation of gold locked within coarser silicates. Further revisions to the process flow have since included a copper elution step on the loaded carbon, which delivers a higher-grade gold bar and an improved efficiency of gold removal from cathodes, by improving the gold to copper ratio in the RoM feed. Graph 2: Actual Production of DP2 for FY2020 to FY2026 Source: FWGR, 2026 Graph 2 and Graph 3 show actual DP2 plant production capacity and plant recoveries over the period FY2020 to FY2026. DP2 Plant throughput has remained stable over the past 3 financial years (FY2024 to FY2026) and has demonstrated greater throughput compared to FY2020 to 2023 (Graph 8). Metallurgical recovery in FY2026 has consistently remained above the forecast recovery and has shown more consistent recoveries than previous financial years. However, it should be noted that the metallurgical plant recoveries will be materially affected by plant head grade. - 100 200 300 400 500 600 Q u a n ti ty ( k t) Months Production (FY 2020) Production (FY 2021) Production (FY 2022) Production (FY 2023) Production (FY 2024) Production (FY 2025) Production (FY 2026) Phase 1 LoM Plan 87 Far West Gold Recoveries (Proprietary) Limited Document No: PR/SMI/1684/26 Graph 3: Actual Plant Recovery for DP2 versus Forecast Recovery for FY2020 to FY2026 Source: FWGR, 2026 The process flow is as follows: • the slurry from the hydro-mining operation is pumped to a surge tank via a 25m2 linear trash screen (800μm). Lime, sourced from a contract supplier as milk of lime, is added directly into a receiving tank for pH control; • from the receiving surge tank, the slurry is pumped to the milling and classification section from where the cyclone overflow reports to the thickener for thickening to 1.45t/m3 before being pumped to the CIL plant; • the CIL section comprises seven tank stages of 1,600m3 per tank combining to approximately twelve hours residence time. Each tank is fitted with carbon retaining screens and a recessed impeller vertical spindle carbon transfer pump. Sodium cyanide solution is added to CIL Tank 1 and Tank 2 in order to maintain the required concentration for the leach reaction. Slurry flows downstream through the screens and via launders from CIL Tank 1 to CIL Tank 7 from where it exits to the 25m2 tailings linear screen. Fine carbon is recovered from the screen overflow while the underflow is pumped by the CIL tailings pump to the tailings tank at the slurry receiving area; • loaded carbon flows upstream from CIL Tank 7 to CIL Tank 1 and is recovered daily from the CIL tank 1 by batch transferring of carbon slurry to the loaded carbon screen and into a holding tank for transfer to the elution circuit; • loaded carbon is batch processed through a 9t elution circuit for gold stripping with the stripped solution reporting to 128m3 holding tanks; • the solution is passed through a zinc precipitation process for recovering gold from dilution. The sludge is then calcined and smelted into doré bars; • the doré bars are dispatched to Rand Refinery Limited for final refining; • the eluted carbon is thermally regenerated in a horizontal kiln at 700°C and returned to DP2 for re-use in the CIL circuit. Fresh carbon is added to the circuit as required; and • CIL tailings and oversize waste from the incoming TSF re-mined slurry is stored in a mechanically agitated surge tank and pumped by the final tailings pumps to the Driefontein 4 TSF. 88 Far West Gold Recoveries (Proprietary) Limited Document No: PR/SMI/1684/26 14.2. Expansion of DP2 The expansion of DP2 from 600ktpm to a higher throughput rate of 1.2Mtpm has been undertaken as scheduled during FY2025 and FY2026, although the plant will only be required to treat an increased throughput from mid-2027 when the new RTSF is planned to be preliminary commissioned and operational. The design approach to the DP2 expansion has been to modify existing ball milling capacity and duplicate existing processing circuits. In addition to these upgrades, FWGR has elected to construct a UFR circuit which is installed after the plants' CIL process. The UFR infrastructure is scheduled to be constructed from June 2026 to June 2027. The block plan shown in Figure 23 presents the latest DP2 plant layout. Figure 23: DP2 Block Plan Source: FWGR, 2026 Historically achievable plant gold recoveries are expected to be realized from the expanded DP2 plant with gold recoveries being principally driven by the plant feed head grade. In addition, the UFR is expected to improve recoveries, however this improvement is still to be quantified though ongoing test work.

89 Far West Gold Recoveries (Proprietary) Limited Document No: PR/SMI/1684/26 ZAR108 M (excluding contingencies) has been included in the LoM plan for the remaining portion of this expansion with a further ZAR792M allocated to the UFR, giving a total of ZAR900M for the expansion. The principal areas of capital expenditure are: • Slurry Receiving and Trash Screening: the hydraulically mined material is pumped over trash screens before entering the respective receiving tanks. Lime can be added in the receiving tank for pH correction. From the slurry receiving tanks the material is pumped either to the classification and milling circuit or can be bypassed directly to the CIL or pre- leach thickeners. The provision addresses process design screen changes and the tank volume adjustments necessary to address the increased production capacity. • Milling and Thickening: prior to milling the material passes through a primary classification stage, via cycloning, where after the coarser material is closed circuit milled and the finer material from the milling circuit directed to the pre-leach thickeners. Thickener underflow is pumped to a second set of trash linear screens prior to CIL. The provision addresses the newly designed cyclone cluster installations, the new 45m diameter thickener circuit, along with all the adjustments and modifications necessary to the current ball milling circuit. • Leach and Adsorption: reclamation slurry is either pumped directly to the CIL or first passes through the classification, milling and thickening circuits before passing through the CIL trash screens and into the CIL. Each circuit consists of one stage of pre-oxidation and seven stages of CIL where gold is leached and adsorbed onto activated carbon, which flows counter-currently to gold-bearing slurry. Loaded carbon is directed to the holding hopper before being transferred to the elution circuits while tailings pass over carbon safety screens before being pumped to the final tailings tank. The provision provides for the installation of a new CIL section which will duplicate the currently installed capacity. • Tailings Disposal: CIL tails gravitate through to carbon safety screens. The screen oversize is pumped to the fine carbon handling circuit ensuring that any carbon passing through the CIL circuit is recovered. The screen undersize is sampled before being collected in the final tailings tank and then pumped to the TSF. The provision recognizes the requirement for additional pumping infrastructure to deliver the increased throughput capacity to the RTSF. • Services and Distribution: this provision considers all the supporting bulk services required for the plant expansion and includes the necessary road access construction for the expanded plant site. • Water and Air Services: the requirements for process water and compressed air services at the increased production capacity are covered by this provision. • Reagents: this provision covers the infrastructure necessary to ensure correct reagent dosage in the duplicated processing circuits. • Elution and Carbon Handling: loaded carbon from the CIL circuit is directed to the holding hopper to remove any foreign particles prior to elution. Adsorbed gold will be eluted from the activated carbon by means of a heated solution of sodium cyanide and caustic soda. Acid wash takes place in the elution column prior to gold elution. This elution process is followed by rinsing and cooling stages. Eluted carbon from the batch elution process will be directed to carbon regeneration while the pregnant eluate solution will be routed to pregnant solution tanks for zinc precipitation. The barren carbon from the elution circuits passes through carbon regeneration kilns to volatilize off impurities and reactivate the carbon where after it is transferred back to the last CIL tank of each circuit. The provision addresses the requirement for the installation of a new elution and carbon handling circuit which will duplicate the currently installed capacity. • Zinc Precipitation and Smelting: Gold in solution from the elution circuit will be recovered by zinc precipitation in plate and frame filters. The provision addresses the requirement for the installation of a new zinc precipitation and smelting circuit which will enable the production of doré to match the currently installed capacity. • Indirect Capital: which is comprised of Construction Costs, First Fill Consumables, Commissioning and Spares and Project Services. 90 Far West Gold Recoveries (Proprietary) Limited Document No: PR/SMI/1684/26 • UFR Capital: has been included for a UFR circuit to further enhance gold extraction. There will be a UFR circuit on the Phase 1 CIL tails and the Phase 2 CIL tails stream. Each UFR circuit will consist of four 300m3 UpFlow Reactors with allowance for an additional two reactors. The UFR optimizes gold dissolution and adsorption onto activated carbon by continuously recirculating the overflowing slurry into a high-energy, counter-current mixing chamber at its base. Interstage pumping screens in each UFR retain the carbon and pump the slurry to the next UFR. The UFR circuit operates on a carousel basis. Loaded carbon removal is done by isolating each UFR in turn and pumping the entire contents over the loaded carbon screen. The screened loaded carbon is collected in a column for pressure transfer to the CIL Plant. New carbon into the UFR circuit will be regenerated carbon that has been screened on the UFR sizing screen and collected in an acid wash column for treatment before pressure transfer to the selected reactor. Fine carbon in the undersized fraction of the UFR sizing screen is pumped to the carbon fines treatment circuit. Reagent usage is hydrochloric acid for the acid treatment of the regenerated carbon. The final UFR tails slurry stream flows onto the carbon safety screen and is collected in a tailings tank for pumping transfer to the TSF tailings disposal pumping system. 14.3. Concluding Comments The current DP2 process performance and subsequent modifications to the original DP2 plant circuit, along with the supporting metallurgical test work have indicated that the expanded DP2 will perform to specification. 91 Far West Gold Recoveries (Proprietary) Limited Document No: PR/SMI/1684/26 15. INFRASTRUCTURE ITEM 15 (I); (II); (III); (IV); (V); (VI); (VII); (VIII); (IX) AND (X) The FWGR operation is supported by an extensive network of infrastructure required for the reclamation, processing and deposition of historical tailings resources. Key infrastructure includes processing facilities, tailings storage facilities, pumping stations, slurry and return water pipelines, water management systems, power supply infrastructure, access roads and associated support services. The operation currently processes approximately 500ktpm of reclaimed tailings material. The ongoing DP2 expansion project is expected to increase processing capacity to approximately 1.2Mtpm following commissioning, resulting in a corresponding increase in infrastructure and tailings management requirements. Since publication of the initial TRS, significant progress has been made in the development of infrastructure supporting the expansion project. In particular, substantial capital expenditure has been committed to the development of the RTSF and associated infrastructure, including tailings delivery systems, return water infrastructure, pumping installations and supporting services. The RTSF project is 67% complete as at the end of FY2026 and will form the long-term tailings deposition solution for the operation. Figure 24: Driefontein 4 TSF Location and Infrastructure Source: FWGR, 2020 92 Far West Gold Recoveries (Proprietary) Limited Document No: PR/SMI/1684/26 Tailings are currently deposited to the Driefontein 4 TSF, which provides sufficient remaining storage capacity to support operations during completion and commissioning of the RTSF. The Leeudoorn TSF, which formed part of the tailings deposition strategy described in the previous TRS, is no longer required as part of the operational plan due to the successful progression of the RTSF project. The following sections describe the RTSF and associated infrastructure supporting the operation. Figure 24 shows the locality of the existing Driefontein 4 TSF and the DP2 plant. 15.1. Tailings Deposition FWGR requires sufficient tailings deposition capacity to support the continued reprocessing of historical tailings resources and the planned increase in processing capacity at DP2 from approximately 500ktpm to 1.2Mtpm. Tailings will continue to be deposited on the Driefontein 4 TSF until mid-2027, whereafter all future tailings will report to the RTSF. Since publication of the previous TRS, the RTSF project has progressed significantly. The supporting detailed engineering was completed by GTSA, all land required for the development has been secured, regulatory requirements have been addressed, and construction of Stage 1 of the RTSF is nearing completion. Significant capital expenditure has also been committed to the development of the RTSF and associated infrastructure, including tailings delivery systems, return water infrastructure, pumping installations, pipelines and supporting services required for long term operation. Construction of Stage 1 (lower compartment) of the RTSF is expected to be complete by Q4 2026, but commissioning has intentionally been deferred until completion of the summer rainfall season, around mid-2027. The final commissioning may be adjusted depending on prevailing weather conditions and the duration of the rainy season. After the rainfall season, the drainage systems will be sealed, and FWGR will apply for beneficial occupation to start depositing tailings. Deposition on the lower compartment of the RTSF will commence once these regulatory approvals for beneficial occupation are received.

93 Far West Gold Recoveries (Proprietary) Limited Document No: PR/SMI/1684/26 15.2. Regional Tailings Storage Facility Design The RTSF detailed design was developed from the original feasibility level design and associated regulatory approvals described in the previous TRS. Since completion of the previous TRS, the project has progressed through detailed engineering design, land acquisition, regulatory approval and eventual construction. The resulting RTSF represents the final engineered implementation of the tailings deposition strategy and provides the basis for long term tailings storage within the FWGR operation. The design is documented in the GTSA RTSF Design Report (2023). The design development process included a comprehensive review of the original facility configuration and deposition philosophy. Consideration was given to long term operational sustainability, environmental performance, water management, construction practicality, overall project economics and compliance with applicable regulatory requirements. A key design constraint was that the facility footprint remains within the approved WUL property boundary while maintaining sufficient capacity to support the LoM production plan. The final design has been developed to accommodate a capacity of approximately 800Mt of tailings over two development stages and support a maximum tailings deposition rate of 2.4Mtpm. The design philosophy adopted for the RTSF extends beyond the provision of tailings storage capacity and seeks to establish a stable and sustainable landform that can be progressively rehabilitated throughout the operational life of the facility. In this regard, the design objective adopted by FWGR was the development of an indefinitely sustainable landscape that, at worst, has a benign but preferably positive socio-environmental impact. Following evaluation of a number of disposal methodologies and engagement with the relevant regulatory authorities, the RTSF was designed as a fourth generation low-feed-density cyclone ring dyke facility incorporating a pumped decant system, an approved barrier system, integrated water management infrastructure and progressive rehabilitation of the outer slopes. The final facility configuration was selected to provide a balance between operational efficiency, environmental performance, long term stability and responsible land stewardship. 15.2.1. Design Criteria and Basis of Design The final RTSF design was developed by GTSA as the basis for the long term deposition of tailings generated by the FWGR operation. The design was undertaken within the constraints of the approved project footprint and WUL requirements while accommodating the projected LoM tailings inventory and production rates. The final design was developed from the original feasibility level design and incorporates the outcomes of additional geotechnical investigations, optimization studies and regulatory engagement completed since publication of the previous TRS. Key design considerations included maximizing storage efficiency within the approved footprint, reducing long term operational risks, improving water recovery, accommodating progressive rehabilitation and establishing a facility capable of supporting the planned expansion of processing capacity. Consideration was also given to long term closure requirements and the objective of creating a stable post-mining landform with a sustainable future land use potential. The selected solution comprises a fourth generation low feed density cyclone ring dyke TSF incorporating a pumped decant system, integrated return water management infrastructure and an Alternative Barrier System as approved through the regulatory process. The selected deposition methodology allows efficient storage utilization, controlled rates of rise and progressive development of the facility over the planned operating life. 94 Far West Gold Recoveries (Proprietary) Limited Document No: PR/SMI/1684/26 Table 15: RTSF Design Basis Summary Item Description Value / Output Source 1 Topographical Survey 1.1 LIDAR Survey Survey date: August 1, 2022 GTSA 1.2 Coordinate System Hartebeeshoek94 WG27 GTSA 2 Process Criteria 2.1 Tailings Deposition Rate Year 1 to 3: 1.2 million dry tpm Year 4 to 6: 1.8 million dry tpm Year 7 onwards: 2.4 million dry tpm FWGR 2.2 Tailings Storage Capacity Stage 1 = 278 million dry t Stage 2 = 522 million dry t Total = 800 million dry t FWGR 2.3 Design Life Stage 1 = 12 years Stage 2 = 18 years Total = 30 years FWGR 2.4 Solids SG 2.72 FWGR 2.5 Relative Slurry Density 1.35 to 1.40 FWGR 2.6 Minimum Cyclone Split 20% underflow to 80% overflow (by mass) GTSA 3 Water Management 3.1 Principles Minimize usage. Encourage drying and consolidation of the tailings. Separate clean runoff from potentially contaminated process water and divert clean stormwater away from the facility. Contain and re-use water emanating from the facility and prevent uncontrolled dirty water discharge to the environment. Discharge excess water only if structural stability is compromised. GTSA 3.2 Water Balance A continuous daily timestep water balance (GoldSim). Probabilistic and Time Series modeling. iLanda 3.3 Climatic Data MAP = 624mm MAE = 1,650mm iLanda 3.4 Storm Event 1 in 50-year, 24-hour = 119mm 1 in 10,000-year, 24-hour (PMP) = 405mm iLanda 3.5 Decant Rate Decant slurry water daily to ensure maximum decant return GTSA 3.6 Water Storage and Return Pumping Capacity The objective is to provide sufficient storage and return pumping capacity to prevent uncontrolled dirty water discharge. Water balance modeling will confirm the frequency for controlled discharges if required. The return water pumping system will be designed to return 100% of the process demand from the return water dams to the process plant. GTSA 3.7 Lining Requirement As approved by DWS GTSA 4 Structural Stability 4.1 Objective To create a safe and stable tailings storage complex and minimize the risk to human lives, health, environment and property GTSA 4.2 Overtopping The minimum freeboard target will accommodate the 1 in 50-year, 24- hour storm volume plus 0.8m dry freeboard above normal operating level (excluding decant return) or the GISTM flood criteria above normal operating level, whichever is greater GTSA 4.3 Side Slope Stability Minimum factor of safety of 1.5 for drained and undrained conditions at peak strength. Minimum factor of safety of 1.1 for undrained conditions at residual strength. Trigger analyses to be undertaken if criteria are not achieved. GTSA 5 Environmental 5.1 Objectives The design will remain fit for purpose and resist external environmental influences. Conserve land area, water, airspace, topsoil, mineralization and energy as far as possible. Minimize environmental impacts where possible. GTSA Source: Table 2, Design Criteria and Assumptions, FWGR RTSF Design Report (Rev 1, May 2023). 95 Far West Gold Recoveries (Proprietary) Limited Document No: PR/SMI/1684/26 15.2.2. Facility Layout and Storage Configuration The RTSF has been developed as a ring dyke tailings storage facility located within the approved project area approximately 10km east of Fochville. The final facility layout was optimized to maximize storage efficiency within the approved WUL boundary while maintaining operational flexibility, effective water management, long term stability and progressive rehabilitation opportunities. The design utilizes the approved site footprint and remaining available land in a manner that supports the full LoM tailings deposition requirement. The facility has been designed to accommodate approximately 800Mt of tailings and occupies a footprint of approximately 858ha. At final development, the RTSF will have an upper basin surface area of approximately 500ha and a final facility height of approximately 108m above natural ground level. The perimeter length of the toe embankment is approximately 10.7km. The final layout incorporates the RTSF, return water dams, silt traps, stockpile areas, drainage infrastructure, access roads and supporting operational infrastructure required for long term operation. A key aspect of the final design was optimization of the facility geometry. The design philosophy adopted by Geo Tail SA recognizes that facility shape has a significant influence on operational performance, water management, stability and overall project risk. Although the approved property boundaries necessitated an elongated footprint, the RTSF was configured as an ovoid ring dyke facility to retain as many of the operational and geotechnical benefits associated with a circular facility as possible. This configuration improves the area-to-perimeter ratio, promotes more efficient seepage and drainage behavior, facilitates more uniform deposition around the perimeter and assists in maintaining consistent freeboard conditions throughout the operating life of the facility. The RTSF is designed as a fourth-generation low feed density cyclone facility. Tailings slurry will be delivered from the processing plant and distributed around the perimeter through a ring main system. Cyclone deposition will be used to separate the coarse and fine fractions of the tailings stream, with cyclone underflow utilized to construct and progressively raise the perimeter embankments while cyclone overflow is discharged into the basin. This approach promotes efficient utilization of storage volume, supports the required rates of rise and provides a more compact and operationally efficient facility than the deposition methodology considered during the original feasibility study. Development of the facility will occur in a staged manner. Stage 1 has been designed to accommodate approximately 278Mt of tailings and Stage 2 a further 522Mt, resulting in a total storage capacity of approximately 800Mt. The staged configuration allows construction and operational activities to remain aligned with planned production growth while ensuring sufficient storage capacity is maintained throughout the LoM. The design life of the facility is approximately thirty years, comprising approximately twelve years for Stage 1 and eighteen years for Stage 2. The perimeter embankment system comprises a toe embankment, a substantial starter embankment and subsequent cyclone underflow raises. The starter embankment ranges from approximately 2m to 18m in height and serves the important function of separating cyclone underflow and overflow during the early stages of facility development until the perimeter wall has been sufficiently established. Material required for embankment construction is sourced predominantly from within the RTSF footprint, thereby limiting disturbance outside the approved project area while simultaneously increasing available storage volume within the basin. 96 Far West Gold Recoveries (Proprietary) Limited Document No: PR/SMI/1684/26 The final side slope configuration comprises intermediate slopes of approximately 1V:3H separated by 10m wide benches at 10m vertical intervals, resulting in an overall side slope angle of approximately 1V:4H. This geometry was selected as a practical balance between geotechnical stability, operational access, stormwater management and progressive rehabilitation requirements. Bench access also facilitates deposition operations, maintenance activities and long-term erosion management. Progressive rehabilitation forms an integral component of the facility layout and operating philosophy. Outer slopes will be progressively clad with selected growth medium and established vegetation as development advances. This approach reduces the final closure liability, limits dust generation and erosion potential, and supports the long-term objective of creating a stable post-mining landform. Designated stockpile areas have been incorporated into the facility layout to store topsoil, spoil and cladding materials recovered from the footprint during construction for subsequent use in rehabilitation activities. The final RTSF layout therefore provides a fully integrated long term tailings storage solution incorporating deposition infrastructure, water management facilities, seepage collection systems, return water infrastructure, operational access and progressive rehabilitation measures. The configuration represents a significant advancement from the conceptual facility presented in the previous TRS and forms the basis for safe, sustainable and efficient tailings management throughout the remaining life of the FWGR operation. Figure 25: RTSF Footprint Source: FWGR, 2026

97 Far West Gold Recoveries (Proprietary) Limited Document No: PR/SMI/1684/26 15.2.3. Water Management and Environmental Controls Water management and environmental protection formed key components of the RTSF design process and were fundamental considerations during optimization of the original feasibility level design. The final RTSF design incorporates an integrated water management system developed to maximize water recovery, minimize environmental impacts, maintain regulatory compliance and support the long term operational and closure objectives of the facility. The water management philosophy adopted for the RTSF is based on minimizing water consumption, encouraging drying and consolidation of the deposited tailings, separating clean and dirty water systems, containing and reusing contact water, and preventing uncontrolled discharges to the environment. The RTSF has been designed as a hydrologically closed ring dyke facility. Tailings slurry and rainfall reporting to the basin are retained within the facility where water is either entrained within the deposited tailings, recovered through the return water system, evaporated, or collected through the underdrainage network. The substantial storage capacity available within the basin provides significant attenuation capacity during extreme rainfall events and substantially reduces the risk of overtopping during operations. The minimum design freeboard incorporates the 1 in 50-year, twenty four hour storm event together with additional dry freeboard requirements and consideration of GISTM flood criteria. As noted in the previous TRS, geochemical investigations classified the tailings as a Type 3 waste stream requiring a Class C liner system or equivalent containment measure. During the regulatory approval process, the Department of Water and Sanitation approved the use of an Alternative Barrier System in place of the conventional Class C liner configuration. The final RTSF design has therefore been developed around the approved Alternative Barrier System and incorporates this requirement throughout the detailed engineering design. The liner system comprises a prepared foundation layer, HDPE geomembrane, selected drainage layers and the deposited tailings profile, together with seepage interception and recovery infrastructure. The facility incorporates a comprehensive seepage control and recovery system designed to minimize impacts on underlying groundwater resources while maintaining long term geotechnical stability. The underdrainage system includes toe drains, intermediate drains, main drains, borrow pit drains and radial drains positioned throughout the facility to intercept seepage, manage pore pressures and promote drainage within the deposited tailings mass. Water recovered through the underdrain system is collected via a dedicated collector pipeline network and transferred to the return water circuit for reuse within the operation. Detailed seepage modeling undertaken as part of the final design indicated that the approved barrier system and drainage network substantially limit seepage losses from the facility. The modeling predicted net seepage losses of approximately 147m³/day, equivalent to approximately 1.7l/s or 5.5mm/a over the footprint area. Groundwater modeling further concluded that potential seepage impacts would remain largely confined within the footprint area and immediately adjacent shallow weathered profile, provided that the facility continues to operate in accordance with the design intent and monitoring requirements. The water recovery system comprises a pumped decant arrangement together with a series of return water dams. Supernatant water reporting to the central basin pool is recovered through a decant system and transferred to Return Water Dams 1 and 2 before being returned to the processing circuit. Seepage recoveries and dirty stormwater collected through the underdrainage and surface water systems are diverted to Return Water Dams 3 and 4, from where the water is pumped back into the primary return water circuit for reuse. This arrangement maximizes process water recovery and reduces reliance on external water sources. 98 Far West Gold Recoveries (Proprietary) Limited Document No: PR/SMI/1684/26 Water balance modeling undertaken for the RTSF demonstrated that the proposed infrastructure is capable of supporting the planned deposition rates and operational requirements. The design was developed using probabilistic rainfall modeling and dynamic water balance simulations to evaluate facility performance over the anticipated 30-year operating life. The modeling indicates an average annual water recovery of approximately 59%, which is consistent with the performance achieved at comparable DRDGOLD operations including Brakpan and Driefontein 4. The RTSF operating pool is expected to maintain a normal operating storage volume of approximately 1.5Mm³ while retaining substantial contingency capacity during extreme rainfall events. Stormwater management measures have been incorporated into both the operational and rehabilitated portions of the facility. Clean runoff from external catchments is diverted around the RTSF footprint to prevent unnecessary reporting of clean water to the facility. Dirty runoff generated within the operational areas is collected, contained and recycled through the return water system. As rehabilitation progresses, runoff from rehabilitated slopes is classified as clean water and discharged via a series of engineered channels and chutes designed to safely convey stormwater to the receiving environment while preventing erosion of rehabilitated surfaces. Progressive rehabilitation forms an important component of the environmental management strategy. The outer slopes of the RTSF will be progressively cladded using selected soil and rock materials obtained from the footprint area and vegetated throughout the operating life of the facility. This approach reduces dust generation, limits erosion potential, improves stormwater management performance and progressively reduces the environmental liability associated with the facility. The closure philosophy adopted for the RTSF is aimed at developing a stable and sustainable long-term landform capable of supporting an environmentally acceptable post-mining land use. The final RTSF configuration therefore integrates containment measures, seepage management infrastructure, water recovery systems, stormwater controls and progressive rehabilitation into a single coordinated design. The adopted approach represents a significant advancement from the conceptual arrangements considered during the feasibility stage and provides a robust framework for environmentally responsible tailings management throughout the operating life of the FWGR project and beyond. 15.2.4. Construction Status and Implementation The RTSF project has progressed significantly since publication of the previous TRS and has advanced from the design and permitting phase into implementation. Detailed engineering has been completed, all land required for the development has been secured and substantial capital expenditure has been committed to the construction of the RTSF and associated infrastructure. The project now represents the approved long term tailings deposition solution for FWGR. Construction of Stage 1 of the RTSF is currently in its final stages, with physical completion anticipated by Q2 FY2027. 15.3. Technical Studies - Water Water is required for the hydro-mining of the TSF’s and for the processing of the reclaimed material. FWGR commissioned an external assessment of the water requirement for an expanded operation in 2020. The work involved modeling the waterflows to establish a water balance for the operation at steady state. The inputs to the model were examined by Sound Mining and found to be appropriate. The planned water supply will primarily be from the RTSF return water and make-up water from underground water sources (Figure 26). 99 Far West Gold Recoveries (Proprietary) Limited Document No: PR/SMI/1684/26 Figure 26: TSF Location, Make-up Water Shafts, Processing Plants and Pipeline Layouts Source: Sound Mining, 2026 Kloof 10 shaft, which is located at the Libanon TSF, and Driefontein 10 shaft, located adjacent to the DP2, are a source of make-up water for the hydro-mining of Kloof 1 TSF, Kloof 2 TSF Libanon TSF, Venterspost North TSF and Venterspost South TSF. Two WULs have been granted for the Kloof and Driefontein operating areas, which permit the pumping of water from nearby underground workings as presented in Table 16. Table 16: Underground Water Sources Facility Permitted Quantity (m3/a) Kloof 10 Shaft 9,487,500 Driefontein 10 Shaft 2,555,000 Source: Sound Mining, 2022; and FWGR, 2020 Return water from Driefontein 4 TSF is currently re-used for the reclamation of the Driefontein 5 and Driefontein 3 TSFs and associated processing at DP2. Make-up water is sourced from Driefontein 10 shaft (~6,000m3/d). 100 Far West Gold Recoveries (Proprietary) Limited Document No: PR/SMI/1684/26 Water and slurry from the hydro-mining of distal TSFs will be pumped to the pumping stations closer to the hydro-mining sites to piggy-back off these sites to avoid having to use additional Booster Pump Stations (BPS). The water pumps at DP2 supply sufficient pressure for the Driefontein 5 TSF and Driefontein 3 TSF hydro-mining operations. High-pressure water pumps will be placed at the various TSFs (i.e., excluding Driefontein 3 TSF) to avoid having high- pressure water pipelines between the hydro-mining sites and the processing plant. They will be utilized in series to deliver the required pressure of 25bar to 30bar, for hydro-mining. Approximately 42,000m³/d of water will be returned from the deposition facilities to support the DP2 expansion facility, with make-up water pumped from Driefontein 10 shaft to DP2 or the relevant mining sites as required. Each production unit (or monitor) requires in the order of 10,500m3/d for the hydro-mining of TSF material and each site will have two monitor units running and one on standby during steady state operations. Water will be recovered from the various deposition facilities and returned to the system. Make-up water (i.e., 30% - 40% of the total water requirement) will be required to compensate after accounting for losses and rainfall (~18,000m3/d), with Kloof 10 shaft alone, having ample available capacity (~36,000m3/d). 15.3.1. Concluding Comments The available water supply more than adequately meets the FWGR requirements including the make-up water during the dry season. The supply from Driefontein 10 shaft and Kloof 10 shaft do not exceed the permissible pumping rates approved in the WULs. According to the WULs the return water will be treated in an advanced water treatment facility and discharged into Leeuspruit or disposed to dust suppression. Instead of this open configuration FWGR has opted for a closed water system throughout the LoM so no water treatment or discharge into the surface water courses will occur. The final water still in use at the point of closure will be deposited onto the RTSF for evaporation, or an alternative water treatment and use will be considered. 15.4. Technical Studies - Power The power supply and Point of Delivery (PoD) for the operations has been determined by independent specialists. These have been reviewed and are deemed appropriate for the operation. Power is currently supplied to transformers at the various sites (Table 17) from Eskom’s 132kV and 44kV grid, where the voltage is reduced to 6.6kV. Table 17: Power Requirements for FWGR Operations Site Installed (kVA) Used (kVA) Available (kVA) Comments Driefontein 8 Shaft 20,000 11,000 9,000 Sufficient for reclamation operations Driefontein 13 Shaft 10,000 6,600 3,400 DP2 40,000 - 40,000 18,000kVA required by DP2 at 1.2Mtpm capacity Libanon 40,000 22,000 18,000 Sufficient for reclamation operations Kloof 4 Shaft 80,000 64,000 16,000 3,500kVA required by RTSF Kloof Main Complex 140,000 81,000 59,000 Leeudoorn Shaft 100,000 61,000 39,000 2,500kVA required by Leeudoorn TSF Total 430,000 245,600 184,400 Source: FWGR, 2026

101 Far West Gold Recoveries (Proprietary) Limited Document No: PR/SMI/1684/26 The capital estimates take account of the available equipment at the respective substations and routing from the substations. The PoDs feeding the substations are shown in Table 18. Table 18: Eskom Points of Delivery Eskom PoD NMD Maximum Utilized NMD Transformer Size Comments Driefontein 8 Shaft 14.0MVA 11.0MVA 4 by 5MVA Driefontein 13 Shaft 4.3MVA 6.6MVA 4 by 5MVA There are sufficient transformers Kloof 1 Shaft (132kV) 81MVA 81MVA 7 by 20MVA Libanon Shaft 5.2MVA 6.92MVA 1 by 20MVA Libanon Gold 22MVA 19.3MVA 2 by 20MVA Source: FWGR, 2026 Suitable PoDs have been identified for the FWGR operations. Eskom will be notified of the increased load - Nominal Maximum Demand (NMD) to be catered for within the existing contracts - at the appropriate time. Overhead lines will be utilized as far as possible to reduce the installation costs and reduce the risk of cable theft. The aggregate load requirement has been based on a conservative diversity factor of 0.8 for the low voltage loads, which represents a relatively flat load profile. The current Eskom supply is stable in that it is linked to the main ring feed. There is a curtailment agreement in place and only under severe power disruption would the area lose supply. In this case there is still sufficient capacity to run the vital plant areas by shutting down the milling section and using diesel generators which will provide enough emergency power to ensure that selected critical process plant equipment is able to re-start immediately in the event of a power failure. DRDGOLD has entered into an electricity supply agreement with the NOA Group Assets (Proprietary) Limited (NOA Group), for the provision of approximately 76GWh per annum of renewable energy, with supply scheduled to commence in January 2028. NOA Group is a South African independent power producer, energy aggregator and energy trader, and holds an electricity trading license from the National Energy Regulator of South Africa (NERSA). This agreement supports DRDGOLD’s objective of reducing its carbon footprint and aligns with the anticipated increase in production at FWGR. 15.4.1. Concluding Comment It is noted by Sound Mining that the power estimates determined are considered appropriate for the planned operations. The power requirement to the various components of the FWGR operation is within the spare capacity available to the related ongoing and current underground mining and processing operations. Management will need to ensure timely modifications to the agreements with Eskom and sufficient allowance for the rising cost of power. 15.5. Technical Studies - Pipelines and Pumping FWGR’s expansion planning requires a network of slurry pipelines from the TSF sites to DP2, and tailings pipelines from DP2 to the RTSF. High pressure pumps will provide the mining operations with the pressures they require (25bar to 30bar). This eliminates having to install high-pressure pipelines from the processing plants to the TSF sites. FWGR worked with specialists on the design and cost estimates for the pipelines. Cognizance was also taken of the environment, mine owned land and already disturbed areas. The pipeline layout has been designed to make use of the shortest possible routes, while also using existing mine servitudes as far as possible. Use was made of the road servitudes to prevent additional impacts associated with the clearing and construction of the pipelines, and to ensure that the pipelines are easily accessed for maintenance. Alternative routes were also considered to avoid wetland areas; and existing impacted land, in the context of the effect on operating costs due to the influence of topographical and pumping costs. A summary of the pipeline and pumping infrastructure (Figure 26), is provided in Table 19. 102 Far West Gold Recoveries (Proprietary) Limited Document No: PR/SMI/1684/26 Table 19: Existing Pipeline and Pumping Infrastructure Existing Pipeline and Pumping Infrastructure Approvals Pre-screening and Slurry Pumping Reclamation Station at Driefontein 5 TSF Hydraulic Mining Site Approved EA and Environmental Management Plan (EMP) Fine Screening and Slurry Transfer Pump Station at Mining Site Approved EA and EMP Slurry Pipeline between Driefontein 5 TSF and DP2 Approved EA and EMP Tailings Pipeline from DP2 to Driefontein 4 TSF Approved EA and EMP Return Water Dam at Driefontein 4 TSF and Process Water Supply to DP2 Approved EA and EMP Process Water Make-up Storage and Pump Station at Driefontein 10 Shaft Approved EA, Integrated Water Use Licenses (IWUL) and EMP Process Water from Driefontein 10 Shaft to DP2 Approved EA, IWUL and EMP Pre-screening and Slurry Pumping Reclamation Stations at Driefontein 3 TSF Approved EA and EMP Pre-screening and Slurry Pumping Reclamation Stations at Libanon TSF Approved EA and EMP Slurry Pipeline from Libanon TSF to DP2 Approved EA and EMP Water Pipeline from DP2 to Driefontein 3 TSF Approved EA and EMP Slurry Pipeline from DP2 to the RTSF Approved EA and EMP Slurry Pipeline from Libanon TSF to DP2 Approved EA and EMP Source: Sound Mining, 2026 A summary of the additional piping requirements is presented in Table 20. Table 20: Additional Pipeline and Pumping Infrastructure Planned Pipeline and Pumping Infrastructure Approvals Pre-screening and Slurry Pumping Reclamation Stations at Kloof 1 TSF Approved IEA and EMP Pre-screening and Slurry Pumping Reclamation Stations at Venterspost North TSF Approved IEA and EMP Pre-screening and Slurry Pumping Reclamation Stations at Venterspost South TSF Approved IEA and EMP Slurry Pipeline from Venterspost South TSF to Libanon TSF Approved IEA and EMP Slurry Pipeline from Kloof 1 TSF to DP2 Approved IEA and EMP Process Water Make-up Storage and Pump Station at Kloof 10 Shaft Approved IEA, IWUL and EMP Process Water from Kloof 10 Shaft to DP2 Approved IEA, IWUL and EMP Slurry Pipeline from Kloof 2 TSF to DP2 Approved IEA and EMP Source: Sound Mining, 2026 15.5.1. Concluding Comments The QP considers the pipeline infrastructure design to be well-engineered and underpinned by practical experience. There appear to be no fatal flaws in the thinking behind amendments to various EIAs and EMPs to accommodate the changes to the pipeline and pumping infrastructure. 103 Far West Gold Recoveries (Proprietary) Limited Document No: PR/SMI/1684/26 16. GOLD MARKET ITEM 16 (I) AND (II) Gold is a precious metal, which serves a dual role as both a commodity and a monetary asset. It is widely used in jewelry, private investment products, central bank reserves, technology applications, dentistry, and various industrial processes. Unlike most commodities, gold is virtually indestructible with substantial above-ground stocks having accumulated (Table 21). Table 21: Above Ground Gold Stocks in 2025 Description Quantity (kt) Contribution (%) Jewelry 99.7 45.2 Private Investment 51.0 23.1 Bank Holdings 38.6 17.5 Other 31.4 14.2 Source: GoldHub, 2026 These inventories are a distinctive feature of the gold market and contribute to gold’s unique pricing characteristics when compared to industrial commodities. 16.1. Gold Price Trends The QP has considered the historical trendlines in Graph 4 and Graph 5 to form an opinion of the gold price and exchange rate used to estimate the mineral reserves. The QP is of the opinion that the period sufficiently covers the market volatility seen in the international gold market. Graph 4: Gold Price Historical Trendline Source: Heraeus-precious-metals, 2026 Gold Prices have strengthened significantly over the past three years, supported by sustained central bank purchasing, geopolitical uncertainty, inflation concerns, and increased investor demand for safe-haven assets. The gold price increased to USD5,033.29/oz (i.e., ~ZAR2,589,224.19/kg at ZAR16/USD) in 2026. It has since declined to a spot price of USD4,015.51/oz as at June 30, 2026 (Graph 4). 0 1 000 2 000 3 000 4 000 5 000 6 000 M a y 2 0 1 7 N o v 2 0 1 7 M a y 2 0 1 8 N o v 2 0 1 8 M a y 2 0 1 9 N o v 2 0 1 9 M a y 2 0 2 0 N o v 2 0 2 0 M a y 2 0 2 1 N o v 2 0 2 1 M a y 2 0 2 2 N o v 2 0 2 2 M a y 2 0 2 3 N o v 2 0 2 3 M a y 2 0 2 4 N o v 2 0 2 4 M a y 2 0 2 5 N o v 2 0 2 5 M a y 2 0 2 6 G o ld P ri c e ( U S D /O z ) 104 Far West Gold Recoveries (Proprietary) Limited Document No: PR/SMI/1684/26 The economic assessment for the Mineral Reserve estimate has utilized a real price of ZAR2,155,461/kg (i.e., USD4,113/oz at ZAR16.30/USD) in June 30, 2026, terms. This aligns with the price used by FWGR for its annual business plan and is considered to be both realistic and reasonable for the purpose of estimating the Mineral Reserves. 16.2. Exchange Rate Forecast The ZAR to USD exchange rate reached a high of ZAR19.78/USD in May 2023 but has since dropped back to circa ZAR16/USD (Graph 5). The spot exchange rate as at June 30, 2026, was ZAR16.27/USD. Graph 5: Exchange Rate Historical Trendline Source: GoldHub, 2026 Various service providers and financial institutions can also be consulted to determine consensus forecasts of the gold price (Table 22). Table 22: Long Term Consensus Forecasts in Nominal Terms Description Year 1 (FY2026) Year 2 (FY2027) Year 3 (FY2028) Year 4 (FY2029) Year 5 (FY2030) Gold Price (USD/oz) 4,849 4,954 4,895 4,847 4,505 Exchange Rate (ZAR/USD) 16.30 16.20 16.50 16.80 17.10 Gold Price (ZAR/kg) 2,458,378 2,496,203 2,512,150 2,532,743 2,396,071 Source: Sound Mining, 2026 The QP considered the price assumption used for the Mineral Reserve estimate against linear trends in the demand and supply of gold as recorded over the period from 2015 to 2025 to form an independent opinion on whether it is reasonable. 10 12 14 16 18 20 22 J u n 2 0 1 7 D e c 2 0 1 7 J u n 2 0 1 8 D e c 2 0 1 8 J u n 2 0 1 9 D e c 2 0 1 9 J u n 2 0 2 0 D e c 2 0 2 0 J u n 2 0 2 1 D e c 2 0 2 1 J u n 2 0 2 2 D e c 2 0 2 2 J u n 2 0 2 3 D e c 2 0 2 3 J u n 2 0 2 4 D e c 2 0 2 4 J u n 2 0 2 5 D e c 2 0 2 5 J u n 2 0 2 6 E x c h a n g e R a te ( Z A R /U S D )

105 Far West Gold Recoveries (Proprietary) Limited Document No: PR/SMI/1684/26 16.3. Global Demand Graph 6 reveals a gradual increase in demand (~14.2%) over the past ten years. Graph 6: Global Gold Demand from 2015 to 2025 Source: GoldHub, 2026 16.4. Global Supply Table 23 shows the annual contributions from the top ten gold producing countries since 2015. Table 23: Global Gold Production Rank Country Production (t) 2015 2016 2017 2018 2019 2020 2021 2022 2023 2024 2025 1 China 460 464 429 404 383 368 332 375 378 380 384 2 Australia 279 288 293 313 325 328 307 306 296 284 293 3 Russia 255 262 281 295 327 332 331 330 322 330 345 4 United States of America 217 229 236 223 200 193 187 173 170 163 157 5 Peru 171 166 205 208 192 140 173 173 176 203 209 6 Canada 158 163 171 192 185 173 193 195 192 203 213 7 South Africa 157 155 147 126 113 102 114 99 106 99 99 8 Ghana 95 131 133 149 142 130 125 137 131 155 187 9 Indonesia 112 161 146 166 100 74 98 139 155 139 104 10 Mexico 132 131 120 118 109 110 125 124 127 118 114 Source: GoldHub, 2026 China is the largest gold producer contributing approximately 8% to global production during 2025. Graph 7 shows a relatively stable and increasing trend in the global supply of gold from mining and recycling activities since 2015. 0 1 000 2 000 3 000 4 000 5 000 6 000 2015 2016 2017 2018 2019 2020 2021 2022 2023 2024 2025 G o ld D e m a n d ( T o n s ) 106 Far West Gold Recoveries (Proprietary) Limited Document No: PR/SMI/1684/26 Graph 7: Global Gold Supply from 2015 to 2025 Source: GoldHub, 2026 These graphs indicate a reasonably stable gold market in the context of the prevailing gold price environment, which supports the QPs opinion that the gold price assumption is reasonable. 16.5. Concluding Comments It is noted that all gold produced by DRDGOLD is sold directly to South African bullion banks at prevailing market prices denominated in South African Rand (ZAR). The QP notes a reasonable consistent trend in the gold market against an elevated trend in the gold price. The QP considers the real June 30, 2026, gold price of ZAR2,155,461/kg to be an appropriately conservative assumption for examining the economic viability of the Mineral Reserve estimate (i.e., against a spot price of R2,118,590.46/kg as at June 30, 2026). 0 1 000 2 000 3 000 4 000 5 000 6 000 2015 2016 2017 2018 2019 2020 2021 2022 2023 2024 2025 G o ld S u p p ly ( T o n s ) Mine Production Recycled Gold 107 Far West Gold Recoveries (Proprietary) Limited Document No: PR/SMI/1684/26 17. ENVIRONMENTAL STUDIES, PERMITTING, OR AGREEMENTS WITH LOCAL INDIVIDUALS OR GROUPS ITEM 17 (I); (II); (III); (IV); (V); (VI) AND (VII) A review of environmental status of FWGR’s assets was undertaken by an independent environmental specialist. It relies on information provided by DRDGOLD and FWGR. The key environmental aspects are discussed below, along with any associated liabilities and risks. Risks or liabilities, that would generally be addressed in terms of accepted environmental practice, and which do not have significant cost implications, have not been discussed. 17.1. Permitting Status The environmental and social compliance status in relation to South African legislation is summarized in Item 21. The following expands the relevant authorizations or permits required. 17.1.1. The National Environmental Management Act EAs have been granted in terms of NEMA and the EIA Regulations of 2014 as described below. Driefontein Mining Right Area: in March 2016, Sibanye Gold Limited submitted an application for an IEA including a Waste Management License (WML) for the proposed activities on the Driefontein Mining Right area (DMPR) Ref. No.: GP 30/5/1/2/2 (51) MR. The DMPR granted the EA Ref. No.: GP 30/5/1/2/3/2/1 (51) EM on May 11, 2018. The Driefontein MR and EA are in good legal standing. Sibanye Gold applied for a Section 102 amendment to the MR to include the Driefontein 4 TSF, which has been granted. FWGR has submitted an application to the DMPR for the transfer of the existing Driefontein EA (Ref. No.: GP 30/5/1/2/3/2/1 (51) EM) as well as the inclusion of related activities covered by the existing Driefontein EMP relevant to the FWGR operation. The amendment was for the following: • the transfer of the Driefontein EA to FWGR; • a modification to scope of how the Phase 1 operations are currently being executed; and • to include DP2, DP3 and Driefontein 4 TSF. The associated rights and approvals have since been transferred to FWGR, and all related amendments have been finalized. Permission for depositing onto the Driefontein 4 TSF is contained in the original Driefontein EMP associated with the MR. This EMP is needed for the operation’s waste management obligations. The pipelines fall within the scope of the existing infrastructure recorded in the current EA and EMP. Table 24 summarizes the current environmental legal standing for the Driefontein mining area. 108 Far West Gold Recoveries (Proprietary) Limited Document No: PR/SMI/1684/26 Table 24: Required Environmental Legislation and the Status for the Driefontein Mining Area Act, Regulation or By-Law Requirements Status Driefontein Area MPRDA, 2002 (Act No. 28 of 2002) Mining Right This is currently in place. Social and Labor Plan (SLP) FWGR has an internally signed-off SLP; however, an SLP is not required for FWGR. NEMA, 1998 (Act No. 107 of 1998): Environmental Impact Assessment Regulations 2014 (GNR 982) EA This is currently in place. EMPr/EIA Forms part of the Driefontein EMPr/EIA. The Rehabilitation and Closure Cost plan must be annually adjusted. This is guaranteed through a Guardrisk Cell Captive. National Environmental Management: Air Quality Act, 2004 (Act No. 39 of 2004) (NEM:AQA) An Atmospheric Emissions License (AEL) is required for any listed activity within this Act. N/A NEM:WA, 2008 (Act No. 59 of 2008) A WML is required for any listed activities within the Act. There is an EA in place for Driefontein. The TSFs are currently managed under Sibanye Gold’s existing EMPs which were in operation prior to the legislation coming into effect. NWA, 1998 (Act No. 36 of 1998) Any abstraction, storage, diversion, flow reduction and disposal of water and effluent requires an IWUL. This is included in the WUL. Source: FWGR, 2020; and Sound Mining, 2022 Kloof Mining Right Area: in March 2016, Sibanye Gold submitted an application for an IEA including a WML for the proposed activities on the Kloof Mining Right area (DMPR Ref. No.: GP 30/5/1/2/2 (66) MR). The DMPR granted the IEA (Ref. No.: GP 30/5/1/2/3/2/1 (66) EM on May 11, 2018. The Kloof MR is in good legal standing, and its IEA has been transferred to FWGR. Sibanye Gold has applied for two Section 102 amendments to the Kloof MR for the inclusion of the Venterspost North and South TSFs as well as land for the RTSF. The Section 102 amendment for Venterspost North and Venterspost South TSFs was granted at the end of 2021. The RTSF Section 102 amendment was granted and executed in August 2026. 17.1.2. National Environmental Waste Management Act FWGR has confirmed that their TSFs have an approved CoP on Mine Residue Deposits in accordance with the requirements of the Mine Health and Safety Act (MHSA). The TSFs on the Driefontein MR and Kloof MR are covered under this CoP. For Phase 2, the following waste management activities have been granted in terms of GNR 921 of November 13, 2013 (as amended) under the National Environmental Waste Management Act (NEM:WA), 2008 (Act No. 59 of 2008). The DMPR granted the IEA Ref. No.: GP 30/5/1/2/3/2/1 (66) EM on May 11, 2018, which has been transferred to FWGR. The waste management activities allow FWGR to construct the RTSF and associated infrastructure. The requirements under NEM:WA have been covered. Table 25: Activities for Phase 2 Requiring a Waste Management License (WML) Number of the Relevant Government Notice Listed Activity Number Authorised Description of Activity GNR 921 Activity B (1) Construction and operation of the RTSF and the sewage treatment plant GNR 921 Activity B (7) Operation of RTSF GNR 921 Activity B (11) Establishment of the RTSF Source: FWGR, 2020 17.1.3. National Water Act FWGR is operating under two authorized WULs, the Driefontein and Kloof mining areas under the License No.: 10/C22B/ACFGI/4976, and the Libanon Reclamation License no: 10/C23D/CGU/18789. The WULs are valid for a period of twelve years from the date of issuance and may be reviewed at intervals of not more than five years. Compliance is also required with the general provisions of the regulations on the use of water for mining and related activities published under the NWA in GN 704 of 1999. Storm water needs to be managed in line with GN 704 of 1999.

109 Far West Gold Recoveries (Proprietary) Limited Document No: PR/SMI/1684/26 17.2. Environmental Considerations The EIAs for the Kloof and Driefontein operation areas state that the TSFs are permanent sources of pollution. Dust from the TSFs impacts on the ambient air quality, the surrounding soils and the wetlands and surface water resources. Ground water is also significantly affected by leaching and the seepage of pollutants from the TSFs that are located over dolomitic aquifers. Any seepage from the Driefontein 3 TSF, Driefontein 4 TSF, Libanon TSF, Venterspost North TSF, Venterspost South TSF, Driefontein 5 TSF and Kloof 1 and 2 are expected to migrate downwards into the aquifers. Monitoring data indicates elevated concentrations of sulphate, total dissolved solids (TDS) and nitrate in the groundwater which are all typical constituents associated with contamination emanating from gold mining areas. Additionally, the pH ranges from 4.1 to 8.0, with the lower values further supporting an indication of Acid Mine Drainage, which is associated with seepage from existing tailings and surface mining facilities. Underground mining in these areas have significantly dewatered the dolomitic systems, which have resulted in numerous sinkhole formations. Dewatering reduces pressure within the dolomite, and this encourages drainage from the overlying TSFs. The removal of these TSFs in the region will result in long-term positive benefits to the region. It is expected that the removal of the TSFs off the underlying dolomite will improve the ground water quality near the TSFs. There is no dolomitic risk in the area of the RTSF. The RTSF site is underlain by Transvaal Supergroup Strubenkop shale, Daspoort quartzite and Silverton shale units. The baseline groundwater quality is good, As RTSF will be a fully HDPE-lined facility, the risk is lower in terms of groundwater contamination. However, this will still need to be monitored and managed if any plumes are picked up through monitoring. The main elements of concern with regards to groundwater contamination are sulphate and manganese, and to a lesser extent, arsenic, uranium and iron, which could potentially impact private boreholes and the Leeuspruit or its tributary. TSFs will be relocated to the new RTSF which is more suitably located with respect to ground water. New environmental impacts and risks associated with the RTSF will need to be adequately mitigated, and appropriate measures implemented as required. Dust measurements from the TSFs are generally within the limits specified by the National Dust Control Regulations. However, the EIA found some sites to be a problem during the dry winter months. Land is used in the region for mining activities, the cultivation of crops, and for grazing. The pipeline routes will utilize existing servitudes and mine owned land. Prior to final rehabilitation of reclaimed TSF footprints and any subsequent land development, a radiological assessment will be undertaken to identify any areas of radioactivity. Where radiological hotspots are identified, these areas will be excavated and the material transferred to the RTSF. If a site falls within the clearance requirements of the NNR for the proposed land use, a report will need to be submitted to the NNR for approval. Following approval, the site will be rehabilitated with indigenous vegetation and returned to the landowner. The RTSF is being constructed on land previously used for agricultural purposes with small pans also located within the footprint area. The EA states that a wetland offset strategy must be implemented within one year of the wetland being impacted. FWGR has commenced the wetland offset strategy as a phased approach which has been submitted to the responsible authorities. The impacts due to contaminated water run-off and windblown dust will be mitigated through the use of wind breaks, concurrent rehabilitation of the RTSF and the installation of silt traps. Clearing and grubbing of the vegetation for construction will leave the soils open to erosion which could lead to sedimentation of surface water, wetlands, and the deterioration of aquatic habitats. These impacts will be mitigated through either silt curtains, cut off drains or siltation ponds. 110 Far West Gold Recoveries (Proprietary) Limited Document No: PR/SMI/1684/26 Fauna and Flora Impact Assessments formed part of the EIAs. The vegetation comprises Carletonville Dolomite Grassland and Gauteng Shale Mountain Bushveld (both with vulnerable conservation status), as well as Rand Highveld Grassland (Endangered) and Soweto Highveld Grassland (Endangered). There are also other vegetations, namely: grasslands, ridges and wetland vegetation of high-ecological importance due to their influence on the overall ecosystem. They are seen to be valuable to maintain the biodiversity balance and therefore, should be conservation priorities. Fauna expected to occur within the area including mammals, birds, reptiles, amphibians and invertebrates. Fauna species of importance are the White-Tailed Mouse (Endangered) and Rough Haired Golden Mole (Vulnerable). Some thirty-seven bird species were identified with some of them being the “Listed Red Data” bird species. However, the Grass Owl (Vulnerable) is expected to occur within the wetland habitats. Red Data reptile species that have a low probability of occurring within the operation area include the Giant Girdled Lizard (Vulnerable) and the Striped Harlequin Snake (Rare). None of the identified amphibians are of concern. Red Data butterfly species expected to occur on site are the Marsh sylph, Roodepoort Copper and Highveld Blue. A consolidated Heritage Resources Management process was completed in 2016 for the Driefontein and Kloof Mining Right areas. No fatal flaws were identified despite the fact that the operation is situated within a sensitive cultural landscape. An external independent environmental compliance audit of the Driefontein and Kloof EAs and the EMPrs conducted in 2024 recorded no major issues and an overall compliance of 94% and 100% respectively for the EAs and 100% for the EMPRs. 17.3. Social and Political Considerations The operation is located in the vicinity of the following two local municipalities: Merafong City and Rand West Local municipalities. The RTSF is in the Rand West City and Merafong City Local Municipalities. Local towns include Fochville, Carletonville, Westonaria and Venterspost. The land is used for mining, agriculture, residential, and businesses. Agriculture covers the largest portion of the area, followed by mining and residential uses. Human settlements are relatively scattered due to the mining activities and impact of dolomite. Over a third of the local GDP is from finance, personal services and government services. The Rand West City and Merafong City economies are more dependent on the mining industry than the district in general. Merafong City has an unemployment rate of over 27.2%, while the Westonaria unemployment rate exceeds 29.5%. The expansion is expected to improve the socio-economic status with new jobs created during construction. Capital investment and contributions to the GDP as a consequence of the FWGR operations, and the obvious multiplier effect, will have a positive impact on the area. Employment opportunities include direct employment by the operation; indirect employment will be created by procuring local goods and services, induced employment generated through spending and associated job creation in the economy. Operation-related employment has the potential to considerably improve the livelihoods and income stability of employees and their dependents. 17.3.1. Discussions with Local Individuals or Groups Interested and Affected Parties (I&APs) raised concerns during the public participation phase of the Kloof EIA process. A petition of 793 signatories was compiled in this regard by the “No for Mega Dump Forum” representing the community (farmers, business owners and residential areas). The concerns raised included: • environmental impacts from the existing TSFs and whether the FWGR operation would worsen the conditions; • dust being a major concern for health reasons; • safety and security on surrounding farms; • water quality; • population influx; and • reduced economic activity within the local community after the LoM. 111 Far West Gold Recoveries (Proprietary) Limited Document No: PR/SMI/1684/26 Some of the I&APs acknowledged that the FWGR operation would have a long-term positive impact by removing TSFs. Other positive impacts were expected skills development, employment creation and the benefits of the multiplier effect where local procurement of goods and services, as well as local and regional economic development would benefit. Improved quality of life and increased availability of land were also cited as positive impacts. These will be managed by the FWGR Social and Labor Plan (SLP). The Social Impact Assessment (SIA) revealed political and community expectations for sharing in the benefits by local communities. Local municipalities sometimes claim that they are disproportionately benefiting, or not benefiting at all, from mining when compared with district municipalities and the provinces at large. It is not the responsibility of FWGR to control informal settlements or to provide public services and facilities. However, the existence of informal settlements near the operations poses a risk to the operation in terms of political stability and community relations/support. This has, however, improved through an ongoing quarterly meeting set up by the FWGR Environmental Department where farmers and landowners adjacent to the operations can raise any concerns that they may have and ask questions relating to environmental matters. Similar forums have been set up by the FWGR HR Department in collaboration with FWGR CSI partners for discussions on labor and development. A social and labor plan exists to address any negative social impacts of the operation on host communities. Potential positive impacts on host communities are continually optimized and enhanced in a sustainable manner. Emphasis will be placed on skills development and local economic development as these aspects would constitute the foundation for enhancing the operation’s social capital. Moreover, negative impacts, such as increased pressure on infrastructure and services, and economic dependence on FWGR can be more effectively mitigated when the social capital of the operations are enhanced through ongoing community engagement, socio-economic development initiatives and skills development programs. It is anticipated that the consequence and/or probability of most negative impacts can be reduced to acceptable levels and that the positive impacts of the operations will outweigh the negative effects. 112 Far West Gold Recoveries (Proprietary) Limited Document No: PR/SMI/1684/26 17.4. Environmental Closure Liability Estimate A review of the closure estimates and associated plans covers the following aspects: • discussion of the methodology used to derive the costs for demolition, closure and rehabilitation; and • comment on the adequacy of the financial provisions made for the operation. 17.4.1. Basis of the Closure Liability Estimate The closure cost assessment was conducted according to the requirements of NEMA as amended (refer to Item 13), by Digby Wells in May 2026. The purpose of the financial provision assessment was to revise the existing estimate for closure and rehabilitation to reflect current conditions as of June 2026. The assessment was undertaken using third-party rates from Digby Wells’ database and contractor – and mine- specific rates supplied by FWGR, where applicable. 17.4.2. Quantum of the Closure Liability The closure cost estimate is for the purpose of reporting the liability in the annual financial statements of FWGR. NEMA as amended, requires the holder of a MR to make full financial provision for the rehabilitation of negative environmental impacts. This liability is required to be updated annually and adjusted. The closure costs are determined on both an “unscheduled” and “scheduled” basis. Scheduled costs assume that mining continues and that the final rehabilitation will be confined to the rehabilitation of the TSF footprints. Unscheduled costs assume the immediate termination of mining and provide rehabilitation of the area in its current condition. The detailed closure cost model calculates the cost of demolishing, removing and rehabilitating each infrastructure component which may include (but is not limited to): • rehabilitation of the pump station and pipeline footprints; • generalized rehabilitation and vegetation management strategies; • ensuring the reclaimed footprints are free draining; • vegetating the TSFs that will remain post closure; • radiation clearance for each rehabilitated footprint; • post-closure maintenance and monitoring costs; and • FWGR has provided for the quantum of the financial guarantees on an unscheduled estimate basis. The 2026 closure cost assessment estimated the total closure liability at ZAR468 M (excluding VAT) for the unscheduled closure scenario and ZAR381 M (excluding VAT) for the scheduled closure scenario, inclusive of project management and contingency allowances. Updates to the 2026 assessment included updated electricity and Rand Water rates, updated vegetation establishment quotations, revised vegetation monitoring and maintenance rates, updated groundwater monitoring rates inclusion of the DP2 expansion based on the current construction status, updated rehabilitation extents for Driefontein 4 and Driefontein 5 TSFs, inclusion of RTSF-related infrastructure and disturbance areas, and updated pipeline infrastructure. FWGR has provided the quantum of the financial guarantees on an unscheduled closure estimate basis. Table 26 presents the closure cost estimates of the June 2026 Digby Wells Annual Financial Provision Assessment.

113 Far West Gold Recoveries (Proprietary) Limited Document No: PR/SMI/1684/26 Table 26: Current Closure Cost Estimates for FWGR Asset Unscheduled Cost 2026 (ZAR M) Scheduled Cost 2026 (ZAR M) Driefontein 5 TSF 14.6 14.6 Driefontein 3 TSF 24.6 24.6 Kloof 1 TSF 28.2 20.9 Kloof 2 TSF 53.9 28.0 Libanon TSF 39.4 26.1 Venterspost North TSF 44.2 21.7 Venterspost South TSF 13.4 8.5 DP2 65.8 65.8 Driefontein 4 TSF 38.9 37.4 Pipelines 22.3 22.3 Regional Tailings Storage Facility (RTSF) 53.6 53.6 Pump electricity and maintenance 4.7 4.7 Project Management 24.2 19.7 Contingency 40.4 32.8 Total 468.2 380.7 Source: Digby Wells, 2026 Note: Apparent computational errors due to rounding This table includes the Post Closure Aspect Costs As mining of the TSFs progress, the liability for rehabilitation and closure will decrease from the current unscheduled cost of ZAR468.2 M to a final scheduled cost of ZAR380.7 M. FWGR will make appropriate application to the DMPR for adjustments to the closure obligation to cater for this decreasing liability. Guardrisk Insurance Company Limited (GICL) has issued financial guarantees in favor of the DMPR of ZAR481.9 M. An amount of ZAR634.0 M is also invested in Guardrisk Cell Captive under the ring-fenced environmental rehabilitation insurance policy. The funds are ring-fenced for the sole objective of future rehabilitation activities during and at the end of the LoM. The financial guarantees and funds held with the Guardrisk Cell Captive (June 30, 2026) are sufficient to cover the estimated unscheduled liability of ZAR468.2 M as estimated for the operation. Moreover, the environmental rehabilitation fund of ZAR117.4 M for the Kloof 2 TSF is still to be transferred to FWGR from Sibanye Gold in accordance with the Exchange Agreement. Table 26 also shows the closure liability for the RTSF calculated in the 2016 Digby Wells EIA and Environmental and Management Program Report Under Regulation 7 of the NEMA Financial Provision Regulations (2015) which states that the financial provision is, at any given time, equal to the sum of the actual costs of implementing the plans for a period of at least ten years forthwith (this includes the annual rehabilitation, final, decommissioning and closure plans). Sound Mining has been informed by FWGR that a ZAR169.0 M of the closure cost estimate for the RTSF has been guaranteed by FWGR through Guardrisk and satisfies the IEA requirements. 114 Far West Gold Recoveries (Proprietary) Limited Document No: PR/SMI/1684/26 17.5. Concluding Comments The FWGR IWUL for the RTSF was approved and construction commenced in June 2024. It is the opinion of the environmental specialist that the FWGR operations have been well planned and executed thus far. The legislative requirements have been identified and addressed, and where there are gaps, measures are being taken to address them. The identified risks are well understood by FWGR and at the time of this TRS are being addressed to avoid any significant impact on the operations. No fatal flaws were identified during this review. An insurance policy through Guardrisk of ZAR481.9 M, combined with the current balance in the Guardrisk Cell Captive of ZAR634.0 M is sufficient to cover the 2026 unscheduled liability of ZAR468.24 M as estimated for the operation. Cognizance needs to be taken of the following: • a risk assessment should be completed as per Government Gazette No.: GNR 1147 the NEMA Financial Provision Regulations (2015) (as amended January 2020) to determine any residual or latent costs to be included; • the RTSF design has been approved and construction has commenced; • illegal mining activities, and nearby informal settlements may encroach on the operations. In terms of the Extension of Security of Tenure Act, 1997 (Act No. 62 of 1997) (ESTA), any land occupiers may also be entitled to certain tenure rights, which could prevent landowners and government from evicting them unless the provisions of ESTA have been met; • dust resulting from the TSFs and the mining activities needs to be managed, and an investigation into the applicability of the Air Quality Act must be undertaken; • the quality or quantity of water available to agricultural activities needs to be preserved; and • constant vigilance is recommended to prevent illegal mining. These are being addressed according to the required timelines. 115 Far West Gold Recoveries (Proprietary) Limited Document No: PR/SMI/1684/26 18. CAPITAL AND OPERATING COSTS ITEM 18 (I) AND (II) The capital requirement and operating cost estimates have been informed by current operations and feasibility study work that covered mining, processing, the RTSF, and associated pumping and piping infrastructure. The QP deems these estimates to have been determined to within an accuracy level of –5%, +15%. The Phase 1 operation is nearing completion as it transitions to Phase 2, as described previously for the FWGR project. Some of the previous estimates have been replaced due to the increased certainty provided by data from the actual operations. The remaining estimates were appropriately inflated to June 2026 real terms, where deemed necessary. Sound Mining has included a 15% contingency on all costs to reflect the confidence ascribed to the estimates. 18.1. Capital Expenditure The capital estimates were determined by applying unit rates obtained from quotations or from the actual costs experienced for recent installations, to the designed quantities. Table 27 presents the latest capital expenditure estimate for the FWGR LoM planning (i.e. as at June 30, 2026, real terms). Table 27: Capital Expenditure Estimate as at June 30, 2026 Description June 2026 (ZAR M) DP2 Expansion Equipment and Infrastructure 109 Up Flow Reactor 792 Total for DP2 Expansion 901 RTSF RTSF Construction* 985 Total for RTSF 985 Pumping and Piping RTSF 101 Kloof 1 194 Kloof 2 534 Libanon 292 Venterspost South 500 Venterspost North 220 Total for Pumping and Piping Capital Expenditure 1,842 Total Direct Capital Expenditure 3,728 Indirect Capital Expenditure DP2 Maintenance/Replacement of Capital 662 Planned Closure Costs - Total Indirect Capital Expenditure 662 Contingency Contingency (15%) 435 Total Capital Expenditure 4,825 Source: Sound Mining, 2026; and FWGR, 2026 Note: * Remaining RTSF Provision with cost of a liner now included ** This rehabilitation requirement is currently exceeded by the provisions in the Guardrisk financial guarantees 116 Far West Gold Recoveries (Proprietary) Limited Document No: PR/SMI/1684/26 It is noted that a significant portion of the original capital estimates have been expensed as a consequence of phase 2 project implementation activities post the previously published 2023 LoM plan (i.e., FWGR TRS, 2023). Table 28: Implementation Progress post 2023 Description Capital Estimate (ZAR M) Comments June 2023 June 2026 Land (RTSF and Pipelines) 49 0 The required acquisitions have been made Equipment and Infrastructure 1,770 109 The expansion of DP2 is largely complete Up Flow Reactor 0 792* The UFR was included in the 2026 mine plan RTSF Construction 3,147 985 RTSF stage 1 anticipated to be complete in Q2 FY2027 RTSF - Piping 635 101 RTSF Piping Infrastructure Kloof 1 - Piping and Pumping 405 534 This estimate has been revised since 2023 Kloof 2 - Piping and Pumping 0 292* Kloof 2 TSF was included in 2026 mine plan Libanon - Piping and Pumping 467 194 Capital expenditure due to development of infrastructure Venterspost South - Piping and Pumping 361 500 This estimate has been revised since 2023 Venterspost North - Piping and Pumping 252 220 Capital expenditure due to development of infrastructure Source: Sound Mining, 2026; FWGR, 2023; and FWGR, 2026 Note: * Not part of the original FWGR Project planning Graph 8 illustrates the annual capital expenditure as forecast through to 2042. Graph 8: Capital Expenditure Forecast Source: Sound Mining, 2026 The bulk of the early expenditure will be on completing both the RTSF and the expansion of DP2. The replacement, or Stay-in-Business (SiB), capital provision of ZAR662 M will be expensed from year 2 onwards. The increases in 2040 and 2042 are for the pumping and piping needed to facilitate the mining of the two Venterspost TSFs. - 500 1 000 1 500 2 000 2 500 2 0 2 7 2 0 2 8 2 0 2 9 2 0 3 0 2 0 3 1 2 0 3 2 2 0 3 3 2 0 3 4 2 0 3 5 2 0 3 6 2 0 3 7 2 0 3 8 2 0 3 9 2 0 4 0 2 0 4 1 2 0 4 2 2 0 4 3 2 0 4 4 2 0 4 5 2 0 4 6 C a p it a l E x p e n d it u re ( Z A R M ) Direct Capital Expenditure Indirect Capital Expenditure Capital Contingency

117 Far West Gold Recoveries (Proprietary) Limited Document No: PR/SMI/1684/26 18.2. Operating Costs The operating cost estimate (Table 29) and forecast (Graph 9) are based on actual costs incurred at the current operation. The Phase 2 estimates also rely on current expenditure but with appropriate adjustments to account for economies of scale as DP2 increases its throughput. Table 29: Operating Cost Estimate as at June 30, 2026 Description Phase 1 (ZAR/t) Phase 2 (ZAR/t) Salaries and Wages 19.6 14.0 Contractors 15.3 10.8 Reagents 29.4 33.4 Other Engineering Stores 11.0 11.0 Electricity 22.2 40.4 Water 0.5 0.7 Machine Hire 4.2 2.3 Other 17.6 6.1 Other Corporate Costs 7.2 3.3 Contingency (15%) 19.0 18.3 Totals 146.0 140.3 Source: Sound Mining, 2026; and FWGR, 2026 Graph 9 illustrates the operating costs to be anticipated over the planned LoM. Graph 9: Operating Cost Forecast Source: Sound Mining, 2026 18.3. Concluding Comments The accuracy of the capital cost estimates have improved as the implementation of Phase 2 nears completion. The cost of power is likely to increase over time as mining of successive TSFs occur further away from the processing facility, but these are not expected to be material to the mineral reserve estimate. - 500 1 000 1 500 2 000 2 500 2 0 2 7 2 0 2 8 2 0 2 9 2 0 3 0 2 0 3 1 2 0 3 2 2 0 3 3 2 0 3 4 2 0 3 5 2 0 3 6 2 0 3 7 2 0 3 8 2 0 3 9 2 0 4 0 2 0 4 1 2 0 4 2 2 0 4 3 2 0 4 4 2 0 4 5 2 0 4 6 O p e ra ti n g C o s ts ( Z A R M ) 118 Far West Gold Recoveries (Proprietary) Limited Document No: PR/SMI/1684/26 19. ECONOMIC ASSESSMENT ITEM 19 (I); (II); (III) AND (IV) A DCF modeling approach was adopted to confirm the economic viability of the Mineral Reserves as stated (Appendix A). It was generated in real June 2026 ZAR terms, which is deemed more appropriate than a DCF model in nominal terms given the uncertainties around future global economics, the exchange rate, interest rate and gold price. The DCF model relies on the revenue and cost forecasts as described in the report. It assumes a 100% equity-based business, ignores the effect of working capital, and relies on appropriate and reasonable economic assumptions (Table 30). Table 30: Economic Assumptions Description Unit Quantum Key Terms Discount Rate % 10.9 SIB/Replacement Capital (% of Operating Costs) % 2 Company Tax % 33-165 / (100*Operating Profit/Net Revenue) Royalties % 0 Contingency % 15% Exchange Rate ZAR/USD 16.30 Price per Troy Ounce USD/oz 4,114 Price Per Kg ZAR/kg 2,155,461 Source: Sound Mining, 2026; and FWGR, 2026 The impact of changes to the discount rate assumption is considered by performing a sensitivity analysis. The stay-in-business (SiB) provision of 2% of the operating costs is consistent with surface operations in general. Taxes are determined using the gold mining tax formula with all unredeemed capital considered. The assets are part of the ongoing business of FWGR, which fall outside the ambit of the provision of the MPRDA that would place an obligation to pay royalties on the proceeds of the operations. These gold price related assumptions are based on information received from FWGR and interrogated by Sound Mining. The production forecast is based on inputs from various consultants who have contributed to the Mineral Resource estimates, LoM planning and associated technical study work. 19.1. Revenue Forecast The revenue forecast is a function of gold sales and the gold price assumption. The following processing recoveries were applied to the material planned for depletion from the respective TSFs to compute the amount of gold sold. They were derived after considering data from both the DP2 plant and external test work: • 51.9% for Driefontein 5 TSF material; • 51.5% for Driefontein 3 TSF material; • 47.2% Libanon TSF material; • 50.5% for Kloof 1 TSF material; • 42.1% for Kloof 2 TSF material (i.e., reduced from the test work result of 57.00%); • 57.6% for Venterspost South TSF material; and • 48.9% for Venterspost North TSF material (i.e., reduced from the test work result of 54.7%). The expansion of DP2 facilitates an increase in gold sales after the first year (Graph 10). 119 Far West Gold Recoveries (Proprietary) Limited Document No: PR/SMI/1684/26 Graph 10: Gold Sales Forecast Source: Sound Mining, 2026 Graph 11 covers the depletion of the TSFs that comprise the latest Mineral Resource base and the LoM gold sold from these TSFs equate to approximately 1.3Moz. FWGR would need additional mineral resources for processing to continue beyond 2046. 19.2. Cashflows Graph 11 presents the post-tax cashflow for the FWGR operation as currently planned. Graph 11: Post-Tax Discounted Cashflows Source: Sound Mining, 2026 The cumulative post-tax cashflows over the LoM remain positive. When assuming a discount rate of 10.9% the unleveraged operation reflects a Net Present Value (NPV10) of ZAR15.97 billion. The QP is satisfied with the quality of the information used to underpin the revenue and cost forecasts and considers the inputs to the DCF model to constitute a level of accuracy of –5%, +15%. The Mineral Reserves as estimated are supported by healthy operating margins - 500 1 000 1 500 2 000 2 500 3 000 2 0 2 7 2 0 2 8 2 0 2 9 2 0 3 0 2 0 3 1 2 0 3 2 2 0 3 3 2 0 3 4 2 0 3 5 2 0 3 6 2 0 3 7 2 0 3 8 2 0 3 9 2 0 4 0 2 0 4 1 2 0 4 2 2 0 4 3 2 0 4 4 2 0 4 5 2 0 4 6 G o ld S o ld ( k g ) - 5 000 10 000 15 000 20 000 25 000 30 000 35 000 40 000 - 500 1 000 1 500 2 000 2 500 3 000 3 500 2 0 2 7 2 0 2 8 2 0 2 9 2 0 3 0 2 0 3 1 2 0 3 2 2 0 3 3 2 0 3 4 2 0 3 5 2 0 3 6 2 0 3 7 2 0 3 8 2 0 3 9 2 0 4 0 2 0 4 1 2 0 4 2 2 0 4 3 2 0 4 4 2 0 4 5 2 0 4 6 Z A R M Free Cashflow After Tax Cumulative Free Cashflow After Tax 120 Far West Gold Recoveries (Proprietary) Limited Document No: PR/SMI/1684/26 19.3. Sensitivities The achievability of the LoM plans, budgets and forecasts cannot be assured as they are based on economic assumptions, many of which are beyond the control of the company. Future cashflows and profits derived from such forecasts are inherently uncertain and actual results may be significantly more or less favorable. The technical risks as identified by Sound Mining are provided in Item 12.1. These and other environmental risks can impact the anticipated revenue and cost forecasts and accordingly have been assessed against upside or downside changes of between -20% and +20%. The consequential potential impacts are presented in Table 31 and is illustrated graphically in Graph 12. Table 31: Sensitivity of Post-tax NPV Variance NPV10 (ZAR Billion) 80% 90% 100% 110% 120% Revenue 10.21 13.09 15.97 18.84 21.72 Capital Expenditure 18.10 17.03 15.97 14.90 13.83 Operating Costs 16.40 16.18 15.97 15.75 15.54 Source: Sound Mining, 2026 Graph 12 shows that changes to the revenue forecast will impact margins the most. Graph 12: Sensitivity to Expected Revenue and Costs Source: Sound Mining, 2026 Table 32 shows the materiality of changes in the gold price. Table 32: Sensitivity of Gold Price Gold Price ZAR/kg 800,000 1,200,000 1,600,000 2,000,000 2,100,000 2,300,000 NPV10 (ZAR M) (3,563) 3,131 8,499 13,891 15,226 17,896 Source: Sound Mining, 2026 The operation is economically viable above a gold price of ZAR992,201/kg. The impact of changes to the operating cost forecast is materially less, with any variance in capital expenditure being relatively insensitive. A sensitivity on the discount rate is displayed in Table 33. - 5 000 10 000 15 000 20 000 25 000 80% 90% 100% 110% 120% N P V ( Z A R M ) Revenue Operating Costs Capital Expenditure

121 Far West Gold Recoveries (Proprietary) Limited Document No: PR/SMI/1684/26 Table 33: Sensitivity of the Discount Rate Discount Rate 0.0% 5.0% 7.5% 10.0% 12.5% 15.0% NPV10 (ZAR Billion) 33.67 22.88 19.43 16.77 14.69 13.02 Source: Sound Mining, 2026 Table 34 presents the potential enhancement in value for a range of UFR Related recoveries Table 34: Impact of UFR Inclusion UFR Recovery 0% 3% 6% 9% 12% 15% NPV10 (ZAR Billion) 13.63 14.33 15.03 15.73 16.43 17.13 Source: Sound Mining, 2026 19.4. Concluding Comments The QP is satisfied that the Mineral Reserves as stated are all economically viable. 122 Far West Gold Recoveries (Proprietary) Limited Document No: PR/SMI/1684/26 20. ADJACENT PROPERTIES ITEM 20 (I); (II); (III) AND (IV) A discussion of the characteristics of adjacent properties is usually relevant for in situ mineral deposits. The TSF assets are independent from adjacent properties with no correlation in mineralization. 123 Far West Gold Recoveries (Proprietary) Limited Document No: PR/SMI/1684/26 21. OTHER RELEVANT DATA AND INFORMATION ITEM 21 Information relevant to the Mineral Resource and Mineral Reserve statements will certainly include the prevailing legislative framework in South Africa. 21.1. South African Minerals Policy and Legislative Framework The South African Government has an extensive legal framework within which mining, environmental and social aspects are managed. Inclusive within the framework are international treaties and protocols, and national acts, regulations, standards, and guidelines which address international, national, provincial and local management areas. The role of the Government and the relevant regulatory authorities can be summarized as follows: • the custodian of environmental and mining legislation as a Constitutional imperative; • a conduit between the public and mining companies to ensure that mineral rights holders satisfy the objectives of transforming the mining industry by, inter alia, increasing the number of black people in the industry to reflect the country’s population demographics, to empower and enable them to meaningfully participate in and sustain the growth of the economy; thereby ensuring transparency to achieve accelerated and shared economic growth; • advocate of sustainable development, from a socio-economic and environmental management perspective; and • ultimate custodian of historical mining legacies, inclusive of abandoned mines. The Government has significantly reformed its environmental legislation. The driving force behind this is the need to support the overall national objective of sustainable development. Most recently, in 2015, the government published the National Environmental Management Laws Amendment Bill for public comment and the Draft Revised Financial Provision Regulations were published in General Notice No.: R1228 of 10 November 2017 in Government Gazette No.: 41236 in respect of prospecting, exploration and mining or production operations. The applicable laws are listed below: • The Constitution of South Africa (Act No. 108 of 1996); • Mines and Works Act, 1956 (Act No. 27 of 1956); • the Mine Health and Safety Act, 1996 (Act No. 29 of 1996); • the National Environmental Management Act, 1998 (Act No. 107 of 1998) (NEMA); • National Water Act, 1998 (Act No. 36 of 1998) (NWA); • National Nuclear Regulator Act, 1999 (Act No. 47 of 1999) (NNRA); • National Environmental Management: Biodiversity Act, 2004 (Act No. 10 of 2004); • National Environmental Management: Air Quality Act, 2004 (Act No. 39 of 2004); • National Environmental Management: Waste Act, 2008 (Act No. 59 of 2008) (NEM:WA); • the Competition Act, 1998 (Act No. 89 of 1998); • the Companies Act, 2008 (Act No. 71 of 2008); • Mineral and Petroleum Resources Development Act, 2002 (Act No. 28 of 2002) (MPRDA); • Mineral and Petroleum Resources Royalty Act, 2008 (Act No. 28 of 2008) (MPRRA); • Mining Titles Registration Act, 1967 (Act No. 16 of 1967); • Mining Titles Registration Amendment Act, 2003 (Act No. 24 of 2003); • Broad-Based Socio-Economic Charter (and associated amendments, 2010), also known as the Mining Charter; • National Heritage Resources Act, 1999 (Act No. 25 of 1999) (NHRA); • National Environmental Management: Protected Areas Act, 2003 (Act No. 57 of 2003) (NEM:PAA); • National Environmental Management: Biodiversity Act, 2004 (Act No. 10 of 2004) (NEM:BA); • National Forests Act, 1998 (Act No. 30 of 1998) (NFA); • Hazardous Substances Act, 1973 (Act No. 15 of 1973) (HSA); • Explosives Act, 1956 (Act No. 25 of 1956); 124 Far West Gold Recoveries (Proprietary) Limited Document No: PR/SMI/1684/26 • National Road Traffic Act, 1993 (Act No. 93 of 1996) (NRTA); and • New Broad-Based Black-Economic Empowerment Charter for the South African Mining Industry (also known as the New Mining Charter) published in September 2018. 21.1.1. South African Legislative Framework South African legislation applicable to mining related activities and specifically with regard to environmental, social and community impact issues are: • The Constitution of South Africa Act, 1996 (Act No. 108 of 1996); • Mineral and Petroleum Resources Development Act, 2008 (Act No. 28 of 2002) (MPRDA); • National Environmental Management Act, 1998 (Act No. 107 of 1998) (NEMA); • National Water Act, 1998 (Act No. 36 of 1998) (NWA); • National Environmental Management: Waste Act, 2008 (Act No. 59 of 2008) (NEM:WA); • National Environmental Management: Air Quality Act, 2004 (Act No. 39 of 2004) (NEM:AQA); • Hazardous Substances Act, 1973 (Act No. 15 of 1973) (HSA); • National Heritage Resources Act, 1999 (Act No. 25 of 1999) (NHRA); • National Environmental Management: Protected Areas Act, 2003 (Act No. 57 of 2003) (NEM:PAA); • National Environmental Management: Biodiversity Act, 2004 (Act No. 10 of 2004); and • National Forests Act, 1998 (Act No. 30 of 1998) (NFA). A brief description of the above Acts is summarized below: The Constitution of South Africa Act, 1996 (Act No. 108 of 1996): Mines must comply with South African constitutional and common law by conducting their operational and closure activities with due diligence and care for the rights of others. Section 24(a) of the Constitution states that everyone has the right to (a) an environment which is not harmful to their health or well-being; and (b) to have the environment protected, for the benefit of present and future generations, through reasonable legislative and other measures that: • prevent pollution and ecological degradation; • promote conservation; and • secure ecologically sustainable development and use of natural resources. Mineral and Petroleum Resources Development Act, 2002 (Act No. 28 of 2002) (MPRDA): The MPRDA provides a holistic cradle-to-grave approach to prospecting and mining by fully considering economic, social and environmental costs to achieve sustainable development of South African Mineral Resources. In May 2025, the DMPR published the Draft Mineral Resources Development Bill, 2025 for public comment, proposing several amendments to the MPRDA. Should these amendments be enacted, DRDGOLD may require some adjustments to the operational and compliance processes. As the Bill remains subject to the legislative process, the potential implications for DRDGOLD are currently uncertain. National Environmental Management Act, 1998 (Act No. 107 of 1998) (NEMA): NEMA was promulgated in 1998 to replace the Environmental Conservation Act, 1989 (Act No. 73 of 1989) (ECA) as the overarching national environmental legislative framework. NEMA was promulgated to give effect to the Environmental Management Policy (published in 2007), and has been subsequently amended, including the National Environmental Management Amendment Act of 2003, and the National Environmental Management Second Amendment Act, 2004 (Act No. 8 of 2004).

125 Far West Gold Recoveries (Proprietary) Limited Document No: PR/SMI/1684/26 The requirements for financial provisions for rehabilitation and closure are evolving. Historically, closure and rehabilitation liability calculations and financial provisions had to be determined and provided for in accordance with Regulations 53 and 54 under the MPRDA (GN 527, April 2004), a guideline document for the evaluation of the quantum of closure-related financial provisions issued by the DMPR in 2004/5, and a set of master rates updated from time to time by the DMPR based on inflation. Financial provision regulations (GNR 1147) were published on November 2015 (as amended January 2020) to replace Regulations 53 and 54 under the MPRDA. The new regulations require the following: • annual rehabilitation, as reflected in an annual rehabilitation plan; • final rehabilitation, decommissioning and closure of the prospecting, exploration, mining or production operations at the end of the life of operations, as reflected in a final rehabilitation, decommissioning and mine closure plan; and • remediation of latent or residual environmental impacts which may become known in the future, including the pumping and treatment of polluted or extraneous water; as reflected in an environmental risk assessment report; and • The applicant or holder of a right or permit must ensure that the financial provision is, at any given time, equal to the sum of the actual costs of implementing the plans and report contemplated in regulation 6 and regulation 11 (1) for a period of at least 10 years forthwith. The NEMA Section 24P (as amended in April 2014) also applies. It requires: • financial provisions to be made in the prescribed manner before an environmental authorization is issued by the DMPR; • annual assessment of environmental liabilities; and • annual “increase” of available financial provisions to the satisfaction of the Minister of Mineral Resources. National Water Act, 1998 (Act No. 36 of 1998) (NWA): The NWA stipulates that a WUL is required for the abstraction, storage, use, diversion, flow reduction and disposal of water and effluent in terms of Section 21 of the Act. Use of water for mining and related activities is also regulated through regulations that were updated after the promulgation of the NWA in 1999 - GN 704. GN 704 addresses the regulations on use of water for mining and related activities aimed at the protection of water resources. Inclusive within GNR 704 are the control measures for activities and its regulation of the sizing, control and monitoring of water management measures. National Environmental Management: Waste Act, 2008 (Act No. 59 of 2008) (NEM:WA): Waste management activities listed in terms of the NEM:WA (GN 921, 29 November 2013) include: storage of waste; the reuse, recycling and recovery of waste; treatment of waste; and disposal of waste at specified thresholds. Historically, mine residues were managed in accordance with the MPRDA and the NEMA. This situation changed in 2014 with the promulgation of the National Environmental Management: Waste Amendment Act of 2014 and its inclusion of mine residue as a Category A (hazardous) waste, as well as the addition of mine residue stockpiles and residue deposits to the list of waste management activities requiring a WML. In 2008 the Ministers of Mineral Resources and Environmental Affairs concluded an agreement on the “One Environmental System” for the country with respect to mining. Ministers adopted an integrated mine environmental management system and sought to align the MPRDA, NEMA, NEM:WA, NEM:AQA and NWA. In short, the 126 Far West Gold Recoveries (Proprietary) Limited Document No: PR/SMI/1684/26 agreement implied that environmental issues resulting from mining, prospecting, production and related activities will be regulated in terms of the NEMA, whilst the Minister of Mineral Resources will become a competent authority in terms of NEMA. Following the acceptance of the above-mentioned agreement various amendments were made to environmental legislation, inter alia, the NEMA, MPRDA and NEM:WA. Significant to these amendments were the inclusion of residue stockpiles under the NEM:WA listed activities as well as the publication of regulations regarding the planning and management of residue stockpiles and residue deposits from the prospecting, mining, exploration or production operation in GNR 632 of 2015 and GN 921 July 2015. Transitional provisions specifically include the following: • any activity in terms of regulation 73 of the MPRDA relating to the management of residue stockpiles and residues deposits, that can be done in terms of a provision of GNR 632 of 2015, must be regarded as having been done in terms thereof; • management measures of residue stockpiles and residue deposits approved in terms of the MPRDA, at the time of the coming into operation of GNR 632 of 2015, must be regarded as having been approved in terms thereof; • a holder of a right or permit in terms of the MPRDA must continue the management of the residue stockpiles and residue deposits in accordance with the approved management measures; and • a person who lawfully conducts a waste management activity listed in the NEM:WA Schedule on the date of the coming into effect of this Notice may continue with the waste management activity until such time that the Minister by notice in a Gazette calls upon such a person to apply for a WML. National Environmental Management: Air Quality Act, 2004 (Act No. 39 of 2004) (NEM:AQA): In terms of Section 21 of the NEM:AQA, an Atmospheric Emissions License (AEL) is required for listed processes that may result in atmospheric emissions, which may have a significant detrimental effect on the environment, health, social and economic conditions. These requirements apply to smelters, refineries and certain processing plants. NEM:AQA GN 283 April 2015 requires mines to register with the Department and submit results in line with the National Atmospheric Emission Inventory System (NAEIS) requirements. The National Dust Control Regulations (GNR 827, 1 November 2013) provides standards for dust-fall in residential and non-residential areas, and the requirements of monitoring and reporting to the air quality officer. Mining operations have the responsibility to comply with the standards. Hazardous Substances Act, 1973 (Act No. 15 of 1973) (HSA): The regulations relating to Group IV Hazardous Substances (GNR 247 of 26 February 1993) in terms of the HSA apply to the use and transportation of radioactive nuclides used in metallurgical processing plants. National Heritage Resources Act, 1999 (Act No. 25 of 1999) (NHRA): The NHRA requires that a heritage assessment be undertaken for developments listed in the Act. The Act prohibits the following: the alteration, disturbance, damage or demolishment of buildings and structures older than 60 years; archaeological and paleontological artefacts; cultural significant graves and burial sites; and public monuments, except for where a permit was issued by the relevant Provincial Heritage Resources Authority. National Environmental Management: Protected Areas Act, 2003 (Act No. 57 of 2003) (NEM:PAA): The NEM:PAA regulates the system of protected areas in South Africa and their management. It distinguishes between the following types of protected areas: national parks; nature reserves; special nature reserves; and ‘protected environments. Mining is prohibited in national parks, nature reserves and special nature reserves, but mining in 127 Far West Gold Recoveries (Proprietary) Limited Document No: PR/SMI/1684/26 ‘protected environments’ may be allowed with the necessary permission from the Minister of Environmental Affairs as well as the Minister of Mineral Resources. National Environmental Management: Biodiversity Act, 2004 (Act No. 10 of 2004) (NEM:BA): Holders of a mining right need to comply with the alien and invasive species regulations (GNR 598 of 1 August 2014) in terms of NEM:BA for species listed in GN 864, of 29 July 2016, which deal with different categories of alien and invasive plant and animal species that are prohibited, must be combatted or eradicated, controlled, require a permit or are subject to certain exemptions and prohibitions. National Forest Act, 1998 (Act No. 84 of 1998) (NFA): The NFA prohibits the cutting, disturbance, damage or destruction of trees in natural forests and trees included in the lists of protected tree species published in terms of the NFA, except where a license was issued by the Department of Agriculture Forestry and Fisheries (DAFF). 21.2. Changes to South African Minerals Policy and Legislative Framework Changes in government policies or the regulatory environment in South Africa may adversely impact our operations and profitability. The mining industry in South Africa is extensively regulated through legislation and regulations promulgated by government departments and regulatory bodies. These regulatory requirements govern areas including health and safety, water usage, the exploration and mining of minerals, and environmental management. A variety of permits, regulatory approvals and authorizations are required to mine lawfully, and the Government enforces its regulations through the various government departments. A lack of communication between government departments and regulatory bodies, together with under-resourced regulators, continues to present challenges that may increase compliance costs and the time required to obtain permits. The formulation or implementation of government policies may be discretionary and unpredictable on certain issues, including changes in conditions for the issuance of licenses relating to labor plans, workplace transformation and Black Economic Empowerment (BEE) requirements, laws relating to mineral rights, ownership of mining assets and the rights to prospect and mine, additional taxes on the mining industry and in extreme cases, nationalization. Changes in regulatory or government policies could adversely affect our business and may result in increased project costs and potential delays. Complexity, uncertainty and regulatory changes continue to characterize the South African regulatory environment, and changes that are adverse to business and growth may result in increased project costs and potential delays. On May 20, 2025, the draft MPRD Bill (MPRD Bill) was gazetted for public comment. The two main areas of concern in the MPRD Bill are the requirement to now be granted a mining right for movable tailings dumps and a new Broad-Based Black Economic Empowerment (B-BBBEE) and transformation regime. The other notable concern with respect to the MPRD Bill relates to suggested Beneficiation. 21.2.1. Requirement of a Mining Right Currently, and as a general proposition in the mining industry, the processing of movable tailings dumps does not constitute “mining” for the purposes of the MPRDA. Movable tailings dumps created before May 1, 2004, when the MPRDA became effective, are not subject to the MPRDA and can be processed without a mining right. Tailings dumps processed by companies like DRDGOLD are all movable in nature, and the MPRD Bill, if it ultimately amends the MPRDA, will radically change our ability to process these movable tailings dumps. 128 Far West Gold Recoveries (Proprietary) Limited Document No: PR/SMI/1684/26 21.2.2. BEE and Transformation Regime Currently, there is no requirement for BEE when applying for a Prospecting Right. The MPRD Bill changes BEE and transformation imperatives to those which currently apply to the Mining Industry. The MPRD Bill amends the definition of “this Act” to include “the Codes of Good Practice for the South African Minerals Industry and Housing and Living Conditions Standards for the Minerals Industry”, gazetted on April 29, 2009 (Codes). The MPRD Bill makes these Codes enforceable legislation. The Codes conflict with the transformational imperatives in the remainder of the MPRD Bill. 21.2.3. Beneficiation "Beneficiation” is defined as “value addition to a higher value over baselines determined by the Minister” (the Minister of Mineral and Petroleum Resources). Therefore, the State has control over what comprises beneficiation. The Minister can prescribe “conditions required to ensure security of supply for local beneficiation”. The MPRD Bill provides that “Every producer of minerals must make available minerals or mineral products for local beneficiation”. In summary, the Minister can determine what comprises “Beneficiation”, can make regulations with respect to promotion of “Beneficiation” and mining companies will be compelled to ensure supply of minerals for “Beneficiation” in South Africa. We have submitted representations to the office of the Department of Mineral and Petroleum Resources (“DMPR”) (previously the Department of Mineral Resources and Energy (the “DMRE”) expressing our concerns regarding these proposed amendments. The Minerals Council of South Africa, which advocates on behalf of mining companies such as DRDGOLD, has also submitted its own representations to the office of the DMPR. However, there can be no assurance that such advocacy efforts will be successful. In addition, although we may challenge any attempts by the State to expropriate or otherwise restrict our ownership or use of movable tailings dumps, there can be no assurance that such challenges would be effective. If the MPRD Bill, or similar amendments, is promulgated into law, it could result in increased regulatory requirements, additional costs and taxes, restrictions on our ability to process tailings or other mineral resources, or potential risks relating to the ownership and use of movable tailings dumps. Any such developments could adversely affect our operations, results and financial conditions. Furthermore, certain regulators are significantly understaffed and under-resourced and not always able to process administrative filings in accordance with prescribed timelines, which could result in delays to our project planning and execution. In 2023 and 2024, this risk materialized when the commissioning of several new reclamation sites was delayed due to backlogs in the DWS's processing of Water Use License applications, leading to shortfalls in planned production. Delays in securing the required regulatory approvals for reclamation sites 4L39 and 5L23 during FY2026 have also resulted in the need for additional material trucking, which, combined with rising fuel prices, had significant impact on operating costs. Both Ergo and FWGR currently have license and other permit applications pending relating to the commissioning of reclamation sites and TSFs. If these are not processed in time, the projects may experience delays in commissioning, which could result in lower than targeted production.

129 Far West Gold Recoveries (Proprietary) Limited Document No: PR/SMI/1684/26 22. INTERPRETATIONS AND CONCLUSIONS ITEM 22 A full list of all technical documents used in the compilation of the TRS is provided in Item 23. The QP has interrogated all of this information in the process of generating the Mineral Resource and Mineral Reserve estimates and remains satisfied with the technoeconomic merits of the LoM planning and of the integrity of the information and study work performed. Both QP’s are of the opinion that the operations of FWGR are reasonably robust in the context of the current methodologies and systems. These operations are ongoing with an experienced management team, skilled employees and a mining contractor whose track record demonstrates the required competence. Apart from the uncertainties identified herein, which risks are manageable, no factors of an operational or geo-metallurgical nature have been identified that could significantly impact the prospects for eventual economic extraction, or the viability of the Mineral Reserves as stated. The drilling, sampling, analytical processes and governance of the exploration programs are appropriate and in-line with industry best practice. They are considered to be of high confidence. The density used to determine quantities from volumes has been determined from both in situ measured values and empirical data. Sound Mining concludes that the Mineral Resource estimates are based on a suitable database of reliable information. Scrutiny of the LoM plan has shown that the recoveries used for the economic assessment coincide with the recoveries repeated herein and that the quantities and grades used are consistent with those estimated in the Mineral Resource estimation. A review of the processing at DP2 confirms that the plant has performed in-line with expectations and with further modifications (i.e., inclusion of the UFR) is likely to continue to perform accordingly at the planned increase in throughput to 1,200ktpm for Phase 2. The tailings material arising from the expanded DP2 will be stored at the RTSF, which will have excess capacity from both a depositional rate (2.4Mtpm) and final capacity perspective (800Mt). Sound Mining has reviewed and endorsed the design for the RTSF and has visited the site during its development. Sound Mining has reviewed the EIA and Environmental Management Plan (EMP) for FWGR. The mineral assets were acquired from Sibanye Gold, a subsidiary of Sibanye Stillwater Limited, in a transaction in which common law ownership was established over the various TFSs containing the Mineral Resources and Mineral Reserves. FWGR conducts its activities inter alia in accordance with environmental legislation and the provisions of the Mine Health and Safety regulations. A Use and Access Agreement with Sibanye Gold articulates the various rights, permits and licenses held by Sibanye Gold in terms of which FWGR operates, pending the transfer to FWGR of those that are transferable. The capital provision for the necessary infrastructural requirements have been reviewed and are considered appropriate. The capital expenditure on expanding DP2 and building the RTSF have been in line with expectations. Operational expenditure has been estimated using actual data from the current operations. The cost estimates are considered appropriate and in-line with a level of accuracy of –5%, +15%. The mineral reserves are stated at the gold price of ZAR2,155,461.00/kg, which is not inconsistent with the spot price of ZAR2,118,590.46/kg (i.e., USD4,015.51/oz at ZAR16.41/USD) as at June 30, 2026. The QP notes the risks identified in Item 12.1, and is satisfied that the Mineral Resources and Mineral Reserves of FWGR are not likely to be impacted materially as a consequence of any of these uncertainties. 130 Far West Gold Recoveries (Proprietary) Limited Document No: PR/SMI/1684/26 23. REFERENCES ITEM 23 The sources of data and information used in preparation of this TRS are presented in Table 35. Table 35: TRS Data and Information Sources Source Date File Type Title Engineering AZTEC Mining (Proprietary) Limited April 2025 pdf AZT-S017 - DRD Gold Far West - UFR Test Work Results R2 AZTEC Mining (Proprietary) Limited July 2025 pdf AZT-S017-TEC-00-01-R0A - Far West Gold Recoveries Testwork Results AZTEC Mining (Proprietary) Limited December 2025 pdf AZ-P055-PR-OFS-001-01 - FWGR UFR Overall Flowsheet (15Dec25) - Issued DRA SA (Proprietary) Limited August 2020 pdf RTSF Hazard and Operational Study 2 Report DRA SA (Proprietary) Limited August 2020 pdf Far West Gold Recoveries RTF FS RTSF Complex Infrastructure Fencing 2.1m High Shotcrete Perimeter Wall Layout & Details DRA SA (Proprietary) Limited September 2020 pdf Far West Gold Recoveries Regional Tailings Facility - Basis of Estimate DRA SA (Proprietary) Limited September 2020 pdf Far West Gold Recoveries Regional Tailings Facility Basis of Estimate DRA SA (Proprietary) Limited June 2020 pdf Plant layout DRD FWGR Phase 2 Expansion Project (CPP) DRA SA (Proprietary) Limited June 2020 pdf DRD FWGR Phase 2 Expansion Project Feasibility Study Process Design Criteria (CPP) DRA SA (Proprietary) Limited June 2020 pdf DRD FWGR Phase 2 Expansion Project Feasibility Study Mechanical Equipment List (CPP) DRA SA (Proprietary) Limited November 2020 pdf DRD FWGR Phase 2 Expansion Project Feasibility Study Executive Summary DRA SA (Proprietary) Limited November 2020 pdf DRD FWGR Phase 2 Expansion Project Feasibility Study Opex (CPP) DRA SA (Proprietary) Limited November 2020 xlsx Phase 2 Expansion Project Feasibility Study Capital Cost Estimate (CPP and Piping Rev 6) DRA SA (Proprietary) Limited October 2020 xlsx Far West Gold Recoveries Regional Tailings Facility Capital Cost Estimate: Scenario 2 DRA SA (Proprietary) Limited October 2020 xlsx DRDGOLD - Far West Gold Recoveries Phase 2 Expansion Project Feasibility Study OPEX DRA SA (Proprietary) Limited August 2022 pdf 00301-Blockplan with Google Overlay DRA SA (Proprietary) Limited 2022 pdf 00301-Blockplan DRA SA (Proprietary) Limited 2022 xlsx DP2 - expansion capital spend DRA SA (Proprietary) Limited March 2022 pdf Far West Gold Recoveries DP2 Expansion Project Feasibility Study Basis of Estimate DRA SA (Proprietary) Limited 2022 pdf FZADBR6245-PROC-PDC-005-Rev B_PDC DRA SA (Proprietary) Limited 2022 xlsx FZADBR6245-PROC-PDC-005-Rev B_PDC DRA SA (Proprietary) Limited May 2022 pdf Far West Gold Recoveries Dp2 Expansion Project Feasibility Study Process Flow Diagram DRDGOLD Limited July 2026 docx Residue Diagnostic Report DRDGOLD Limited August 2020 docx Manual for the Management of the Disposal of Tailings on the Far West Gold Recoveries Regional Tailings Facility DRDGOLD Limited August 2020 pdf Electrical Point of Delivery Meeting minutes Geo Tail SA (Proprietary) Limited May 2023 pdf Far West Gold Recoveries Regional Tailings Storage Facility Design Report Geo Tail SA (Proprietary) Limited June 2022 pdf Leeudoorn TSF Cyclone Conversion Design Geo Pollution Technologies - Gauteng (Proprietary) Limited August 2021 pdf Kloof Gold Mine Leeudoorn Return Water Dam Strategy Highlands Hydrology (Proprietary) Limited and Water Hunters August 2020 pdf Hydrological Assessment for the Proposed Regional Tailings Facility, Far West Gold Recoveries Version 1 Mintek and DRDGOLD Limited September 2020 xlsx Predicted yields from the various dams based on test work results at September 2020 Water Hunters January 2020 xlsx WRTRP Output Analysis v 0.5e2 Base Case Water Hunters August 2020 pdf Far West Gold Recoveries - Regional Tailings Facility - Updated Ground Water Model Report Environmental/Legal 131 Far West Gold Recoveries (Proprietary) Limited Document No: PR/SMI/1684/26 Department of Minerals Resources and Energy May 2018 pdf WRTRP Driefontein Environmental Authorization GP30/5/1/2/3/2/1(51)EM Department of Minerals Resources and Energy May 2018 pdf WRTRP Kloof Integrated Environmental Authorization GP30/5/1/2/3/2/1 (66)EM Department of Minerals Resources and Energy July 2023 pdf EA Granting Letter for Far West Gold Recoveries (Pty) Ltd Ref No.: GP30/5/1/2/2 (51) MR Department of Mineral and Petroleum Resources July 2026 pdf Integrated Environmental Authorisation for Far West Gold Recoveries Libanon Project Ref No.: GP30/5/1/1/2(000073) BP/BAR Department of Water and Sanitation March 2017 pdf WRTRP Integrated Water Use License. License No.: 10/C22B/ACFGI/4976 Department of Water and Sanitation March 2017 pdf Driefontein Water Use License. License No.: 10/C23E/ACEFGIJ/4527 Department of Water and Sanitation July 2025 pdf Far West Gold Recoveries (Pty) Kloof Operations Water Use License. License No.: 10/C22B/ACFGI/4976 Department of Water and Sanitation July 2026 pdf Far West Gold Recoveries (Pty) Libanon Water Use License. License No.: 10/C23D/CGI/18789 Digby Wells Environmental (South Africa) (Proprietary) Limited May 2026 xlsx Far West Gold Recoveries Closure Cost Assessment 2026. Digby Wells Environmental (South Africa) (Proprietary) Limited August 2025 pdf Far West Gold Recoveries Closure Planning Documents Aligned with the Requirements of the Financial Provisioning Regulations Digby Wells Environmental (South Africa) (Proprietary) Limited March 2016 pdf Environmental Impact Assessment and Environmental Management Programme for the Amendment of the existing EMP and Inclusion of Listed Activities Associated with Operations at Driefontein Mining Right Area, Sibanye Gold Digby Wells Environmental (South Africa) (Proprietary) Limited March 2016 pdf Environmental Impact Assessment and Environmental Management Programme for the Amendment of the existing EMP and Inclusion of Listed Activities Associated with Operations at Kloof Mining Right Area, Sibanye Gold Digby Wells Environmental (South Africa) (Proprietary) Limited May 2020 pdf Far West Gold Recoveries Closure Costs Assessment 2020 (ERG6453) Digby Wells Environmental (South Africa) (Proprietary) Limited September 2020 pdf Driefontein Environmental Authorization Audit Malan Scholes Inc November 2017 pdf Due Diligence Report for DRDGOLD Limited in respect of the West Rand Tailings Retreatment Project National Nuclear Regulator July 2019 pdf Certificate of Registration in terms of the National Nuclear Regulator Act, 1999 (Act No. 4T of 1999) Werksmans Attorneys November 2017 pdf Exchange agreement between Sibanye Gold and K2017449061 (WRTRP to be renamed) and including DRDGOLD Schedule and Economics DRDGOLD Limited 2022 xlsx SK1300 - DP2 Expansion LOM plan_13Jul22_Option 3_REAL_Blended_50_MT Edited_Rev3 DRDGOLD Limited June 2026 xlsx DP2_FY26_June 26_BASE_V5 DRDGOLD Limited 2026 xlsx Gold and Tonnage Split_2026 GoldHub 2026 https World Gold Council, Gold supply and demand statistics - https://www.gold.org/goldhub/data/gold-supply-and-demand-statistics GoldHub 2026 https https://www.gold.org/goldhub/research/gold-demand-trends/gold-demand- trends-q2-2026 GoldHub 2026 https https://www.gold.org/goldhub/data/historical-mine-production GoldHub 2026 https Gold Supply and demand statistics 30 July 2026https://www.gold.org/goldhub/data/gold-supply-and-demand-statistics Sibanye Stillwater Limited 2019 pdf Mineral Resources and Mineral Reserves Report Sound Mining December 2017 pdf Competent Persons' Report on the West Rand Tailings Retreatment Project for DRDGOLD Limited Sound Mining December 2020 pdf PR SMI 0921 20 DFS Report for FWGR - Phase 2 Expansion Project World Gold Council 2026 https Gold Demand Trends Q2 2026 - https://www.gold.org/goldhub/research/gold- demand-trends/gold-demand-trends-q2-2026/supply Geology Frimmel et al 2005 pdf The Formation and Preservation of the Witwatersrand Goldfields, the World’s Largest Gold Province Geographicx Surveys CC July 2026 dwg DRIEFONTEIN 5 01072026 MERGE R1 132 Far West Gold Recoveries (Proprietary) Limited Document No: PR/SMI/1684/26 Geographicx Surveys CC July 2026 pdf QUANTITY REPORT OF DRIEFONTEIN 5 01072026 R1 Geographicx Surveys CC July 2026 dwg DRIEFONTEIN NO 3 01072026 MERGE R1 Geographicx Surveys CC July 2026 pdf QUANTITY REPORT OF DRIEFONTEIN 3 01072026 R1 Geoplan Materials Engineering (Proprietary) Limited November 2020 xlsx DRDGOLD Density Data McCarthy and Rubidge 2005 Book The Story of Earth and Life Minxcon (Proprietary) Limited June 2009 pdf Technical Report on the Surface Mineral Resource Estimation, Scheduling and Financial Valuation of the West Wits HTO Project, Gold Fields (Pty) Ltd. South Africa Minxcon (Proprietary) Limited February 2013 pdf A Technical Report on The Gold1 TSFs in the Gauteng Province, South Africa Minxcon (Proprietary) Limited 2013 dm d4_e_krig_all1 Minxcon (Proprietary) Limited 2013 dm d4_w_krig_all1 Minxcon (Proprietary) Limited 2009 dm drth_krig_allfinal2b Minxcon (Proprietary) Limited 2009 dm DTOPO_pt/tr Minxcon (Proprietary) Limited 2009 dm dr5_krig_all fin Minxcon (Proprietary) Limited 2009 dm dtopo_pt/tr Minxcon (Proprietary) Limited 2009 dm kl1_krig_all_final3c Minxcon (Proprietary) Limited 2009 dm DTOPO_pt/tr Minxcon (Proprietary) Limited 2009 dm lib_krig_all1_2010c Minxcon (Proprietary) Limited 2009 dm dtopo_pt/tr Minxcon (Proprietary) Limited 2009 dm vn_krig_all1_fin2d Minxcon (Proprietary) Limited 2009 dm vn_fin_pt/tr Minxcon (Proprietary) Limited 2009 dm vs_krig_all1_final2c Minxcon (Proprietary) Limited 2009 dm vs_fin_pt/tr Sound Mining 2026 dat K2 OK 2 Sound Mining 2026 dat Combined Composite 1.5m -BM The RVN Group (Proprietary) Limited July 2020 pdf Density Measurements and Supervision DRDGOLD The glossary of terms, units and abbreviations used in this TRS are presented in Table 36. Table 36: Glossary and Abbreviations Term Explanation Archaean Geological eon from 2,500Ma - 4,000Ma Assay The chemical analysis of ore samples to determine their metal content Auriferous Containing, or producing, gold Basin A geological basin is a large low-lying area, often below sea level Clastic A rock or sediment composed principally of transported broken fragments derived from pre-existing rocks or minerals Conformable A sequence of beds is said to be conformable when they represent an unbroken period of deposition Conglomerate A coarse-grained clastic sedimentary rock composed of rounded to subangular fragments set in a fine-grained matrix Craton An old and stable section of the continental lithosphere which has survived cycles of merging and rifting continents. Cratons are today generally found in the interior of tectonic plates Cut-off grade The lowest grade of mineralized rock that determines as to whether or not it is economic to recover its gold content by further concentration Density Measure of the relative “heaviness” of objects with a constant volume, density = mass/volume Deposit Any sort of earth material that has accumulated through the action of wind, water, ice or other agents De-survey Mathematical reconstruction in 3D space of a borehole trace using azimuth and dip survey data Detrital Formed from eroded loose rock and mineral material Dilution Waste or material below the cut-off grade that contaminates the ore during the course of mining operations and thereby reduces the average grade mined Definitive Feasibility Study (DFS) A definitive engineering estimate of all costs, revenues, equipment requirements and production at a -5% to +10% level of accuracy. The study is used to define the economic viability of a project and to support the search for project financing Distal Relating to or denoting the outer part of an area affected by geological activity Dolomite Carbonate mineral, CaMg(CO3)2. The word dolomite is also used to describe the sedimentary carbonate rock, which is composed predominantly of the mineral dolomite Doré An unrefined, therefore impure, alloy of gold with variable quantities of silver and smaller quantities of base metals, which is produced at a mine before passing on to a refinery for upgrading to London Good Delivery standard, which usually consists of 85% gold on average

133 Far West Gold Recoveries (Proprietary) Limited Document No: PR/SMI/1684/26 Term Explanation Drillhole Exploration hole drilled for the purposes of exploring for and evaluating sub-surface geology, in this instance the presence and distribution of gold Dyke A tabular vertical or near-vertical body of igneous rock formed by magmatic injection into planar zones of weakness such as faults or fractures that is discordant to the bedding or foliation of the country rock Estimation The quantitative judgement of a variable Exploration Prospecting, sampling, mapping, drilling and other work involved in the search for mineralization Facies The sum total of sedimentary features that characterize a sediment as having been deposited in a given environment; an assemblage of metamorphic rocks which are considered to have formed under similar conditions of temperature and pressure Fault A fracture in earth materials, along which the opposite sides have been displaced parallel to then plane of the movement Fire Assay The assaying of metallic ores by methods requiring the use of furnace heat Fluvial Produced by the action of a stream or river Footwall The underlying side of a stope or ore body Goldfield An auriferous deposit defined in a geographically distinct sub-basin Granite An intrusive felsic rock which is granular in texture Hydrothermal The circulation of hot water. Hydrothermal circulation occurs most often in the vicinity of sources of heat within the Earth's crust. In general, this occurs near volcanic activity Indicated Mineral Resource Is that part of a Mineral Resource for which quantity and grade or quality are estimated on the basis of adequate geological evidence and sampling. The level of geological certainty associated with an indicated Mineral Resource is sufficient to allow a qualified person to apply modifying factors in sufficient detail to support mine planning and evaluation of the economic viability of the deposit. Because an indicated Mineral Resource has a lower level of confidence than the level of confidence of a measured mineral resource, an indicated Mineral Resource may only be converted to a probable Mineral Reserve. Inferred Mineral Resource Is that part of a Mineral Resource for which quantity and grade or quality are estimated on the basis of limited geological evidence and sampling. The level of geological uncertainty associated with an inferred Mineral Resource is too high to apply relevant technical and economic factors likely to influence the prospects of economic extraction in a manner useful for evaluation of economic viability. Because an inferred Mineral Resource has the lowest level of geological confidence of all Mineral Resources, which prevents the application of the modifying factors in a manner useful for evaluation of economic viability, an inferred Mineral Resource may not be considered when assessing the economic viability of a mining project, and may not be converted to a Mineral Reserve. Karoo A large semi-desert natural region of South Africa which lends its name to the geological Karoo Supergroup which is often used as an age description for the eon from 145Ma - 360Ma Kriging An interpolation method that minimizes the estimation error in the determination of a mineral resource. Kriging is a method of interpolation for which the interpolated values are modelled by a Gaussian process governed by prior covariances License, Permit, Lease or other similar entitlement Any form of license, permit, lease or other entitlement granted by the relevant Government department in accordance with its mining legislation that confers on the holder certain rights to explore for and/or extract minerals that might be contained in the land, or ownership title that may prove ownership of the minerals Life-of-Mine (LoM) Number of years in the current mine plan that an operation will extract and treat ore Measured Mineral Resource is that part of a Mineral Resource for which quantity and grade or quality are estimated on the basis of conclusive geological evidence and sampling. The level of geological certainty associated with a measured Mineral Resource is sufficient to allow a qualified person to apply modifying factors, in sufficient detail to support detailed mine planning and final evaluation of the economic viability of the deposit. Because a measured Mineral Resource has a higher level of confidence than the level of confidence of either an indicated Mineral Resource or an inferred Mineral Resource, a measured Mineral Resource may be converted to a proven Mineral Reserve or to a probable Mineral Reserve. Mineable That portion of a mineral resource for which extraction is technically and economically feasible Mineral Asset(s) Any right to explore and/or mine which has been granted (“property”), or entity holding such property or the securities of such an entity, including but not limited to all corporeal and incorporeal property, mineral rights, mining titles, mining leases, intellectual property, personal property (including plant equipment and infrastructure), mining and exploration tenures and titles or any other right held or acquired in connection with the finding and removing of minerals and petroleum located in, on or near the Earth’s crust. Mineral Assets can be classified as Dormant Properties, Exploration Properties, Development Properties, Mining Properties or Defunct Properties Mineral Reserve Is an estimate of tonnage and grade or quality of indicated and measured Mineral Resources that, in the opinion of the QP, can be the basis of an economically viable project. More specifically, the economically mineable part of a measured or indicated Mineral Resource, which includes diluting materials and allowances for losses that may occur when the material is mined or extracted. The determination that part of a measured or indicated Mineral Resource is economically mineable must be based on a preliminary feasibility or feasibility study conducted by a QP applying the modifying factors to indicated or measured Mineral Resources. The study must demonstrate that, at the time of the reporting, extraction of the Mineral Reserve is economically viable under reasonable investment and market assumptions. The study must establish a life of mine plan that is technically achievable and economically viable, which will be the basis of determining the Mineral Reserve. And the term “economically viable” means that the QP has determined, using a discounted cashflow analysis, or has otherwise analytically determined that the extraction of the mineral reserve is economically viable under reasonable investment and market assumptions. 134 Far West Gold Recoveries (Proprietary) Limited Document No: PR/SMI/1684/26 Term Explanation Mineral Resource Is a concentration or occurrence of material of economic interest in or on the Earth's crust in such form, grade or quality, and quantity that there are reasonable prospects for economic extraction. A Mineral Resource is a reasonable estimate of mineralization, taking into account relevant factors such as cut-off grade, likely mining dimensions, location or continuity, that, with the assumed and justifiable technical and economic conditions, is likely to, in whole or in part, become economically extractable. It is not merely an inventory of all mineralization drilled or sampled. Modifying Factors Are the factors that a qualified person must apply to indicated and measured Mineral Resources and then evaluate in order to establish the economic viability of Mineral Reserves. A qualified person must apply and evaluate modifying factors to convert measured and indicated Mineral Resources to proven and probable Mineral Reserves. These factors include, but are not restricted to: Mining; processing; metallurgical; infrastructure; economic; marketing; legal; environmental compliance; plans, negotiations, or agreements with local individuals or groups; and governmental factors. The number, type and specific characteristics of the modifying factors applied will necessarily be a function of and depend upon the mineral, mine, property, or project. Reef A precious metal bearing stratiform tabular ore body Run-of-Mine (RoM) Means the mineralized, raw unprocessed or uncrushed material obtained after blasting or excavating Shale A fine-grained detrital sedimentary rock formed from clay, mud or silt Strike Refers to the orientation of a geologic feature which is a line representing the intersection of that feature with a horizontal plane. This is represented as a compass bearing of the strike line Syncline A fold with strata sloping upward on both sides from a common valley/base Tailings Material remaining after ore has been processed Unconformity A surface between successive strata representing a missing interval in the geologic record of time and produced either by an interruption in deposition or by the erosion of lithology followed by renewed deposition Uraninite A black, brown or grey uranium ore mineral, UO2 Variogram A measure of the average variance between sample locations as a function of sample separation Wireframe A 3D surface constructed from vertices with connecting straight lines or curves Term Description % percentage % Au percentage gold % mass percentage mass ~ approximate ‘ minutes ‘000m3 thousand cubic meters “ seconds ° Degree °C Degrees Celsius µm micrometer 3D three dimensional AEL Atmospheric Emissions License ALS ALS Chemex South Africa (Proprietary) Limited AMIS African Mineral Standards ANC African National Congress Au Gold Au(CN)2 gold cyanide complex Aztec AZTEC Mining (Proprietary) Limited bar metric unit of pressure BPS Booster Pump Stations CIL Carbon-in-Leach CIP Carbon-in-Pulp CLR Carbon Leader Reef cm centimeter cm3 cubic centimeter COP Cooke Optimization Project CoR Certificate of Registration Covid-19 Coronavirus Disease 2019 CPP Central Processing Plant CRM Certified Reference Material CTSF Central Tailings Storage Facility CUP Cooke Uranium Project DA Democratic Alliance 135 Far West Gold Recoveries (Proprietary) Limited Document No: PR/SMI/1684/26 Term Explanation DAFF Department of Agriculture Forestry and Fisheries DCF Discounted Cashflow DFS Definitive Feasibility Study Digby Wells Digby Wells Environmental (South Africa) (Proprietary) Limited DMPR Department of Mineral and Petroleum Resources DP2 Driefontein Plant 2 DP3 Driefontein Plant 3 DRA DRA SA (Proprietary) Limited DRDGOLD DRDGOLD Limited DWS Department of Water and Sanitation E east EA Environmental Authorization under NEMA EAPASA Environmental Assessment Practitioners Association of South Africa ECA Environmental Conservation Act ECSA Engineering Council of South Africa EIA Environmental Impact Assessment EMP Environmental Management Plan EMPr Environmental Management Program Report Ergo Ergo Mining (Proprietary) Limited Eskom Electricity Supply Commission ESTA Extension of Security of Tenure Act Ezulwini Ezulwini Mining Company (Proprietary) Limited FEED Front End Engineering Design FSAIMM Fellow of the Southern African Institute of Mining and Metallurgy FWGR Far West Gold Recoveries (Proprietary) Limited FY Financial Year g gram g/cm3 grams per cubic centimeter g/t grams per tons g/t Au grams per tons gold Ga Giga annum (a period of 1 billion years) GDP Gross Domestic Product GICL Guardrisk Insurance Company Limited GISTM Global Industry Standard on Tailings Management GN Government Notice GNR Government Notice Regulation GNU Government of National Unity Gold Fields Gold Fields Limited Gold One Gold One International Limited GPS Global Positioning System GSSA Geological Society of South Africa GTSA Geo Tail SA (Proprietary) Limited GWh Gigawatt-hour H2SO4 sulfuric acid ha Hectare Harmony Harmony Gold Mining Company Limited HDPE high-density polyethylene pipe HIA Heritage Impact Assessment HIV/AIDS Human Immunodeficiency Viruses/Acquired Immunodeficiency Syndrome HNO3 nitric acid hr Hour HSA Hazardous Substances Act I&APs Interested & Affected Parties IEA Integrated Environmental Authorization IFP Inkatha Freedom Party 136 Far West Gold Recoveries (Proprietary) Limited Document No: PR/SMI/1684/26 Term Explanation iLanda iLanda Water Services CC ISO International Organization for Standardization IWUL Integrated Water Use License JSE Johannesburg Stock Exchange Limited JV Joint Venture kg kilogram kHz kilohertz km kilometer koz kilo ounce ktpm kiloton per month kV kilovolt kVA kilovolt-ampere LIDAR light detection and ranging LoM Life-of-Mine m meters M million m/yr meters per year m2 square meter m³ cubic meter m³/a cubic meter per annum m³/d cubic meters per day m³/hr cubic meter per hour Ma Mega annum (a period of 1 million years) MAED MAED Metallurgical Laboratories mamsl meters above mean sea level MHSA Mine Health and Safety Act Minxcon Minxcon (Proprietary) Limited mm millimeters Mm3 Million cubic meters Mm3/a Million cubic meters per annum Moz Millions of ounces MPRDA Mineral and Petroleum Resources Development Act MPRRA Mineral and Petroleum Resources Royalty Act MR Mining Right Mt Million tons Mtpm Million tons per month MVA Mega Volt Ampere N north NAEIS National Atmospheric Emission Inventory System NEM:AQA National Environmental Management Air Quality Act NEM:BA National Environmental Management Biodiversity Act NEM:PAA National Environmental Management: Protected Areas Act NEM:WA National Environmental Management Waste NEMA National Environmental Management Act NERSA National Energy Regulator of South Africa NFA National Forests Act NHRA National Heritage Resources Act NMD Nominal Maximum Demand NNR National Nuclear Regulator NNRA National Nuclear Regulator Act NOA Group NOA Group Assets Proprietary Limited NPV Net Present Value NRTA National Road Traffic Act NWA National Water Act NYSE New York Stock Exchange

137 Far West Gold Recoveries (Proprietary) Limited Document No: PR/SMI/1684/26 Term Explanation oz troy ounce (conversion to troy ounces is 31.10348) oz Au gold ounces Performance Laboratories Performance Laboratories Proprietary Limited PFS Preliminary Feasibility Study pH scale used to specify the acidity or basicity of an aqueous solution PMP Probable Maximum Precipitation PoD Point of Delivery QA/QC Quality Assurance and Quality Control QP Qualified Person Rand Uranium Rand Uranium Limited RoM Run-of-Mine RTK Real Time Kinetic RTSF Regional Tailings Storage Facility S south S2 sulfur SACNASP South African Council for Natural Scientific Professions SADPMR The South African Diamond and Precious Metals Regulator SAIMM Southern African Institute of Mining and Metallurgy SALA Subdivision of Agricultural Land Act SANAS South African National Accreditation System SEC Securities and Exchange Commission Set Point Set Point Laboratories SG Specific Gravity SGS SGS South Africa (Proprietary) Limited SI Système Internationale SIA Social Impact Assessment SiB Stay-in-Business Sibanye Gold Sibanye Gold (Proprietary) Limited Sibanye-Stillwater Sibanye Stillwater Limited S-K 1300 Subpart 1300 of Regulation S-K under the U.S. Securities Exchange Act of 1934 SLP Social and Labor Plan Sound Mining Sound Mining International SA (Proprietary) Limited SPLUMA Spatial Planning and Land Use Management Act, SPV Special Purpose Vehicle SRK SRK Consulting (Proprietary) Limited SVOL1 first search volume SVOL2 second search volume t metric tons t/m3 tons per cubic meter TDS total dissolved solids the Trust DRDSA Empowerment Trust ToR Terms of Reference tpa tons per annum tph tons per hour tpm tons per month TRS Technical Report Summary TSF Tailings Storage Facility U uranium U3O8 triuranium octoxide UFR Aztec UpFlow Reactor USD United States Dollars USD/oz United States Dollars per ounce UTM Gauss Conform Projection V1 Version 1 138 Far West Gold Recoveries (Proprietary) Limited Document No: PR/SMI/1684/26 Term Explanation V2 Version 2 V:H Vertical Distance: Horizontal Distance VCR Ventersdorp Contact Reef W west Witwatersrand Basin Witwatersrand Supergroup WML Waste Management License WRTRP West Rand Tailings Retreatment Project (Proprietary) Limited WUL Water Use License WWP West Wits Project WWTTP West Wits Tailings Treatment Project ZAR South African Rands ZAR Billion Billion South African Rands ZAR M Million South African Rands ZAR M/yr Millions of South African Rands per year ZAR/kg South African Rands per kilogram ZAR/t South African Rands per tons ZAR/USD South African Rands and United States Dollars exchange rate 139 Far West Gold Recoveries (Proprietary) Limited Document No: PR/SMI/1684/26 24. RELIANCE ON INFORMATION PROVIDED BY THE REGISTRANT ITEM 24 The information and conclusions within this TRS are based on information made available to the QPs by DRDGOLD and FWGR at the time of the preparation of this TRS. The QPs have relied on this information with respect to legal matters (Item 3), environmental or social and labor planning aspects (Item 17) and economic assumptions (Item 19). The QPs have reviewed this information at face value and are satisfied that it is both reasonable and appropriate. QPs consider it reasonable to rely on the information provided by FWGR since they are familiar with the operations and ongoing progress of FWGR since inception, and as a consequence enjoy an enhanced level of comfort with respect to management integrity and the processes, procedures and quality of planning conducted at FWGR. Additional information provided by FWGR included technical reports supplied by its consultants and associates and the relevant published data, as listed below: • the QPs have not independently conducted any title or litigation searches but have relied upon FWGR for information on the property title, agreements and other pertinent conditions; • these studies were undertaken by Digby Wells Environmental (South Africa) (Proprietary) Limited (Digby Wells) and Sound Mining has relied on the findings of these studies; • DRA SA (Proprietary) Limited were responsible for the detailed design for the expansion of DP2 and associated piping and pumping infrastructure; • Geo Tail SA (Proprietary) Limited (GTSA) were responsible for the Cyclone Conversion Design as well as the design of the RTSF; and the QPs have relied on the findings of this study; and • AZTEC Mining (Proprietary) Limited (AZTEC) were responsible for the UpFlow Reactor Test Work. 140 Far West Gold Recoveries (Proprietary) Limited Document No: PR/SMI/1684/26 25. QUALIFIED PERSONS DISCLOSURE CONSENT ITEM 25 We, the signees, in our capacity as Qualified Persons in connection with the Technical Report Summary of Far West Gold Recoveries Proprietary Limited dated October 2, 2026 (The Technical Report Summary) as required by Item 601(b)(96) of Regulation S-K and filed as an exhibit to DRDGOLD Limited’s (DRDGOLD) annual report on Form 20-F for the year ended June 30, 2026 and any amendments or supplements and/or exhibits thereto (collectively, the “Form 20-F”) pursuant to Subpart 1300 of Regulation S-K promulgated by the U.S. Securities and Exchange Commission (1300 Regulation S-K), each hereby consent to: • the public filing and use by DRDGOLD of the Technical Report Summary for which I am responsible as an exhibit to the Form 20-F; • the use and reference to my name, including my status as an expert or Qualified Person (as defined by SK-1300) in connection with the Form 20-F and Technical Report Summary for which I am responsible; • use of any extracts from, or summary of, the Technical Report Summary in the Form 20-F and the use of any information derived, summarized, quoted or referenced from the Technical Report Summary, or portions thereof, that is included or incorporated by reference into the Form 20-F; and any amendments or supplements thereto. I am responsible for authoring, and this consent pertains to, the Technical Report Summary for which my name appears below and certify that I have read the 20-F and that it fairly and accurately represents the information in the Technical Report Summary for which I am responsible. Table 37: QP Area of Responsibility and Disclosure Consent Property Name TRS Effective Date QP Name Affiliation to Registrant Field or Area of Responsibility Signature Far West Gold Recoveries Proprietary Limited (A subsidiary of DRDGOLD Limited) June 30, 2026 Mr Vaughn Duke Independent Consultant Item 1 to 5, 10, 12 to 16, and 18 to 25 /s/ Vaughn Duke Far West Gold Recoveries Proprietary Limited (A subsidiary of DRDGOLD Limited) June 30, 2026 Mr Nicholas Weeks Independent Consultant Item 1, 6 to 9 and 11 /s/ Nicholas Weeks Far West Gold Recoveries Proprietary Limited (A subsidiary of DRDGOLD Limited) June 30, 2026 Mr W de Frey Independent Consultant Item 17 /s/ Willem de Frey
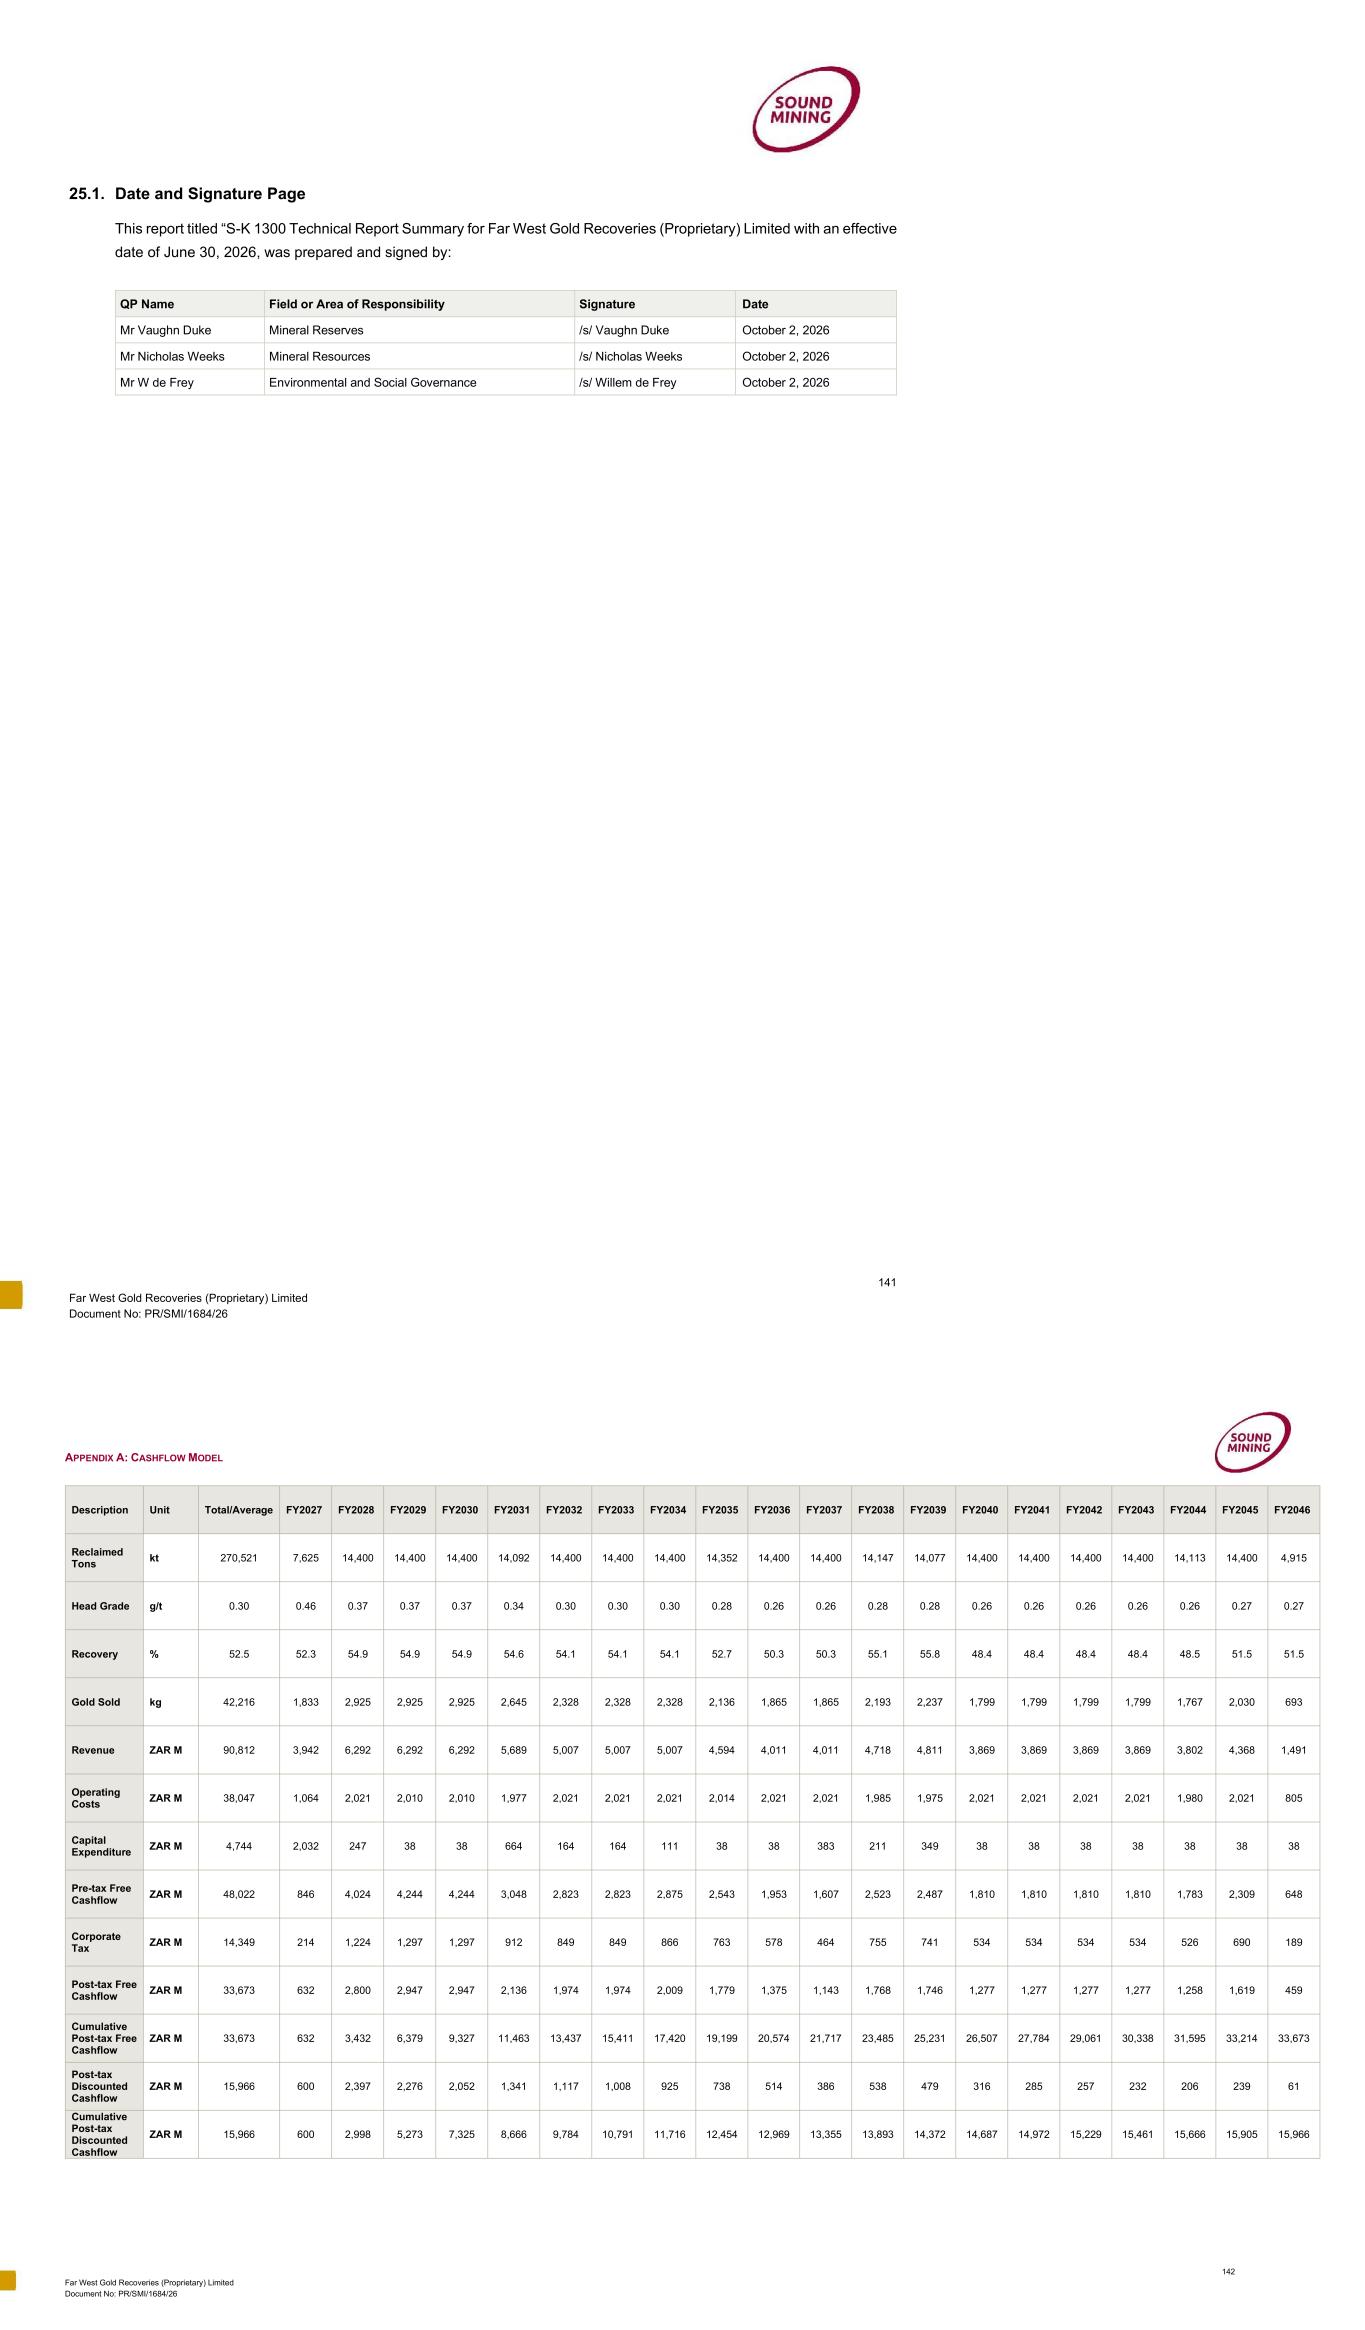
141 Far West Gold Recoveries (Proprietary) Limited Document No: PR/SMI/1684/26 25.1. Date and Signature Page This report titled “S-K 1300 Technical Report Summary for Far West Gold Recoveries (Proprietary) Limited with an effective date of June 30, 2026, was prepared and signed by: QP Name Field or Area of Responsibility Signature Date Mr Vaughn Duke Mineral Reserves /s/ Vaughn Duke October 2, 2026 Mr Nicholas Weeks Mineral Resources /s/ Nicholas Weeks October 2, 2026 Mr W de Frey Environmental and Social Governance /s/ Willem de Frey October 2, 2026 142 Far West Gold Recoveries (Proprietary) Limited Document No: PR/SMI/1684/26 APPENDIX A: CASHFLOW MODEL Description Unit Total/Average FY2027 FY2028 FY2029 FY2030 FY2031 FY2032 FY2033 FY2034 FY2035 FY2036 FY2037 FY2038 FY2039 FY2040 FY2041 FY2042 FY2043 FY2044 FY2045 FY2046 Reclaimed Tons kt 270,521 7,625 14,400 14,400 14,400 14,092 14,400 14,400 14,400 14,352 14,400 14,400 14,147 14,077 14,400 14,400 14,400 14,400 14,113 14,400 4,915 Head Grade g/t 0.30 0.46 0.37 0.37 0.37 0.34 0.30 0.30 0.30 0.28 0.26 0.26 0.28 0.28 0.26 0.26 0.26 0.26 0.26 0.27 0.27 Recovery % 52.5 52.3 54.9 54.9 54.9 54.6 54.1 54.1 54.1 52.7 50.3 50.3 55.1 55.8 48.4 48.4 48.4 48.4 48.5 51.5 51.5 Gold Sold kg 42,216 1,833 2,925 2,925 2,925 2,645 2,328 2,328 2,328 2,136 1,865 1,865 2,193 2,237 1,799 1,799 1,799 1,799 1,767 2,030 693 Revenue ZAR M 90,812 3,942 6,292 6,292 6,292 5,689 5,007 5,007 5,007 4,594 4,011 4,011 4,718 4,811 3,869 3,869 3,869 3,869 3,802 4,368 1,491 Operating Costs ZAR M 38,047 1,064 2,021 2,010 2,010 1,977 2,021 2,021 2,021 2,014 2,021 2,021 1,985 1,975 2,021 2,021 2,021 2,021 1,980 2,021 805 Capital Expenditure ZAR M 4,744 2,032 247 38 38 664 164 164 111 38 38 383 211 349 38 38 38 38 38 38 38 Pre-tax Free Cashflow ZAR M 48,022 846 4,024 4,244 4,244 3,048 2,823 2,823 2,875 2,543 1,953 1,607 2,523 2,487 1,810 1,810 1,810 1,810 1,783 2,309 648 Corporate Tax ZAR M 14,349 214 1,224 1,297 1,297 912 849 849 866 763 578 464 755 741 534 534 534 534 526 690 189 Post-tax Free Cashflow ZAR M 33,673 632 2,800 2,947 2,947 2,136 1,974 1,974 2,009 1,779 1,375 1,143 1,768 1,746 1,277 1,277 1,277 1,277 1,258 1,619 459 Cumulative Post-tax Free Cashflow ZAR M 33,673 632 3,432 6,379 9,327 11,463 13,437 15,411 17,420 19,199 20,574 21,717 23,485 25,231 26,507 27,784 29,061 30,338 31,595 33,214 33,673 Post-tax Discounted Cashflow ZAR M 15,966 600 2,397 2,276 2,052 1,341 1,117 1,008 925 738 514 386 538 479 316 285 257 232 206 239 61 Cumulative Post-tax Discounted Cashflow ZAR M 15,966 600 2,998 5,273 7,325 8,666 9,784 10,791 11,716 12,454 12,969 13,355 13,893 14,372 14,687 14,972 15,229 15,461 15,666 15,905 15,966