What were the Fund costs for the past year?
(based on a hypothetical $10,000 investment)
|
Fund
Name |
Costs
of a $10,000 investment |
Costs
paid as a percentage of a $10,000 investment |
|---|---|---|
|
WealthTrust
DBS Long Term Growth ETF |
$74 |
0.67% |
How did the Fund perform?
For the one-year period of August 1, 2025, to July 31, 2026, the WealthTrust DBS Long Term Growth ETF (the “Fund”) returned 19.76%, compared with a 19.56% return for the S&P 500® Index, outperforming the benchmark by 0.20 percentage points.
What key factors influenced performance?
U.S. equity markets remained resilient during the period despite changing expectations for monetary policy, elevated valuations in certain areas of the market, geopolitical developments, and shifts in sector leadership. The Fund's active investment approach emphasized companies with favorable earnings characteristics and attractive long-term growth prospects while maintaining flexibility as market conditions evolved.
The Fund's performance relative to the S&P 500® Index reflected the results of both security selection and portfolio positioning during the period. The Fund benefited from exposure to securities and areas of the market that demonstrated strong earnings and fundamental performance, while relative results were affected by positioning in areas that lagged the broader market.
Overall, the Fund generated a positive return and modestly exceeded the performance of the S&P 500® Index for the one-year period ended July 31, 2026.
Cumulative Performance
(based on a hypothetical $10,000 investment)
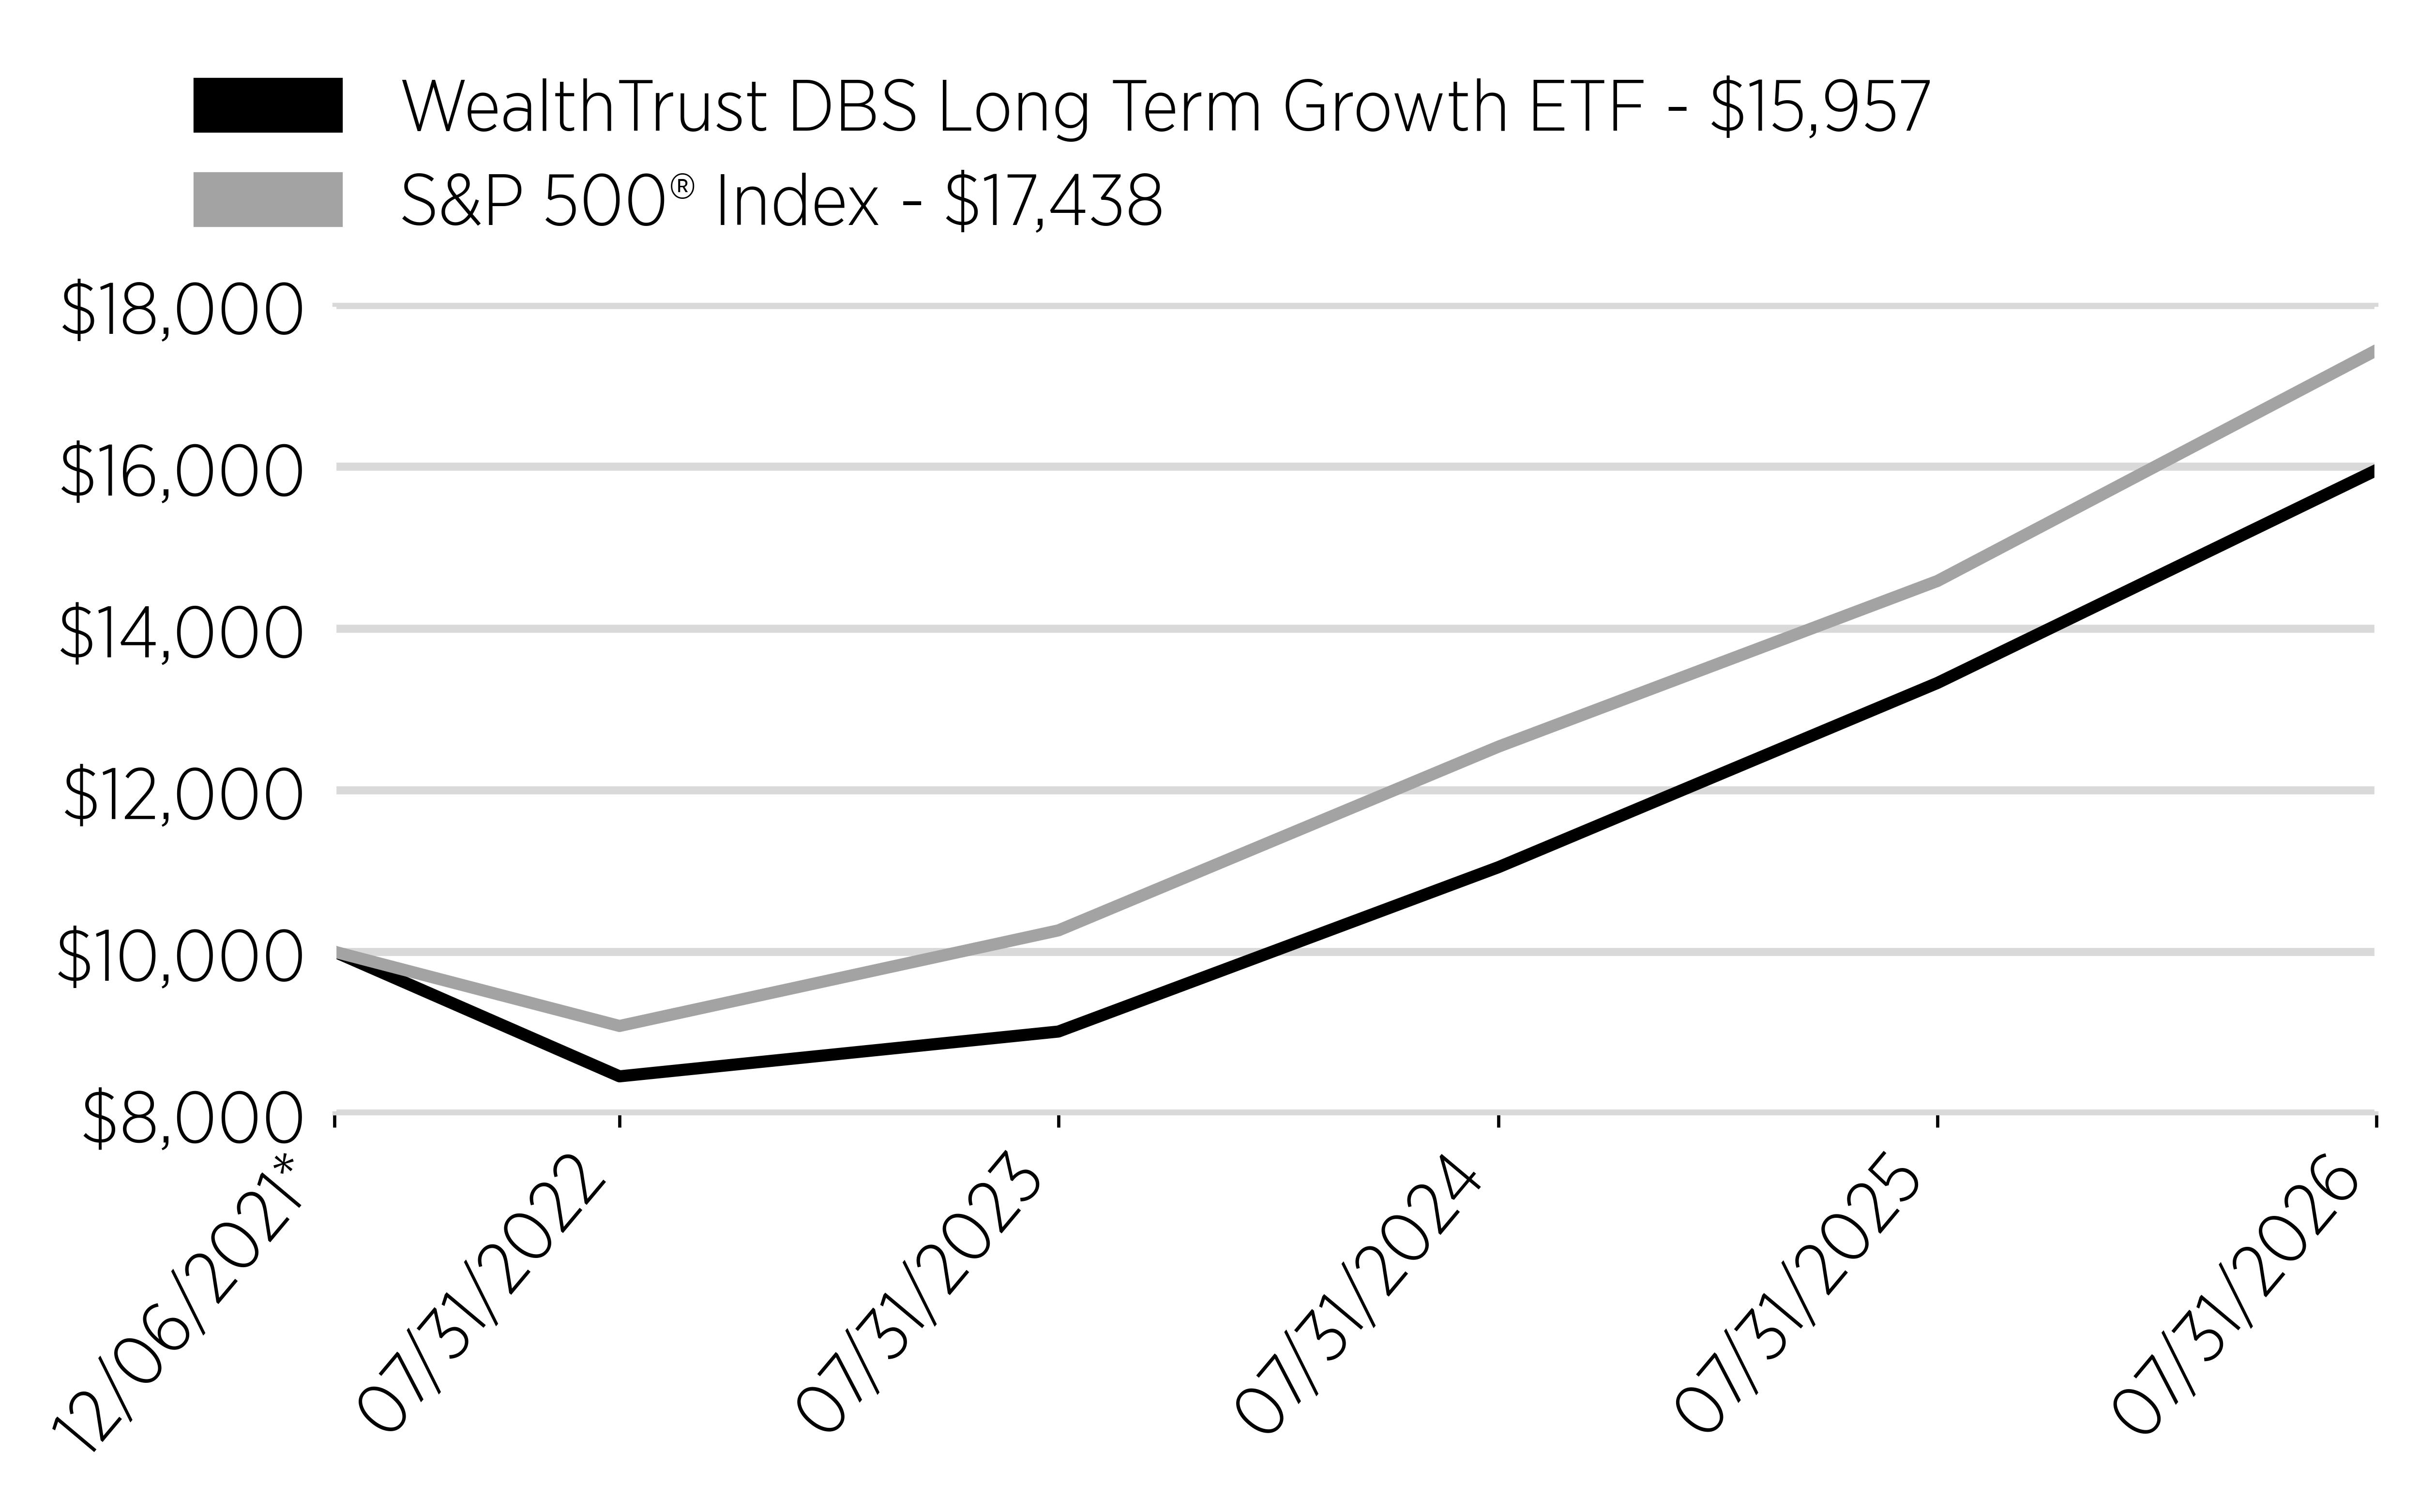
| * | Inception |
Annual Performance
|
|
1
Year |
Average
Annual
Total
Return
Since
Inception |
|---|---|---|
|
WealthTrust
DBS Long Term Growth ETF |
19.76% |
10.57% |
|
S&P
500® Index |
19.56% |
12.70% |
Key Fund Statistics
(as of July 31, 2026)
|
Fund
Net Assets |
$76,854,820 |
|
Number
of Holdings |
40 |
|
Total
Net Advisory Fee |
$465,602 |
|
Portfolio
Turnover Rate |
63.52% |
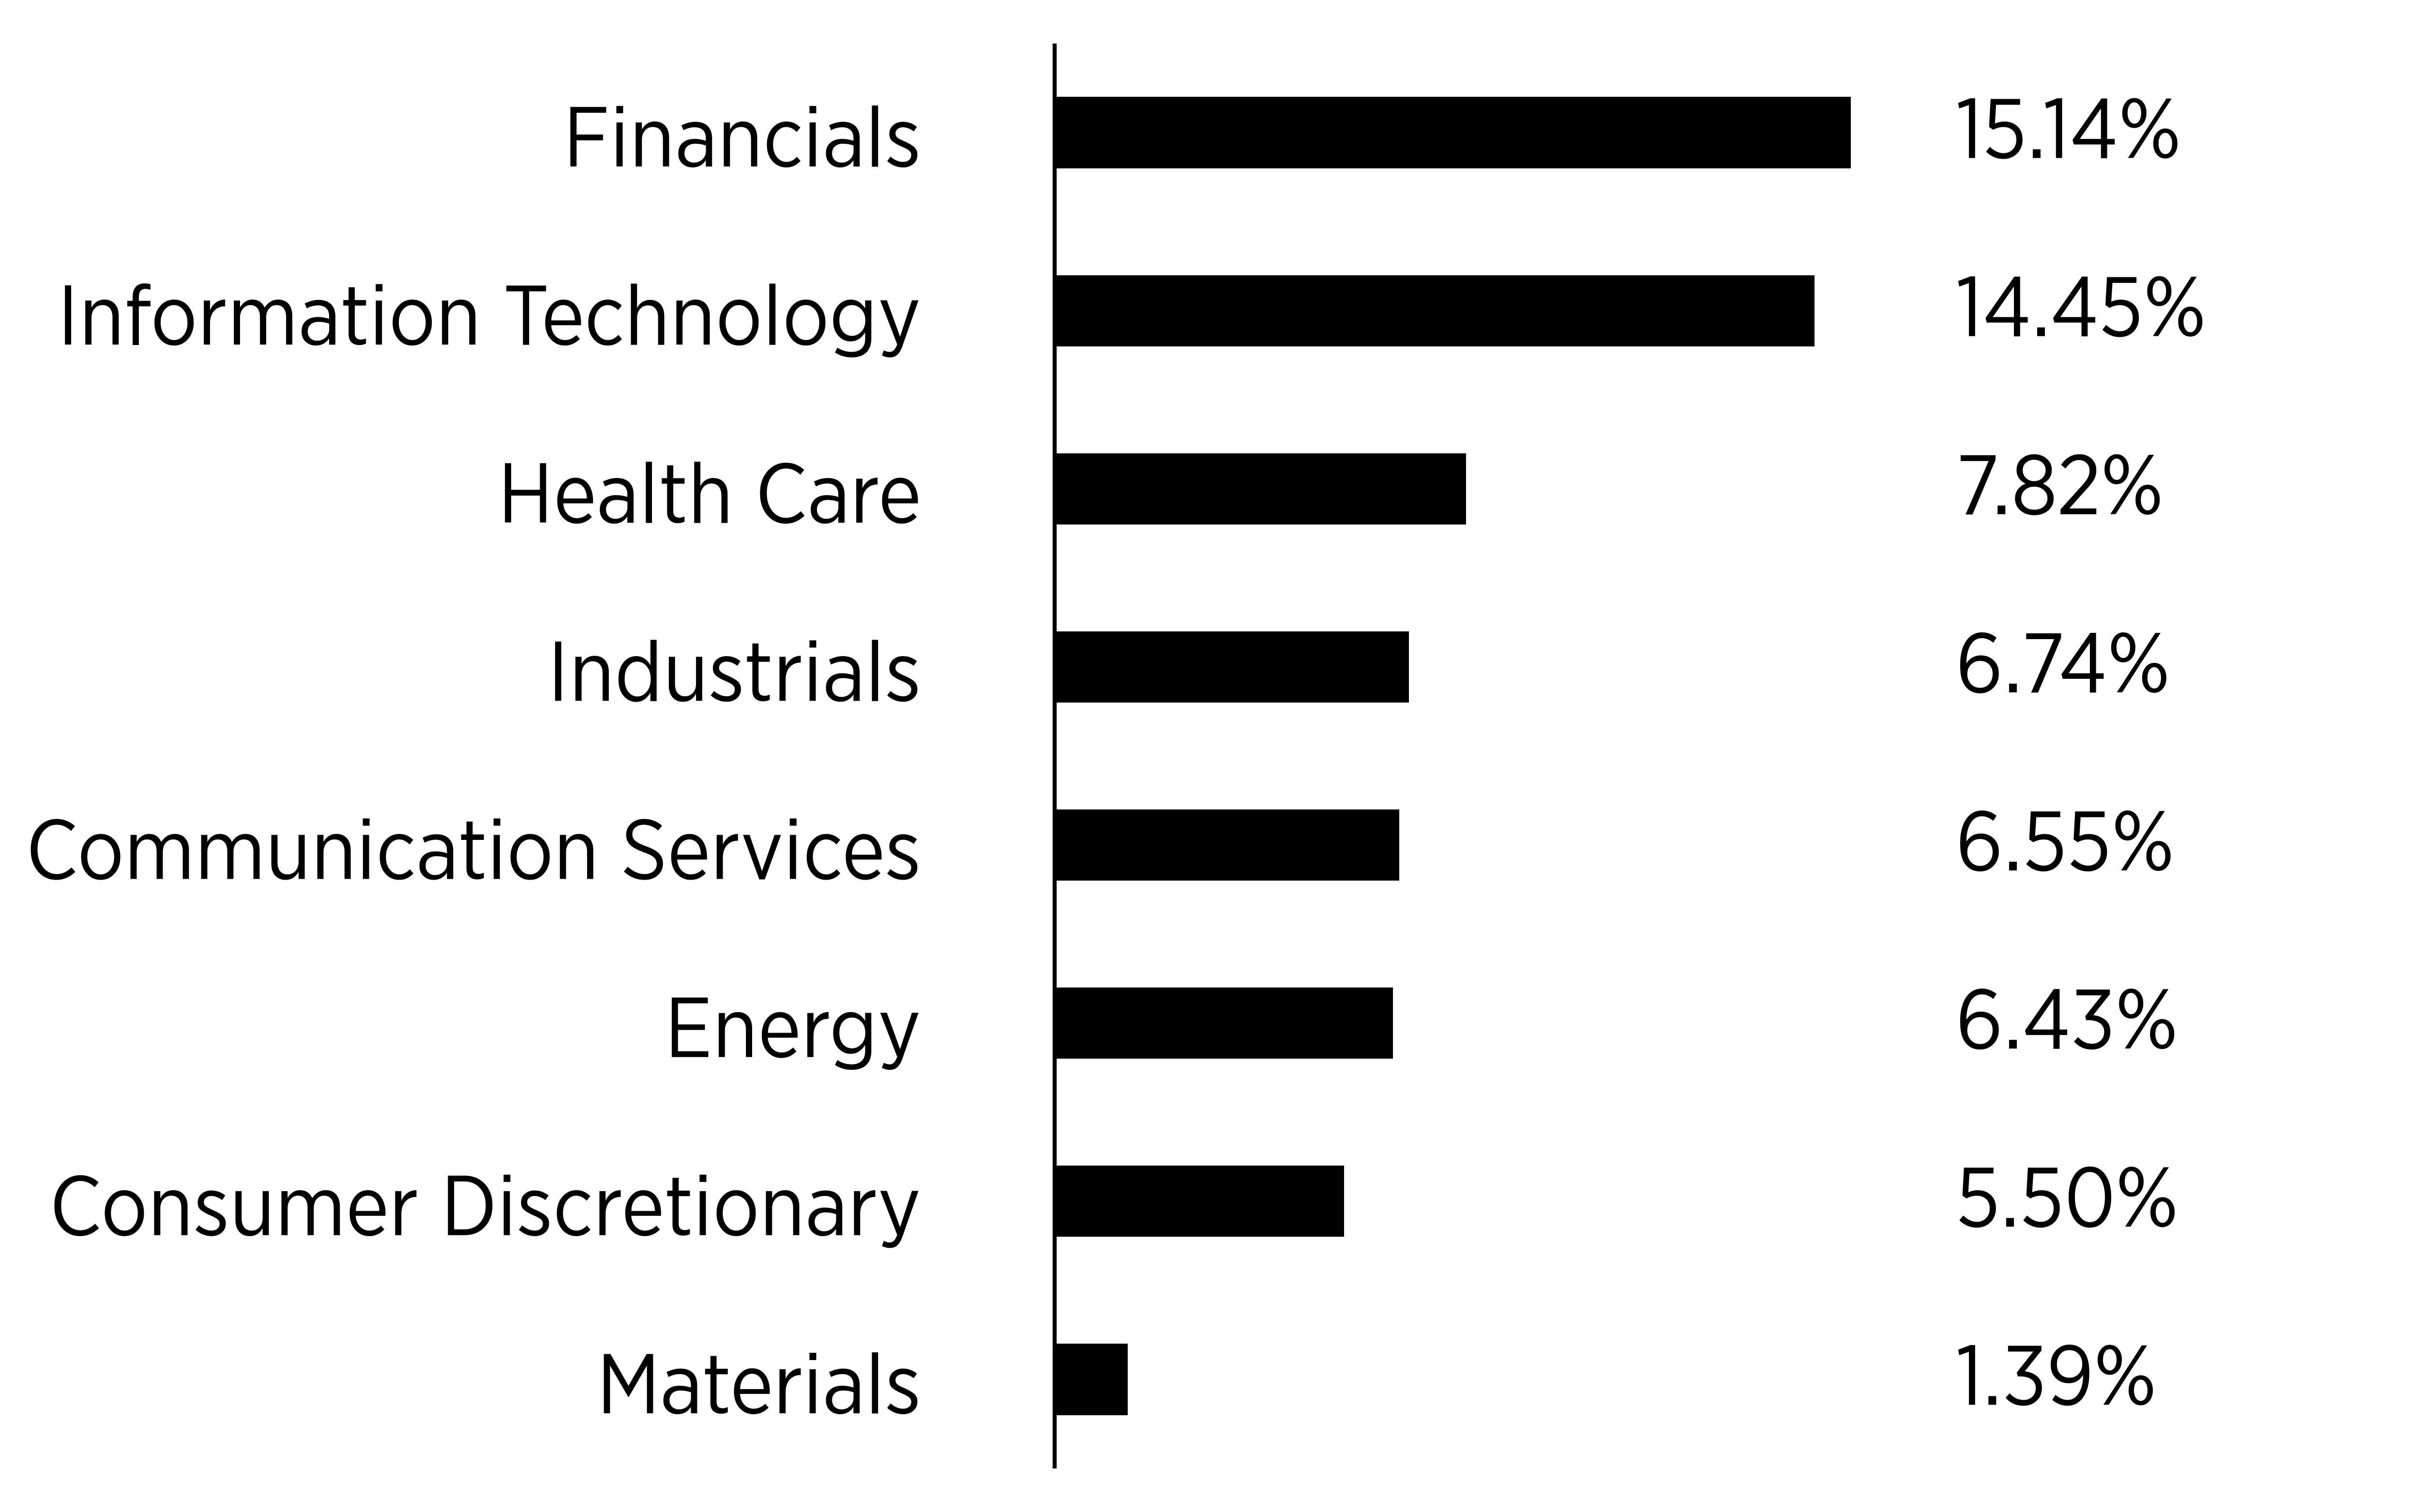
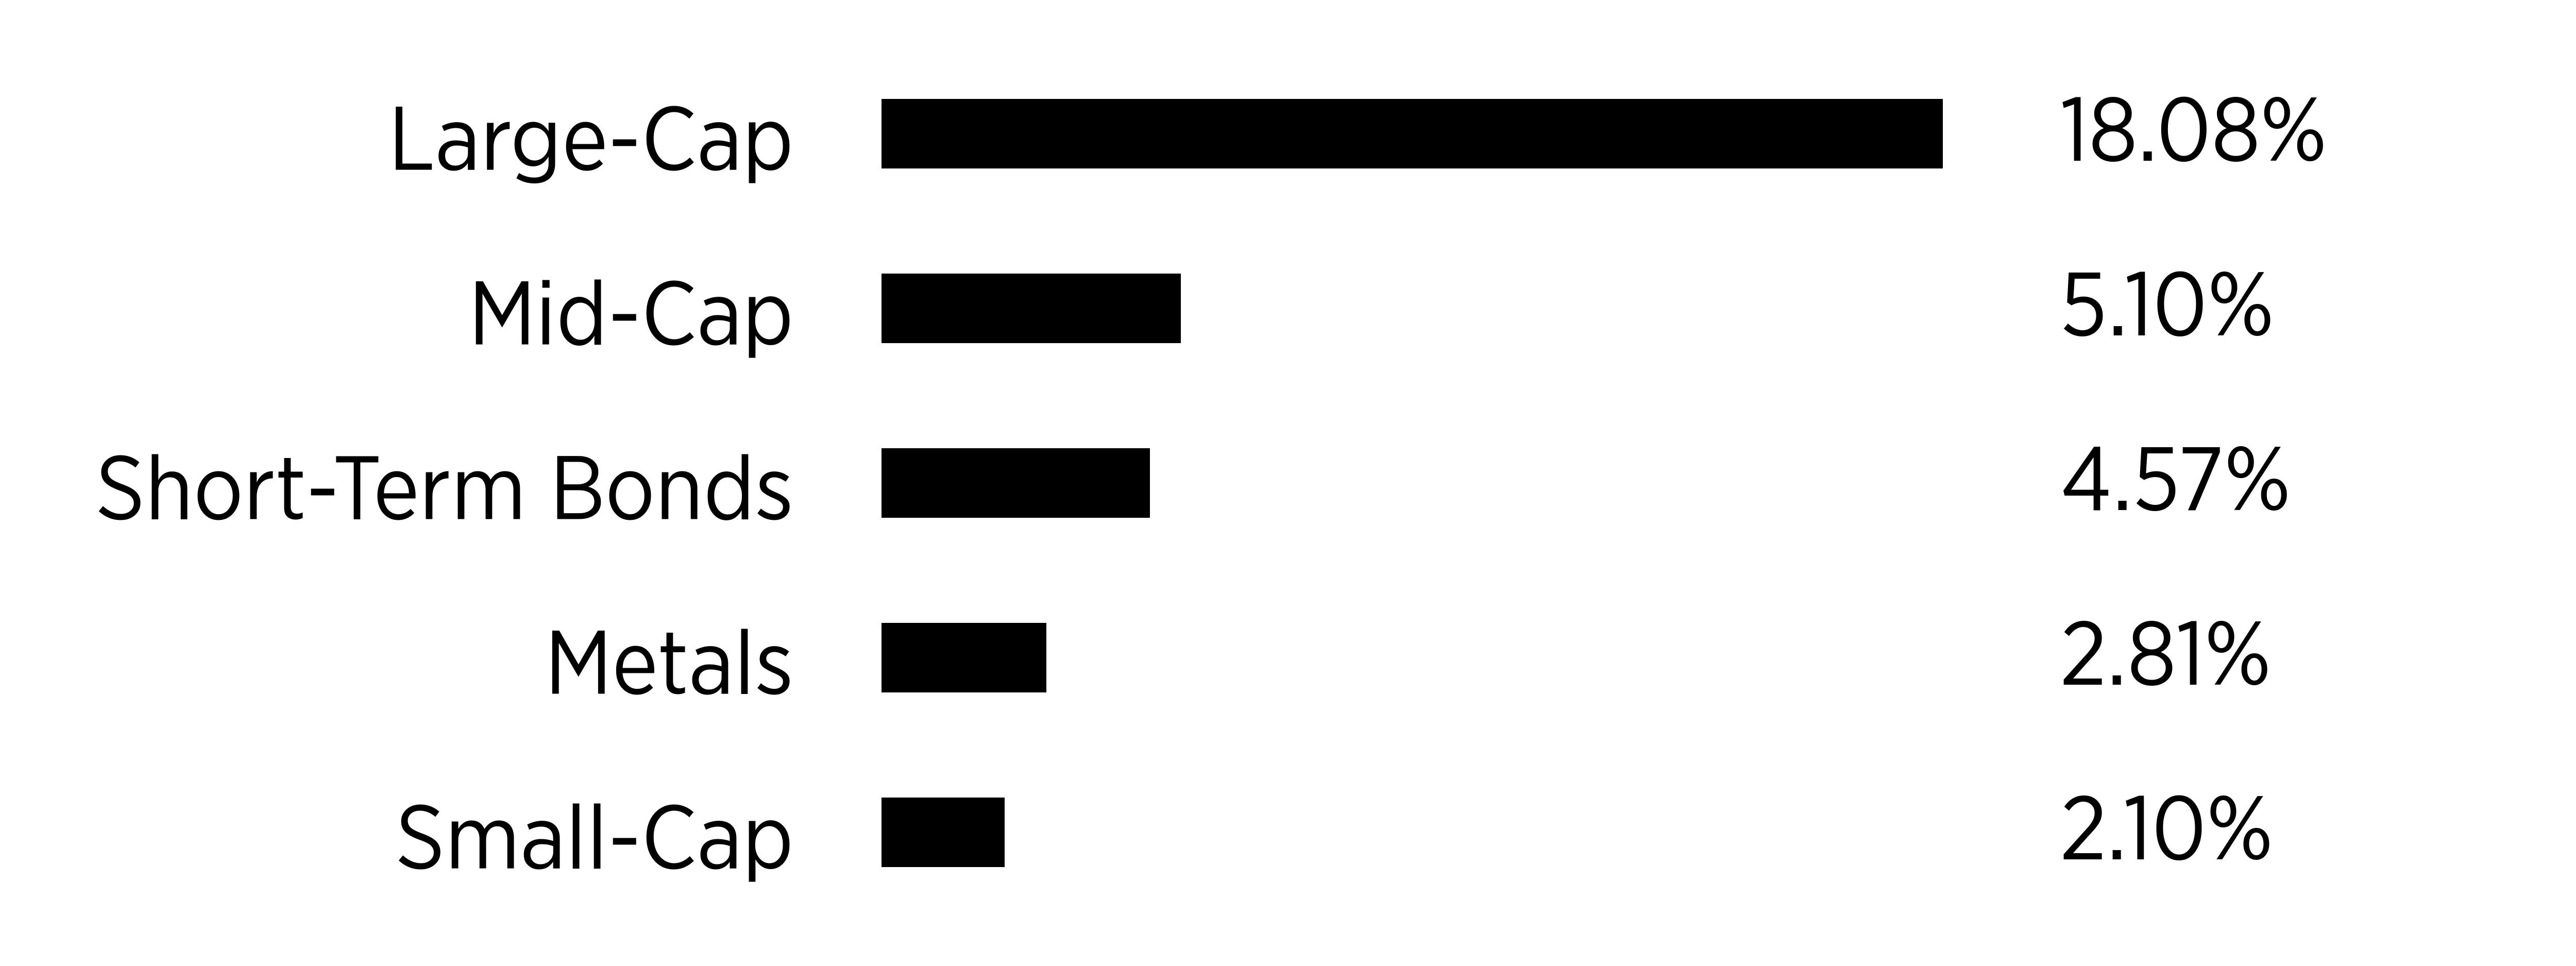
Sector Breakdown
Common Stocks
Exchange Traded Funds
|
Top
10 Holdings |
|
|---|---|
|
iShares
Russell 1000 ETF |
|
|
Vanguard
Mid-Cap ETF |
|
|
Invesco
QQQ Trust Series |
|
|
SPDR
Bloomberg 3-12 Month |
|
|
Taiwan
Semiconductor Manufacturing Co. Ltd. |
|
|
Nvidia
Corp. |
|
|
Eli
Lilly & Co. |
|
|
Vanguard
Mega Cap Growth ETF |
|
|
Amazon.com,
Inc. |
|
|
Bank
of New York Mellon |