Shareholder Report
Jul. 31, 2026
USD ($)
Holdings
What were the Fund costs for the past year?
(based on a hypothetical $10,000 investment)
|
Fund
Name |
Costs
of a $10,000 investment |
Costs
paid as a percentage of a $10,000 investment |
|---|---|---|
|
REX
FANG & Innovation Equity Premium Income ETF |
$68 |
0.65% |
How did the Fund perform?
For the period of August 1, 2025, to July 31, 2026, the REX FANG & Innovation Equity Premium Income ETF (the "Fund") returned 10.64%. In comparison, the S&P 500® Index and the Solactive FANG Innovation Index Total Return returned 19.56% and 35.00% respectively for the same period.
What key factors influenced performance?
- Technology and AI-related equities generally rose during the period, but returns among individual large-capitalization technology companies were dispersed. Several of the largest contributors advanced sharply while other well-known holdings declined significantly.
- The Fund's equity holdings mirror the Solactive FANG Innovation Index, an equal-weighted index of highly liquid technology stocks. Because the Fund's portfolio is concentrated in a small number of technology companies, it experienced greater volatility than the broader market.
- The Fund's strategy of selling covered calls caused performance to depend not only on the price returns of the individual equity holdings, but also on the paths that the prices of the individual stocks took over time. Significant upside trends in several AI-related equities during the period led to reduced participation in equity price gains relative to the Solactive FANG Innovation Index. Option premiums received were retained and contributed to income, but did not offset the upside forgone on appreciating holdings, and the Fund's return trailed that of the underlying index for the period.
Cumulative Performance
(based on a hypothetical $10,000 investment)
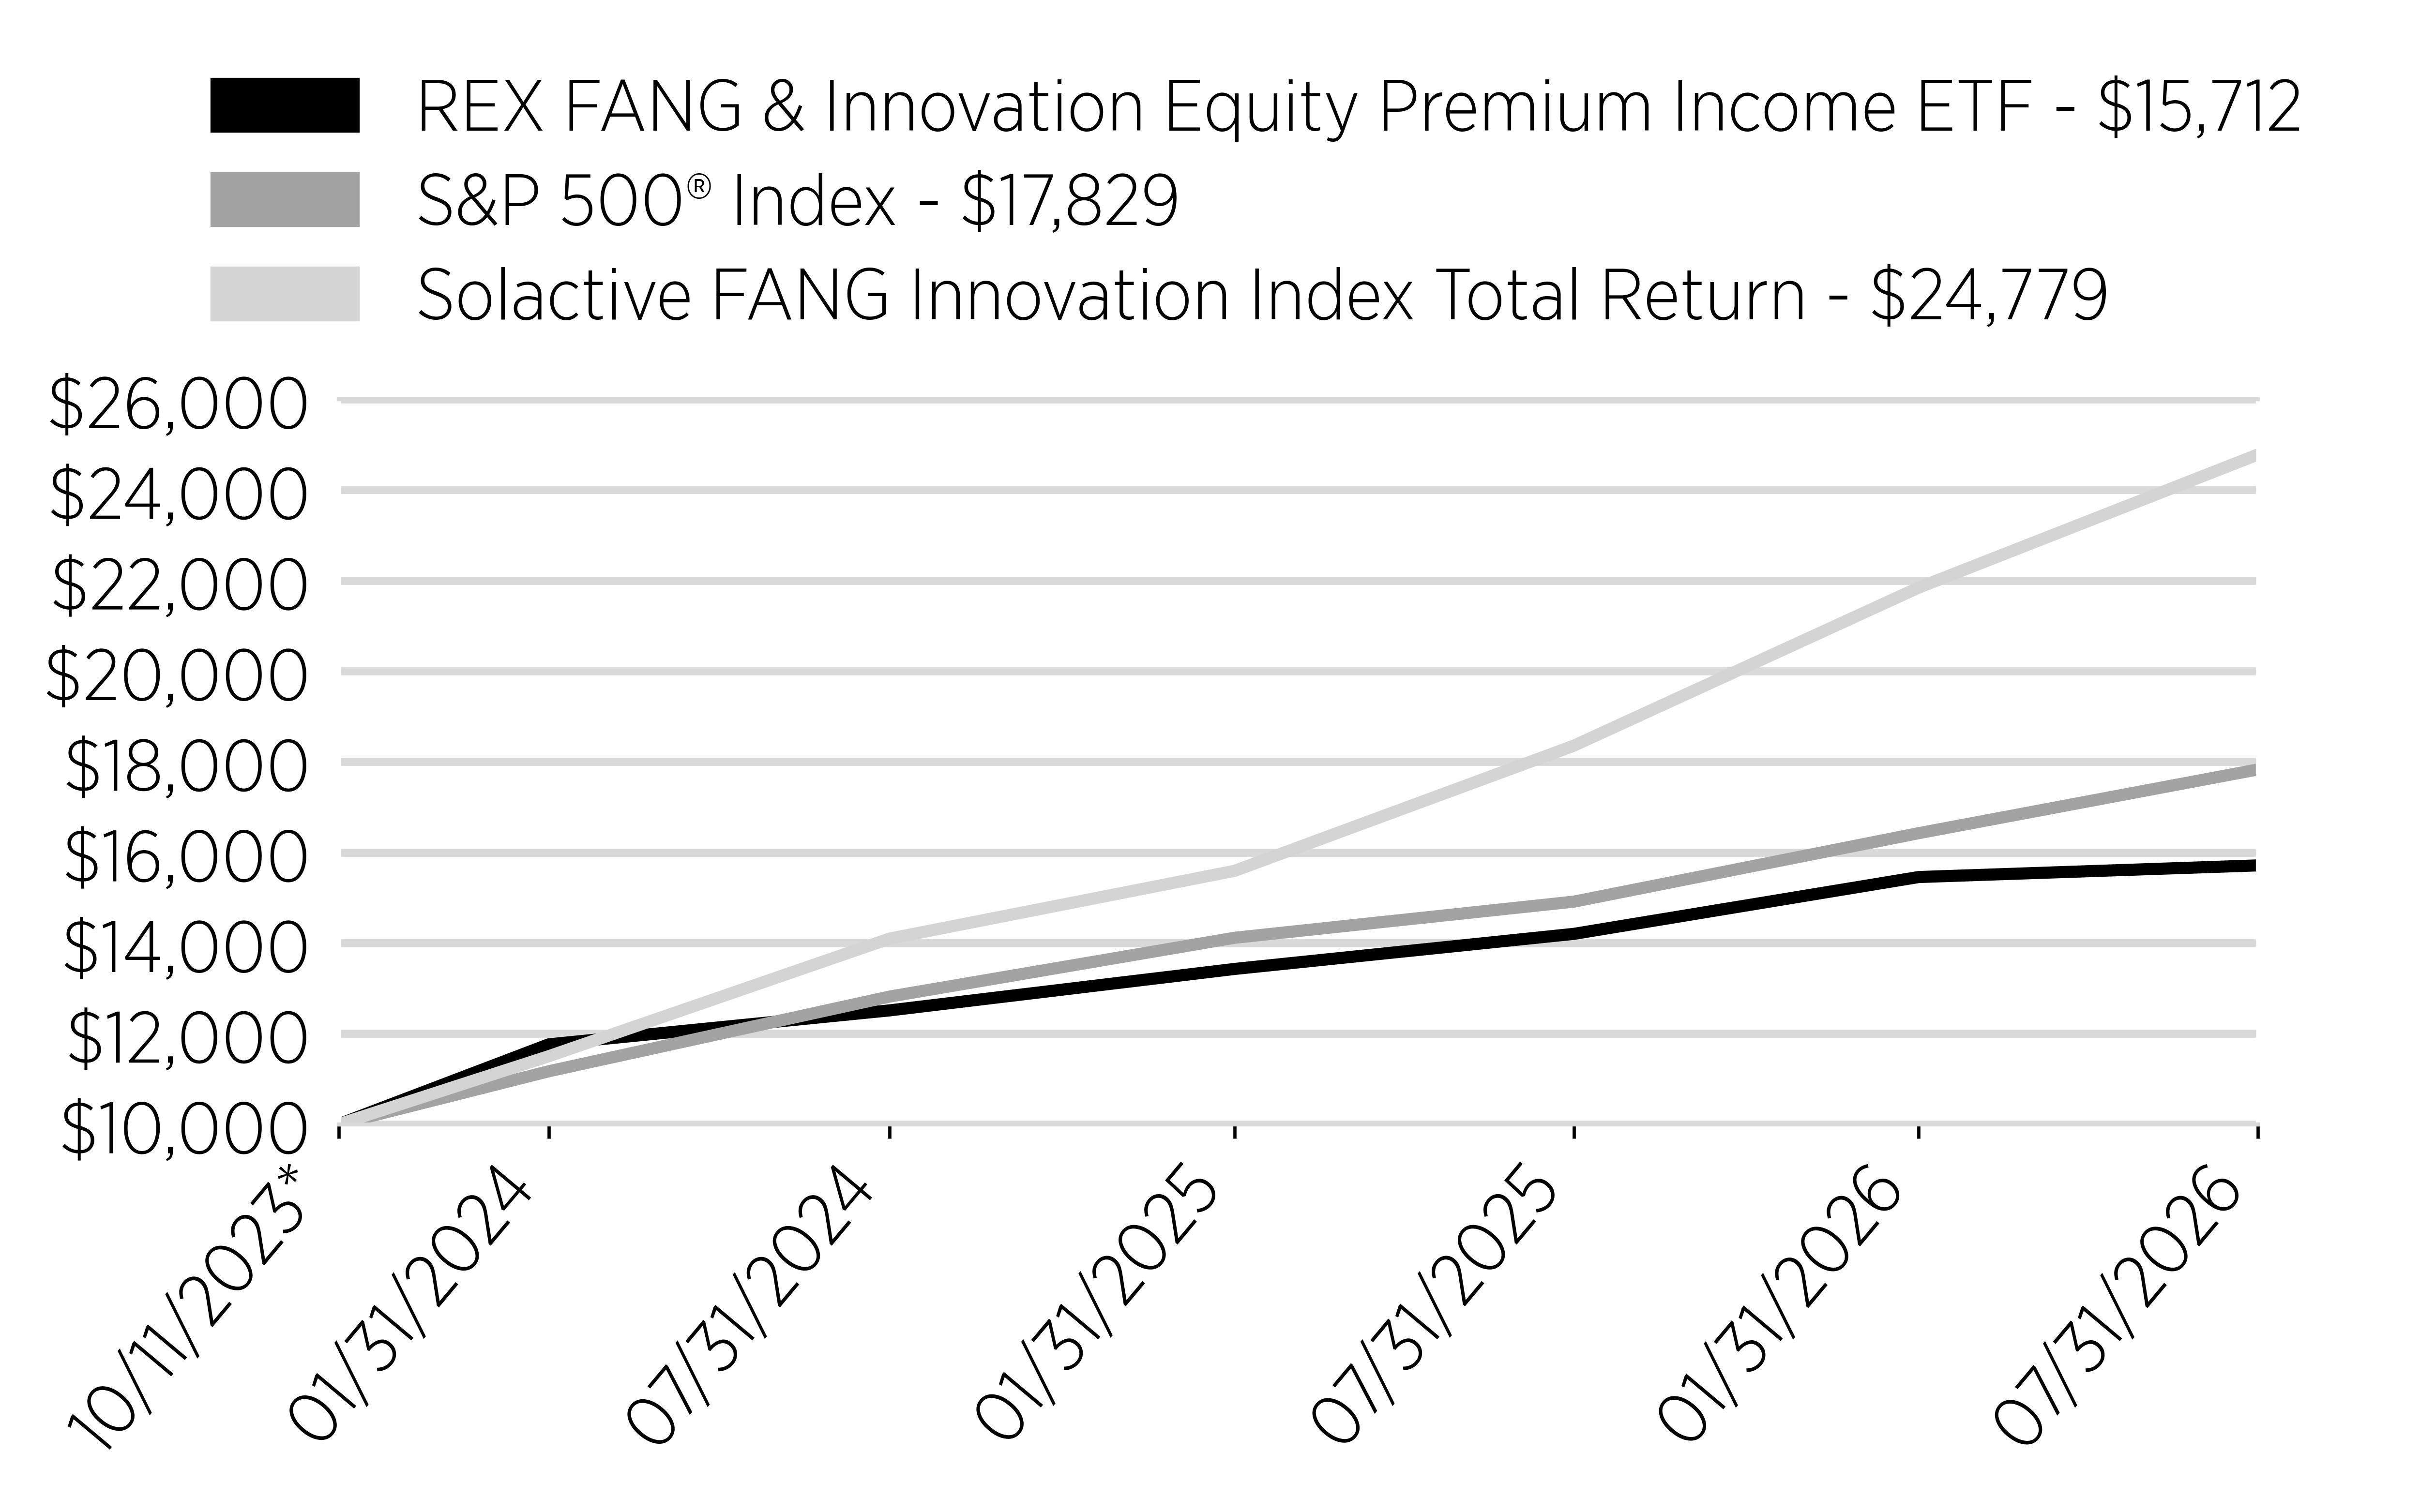
| * | Inception |
Annual Performance
|
|
1
Year |
Average
Annual Total Return Since Inception |
|---|---|---|
|
REX
FANG & Innovation Equity Premium Income ETF |
10.64% |
17.46% |
|
S&P
500® Index |
19.56% |
22.86% |
|
Solactive
FANG Innovation Index
Total
Return |
35.00% |
38.14% |
Key Fund Statistics
(as of July 31, 2026)
|
Fund
Net Assets |
$647,159,004 |
|
Number
of Holdings |
51 |
|
Total
Advisory Fee |
$3,894,510 |
|
Portfolio
Turnover Rate |
147.31% |
Sector Breakdown
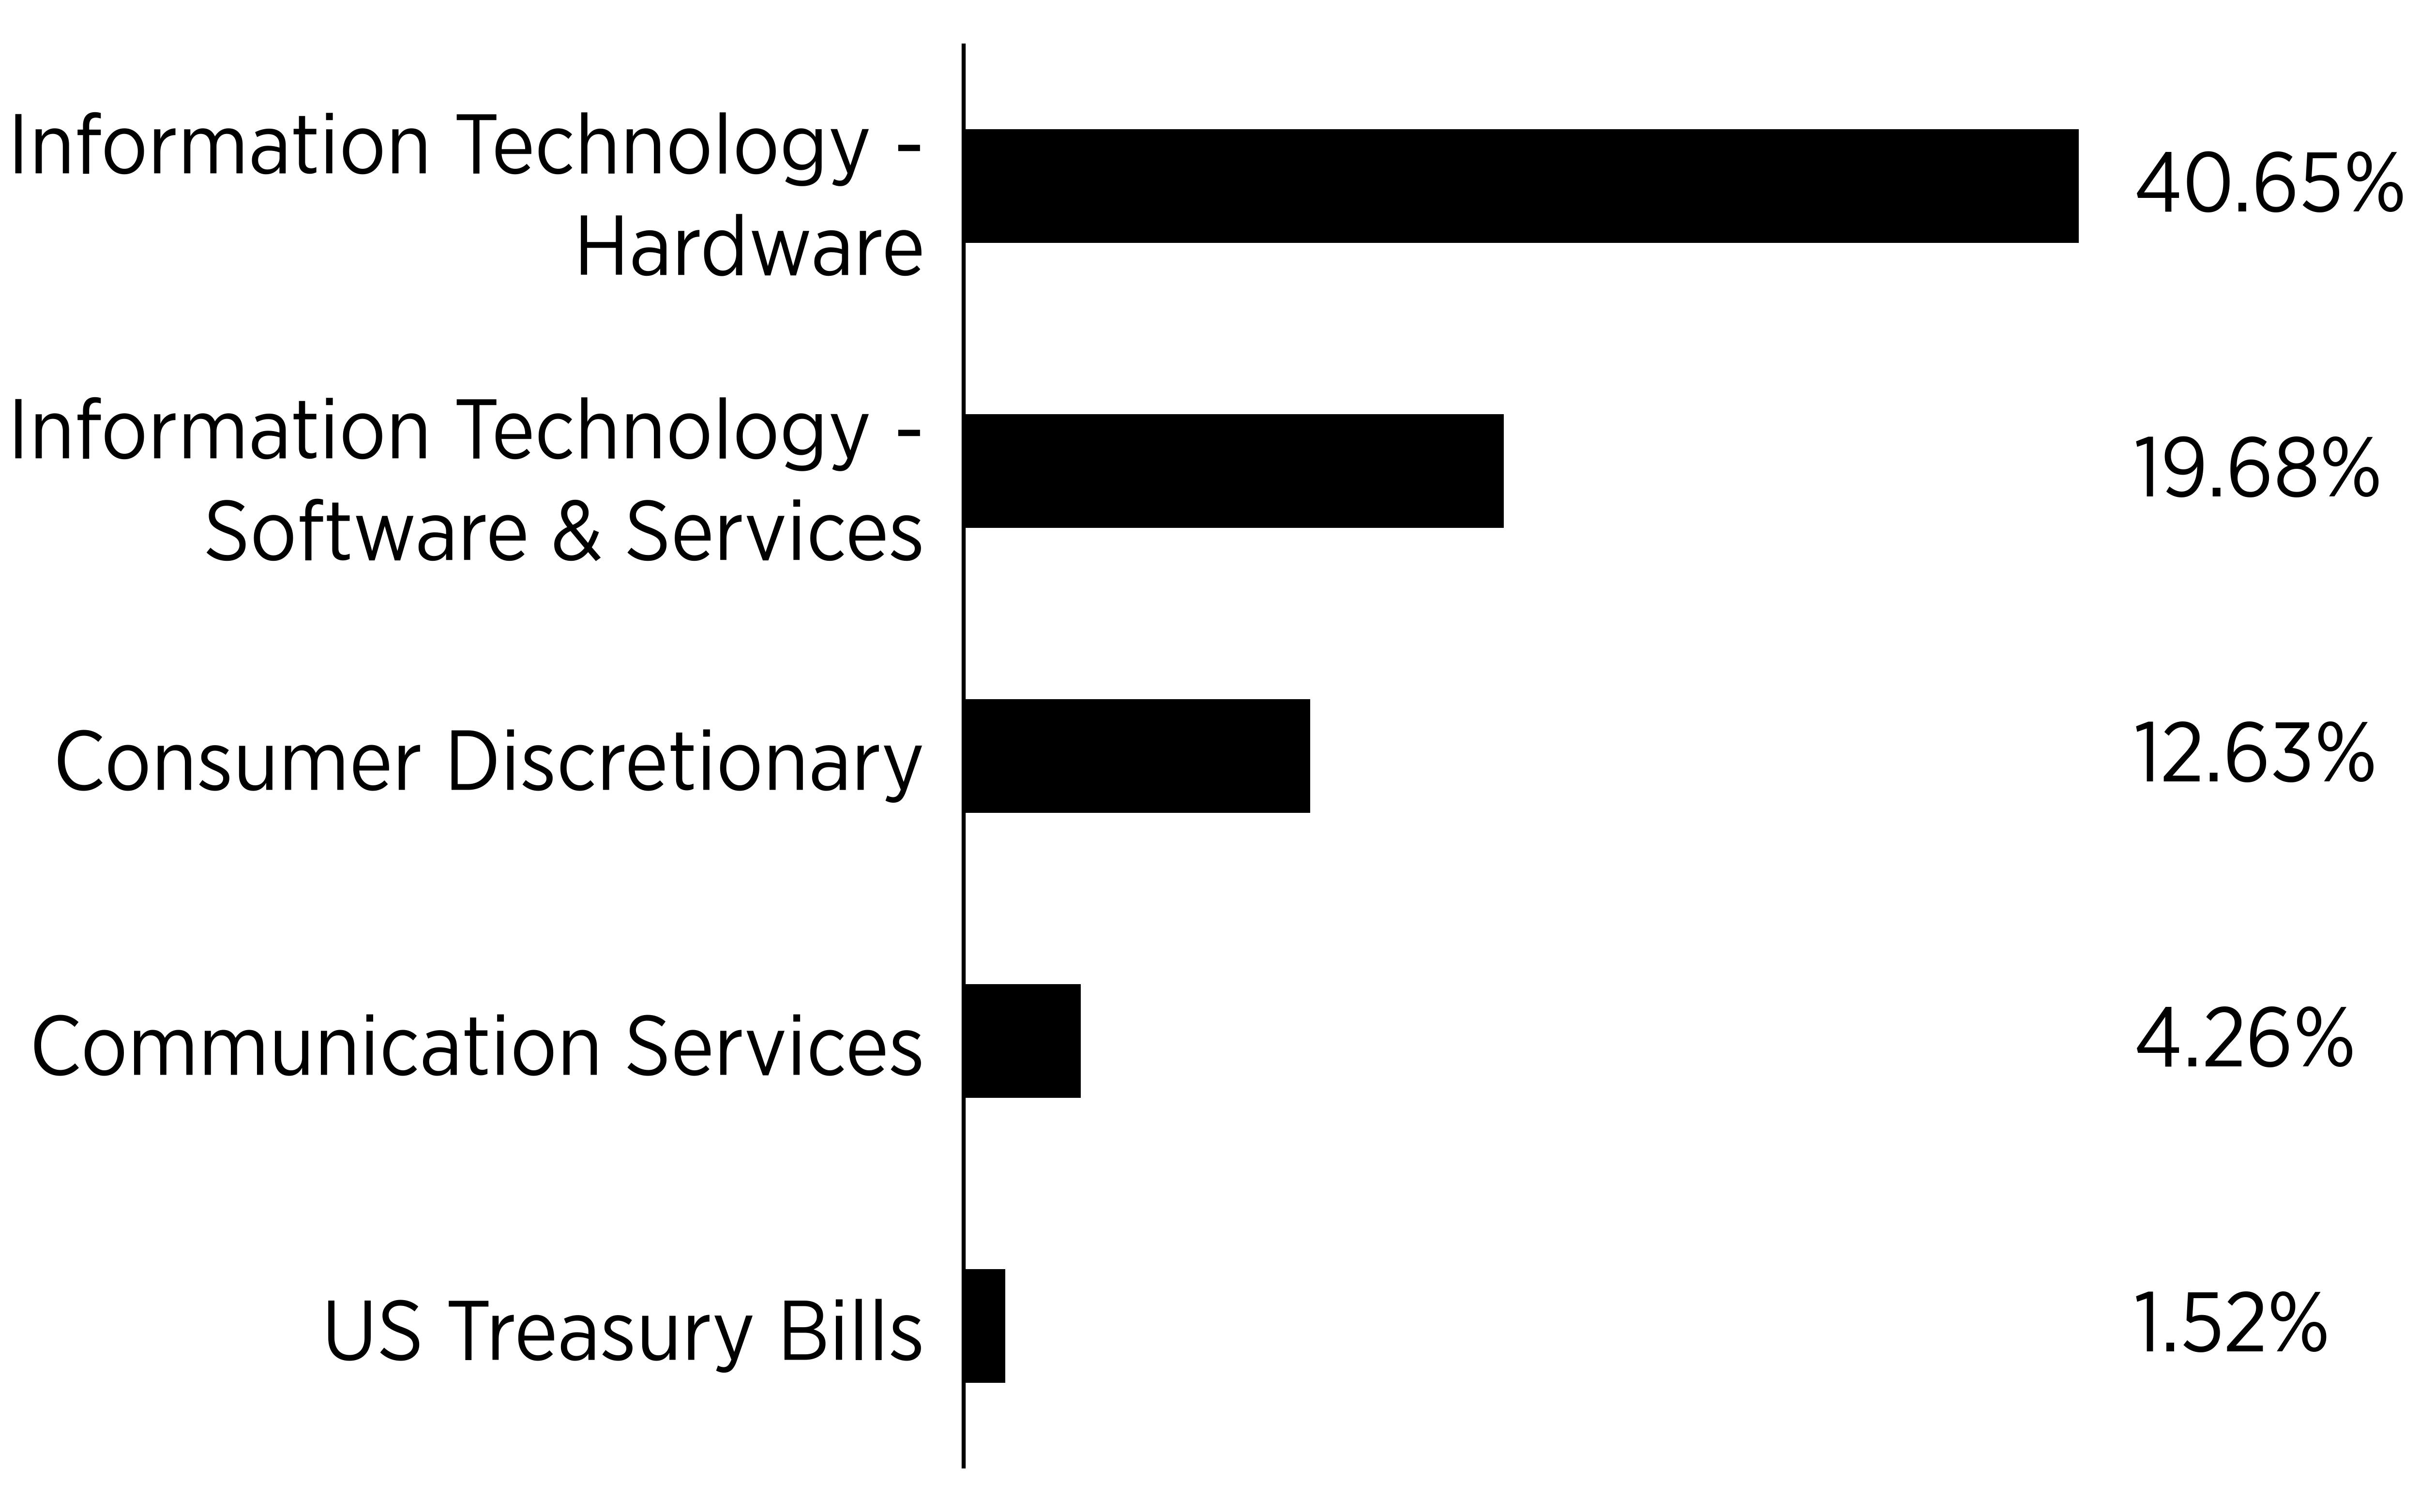
|
Top
10 Holdings |
|
|---|---|
|
Alphabet,
Inc. Class A |
|
|
Broadcom,
Inc. |
|
|
Apple,
Inc. |
|
|
Nvidia
Corp. |
|
|
Advanced
Micro Devices |
|
|
Micron
Technology, Inc. |
|
|
Meta
Platforms, Inc. |
|
|
Microsoft
Corp. |
|
|
Oracle
Corp. |
|
|
Palantir
Technologies Inc. |