What were the Fund costs for the past year?
(based on a hypothetical $10,000 investment)
|
Fund
Name |
Costs
of a $10,000 investment |
Costs
paid as a percentage of a $10,000 investment |
|---|---|---|
|
Cultivar
ETF |
$94 |
0.87% |
How did the Fund perform?
For the period of August 1, 2025, to July 31, 2026, the Cultivar ETF (“the Fund”) returned 16.46%, slightly underperforming its benchmark, the Russell 3000® Index, which returned 19.60% during the same period. The Fund provided a solid absolute return despite the modest lag to the benchmark and did so while maintaining a risk-informed posture. The Fund does not follow a capitalization-weighted indexed approach, as it focuses on active stock selection based on the portfolio managers’ assessment of individual stock valuations, as well as broad macro risks.
What key factors influenced performance?
The Fund’s active assessment of individual security valuations and concerns about macro risks, continued to cause underweights to technology and consumer discretionary areas. This assessment also led the Fund to maintain an overweight in traditionally less volatile areas, such as cash and U.S. Treasuries, healthcare, and consumer staples.
Positioning
The Fund maintained its overweight in the healthcare and consumer staples sectors, as these sectors continued to provide opportunities within the Fund’s desired valuation range. A narrow group of mega-cap technology stocks and semiconductor manufacturers appear overvalued. With the index being driven higher by such valuations, the Fund exercised a measure of risk control by continuing to maintain its underweight in the technology sector relative to the benchmark. However, the Fund was able to add to some key software technology firms at good valuations.
Performance
The Fund posted a solid double-digit absolute return for the year, while maintaining broad diversification with a focus toward risk control measures. The focus on diversification was beneficial during much of 2025 and into the first part of 2026. Positive impacts came from holdings in the materials sector, primarily through precious metals mining companies and lithium mining companies. Additionally, in the industrials area, there were a couple of key overweight positions that performed well. Lastly, the healthcare sector was additive to portfolio performance, with a broader group of holdings showing positive contribution. A critical theme among all these performers was the patience required to hold while awaiting such timely performance movements.
Top Contributors – Materials, Industrials, Healthcare
Top Detractors – Real Estate, Financials, Consumer Discretionary
Cumulative Performance
(based on a hypothetical $10,000 investment)
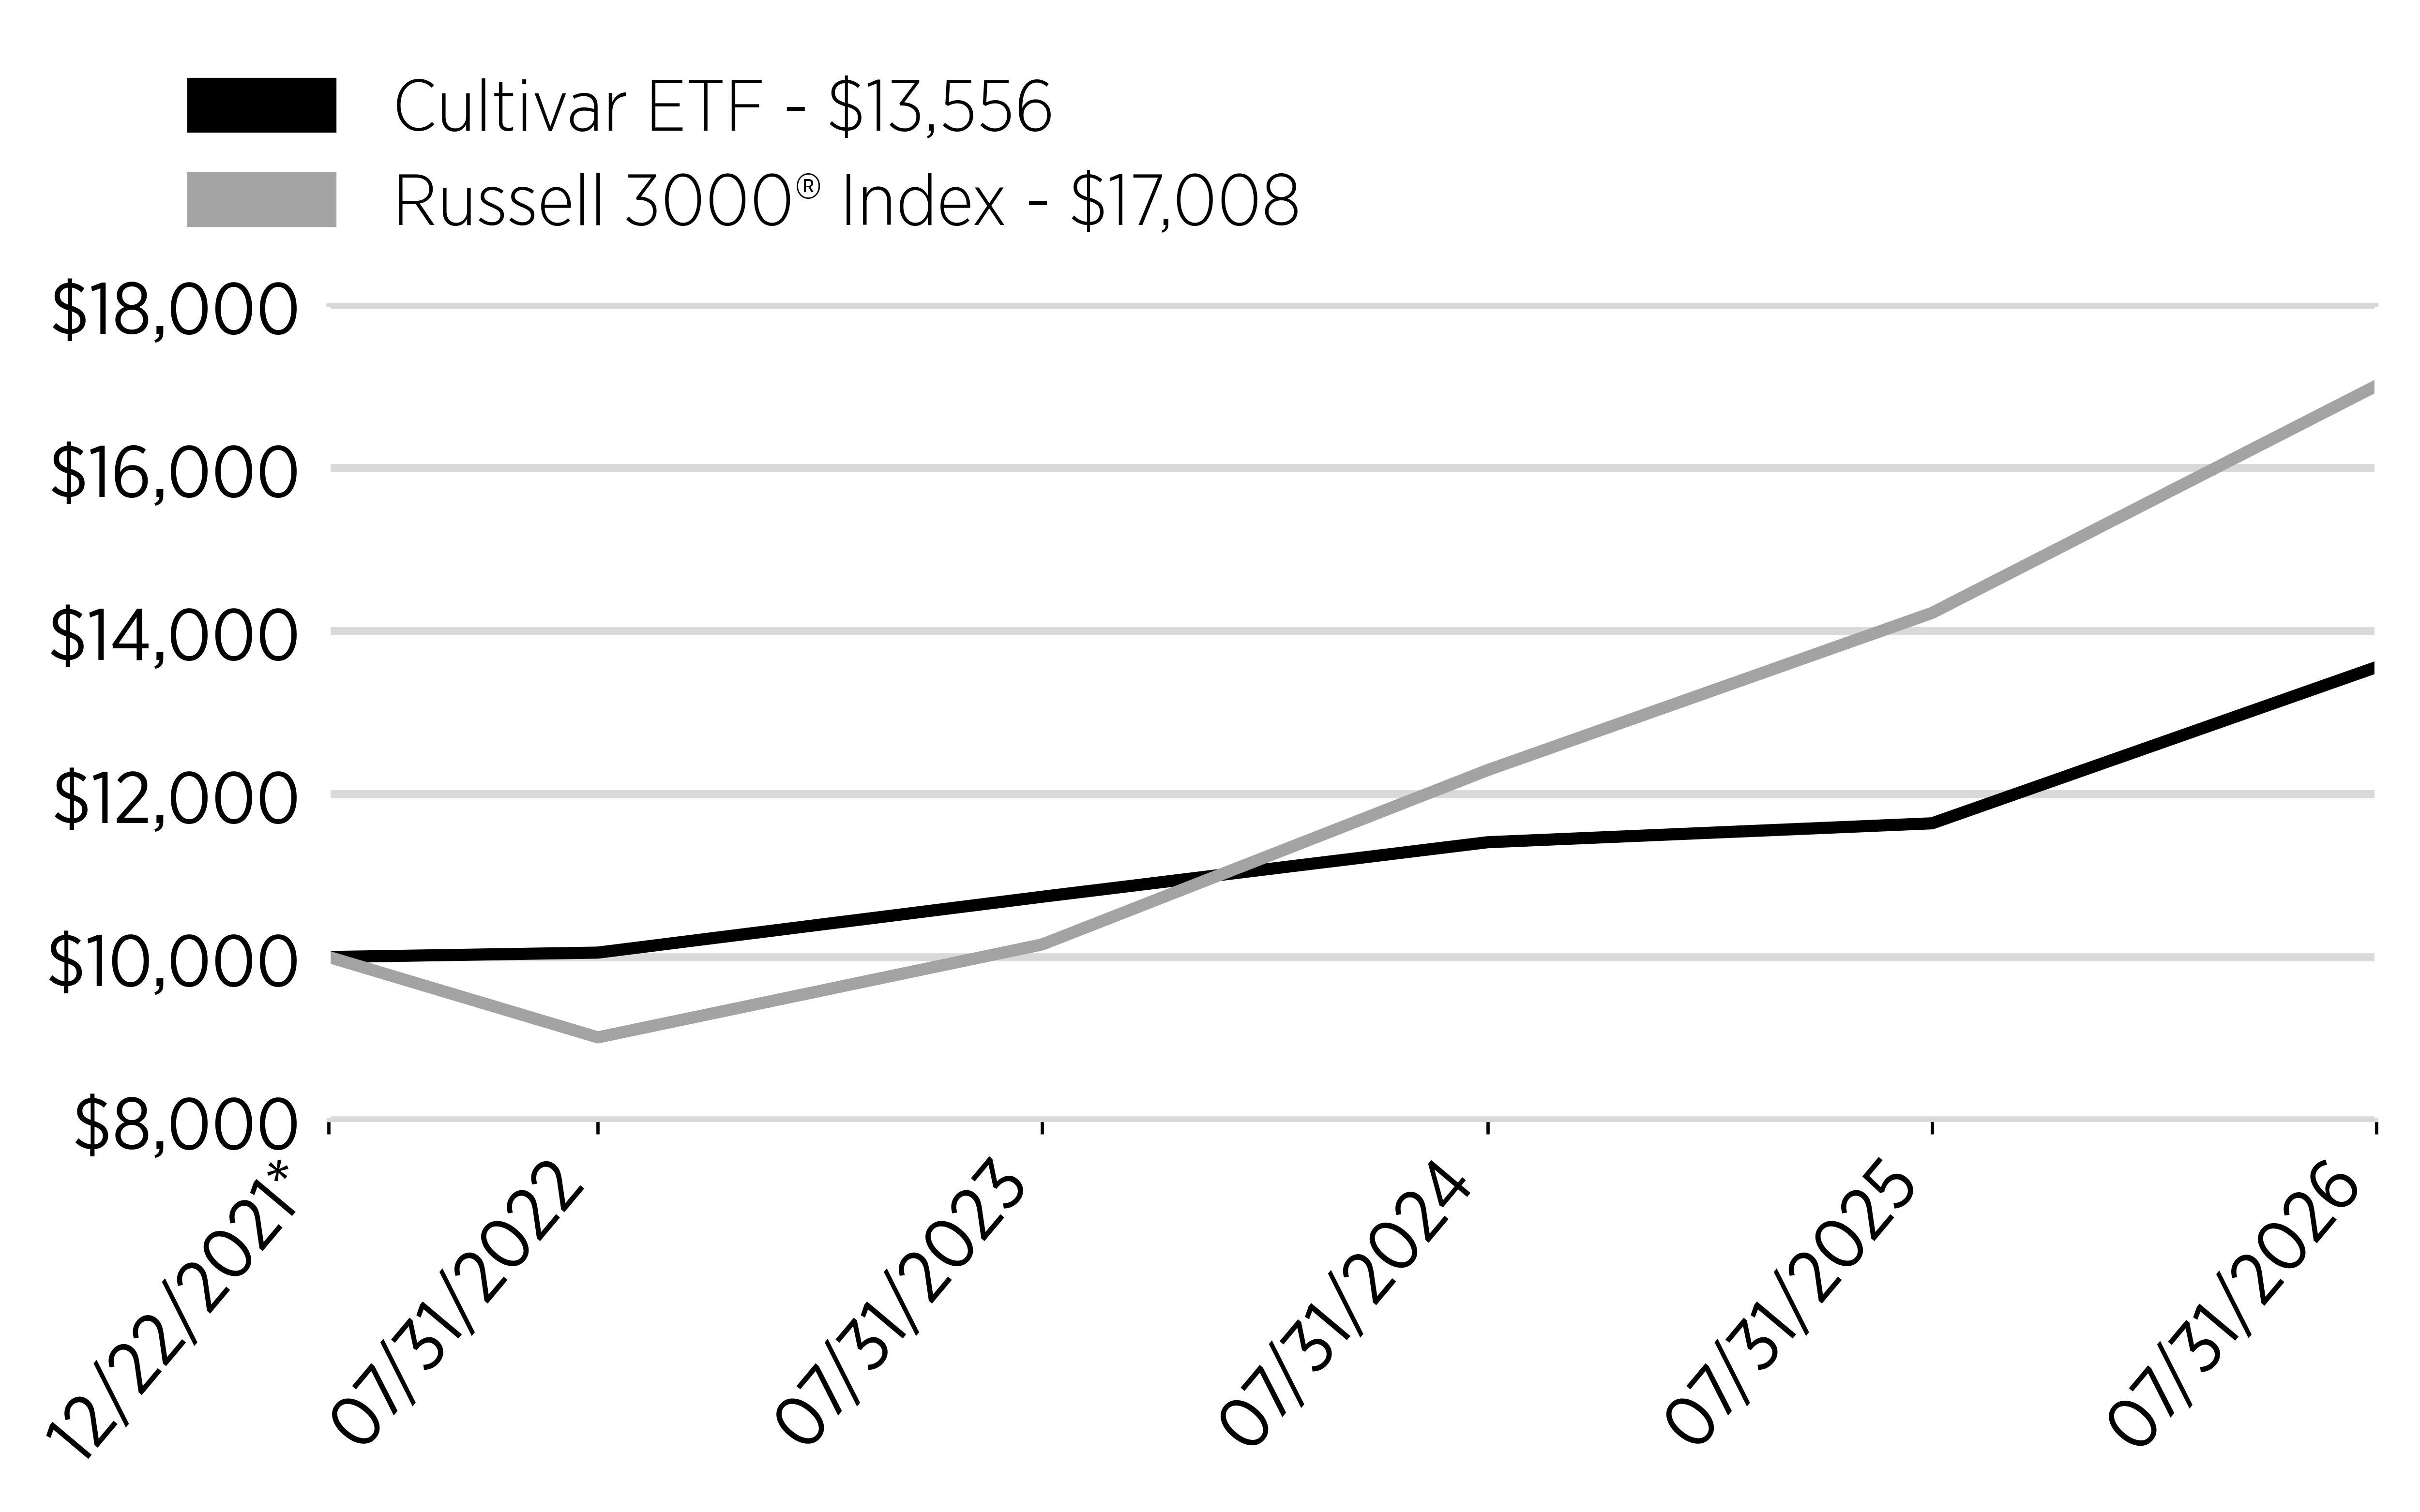
| * | Inception |
Annual Performance
|
|
1
Year |
Average
Annual Total Return
Since
Inception |
|---|---|---|
|
Cultivar
ETF |
16.46% |
6.82% |
|
Russell
3000® Index |
19.60% |
12.21% |
Key Fund Statistics
(as of July 31, 2026)
|
Fund
Net Assets |
$42,927,790 |
|
Number
of Holdings |
90 |
|
Total
Net Advisory Fee |
$327,868 |
|
Portfolio
Turnover Rate |
32.08% |
Sector Breakdown
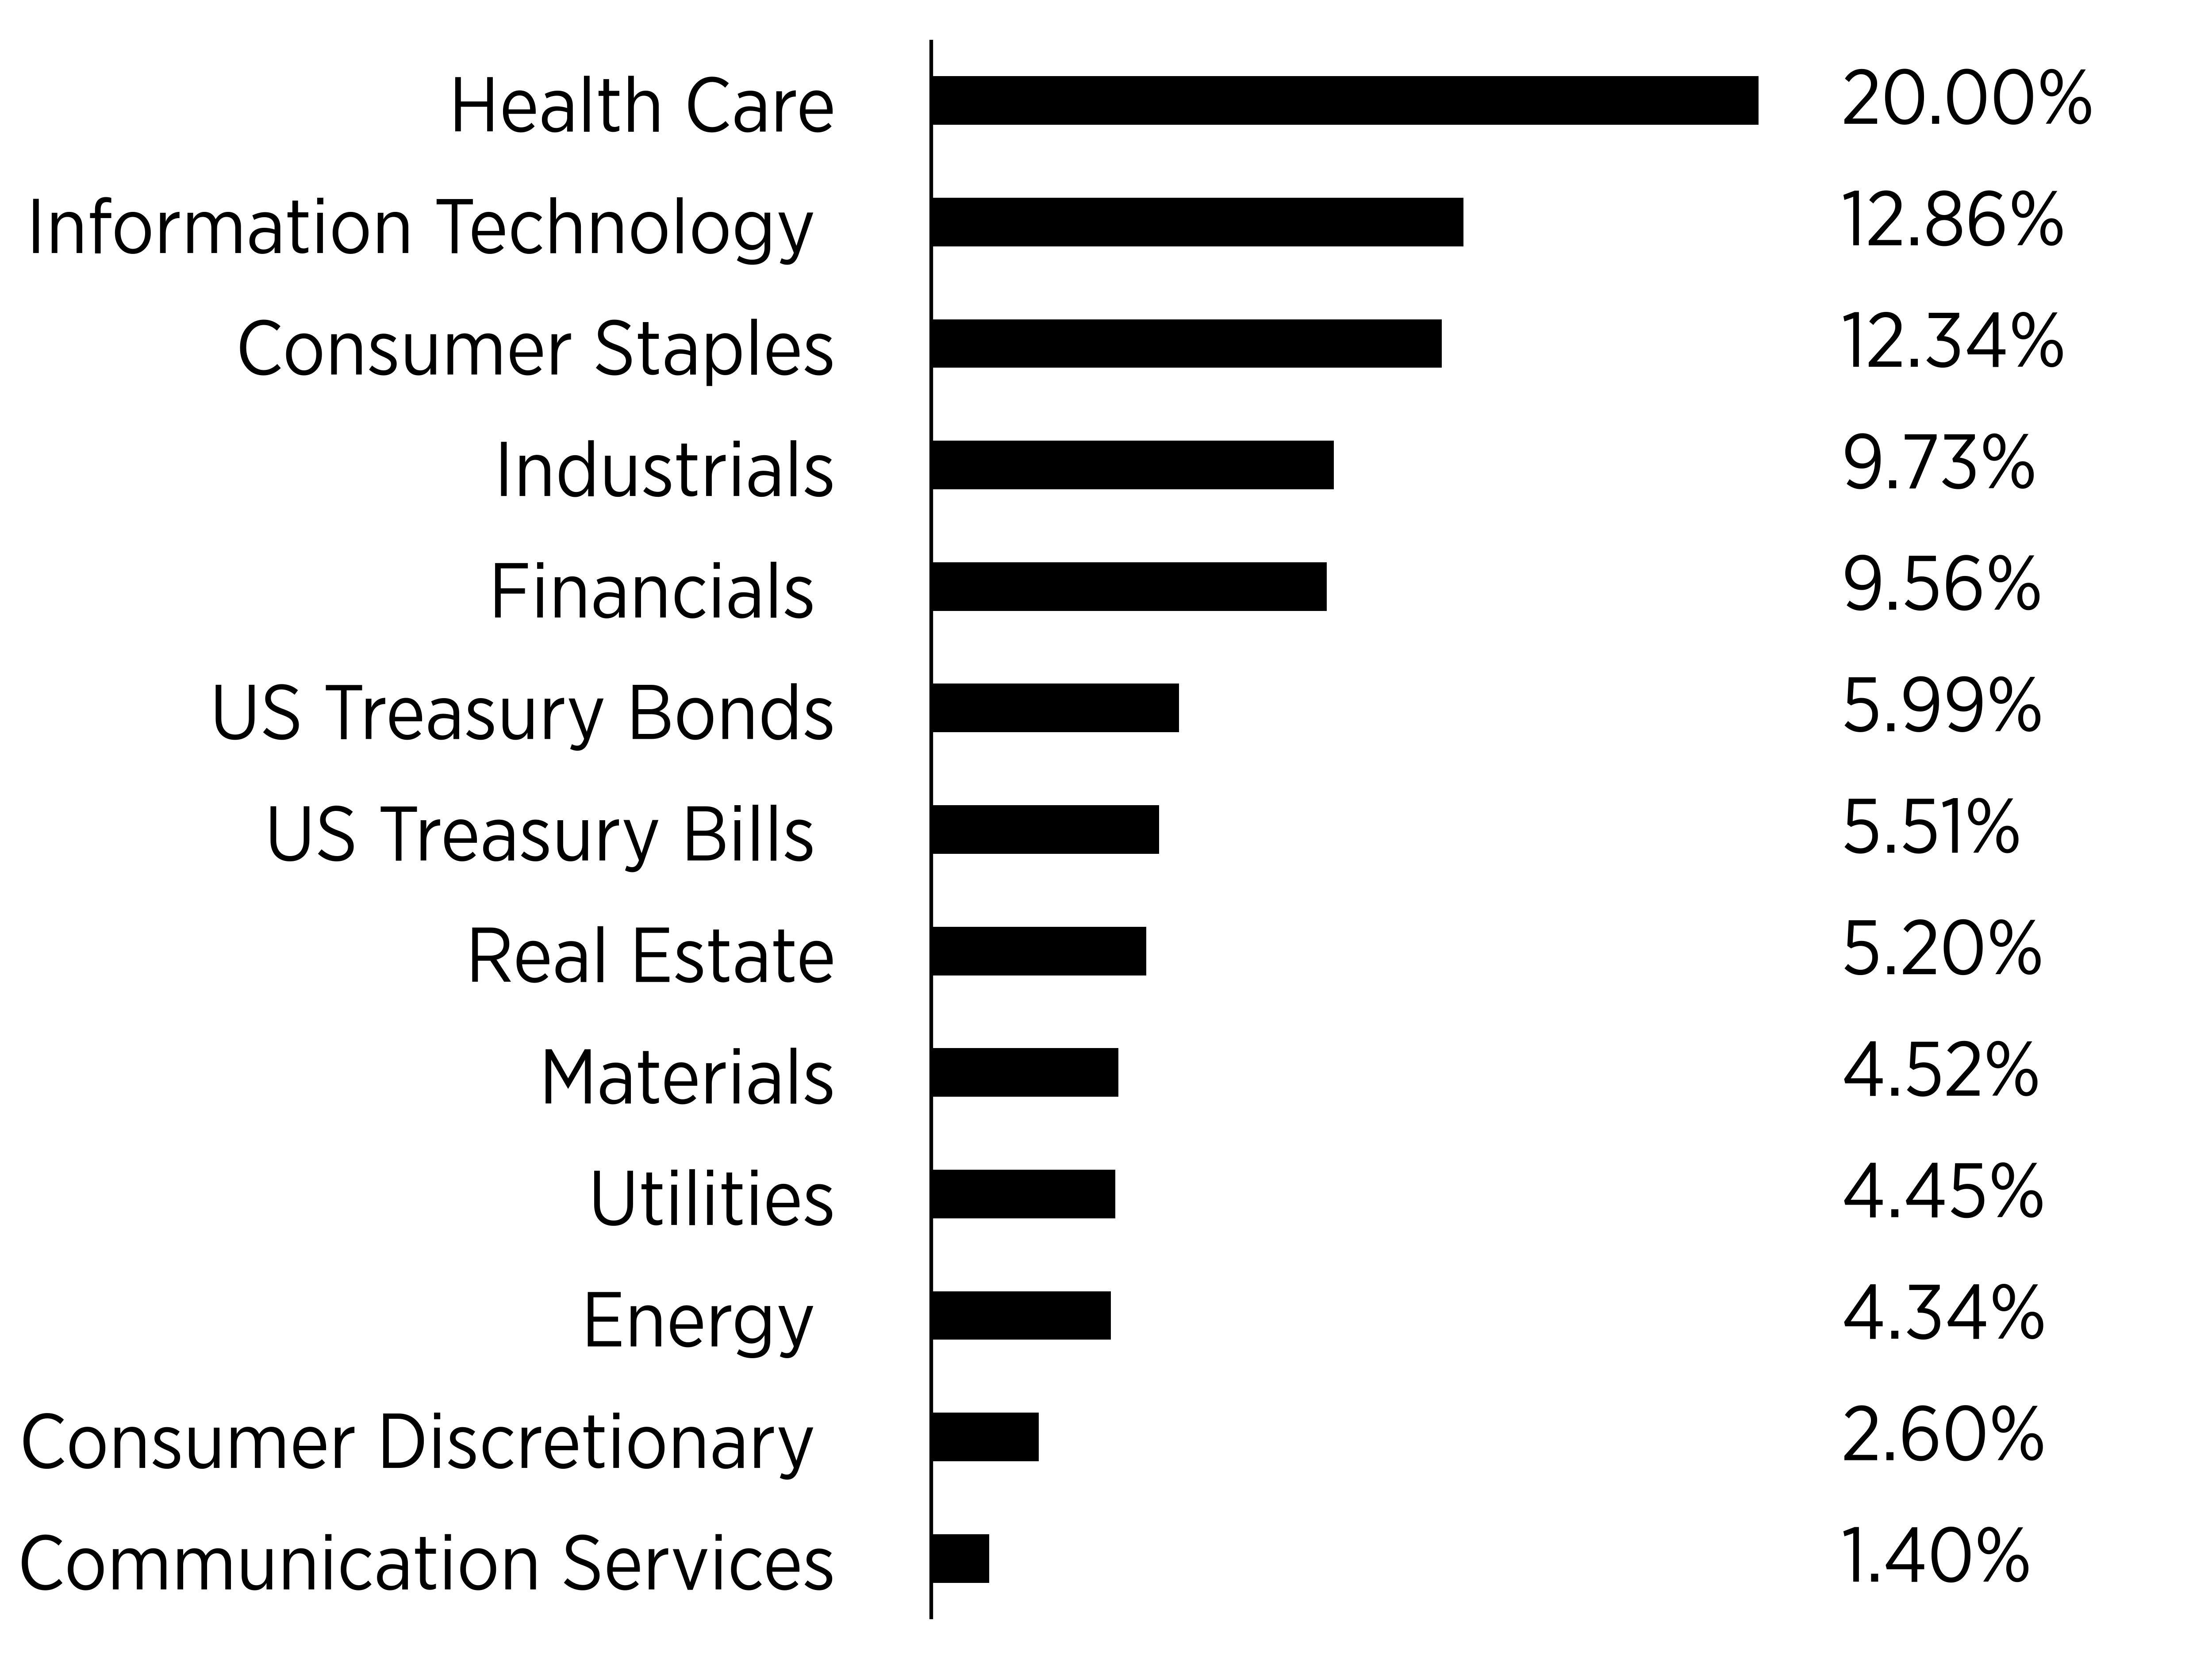
|
Top
10 Holdings |
|
|---|---|
|
US
Treasury Bill 8/4/2026 |
|
|
MarketAxess
Holdings, Inc. |
|
|
US
Treasury 5/15/2052 |
|
|
Healthcare
Services Group, Inc. |
|
|
US
Treasury 5/15/2054 |
|
|
Kimberly-Clark
Corp. |
|
|
Alexandria
Real Estate Equities, Inc. |
|
|
Core
Laboratories, Inc. |
|
|
Illumina,
Inc. |
|
|
Dollar
General Corp. |