Pay vs Performance Disclosure (Details)
R in Thousands
R in Thousands
Jun. 30, 2026
USD ($)
ZAR (R)
Jun. 30, 2025
USD ($)
ZAR (R)
Jun. 30, 2024
USD ($)
ZAR (R)
Jun. 30, 2023
USD ($)
ZAR (R)
Jun. 30, 2022
USD ($)
ZAR (R)
PAY VERSUS PERFORMANCE DISCLOSURES
As required by Section 953(a) of the Dodd-Frank Wall Street Reform and Consumer Protection Act, and Item 402(v) of Regulation S-K promulgated under the Exchange Act, we are providing
the following information about the relationship between executive compensation actually paid and certain financial performance of our company. Refer to the Compensation Discussion and
Analysis section for further information concerning our variable pay -for-performance philosophy and how it aligns executive compensation with our performance.
Year
Summary
compensation
table total for
first PEO
Summary
compensation
table total for
second PEO
Compensation
actually paid to
first PEO
Compensation
actually paid to
second PEO
Average
summary
compensation
table total for
non-PEO NEOs
Average
compensation
actually paid to
non-PEO NEOs
Value of initial fixed $100
investment based on:
Net income
(loss)
$ ‘000
Group Adjusted
EBITDA
ZAR ‘000
Total
shareholder
return
Peer Group
Total
shareholder
return
(1)(4)
(2)(4)
(1)(5)
(2)(5)
(3)(6)
(3)(7)
(8)
(9)
(10)
2026
$600,000
N/A
($220,000)
N/A
$997,274
$757,762
$106
$116
$2,758
ZAR 1,274,588
2025
$609,349
N/A
($1,018,451)
N/A
$1,270,452
$943,940
$95
$110
($90,957)
ZAR 906,573
2024
$5,709,225
$1,244,097
$6,371,525
$1,386,802
$1,298,856
$1,347,237
$99
$91
($18,515)
ZAR 675,332
2023
N/A
$1,432,860
N/A
$833,154
$1,283,723
$925,470
$81
$83
($35,935)
ZAR 432,078
2022
N/A
$3,978,441
N/A
$3,996,918
$873,407
$773,282
$109
$71
($44,697)
(ZAR 339,390)
(1)
First Principal Executive Officer (“PEO”) is our current Executive Chairman,
Mr. Mazanderani
.
(2)
Second PEO was
Chris Meyer
. Mr. Meyer’s employment terminated on February 29, 2024.
(3)
2026 and 2025 comprise four NEOs:
Messrs. Smith, Heilbron, Kola and Mali
;
2024 comprise three NEOs:
Messrs. Heilbron, Kola and Mali
; and
2023 and 2022 comprise four NEOs:
Messrs. Heilbron, Kola, Mali, and Alex M.R. Smith
(4)
Represents the amount of total compensation reported for each PEO for each corresponding fiscal year in the “Total” column of the Summary Compensation Table for each applicable
fiscal year.
(5)
Represents the amount of “compensation actually paid” to the first and second PEOs respectively, as computed in accordance with Item 402(v) of Regulation S-K. The dollar amounts
do not necessarily reflect the actual amount of compensation earned by or paid to the respective PEO during the applicable fiscal year. In accordance with the requirements of Item
402(v) of Regulation S-K, the following adjustments were made to the respective PEO’s total Summary Compensation Table compensation for each year to determine the
compensation actually paid
:
First PEO
Second PEO
Year
Summary
compensation
table total
Reported value of
equity awards
Equity award
adjustments
Compensation
actually paid
Summary
compensation
table total
Reported value of
equity awards
Equity award
adjustments
Compensation
actually paid
(a)
(b)
(a)
(b)
2026
$600,000
$0
($820,000)
($220,000)
N/A
N/A
N/A
N/A
2025
$609,349
$0
($1,627,800)
($1,018,451)
N/A
N/A
N/A
N/A
2024
$5,709,225
($5,480,000)
$6,142,300
$6,371,525
$1,244,097
($441,779)
$584,484
$1,386,802
2023
N/A
N/A
N/A
N/A
$1,432,860
($257,985)
($341,721)
$833,154
2022
N/A
N/A
N/A
N/A
$3,978,441
($2,548,441)
$2,566,918
$3,996,918
The grant date fair value of equity awards represents the total of the amounts reported in the “Stock Awards” and “Option Awards” columns in the Summary Compensation Table
for the applicable fiscal year.
(b)
The equity award adjustments for each applicable fiscal year include the addition (or subtraction, as applicable) of the following: (i) the year -end fair value of any equity awards
granted in the applicable fiscal year that are outstanding and unvested as of the end of the fiscal year; (ii) the amount of change as of the end of the applicable fiscal year (from the
end of the prior fiscal year) in fair value of any awards granted in prior fiscal years that are outstanding and unvested as of the end of the applicable fiscal year; (iii) for awards that
are granted and vest in same applicable fiscal year, the fair value as of the vesting date; (iv) for awards granted in prior years that vest in the applicable fiscal year, the amount equal
to the change as of the vesting date (from the end of the prior fiscal year) in fair value; and (v) for awards granted in prior fiscal years that are determined to fail to meet the applicable
vesting conditions during the applicable fiscal year, a deduction for the amount equal to the fair value at the end of the prior fiscal year; and (vi) the dollar value of any dividends or
other earnings paid on stock or option awards in the applicable fiscal year prior to the vesting date that are not otherwise reflected in the fair value of such award or included in any
other component of total compensation for the applicable fiscal year (there were no adjustments related to item (vi)). The valuation assumptions used to calculate fair values did not
materially differ from those disclosed at the time of grant. The amounts deducted or added in calculating the equity award adjustments are as follows (only applicable years presented
for each respective PEO).
Year
(i)
Year End Fair Value of
Unvested Covered Year
Equity Awards
(ii)
Year over Year Change
in Fair Value of
Outstanding and
Unvested Prior Year
Equity Awards
(iii)
Fair Value as of Vesting
Date of Equity Awards
Granted and Vested in
the Year
(iv)
Year over Year Change
in Fair Value of Equity
Awards Granted in Prior
Years that Vested in the
Year
(v)
Awards Granted in Prior
Fiscal Years that are
Determined to Fail to
Meet the Applicable
Vesting Conditions
During the Applicable
Fiscal Year
Equity award
adjustments
First PEO
2026
$0
$0
$0
($820,000)
$0
($820,000)
2025
$0
($1,803,000)
$0
$175,200
$0
($1,627,800)
2024
$6,142,300
$0
$0
$0
$0
$6,142,300
Second PEO
2024
$469,121
$183,382
$0
$155,445
($223,464)
$584,484
2023
$203,927
($550,377)
$0
$4,729
$0
($341,721)
2022
$2,267,323
$0
$299,595
$0
$0
$2,566,918
(6)
(7)
Represents the average amount of “compensation actually paid” to the non -PEO NEOs as a group, as computed in accordance with Item 402(v) of Regulation S-K. The dollar amounts
do not necessarily reflect the actual average amount of compensation earned by or paid to the non-PEO NEOs as a group during the applicable fiscal year. In accordance with the
requirements of Item 402(v) of Regulation S-K, the following adjustments were made to average total Summary Compensation Table compensation for the non-PEO NEOs as a group
for each year to determine the compensation actually paid
:
Year
Average Reported Summary
Compensation Table Total for
Non-PEO NEOs
Average Reported Value
of Equity Awards
Average Equity Award
Adjustments
Average Compensation
Actually Paid to Non-PEO
NEOs
(a)
(b)
2026
$997,274
($174,375)
($65,137)
$757,762
2025
$1,270,452
($701,550)
$375,038
$943,940
2024
$1,298,856
($498,661)
$547,042
$1,347,237
2023
$1,283,723
($681,395)
$323,142
$925,470
2022
$873,407
($417,458)
$317,333
$773,282
The grant date fair value of equity awards represents the total of the amounts reported in the “Stock Awards” and “Option Awards” columns in the Summary Compensation
Table for the applicable fiscal year.
(b)
The equity award adjustments for each applicable fiscal year include the addition (or subtraction, as applicable) are as discussed above in footnote (5)(b), and there were no
adjustments related to item (vi) in footnote (5)(b). The amounts deducted or added in calculating the equity award adjustments for our non-PEO NEOs are as follows:
Year
(i)
Average Year End Fair
Value of Unvested Covered
Year Equity Awards
(ii)
Year over Year Average
Change in Fair Value of
Outstanding and Unvested
Prior Year Equity Awards
(iii)
Average Fair Value as of
Vesting Date of Equity
Awards Granted and
Vested in the Year
(iv)
Year over Year Average
Change in Fair Value of
Equity Awards Granted in
Prior Years that Vested in
the Year
(v)
Average Awards Granted
in Prior Fiscal Years that
are Determined to Fail to
Meet the Applicable
Vesting Conditions During
the Applicable Fiscal Year
Average equity
award
adjustments
2026
$186,375
($88,933)
$0
$1,334
($163,913)
($65,137)
2025
$394,525
($12,225)
$0
($7,262)
$0
$375,038
2024
$532,489
$60,656
$0
$69,660
($115,763)
$547,042
2023
$280,876
($159,394)
$341,250
($36,790)
($102,800)
$323,142
2022
$267,099
$16,754
$23,036
$14,944
($4,500)
$317,333
(8)
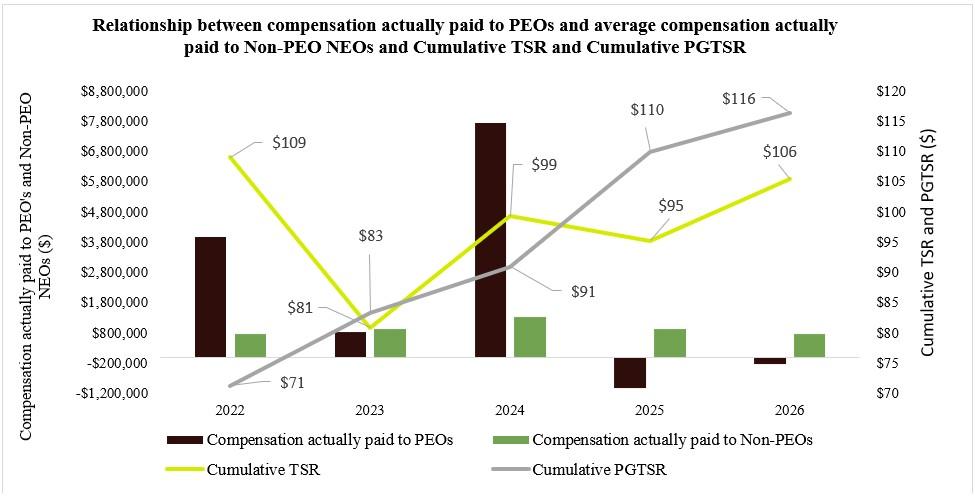
Cumulative total shareholder return (“TSR”) is calculated by dividing the sum of the cumulative amount of dividends for the measurement period, assuming dividend reinvestment,
and the difference between our share price at the end and the beginning of the measurement period by the Company’s share price at the beginning of the measurement period.
(9)
Peer Group Total Shareholder Return (“PGTSR”) represents the cumulative TSR of the industry index selected, namely the Nasdaq Industrial Index . PGTSR is calculated based
on a fixed investment of $100 at the beginning of the measurement period and assumes the reinvestment of dividends. The index is weighted based on the market capitalization
of its constituent companies in accordance with the index provider ’s methodology .
(10)
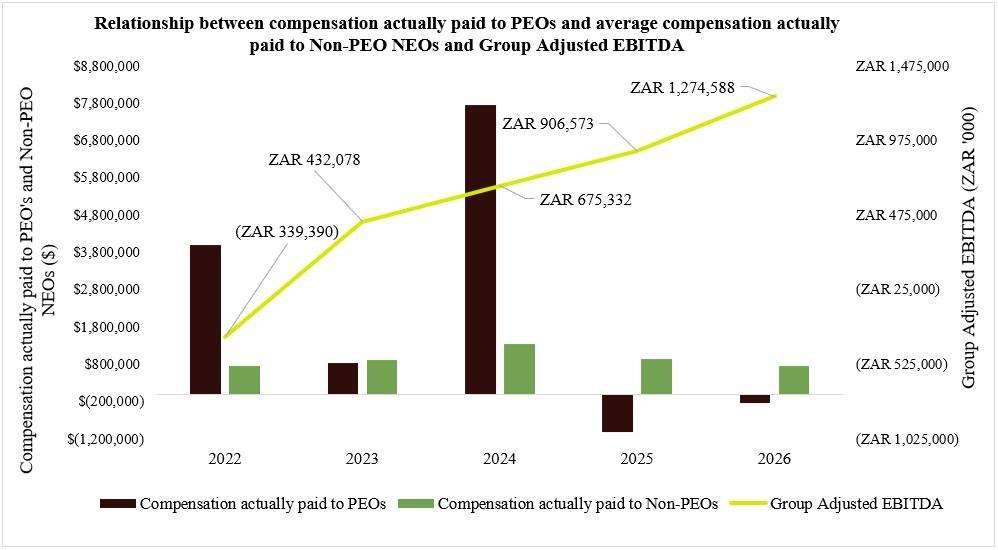
Group Adjusted EBITDA is the most significant performance measure used to link our company’s performance to compensation paid to our PEO and non-PEO NEOs. Group
Adjusted EBITDA is a non -GAAP measure and is calculated as earnings (net income attributable to Lesaka) before interest, tax, depreciation and amortization (“EBITDA”),
adjusted for non-operational transactions (including loss on disposal of equity-accounted investments, gain related to fair value adjustments to currency options), (earnings) loss
from equity-accounted investments, stock-based compensation charges and once-off items. Once -off items represents non-recurring expense items, including costs related to
acquisitions and transactions consummated or ultimately not pursued
.
2026 and 2025 comprise four NEOs:
Messrs. Smith, Heilbron, Kola and Mali
;
2024 comprise three NEOs:
Messrs. Heilbron, Kola and Mali
; and
2023 and 2022 comprise four NEOs:
Messrs. Heilbron, Kola, Mali, and Alex M.R. Smith
Represents the amount of “compensation actually paid” to the first and second PEOs respectively, as computed in accordance with Item 402(v) of Regulation S-K. The dollar amounts
do not necessarily reflect the actual amount of compensation earned by or paid to the respective PEO during the applicable fiscal year. In accordance with the requirements of Item
402(v) of Regulation S-K, the following adjustments were made to the respective PEO’s total Summary Compensation Table compensation for each year to determine the
compensation actually paid
First PEO
Second PEO
Year
Summary
compensation
table total
Reported value of
equity awards
Equity award
adjustments
Compensation
actually paid
Summary
compensation
table total
Reported value of
equity awards
Equity award
adjustments
Compensation
actually paid
(a)
(b)
(a)
(b)
2026
$600,000
$0
($820,000)
($220,000)
N/A
N/A
N/A
N/A
2025
$609,349
$0
($1,627,800)
($1,018,451)
N/A
N/A
N/A
N/A
2024
$5,709,225
($5,480,000)
$6,142,300
$6,371,525
$1,244,097
($441,779)
$584,484
$1,386,802
2023
N/A
N/A
N/A
N/A
$1,432,860
($257,985)
($341,721)
$833,154
2022
N/A
N/A
N/A
N/A
$3,978,441
($2,548,441)
$2,566,918
$3,996,918
The grant date fair value of equity awards represents the total of the amounts reported in the “Stock Awards” and “Option Awards” columns in the Summary Compensation Table
for the applicable fiscal year.
(b)
The equity award adjustments for each applicable fiscal year include the addition (or subtraction, as applicable) of the following: (i) the year -end fair value of any equity awards
granted in the applicable fiscal year that are outstanding and unvested as of the end of the fiscal year; (ii) the amount of change as of the end of the applicable fiscal year (from the
end of the prior fiscal year) in fair value of any awards granted in prior fiscal years that are outstanding and unvested as of the end of the applicable fiscal year; (iii) for awards that
are granted and vest in same applicable fiscal year, the fair value as of the vesting date; (iv) for awards granted in prior years that vest in the applicable fiscal year, the amount equal
to the change as of the vesting date (from the end of the prior fiscal year) in fair value; and (v) for awards granted in prior fiscal years that are determined to fail to meet the applicable
vesting conditions during the applicable fiscal year, a deduction for the amount equal to the fair value at the end of the prior fiscal year; and (vi) the dollar value of any dividends or
other earnings paid on stock or option awards in the applicable fiscal year prior to the vesting date that are not otherwise reflected in the fair value of such award or included in any
other component of total compensation for the applicable fiscal year (there were no adjustments related to item (vi)). The valuation assumptions used to calculate fair values did not
materially differ from those disclosed at the time of grant. The amounts deducted or added in calculating the equity award adjustments are as follows (only applicable years presented
for each respective PEO).
Year
(i)
Year End Fair Value of
Unvested Covered Year
Equity Awards
(ii)
Year over Year Change
in Fair Value of
Outstanding and
Unvested Prior Year
Equity Awards
(iii)
Fair Value as of Vesting
Date of Equity Awards
Granted and Vested in
the Year
(iv)
Year over Year Change
in Fair Value of Equity
Awards Granted in Prior
Years that Vested in the
Year
(v)
Awards Granted in Prior
Fiscal Years that are
Determined to Fail to
Meet the Applicable
Vesting Conditions
During the Applicable
Fiscal Year
Equity award
adjustments
First PEO
2026
$0
$0
$0
($820,000)
$0
($820,000)
2025
$0
($1,803,000)
$0
$175,200
$0
($1,627,800)
2024
$6,142,300
$0
$0
$0
$0
$6,142,300
Second PEO
2024
$469,121
$183,382
$0
$155,445
($223,464)
$584,484
2023
$203,927
($550,377)
$0
$4,729
$0
($341,721)
2022
$2,267,323
$0
$299,595
$0
$0
$2,566,918
Represents the average amount of “compensation actually paid” to the non -PEO NEOs as a group, as computed in accordance with Item 402(v) of Regulation S-K. The dollar amounts
do not necessarily reflect the actual average amount of compensation earned by or paid to the non-PEO NEOs as a group during the applicable fiscal year. In accordance with the
requirements of Item 402(v) of Regulation S-K, the following adjustments were made to average total Summary Compensation Table compensation for the non-PEO NEOs as a group
for each year to determine the compensation actually paid
Year
Average Reported Summary
Compensation Table Total for
Non-PEO NEOs
Average Reported Value
of Equity Awards
Average Equity Award
Adjustments
Average Compensation
Actually Paid to Non-PEO
NEOs
(a)
(b)
2026
$997,274
($174,375)
($65,137)
$757,762
2025
$1,270,452
($701,550)
$375,038
$943,940
2024
$1,298,856
($498,661)
$547,042
$1,347,237
2023
$1,283,723
($681,395)
$323,142
$925,470
2022
$873,407
($417,458)
$317,333
$773,282
The grant date fair value of equity awards represents the total of the amounts reported in the “Stock Awards” and “Option Awards” columns in the Summary Compensation
Table for the applicable fiscal year.
(b)
The equity award adjustments for each applicable fiscal year include the addition (or subtraction, as applicable) are as discussed above in footnote (5)(b), and there were no
adjustments related to item (vi) in footnote (5)(b). The amounts deducted or added in calculating the equity award adjustments for our non-PEO NEOs are as follows:
Year
(i)
Average Year End Fair
Value of Unvested Covered
Year Equity Awards
(ii)
Year over Year Average
Change in Fair Value of
Outstanding and Unvested
Prior Year Equity Awards
(iii)
Average Fair Value as of
Vesting Date of Equity
Awards Granted and
Vested in the Year
(iv)
Year over Year Average
Change in Fair Value of
Equity Awards Granted in
Prior Years that Vested in
the Year
(v)
Average Awards Granted
in Prior Fiscal Years that
are Determined to Fail to
Meet the Applicable
Vesting Conditions During
the Applicable Fiscal Year
Average equity
award
adjustments
2026
$186,375
($88,933)
$0
$1,334
($163,913)
($65,137)
2025
$394,525
($12,225)
$0
($7,262)
$0
$375,038
2024
$532,489
$60,656
$0
$69,660
($115,763)
$547,042
2023
$280,876
($159,394)
$341,250
($36,790)
($102,800)
$323,142
2022
$267,099
$16,754
$23,036
$14,944
($4,500)
$317,333
(8)
Cumulative total shareholder return (“TSR”) is calculated by dividing the sum of the cumulative amount of dividends for the measurement period, assuming dividend reinvestment,
and the difference between our share price at the end and the beginning of the measurement period by the Company’s share price at the beginning of the measurement period.
(9)
Peer Group Total Shareholder Return (“PGTSR”) represents the cumulative TSR of the industry index selected, namely the Nasdaq Industrial Index . PGTSR is calculated based
on a fixed investment of $100 at the beginning of the measurement period and assumes the reinvestment of dividends. The index is weighted based on the market capitalization
of its constituent companies in accordance with the index provider ’s methodology .
(10)
Group Adjusted EBITDA is the most significant performance measure used to link our company’s performance to compensation paid to our PEO and non-PEO NEOs. Group
Adjusted EBITDA is a non -GAAP measure and is calculated as earnings (net income attributable to Lesaka) before interest, tax, depreciation and amortization (“EBITDA”),
adjusted for non-operational transactions (including loss on disposal of equity-accounted investments, gain related to fair value adjustments to currency options), (earnings) loss
from equity-accounted investments, stock-based compensation charges and once-off items. Once -off items represents non-recurring expense items, including costs related to
acquisitions and transactions consummated or ultimately not pursued
.
..
..
..
Tabular list of financial performance measures
We have adopted a cash incentive award plan for the current fiscal year which includes a number of financial and non-
financial performance measures. We consider the following to be a list of our most important financial performance measures used
to link co mpensation actually paid to our named executive officers for our fiscal 202 6 company performance, as required by Item
402(v) of Regulation S-K, the following is a list of financial performance measures:
Smith
Heilbron
Kola
Mali
Group Adjusted EBITDA
Group Adjusted EBITDA
Group Adjusted EBITDA
Group Adjusted EBITDA
Group Net Revenue
Group Net Revenue
Group Net Revenue
Group Net Revenue
Positive Earnings
Positive Earnings
Positive Earnings
Positive Earnings
Group Adjusted EBITDA is the most significant performance measure used to link our company’s performance to compensation paid to our PEO and non-PEO NEOs. Group
Adjusted EBITDA is a non -GAAP measure and is calculated as earnings (net income attributable to Lesaka) before interest, tax, depreciation and amortization (“EBITDA”),
adjusted for non-operational transactions (including loss on disposal of equity-accounted investments, gain related to fair value adjustments to currency options), (earnings) loss
from equity-accounted investments, stock-based compensation charges and once-off items. Once -off items represents non-recurring expense items, including costs related to
acquisitions and transactions consummated or ultimately not pursued