Shareholder Report
Jul. 31, 2026
USD ($)
$ / shares
This report describes changes to the Fund that occurred during the reporting period.
WHAT WERE THE FUND COSTS FOR THE PAST YEAR? (based on a hypothetical $10,000 investment)
|
Fund Name
|
Costs of a $10,000 investment
|
Costs paid as a percentage of a $10,000 investment
|
|
Abacus FCF Innovation Leaders ETF
|
$40
|
0.39%
|
HOW DID THE FUND PERFORM LAST YEAR AND WHAT AFFECTED ITS PERFORMANCE?
During this period, ABOT returned 5.25% (NAV) and 5.42% (Market) and its style-specific benchmark returned 7.78%. On a benchmark relative basis, the best active contributors were Health Care and Large Blend stocks. The main active detractors were Information Technology and Mid Growth stocks. ABOT owns a portfolio of high-quality stocks selected by our proprietary free cash flow algorithm: as of July 31, 2026, the cash flow return for ABOT was 5.02% compared to the benchmark’s 2.50%.
|
Top Contributor
|
|
|
↑
|
Datadog Inc
|
|
Top Detractor
|
|
|
↓
|
Roblox Corp
|
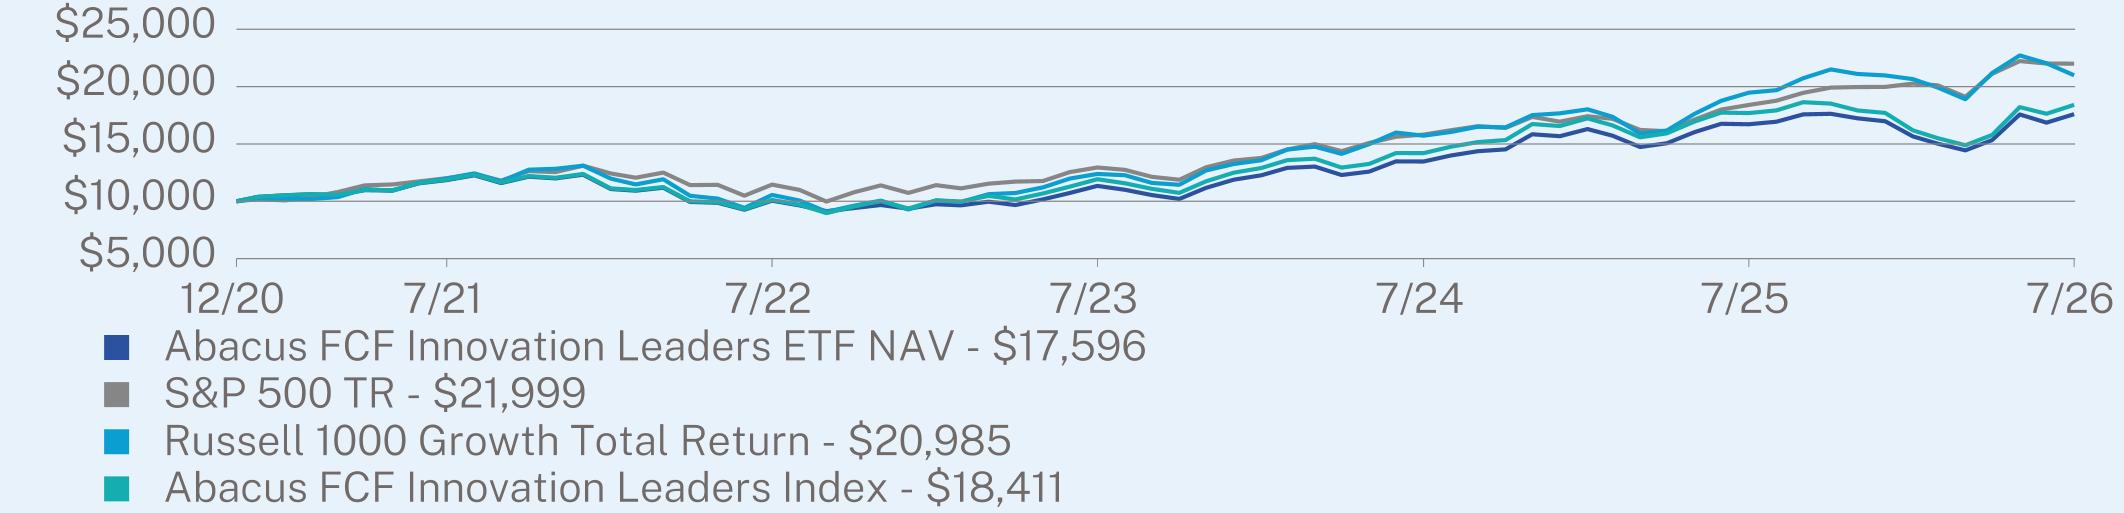
ANNUAL AVERAGE TOTAL RETURN (%)
|
|
1 Year
|
5 Year
|
Since Inception
(12/07/2020) |
|
Abacus FCF Innovation Leaders ETF NAV
|
5.25
|
8.23
|
10.53
|
|
S&P 500 TR
|
19.56
|
12.86
|
14.98
|
|
Russell 1000 Growth Total Return
|
7.78
|
11.85
|
14.03
|
|
Abacus FCF Innovation Leaders Index
|
4.07
|
9.14
|
11.42
|
Visit https://abacusfcf.com/abot/ for more recent performance information.
KEY FUND STATISTICS (as of July 31, 2026)
|
Net Assets
|
$4,042,333
|
|
Number of Holdings
|
51
|
|
Net Advisory Fee
|
$19,579
|
|
Portfolio Turnover
|
73%
|
|
30-Day SEC Yield
|
0.20%
|
|
30-Day SEC Yield Unsubsidized
|
0.01%
|
WHAT DID THE FUND INVEST IN? (as of July 31, 2026)
|
Top 10 Issuers
|
(% of net assets)
|
|
|
Apple, Inc.
|
4.9
|
%
|
|
NVIDIA Corp.
|
4.7
|
%
|
|
Broadcom, Inc.
|
3.9
|
%
|
|
Mount Vernon Liquid Assets Portfolio, LLC
|
3.5
|
%
|
|
AbbVie, Inc.
|
3.3
|
%
|
|
Airbnb, Inc.
|
2.7
|
%
|
|
Snowflake, Inc.
|
2.7
|
%
|
|
Bristol-Myers Squibb Co.
|
2.6
|
%
|
|
Fortinet, Inc.
|
2.5
|
%
|
|
Adobe, Inc.
|
2.5
|
%
|
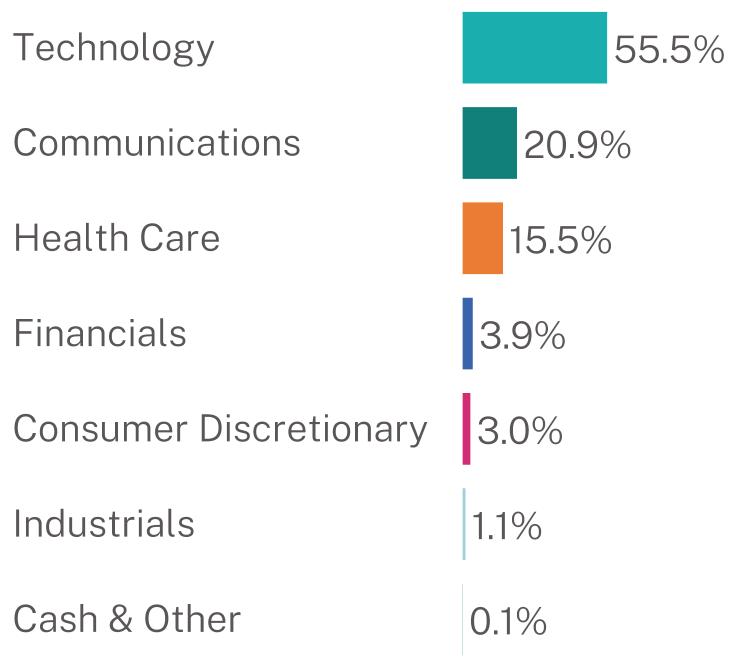
Sector Breakdown (% of net assets)
CERTAIN CHANGES TO THE FUND
Effective August 14, 2026, Cody Raulerson, CFA, joined the firm as Executive Vice President and Portfolio Manager. Mr. Raulerson, along with Fei Xue (Vice President) and Tom MacDonald (Financial Analyst), now serve as ABOT’s portfolio managers and are jointly and primarily responsible for the day-to-day management of ABOT’s portfolio.
This report describes changes to the Fund that occurred during the reporting period.
WHAT WERE THE FUND COSTS FOR THE PAST YEAR? (based on a hypothetical $10,000 investment)
|
Fund Name
|
Costs of a $10,000 investment
|
Costs paid as a percentage of a $10,000 investment
|
|
Abacus FCF International Leaders ETF
|
$56
|
0.54%
|
HOW DID THE FUND PERFORM LAST YEAR AND WHAT AFFECTED ITS PERFORMANCE?
During this period, ABLG returned 6.87% (NAV) and 6.10% (Market) and its benchmark returned 28.46%. On a benchmark relative basis, the best active contributors were Health Care, Mid Value stocks and exposure to Japan. The main active detractors were Information Technology, Large Value stocks and exposure to Asia - Emerging. ABLG owns a portfolio of high-quality stocks selected by our proprietary free cash flow algorithm: as of July 31, 2026, the cash flow return for ABLG was 6.41% compared to the benchmark’s 4.17%.
|
Top Contributor
|
|
|
↑
|
Advantest Corp
|
|
Top Detractor
|
|
|
↓
|
Monday.com LTD
|
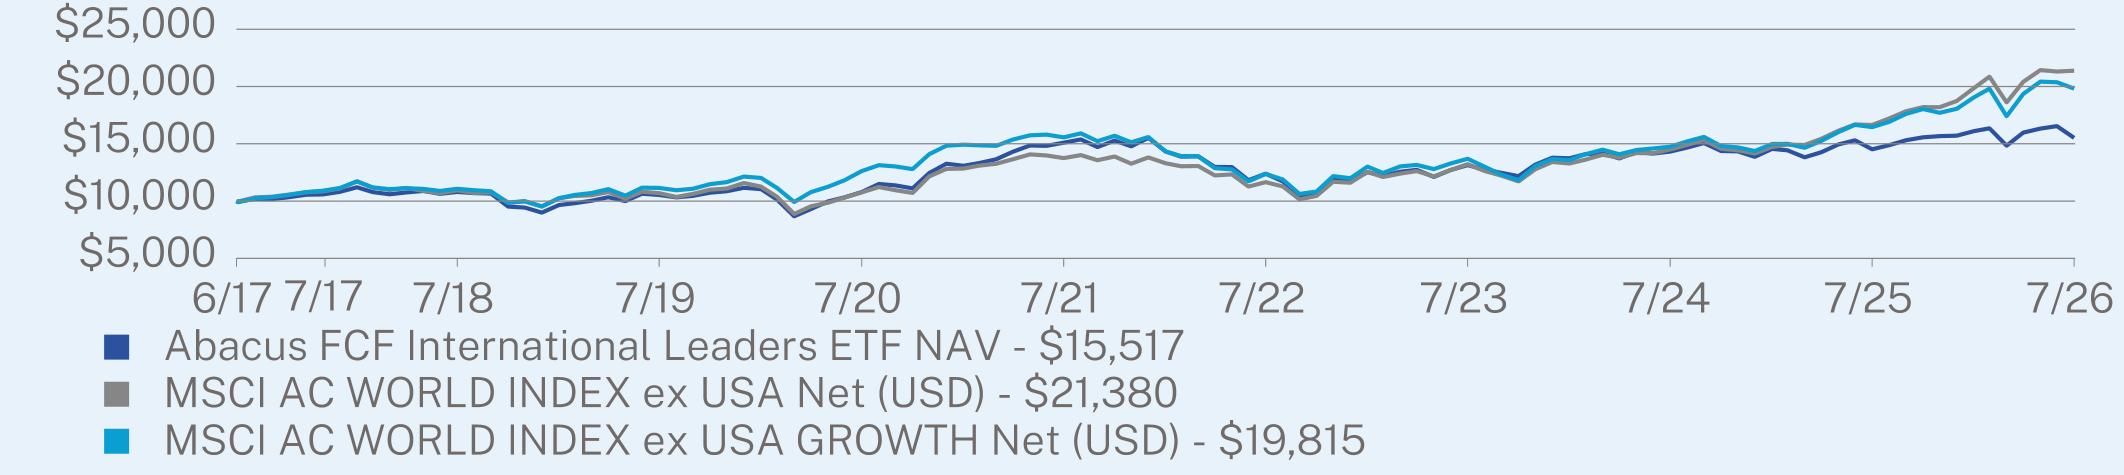
ANNUAL AVERAGE TOTAL RETURN (%)
|
|
1 Year
|
5 Year
|
Since Inception
(06/27/2017) |
|
Abacus FCF International Leaders ETF NAV
|
6.87
|
0.55
|
4.95
|
|
MSCI AC WORLD INDEX ex USA Net (USD)
|
28.46
|
9.22
|
8.72
|
|
MSCI AC WORLD INDEX ex USA GROWTH Net (USD)
|
20.42
|
4.95
|
7.81
|
Visit https://abacusfcf.com/ablg/ for more recent performance information.
KEY FUND STATISTICS (as of July 31, 2026)
|
Net Assets
|
$16,136,671
|
|
Number of Holdings
|
49
|
|
Net Advisory Fee
|
$137,022
|
|
Portfolio Turnover
|
99%
|
|
30-Day SEC Yield
|
2.19%
|
|
30-Day SEC Yield Unsubsidized
|
2.19%
|
WHAT DID THE FUND INVEST IN? (as of July 31, 2026)
|
Top 10 Issuers
|
(% of net assets)
|
|
|
Mount Vernon Liquid Assets Portfolio, LLC
|
12.7
|
%
|
|
Taiwan Semiconductor Manufacturing Co. Ltd.
|
4.9
|
%
|
|
ASML Holding NV
|
4.9
|
%
|
|
SK hynix, Inc.
|
4.1
|
%
|
|
Advantest Corp.
|
3.9
|
%
|
|
Novartis AG
|
3.3
|
%
|
|
Rolls-Royce Holdings PLC
|
3.2
|
%
|
|
Tencent Holdings Ltd.
|
3.1
|
%
|
|
Roche Holding AG
|
2.7
|
%
|
|
Siemens Energy AG
|
2.6
|
%
|
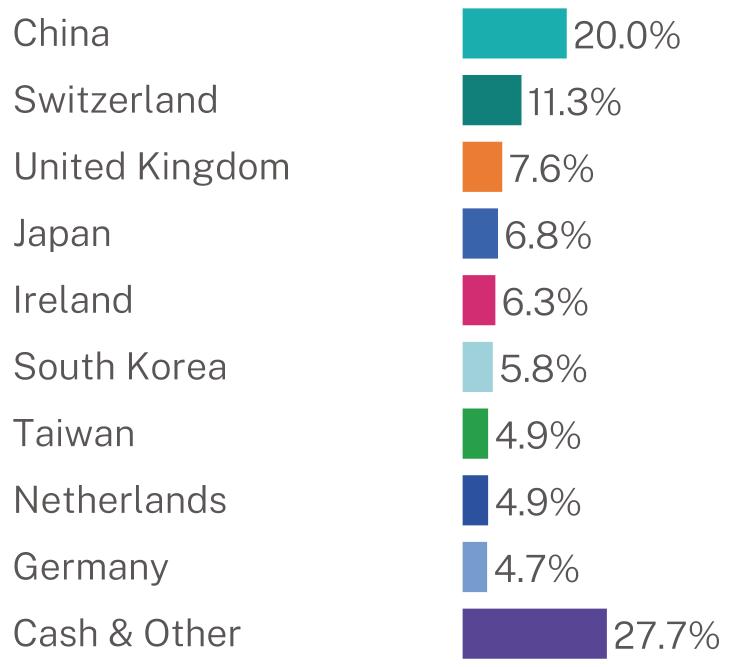
Geographic Breakdown (% of net assets)
Sector Breakdown (% of net assets)
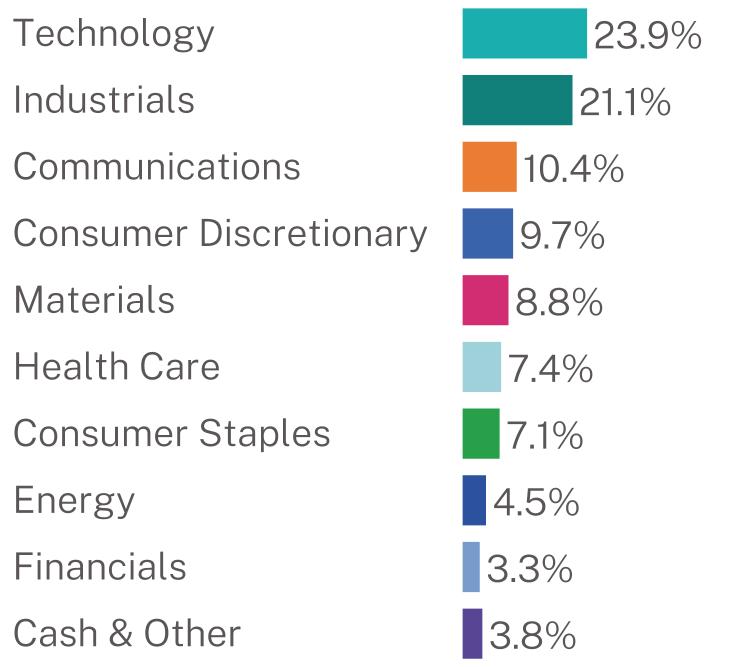
CERTAIN CHANGES TO THE FUND
Effective August 14, 2026, Cody Raulerson, CFA, joined the firm as Executive Vice President and Portfolio Manager. Mr. Raulerson, along with Fei Xue (Vice President) and Tom MacDonald (Financial Analyst), now serve as ABLG’s portfolio managers and are jointly and primarily responsible for the day-to-day management of ABLG’s portfolio.
This report describes changes to the Fund that occurred during the reporting period.
WHAT WERE THE FUND COSTS FOR THE PAST YEAR? (based on a hypothetical $10,000 investment)
|
Fund Name
|
Costs of a $10,000 investment
|
Costs paid as a percentage of a $10,000 investment
|
|
Abacus FCF Leaders ETF
|
$53
|
0.49%
|
HOW DID THE FUND PERFORM LAST YEAR AND WHAT AFFECTED ITS PERFORMANCE?
During this period, ABFL returned 17.37% (NAV) and 17.50% (Market) and its benchmark returned 19.60%. On a benchmark relative basis, the best active contributors were Industrials and Large Growth stocks. The main active detractors were Information Technology and Mid Growth stocks. ABFL owns a portfolio of high-quality stocks selected by our proprietary free cash flow algorithm: as of July 31, 2026, the cash flow return for ABFL was 4.58% compared to 3.33% for the benchmark.
|
Top Contributor
|
|
|
↑
|
Argan Inc
|
|
Top Detractor
|
|
|
↓
|
Roblox Corp
|
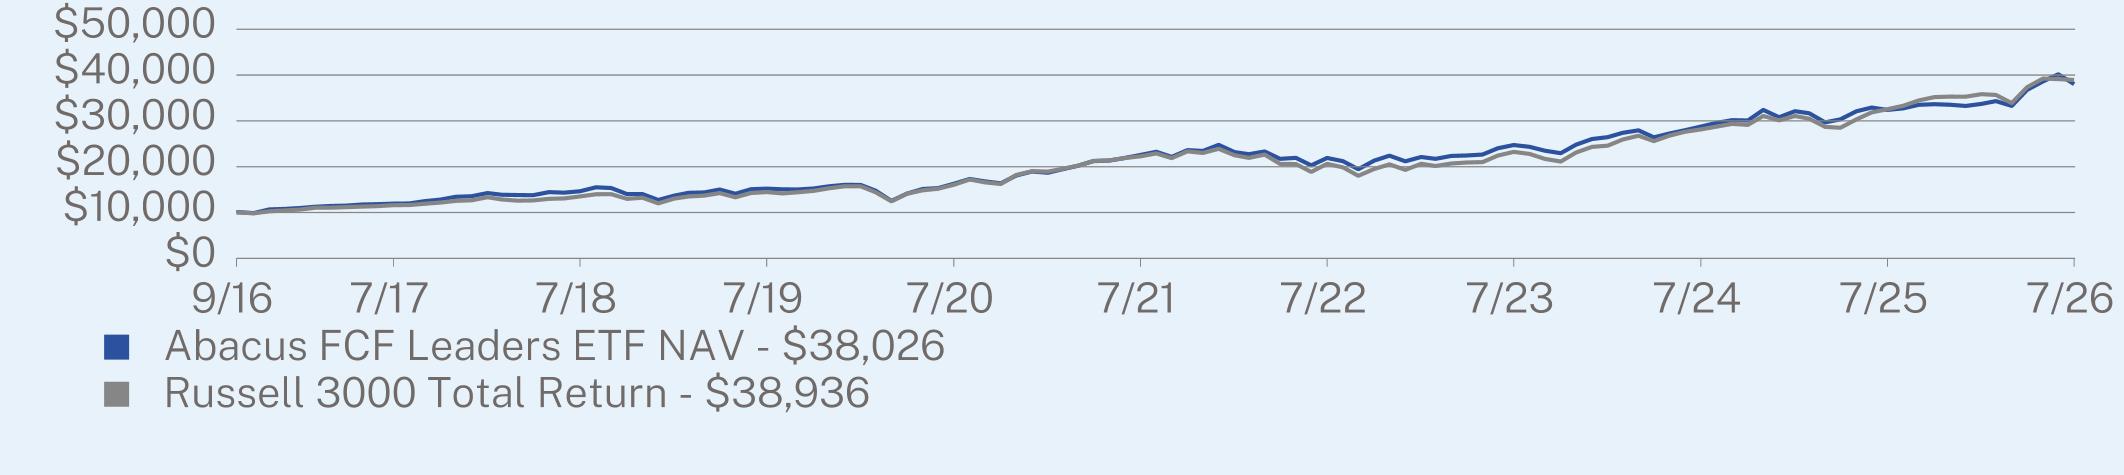
ANNUAL AVERAGE TOTAL RETURN (%)
|
|
1 Year
|
5 Year
|
Since Inception
(09/27/2016) |
|
Abacus FCF Leaders ETF NAV
|
17.37
|
11.00
|
14.54
|
|
Russell 3000 Total Return
|
19.60
|
11.82
|
14.81
|
Visit https://abacusfcf.com/abfl/ for more recent performance information.
KEY FUND STATISTICS (as of July 31, 2026)
|
Net Assets
|
$526,084,373
|
|
Number of Holdings
|
59
|
|
Net Advisory Fee
|
$3,254,974
|
|
Portfolio Turnover
|
104%
|
|
30-Day SEC Yield
|
0.72%
|
|
30-Day SEC Yield Unsubsidized
|
0.72%
|
WHAT DID THE FUND INVEST IN? (as of July 31, 2026)
|
Top 10 Issuers
|
(% of net assets)
|
|
|
Apple, Inc.
|
5.1
|
%
|
|
NVIDIA Corp.
|
4.6
|
%
|
|
Eli Lilly & Co.
|
3.0
|
%
|
|
Bristol-Myers Squibb Co.
|
2.9
|
%
|
|
AbbVie, Inc.
|
2.9
|
%
|
|
GE Vernova, Inc.
|
2.6
|
%
|
|
Lam Research Corp.
|
2.6
|
%
|
|
Cheniere Energy Partners LP
|
2.5
|
%
|
|
Broadcom, Inc.
|
2.5
|
%
|
|
KLA Corp.
|
2.4
|
%
|
Sector Breakdown (% of net assets)
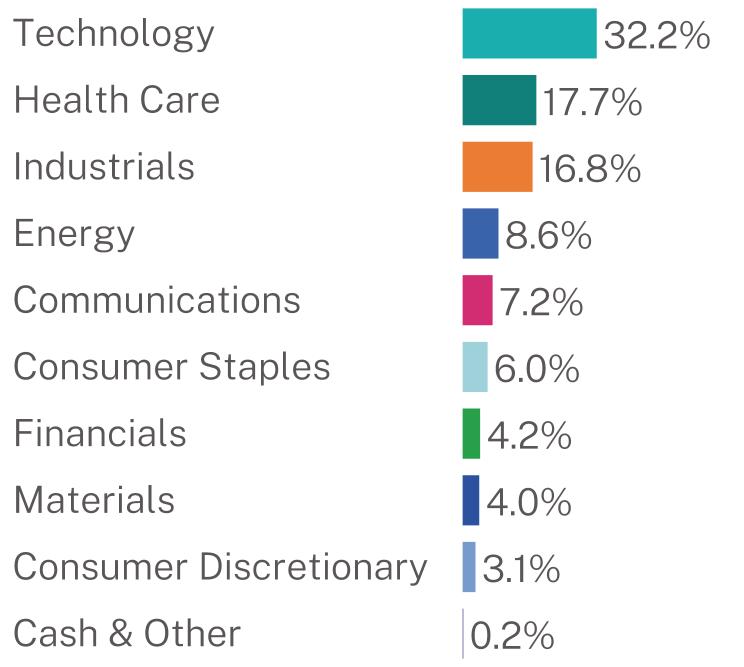
CERTAIN CHANGES TO THE FUND
Effective August 14, 2026, Cody Raulerson, CFA, joined the firm as Executive Vice President and Portfolio Manager. Mr. Raulerson, along with Fei Xue (Vice President) and Tom MacDonald (Financial Analyst), now serve as ABFL’s portfolio managers and are jointly and primarily responsible for the day-to-day management of ABFL’s portfolio.
This report describes changes to the Fund that occurred during the reporting period.
WHAT WERE THE FUND COSTS FOR THE PAST YEAR? (based on a hypothetical $10,000 investment)
|
Fund Name
|
Costs of a $10,000 investment
|
Costs paid as a percentage of a $10,000 investment
|
|
Abacus FCF Real Assets Leaders ETF
|
$41
|
0.39%
|
HOW DID THE FUND PERFORM LAST YEAR AND WHAT AFFECTED ITS PERFORMANCE?
During this period, ABLD returned 11.85% (NAV) and 12.04% (Market) and its style-specific benchmark returned 20.62%. On a benchmark relative basis, the best active contributors were Financials and Large Value stocks. The main active detractors were Information Technology and Large Growth stocks. ABLD owns a portfolio of high-quality stocks selected by our proprietary free cash flow algorithm: as of July 31, 2026, the cash flow return for ABLD was 7.76% compared to the benchmark’s 4.11%.
|
Top Contributor
|
|
|
↑
|
Axia Energia
|
|
Top Detractor
|
|
|
↓
|
Vontier Corp
|
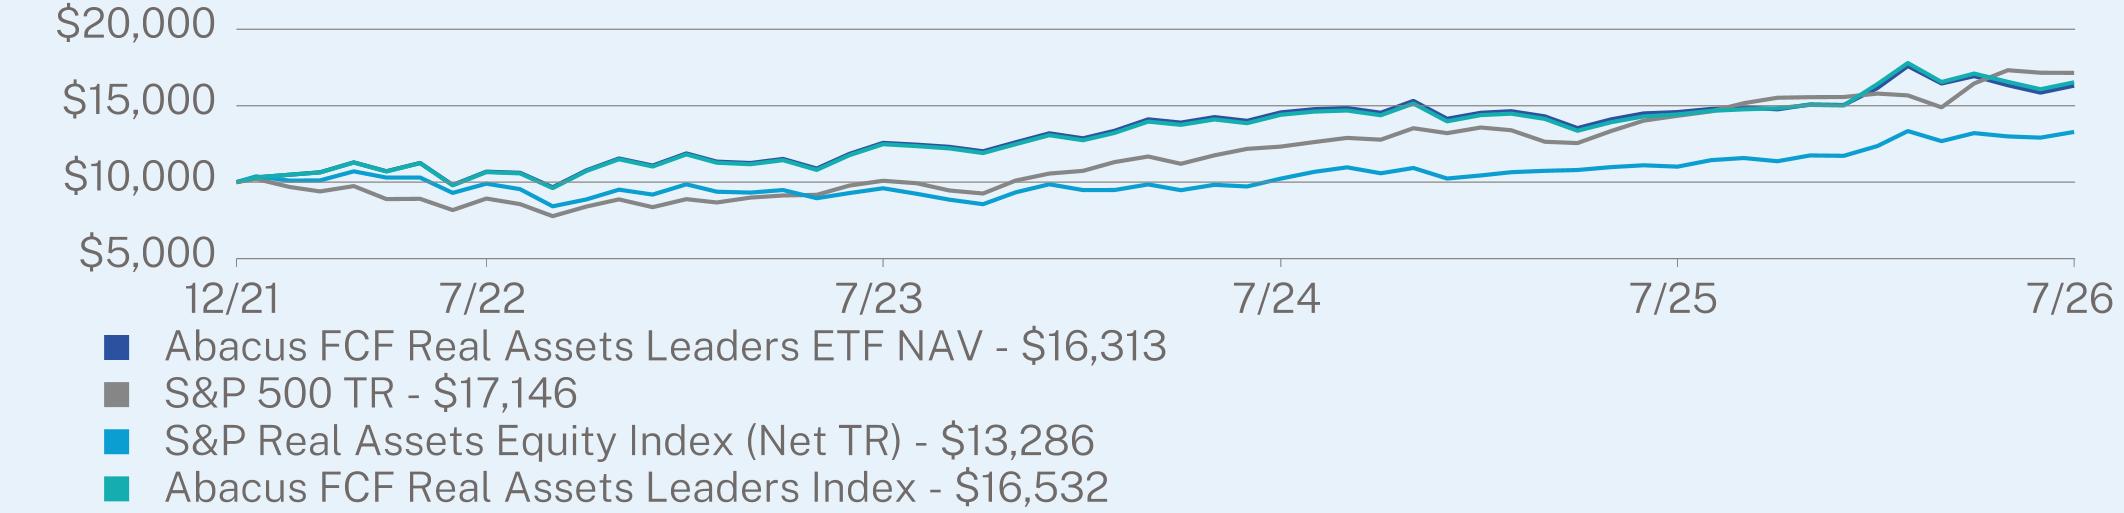
ANNUAL AVERAGE TOTAL RETURN (%)
|
|
1 Year
|
Since Inception
(12/13/2021) |
|
Abacus FCF Real Assets Leaders ETF NAV
|
11.85
|
11.15
|
|
S&P 500 TR
|
19.56
|
12.35
|
|
S&P Real Assets Equity Index (Net TR)
|
20.62
|
6.33
|
|
Abacus FCF Real Assets Leaders Index
|
14.58
|
11.47
|
Visit https://abacusfcf.com/abld/ for more recent performance information.
KEY FUND STATISTICS (as of July 31, 2026)
|
Net Assets
|
$92,756,849
|
|
Number of Holdings
|
48
|
|
Net Advisory Fee
|
$231,123
|
|
Portfolio Turnover
|
151%
|
|
30-Day SEC Yield
|
2.72%
|
|
30-Day SEC Yield Unsubsidized
|
2.52%
|
WHAT DID THE FUND INVEST IN? (as of July 31, 2026)
|
Top 10 Issuers
|
(% of net assets)
|
|
|
Mount Vernon Liquid Assets Portfolio, LLC
|
11.2
|
%
|
|
Cheniere Energy Partners LP
|
3.9
|
%
|
|
Petroleo Brasileiro SA - Petrobras
|
3.9
|
%
|
|
APA Corp.
|
3.9
|
%
|
|
Simon Property Group, Inc.
|
3.8
|
%
|
|
Hitachi Ltd.
|
3.6
|
%
|
|
Archer-Daniels-Midland Co.
|
3.6
|
%
|
|
Western Midstream Partners LP
|
3.6
|
%
|
|
BHP Group Ltd.
|
3.2
|
%
|
|
Antero Midstream Corp.
|
3.2
|
%
|
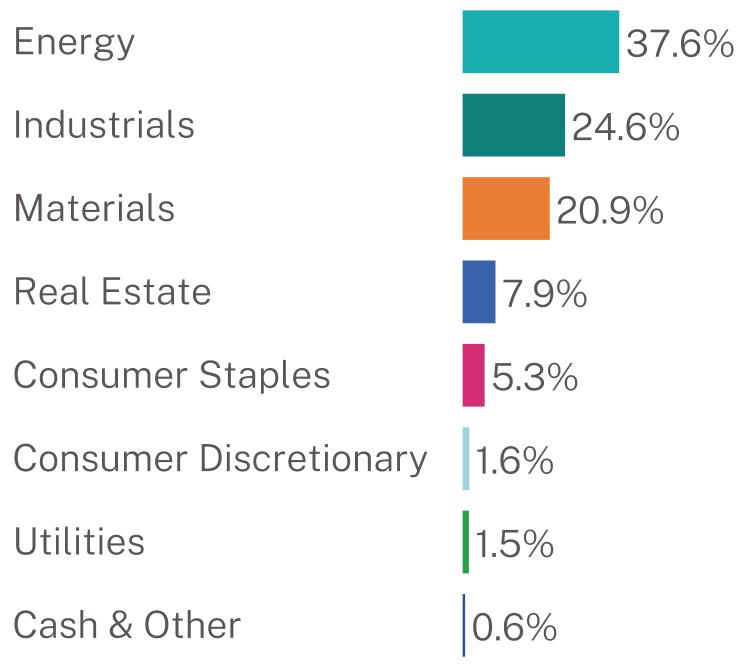
Sector Breakdown (% of net assets)
CERTAIN CHANGES TO THE FUND
Effective January 15, 2026, ABLD no longer considers dividends as part of its investment strategy.
Effective August 14, 2026, Cody Raulerson, CFA, joined the firm as Executive Vice President and Portfolio Manager. Mr. Raulerson, along with Fei Xue (Vice President) and Tom MacDonald (Financial Analyst), now serve as ABLD’s portfolio managers and are jointly and primarily responsible for the day-to-day management of ABLD’s portfolio.
This report describes changes to the Fund that occurred during the reporting period.
WHAT WERE THE FUND COSTS FOR THE PAST YEAR? (based on a hypothetical $10,000 investment)
|
Fund Name
|
Costs of a $10,000 investment
|
Costs paid as a percentage of a $10,000 investment
|
|
Abacus FCF Small Cap Leaders ETF
|
$41
|
0.39%
|
HOW DID THE FUND PERFORM LAST YEAR AND WHAT AFFECTED ITS PERFORMANCE?
During this period, ABLS returned 12.47% (NAV) and 12.56% (Market) and its style-specific benchmark returned 34.18%. On a benchmark relative basis, the best active contributors were Financials and Mid Blend stocks. The main active detractors were Information Technology and Small Value stocks. ABLS owns a portfolio of high-quality stocks selected by our proprietary free cash flow algorithm: as of July 31, 2026, the cash flow return for ABLS was 10.15% compared to the benchmark’s 2.90%.
|
Top Contributor
|
|
|
↑
|
Argan Inc
|
|
Top Detractor
|
|
|
↓
|
CommVault Systems
|
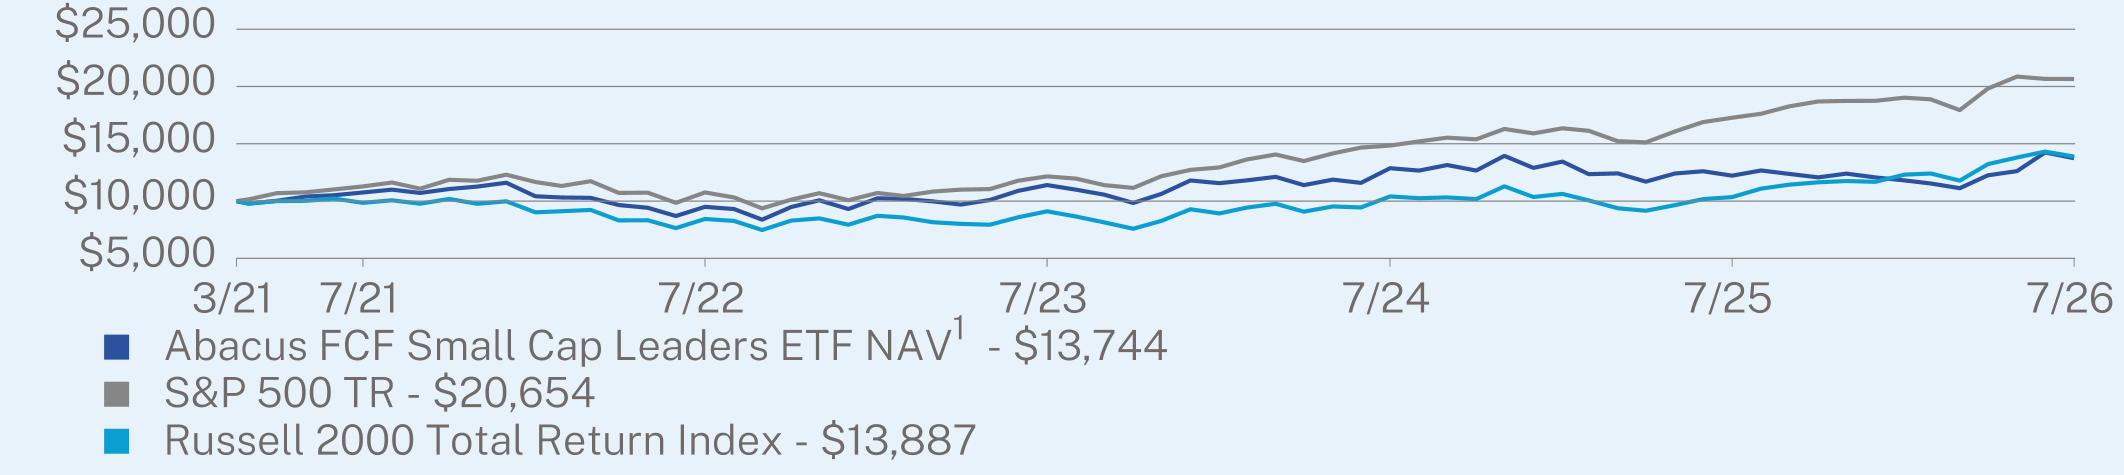
ANNUAL AVERAGE TOTAL RETURN (%)
|
|
1 Year
|
5 Year1
|
Since Inception
(03/18/2021)1
|
|
Abacus FCF Small Cap Leaders ETF NAV
|
12.47
|
5.03
|
6.10
|
|
S&P 500 TR
|
19.56
|
12.86
|
14.46
|
|
Russell 2000 Total Return Index
|
34.18
|
7.11
|
6.31
|
|
Abacus FCF Small Cap Leaders Index
|
16.11
|
5.74
|
7.502
|
Visit https://abacusfcf.com/abls/ for more recent performance information.
KEY FUND STATISTICS (as of July 31, 2026)
|
Net Assets
|
$464,509
|
|
Number of Holdings
|
47
|
|
Net Advisory Fee
|
$4,389
|
|
Portfolio Turnover
|
108%
|
|
30-Day SEC Yield
|
0.47%
|
|
30-Day SEC Yield Unsubsidized
|
0.27%
|
WHAT DID THE FUND INVEST IN? (as of July 31, 2026)
|
Top 10 Issuers
|
(% of net assets)
|
|
|
Argan, Inc.
|
11.8
|
%
|
|
Enova International, Inc.
|
6.5
|
%
|
|
Oscar Health, Inc.
|
5.8
|
%
|
|
Artisan Partners Asset Management, Inc.
|
4.4
|
%
|
|
Collegium Pharmaceutical, Inc.
|
4.3
|
%
|
|
Healthcare Services Group, Inc.
|
3.7
|
%
|
|
Harmony Biosciences Holdings, Inc.
|
3.6
|
%
|
|
Qualys, Inc.
|
3.4
|
%
|
|
Kontoor Brands, Inc.
|
3.4
|
%
|
|
Progyny, Inc.
|
3.3
|
%
|
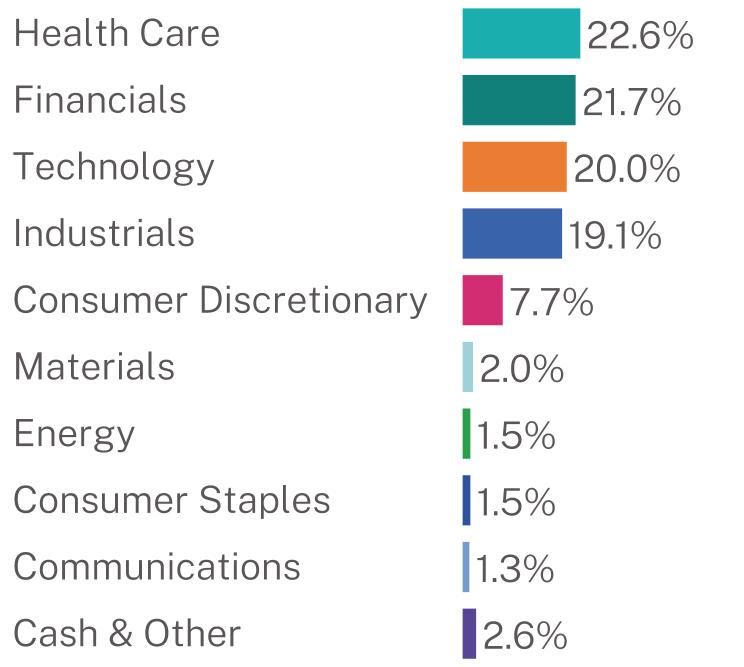
Sector Breakdown (% of net assets)
CERTAIN CHANGES TO THE FUND
Effective August 14, 2026, Cody Raulerson, CFA, joined the firm as Executive Vice President and Portfolio Manager. Mr. Raulerson, along with Fei Xue (Vice President) and Tom MacDonald (Financial Analyst), now serve as ABLS’s portfolio managers and are jointly and primarily responsible for the day-to-day management of ABLS’s portfolio.
This report describes changes to the Fund that occurred during the reporting period.
WHAT WERE THE FUND COSTS FOR THE PAST YEAR? (based on a hypothetical $10,000 investment)
|
Fund Name
|
Costs of a $10,000 investment
|
Costs paid as a percentage of a $10,000 investment
|
|
Abacus Flexible Bond Leaders ETF
|
$40
|
0.39%
|
HOW DID THE FUND PERFORM LAST YEAR AND WHAT AFFECTED ITS PERFORMANCE?
During this period, ABXB was up 2.81% (NAV) and 2.81% (Market) and its benchmark returned 2.71%. On a benchmark relative basis, the best active contributor was iShares J.P. Morgan USD Emerging Markets Bond ETF. The main active detractor was iShares 10-20 Year Treasury Bond ETF. The period was marked by Federal Reserve rate cuts in late 2025 followed by an extended pause as sticky inflation and rising oil prices pushed longer-term Treasury yields higher, weighing on ABXB’s duration exposure. Emerging markets debt was the primary contributor as credit spreads tightened to multi-year lows amid resilient global growth and strong investor demand for yield. ABXB seeks current income and capital preservation by dynamically allocating across diverse fixed income categories using a trend-following approach that can move to cash during unfavorable market conditions, creating intermediate core bond plus exposure seeking downside protection.
|
Top Contributor
|
|
|
↑
|
iShares J.P. Morgan USD Emerging Markets Bond ETF
|
|
Top Detractor
|
|
|
↓
|
iShares 10-20 Year Treasury Bond ETF
|
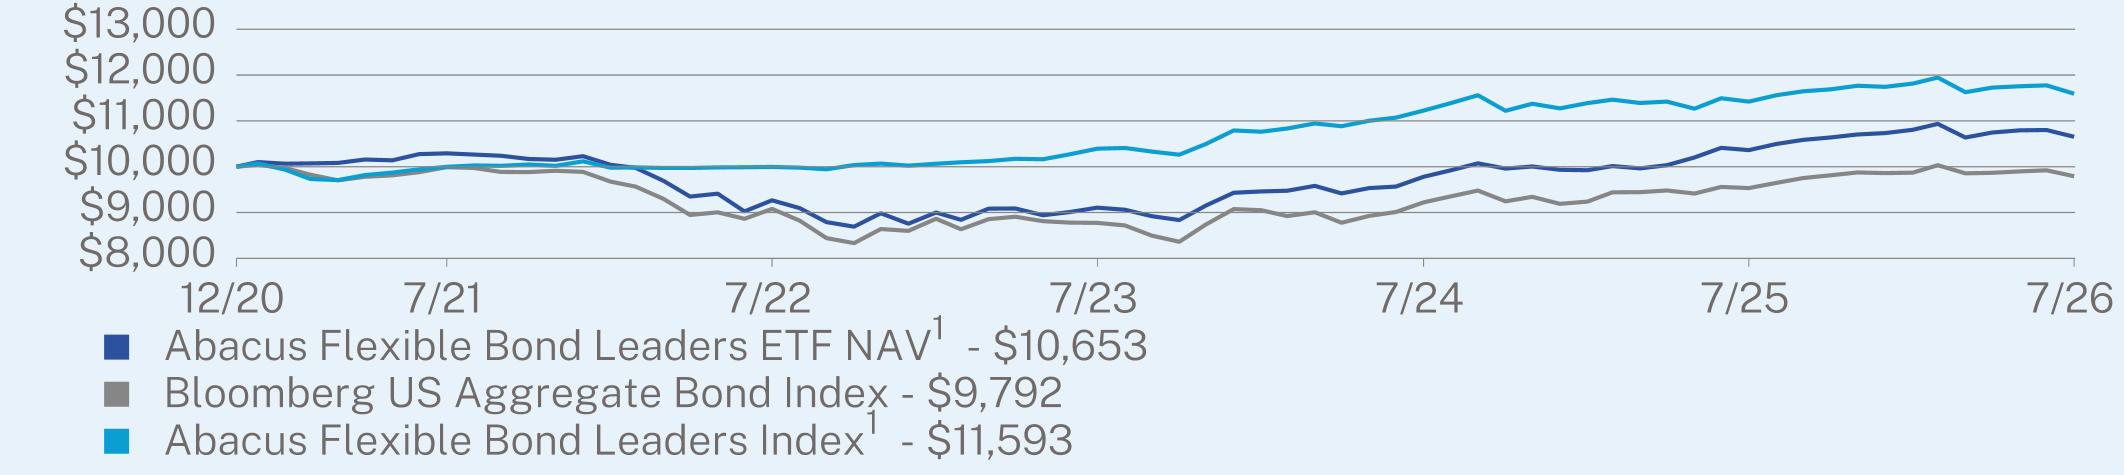
ANNUAL AVERAGE TOTAL RETURN (%)
|
|
1 Year
|
5 Year
|
Since Inception
(12/07/2020) |
|
Abacus Flexible Bond Leaders ETF NAV1
|
2.81
|
0.69
|
1.13
|
|
Bloomberg US Aggregate Bond Index
|
2.71
|
-0.40
|
-0.37
|
|
Abacus Flexible Bond Leaders Index1
|
1.51
|
3.01
|
2.65
|
Visit https://abacusfcf.com/abxb/ for more recent performance information.
KEY FUND STATISTICS (as of July 31, 2026)
|
Net Assets
|
$1,905,874
|
|
Number of Holdings
|
8
|
|
Net Advisory Fee
|
$8,082
|
|
Portfolio Turnover
|
260%
|
|
30-Day SEC Yield
|
4.63%
|
|
30-Day SEC Yield Unsubsidized
|
4.43%
|
WHAT DID THE FUND INVEST IN? (as of July 31, 2026)
|
Top 10 Issuers
|
(% of net assets)
|
|
|
Mount Vernon Liquid Assets Portfolio, LLC
|
19.5
|
%
|
|
Vanguard Short-Term Treasury ETF
|
17.6
|
%
|
|
iShares MBS ETF
|
17.4
|
%
|
|
iShares iBoxx USD Investment Grade Corporate Bond ETF
|
17.2
|
%
|
|
iShares 10-20 Year Treasury Bond ETF
|
17.0
|
%
|
|
VanEck J. P. Morgan EM Local Currency Bond ETF
|
10.2
|
%
|
|
iShares 0-5 Year High Yield Corporate Bond ETF
|
10.1
|
%
|
|
iShares J.P. Morgan USD Emerging Markets Bond ETF
|
10.0
|
%
|
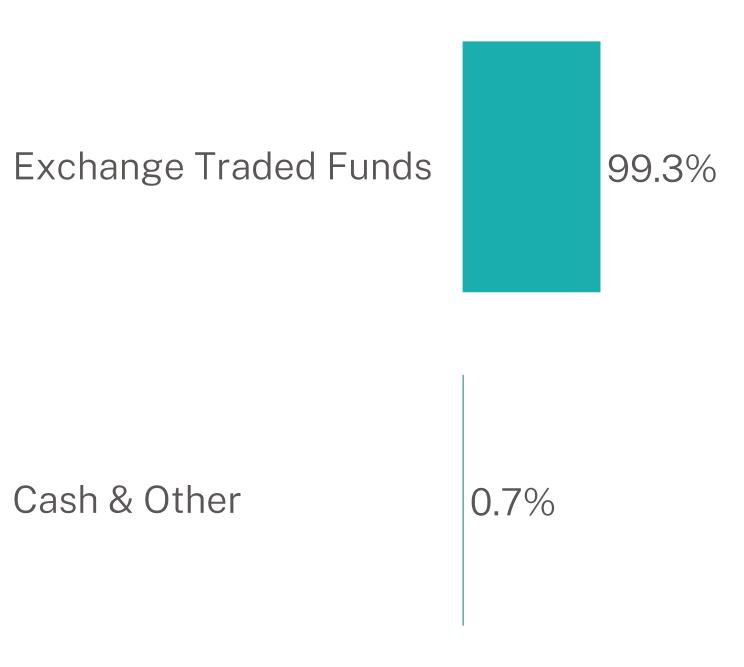
Security Type Breakdown (% of net assets)
CERTAIN CHANGES TO THE FUND
Effective May 15, 2026, ABXB implemented an intermediate core-plus fixed income character to its bond investment strategy.
Effective August 14, 2026, Cody Raulerson, CFA, joined the firm as Executive Vice President and Portfolio Manager. Mr. Raulerson, along with Fei Xue (Vice President) and Tom MacDonald (Financial Analyst), now serve as ABXB’s portfolio managers and are jointly and primarily responsible for the day-to-day management of ABXB’s portfolio.
| [1] |
|
||
| [2] |
|
||
| [3] |
|