Value of Initial Fixed $100 Investment Based On: | ||||||||||||||||||||
Fiscal Year | SCT Total for First PEO | SCT Total for Second PEO | CAP to First PEO | CAP to Second PEO | Average SCT Total for non-PEO NEOs | Average CAP to non-PEO NEOs | Covista Total Shareholder Return | Peer Group Total Shareholder Return | Net Income | Company Selected Measure: Revenue Growth (4) | ||||||||||
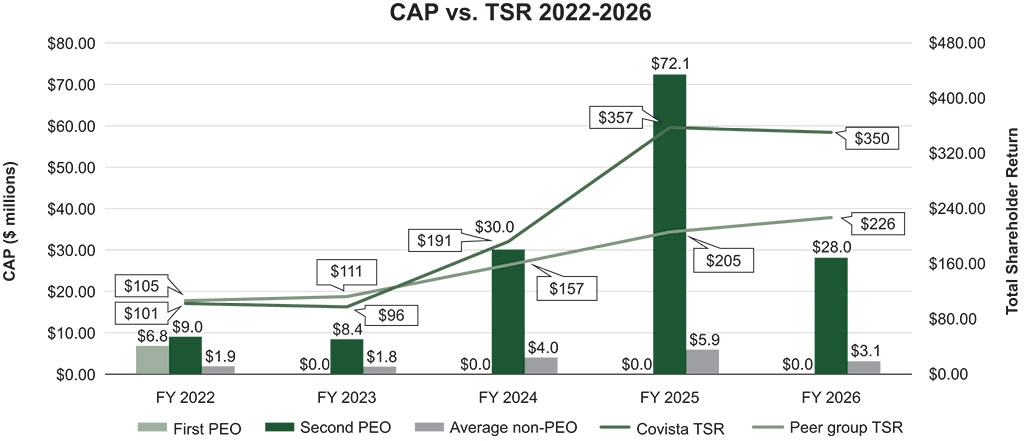
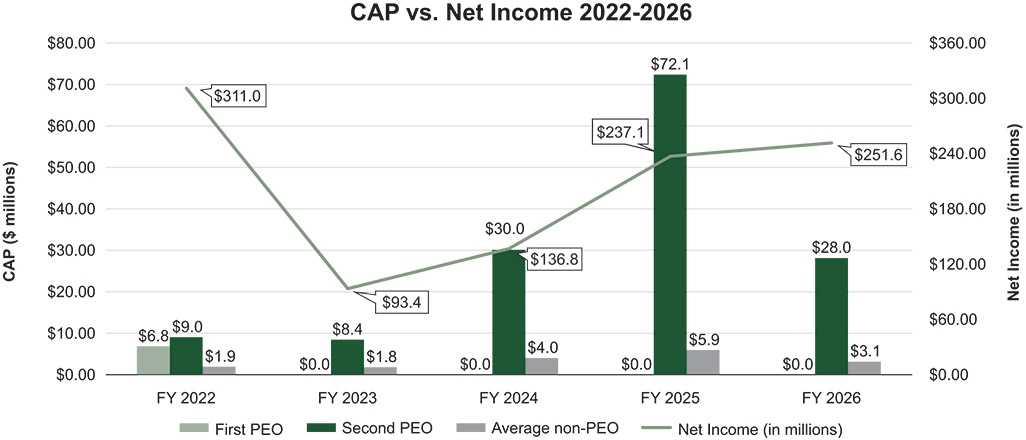
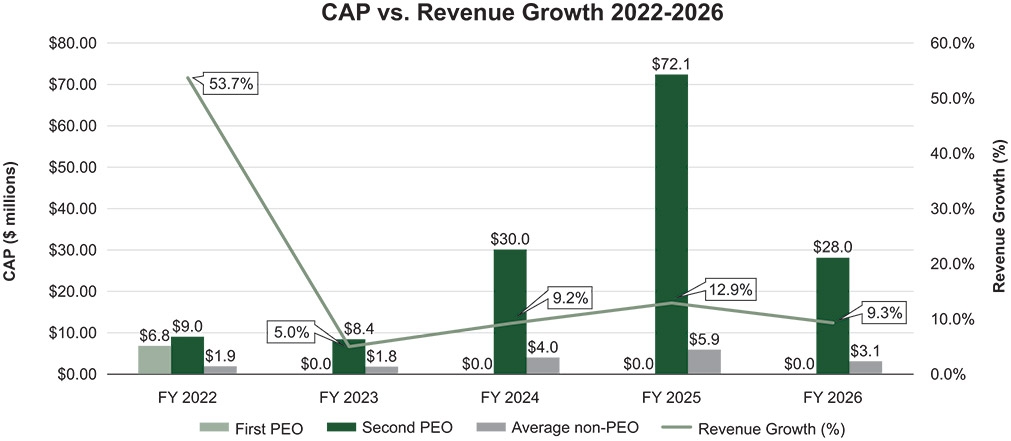
2026 | n/a | 19,016,418 | n/a | 27,987,277 | 2,482,481 | 3,062,252 | 350 | 226 | 251,566 | 9.3% | ||||||||||
2025 | n/a | 17,244,988 | n/a | 72,122,898 | 1,970,444 | 5,924,521 | 357 | 205 | 237,065 | 12.9% | ||||||||||
2024 | n/a | 14,302,581 | n/a | 30,032,741 | 2,390,184 | 4,074,936 | 191 | 157 | 136,777 | 9.2% | ||||||||||
2023 | n/a | 8,054,094 | n/a | 8,409,990 | 1,699,688 | 1,762,437 | 96 | 111 | 93,358 | 5.0% | ||||||||||
2022 | 6,276,069 | 9,204,332 | 6,757,452 | 8,973,854 | 1,851,310 | 1,867,071 | 101 | 105 | 310,991 | 53.7% | ||||||||||
| (1) | Lisa W. Wardell is the First PEO for each of the years shown. Stephen W. Beard is the Second PEO for each of the years shown. The following non-PEO NEOs are included in the average amounts shown: |
2026: Robert J. Phelan, Douglas G. Beck, Michael Betz, Scott Liles
2025: Robert J. Phelan, Douglas G. Beck, Michael Betz, Scott Liles
2024: Robert J. Phelan, Douglas G. Beck, Michael Betz, Maurice Herrera
2023: Robert J. Phelan, Douglas G. Beck, Maurice Herrera, and Steven Tom
2022: Robert J. Phelan, Douglas G. Beck, John W. Danaher, and Maurice Herrera
| (2) | The following tables show amounts deducted from and added to the SCT total to calculate CAP. The fair value of the equity awards was determined consistent with the methodology used to determine the grant date fair value of the awards, with values changing primarily due to the change in stock price and our performance on the metrics applicable to those awards. |
First PEO SCT Total to CAP Reconciliation:
Fiscal Year | SCT Total for First PEO | Less: SCT Total Equity (Stock Awards + Option Awards) | Plus: Fair Value as of Fiscal Year-End of Stock and Option Awards Granted in Covered Year | Plus: Fair Value as of Vest Date of Stock and Option Awards Granted and Vested in Covered Year | Plus: Change in Fair Value of Outstanding and Unvested Stock and Option Awards From Prior Years | Plus: Change in Fair Value of Stock and Option Awards From Prior Years that Vested in the Covered Year | Less: Fair Value as of Prior Fiscal Year-End of Stock and Option Awards Forfeited during the Covered Year | CAP to First PEO | ||||||||
2026 | n/a | n/a | n/a | n/a | n/a | n/a | n/a | n/a | ||||||||
2025 | n/a | n/a | n/a | n/a | n/a | n/a | n/a | n/a | ||||||||
2024 | n/a | n/a | n/a | n/a | n/a | n/a | n/a | n/a | ||||||||
2023 | n/a | n/a | n/a | n/a | n/a | n/a | n/a | n/a | ||||||||
2022 | 6,276,069 | (4,999,803) | 5,167,325 | — | 190,398 | 123,463 | — | 6,757,452 |
Second PEO SCT Total to CAP Reconciliation:
Fiscal Year | SCT Total for Second PEO | Less: SCT Total Equity (Stock Awards + Option Awards) | Plus: Fair Value as of Fiscal Year-End of Stock and Option Awards Granted in Covered Year | Plus: Fair Value as of Vest Date of Stock and Option Awards Granted and Vested in Covered Year | Plus: Change in Fair Value of Outstanding and Unvested Stock and Option Awards From Prior Years | Plus: Change in Fair Value of Stock and Option Awards From Prior Years that Vested in the Covered Year | Less: Fair Value as of Prior Fiscal Year-End of Stock and Option Awards Forfeited during the Covered Year | CAP to Second PEO | ||||||||
2026 | 19,016,418 | (15,999,916) | 23,794,156 | — | (974,789) | 2,151,408 | — | 27,987,277 | ||||||||
2025 | 17,244,988 | (13,999,529) | 31,717,166 | — | 36,720,645 | 439,628 | — | 72,122,898 | ||||||||
2024 | 14,302,581 | (10,499,903) | 17,212,207 | — | 8,342,349 | 675,507 | — | 30,032,741 | ||||||||
2023 | 8,054,094 | (5,808,957) | 6,417,116 | — | (286,448) | 34,185 | — | 8,409,990 | ||||||||
2022 | 9,204,332 | (8,019,699) | 7,168,073 | 625,000 | 53,564 | (57,416) | — | 8,973,854 |
Non-PEO NEOs Average SCT Total to Average CAP Reconciliation:
Fiscal Year | Average SCT Total for non-PEO NEOs | Less: SCT Total Equity (Stock Awards + Option Awards) | Plus: Fair Value as of Fiscal Year-End of Stock and Option Awards Granted in Covered Year | Plus: Fair Value as of Vest Date of Stock and Option Awards Granted and Vested in Covered Year | Plus: Change in Fair Value of Outstanding and Unvested Stock and Option Awards From Prior Years | Plus: Change in Fair Value of Stock and Option Awards From Prior Years that Vested in the Covered Year | Less: Fair Value as of Prior Fiscal Year-End of Stock and Option Awards Forfeited during the Covered Year | Average CAP to non-PEO NEOs | ||||||||
2026 | 2,482,481 | (1,172,200) | 1,672,853 | — | (60,485) | 139,603 | — | 3,062,252 | ||||||||
2025 | 1,970,444 | (711,388) | 1,611,686 | — | 2,850,775 | 203,005 | — | 5,924,521 | ||||||||
2024 |
| 2,390,184 | (986,649) | 1,609,794 | — | 821,826 | 239,781 | — | 4,074,936 | |||||||
2023 |
| 1,699,688 | (559,281) | 617,862 | — | (36,114) | 40,282 | — | 1,762,437 | |||||||
2022 |
| 1,851,310 | (1,047,505) | 1,078,377 | — | 3,532 | (18,643) | — | 1,867,071 |
| (3) | Covista Total Shareholder Return (“TSR”) and Peer Group TSR assume a respective investment of $100 on June 30, 2021 in common stock and also assumes the reinvestment of dividends. Additionally, the Peer Group is weighted by the market capitalization of each component company. The Peer Group consists of American Public Education, Inc. (APEI), Graham Holdings Company (GHC), Grand Canyon Education, Inc. (LOPE), Laureate Education, Inc. (LAUR), Perdoceo Education Corporation (formerly known as Career Education Corporation) (PRDO), and Strategic Education, Inc. (formerly known as Strayer Education, Inc.) (STRA). It is consistent with the Peer Group described in our Form 10-K for FY24. |
| (4) | Covista acquired Walden University on August 12, 2021 (during FY22) and the timing of the acquisition is impacting Covista’s revenue growth percentages in FY22 and 2023. |
Value of Initial Fixed $100 Investment Based On: | ||||||||||||||||||||
Fiscal Year | SCT Total for First PEO | SCT Total for Second PEO | CAP to First PEO | CAP to Second PEO | Average SCT Total for non-PEO NEOs | Average CAP to non-PEO NEOs | Covista Total Shareholder Return | Peer Group Total Shareholder Return | Net Income | Company Selected Measure: Revenue Growth (4) | ||||||||||
2026 | n/a | 19,016,418 | n/a | 27,987,277 | 2,482,481 | 3,062,252 | 350 | 226 | 251,566 | 9.3% | ||||||||||
2025 | n/a | 17,244,988 | n/a | 72,122,898 | 1,970,444 | 5,924,521 | 357 | 205 | 237,065 | 12.9% | ||||||||||
2024 | n/a | 14,302,581 | n/a | 30,032,741 | 2,390,184 | 4,074,936 | 191 | 157 | 136,777 | 9.2% | ||||||||||
2023 | n/a | 8,054,094 | n/a | 8,409,990 | 1,699,688 | 1,762,437 | 96 | 111 | 93,358 | 5.0% | ||||||||||
2022 | 6,276,069 | 9,204,332 | 6,757,452 | 8,973,854 | 1,851,310 | 1,867,071 | 101 | 105 | 310,991 | 53.7% | ||||||||||
| (1) | Lisa W. Wardell is the First PEO for each of the years shown. Stephen W. Beard is the Second PEO for each of the years shown. The following non-PEO NEOs are included in the average amounts shown: |
2026: Robert J. Phelan, Douglas G. Beck, Michael Betz, Scott Liles
2025: Robert J. Phelan, Douglas G. Beck, Michael Betz, Scott Liles
2024: Robert J. Phelan, Douglas G. Beck, Michael Betz, Maurice Herrera
2023: Robert J. Phelan, Douglas G. Beck, Maurice Herrera, and Steven Tom
2022: Robert J. Phelan, Douglas G. Beck, John W. Danaher, and Maurice Herrera
Fiscal Year | Average SCT Total for non-PEO NEOs | Less: SCT Total Equity (Stock Awards + Option Awards) | Plus: Fair Value as of Fiscal Year-End of Stock and Option Awards Granted in Covered Year | Plus: Fair Value as of Vest Date of Stock and Option Awards Granted and Vested in Covered Year | Plus: Change in Fair Value of Outstanding and Unvested Stock and Option Awards From Prior Years | Plus: Change in Fair Value of Stock and Option Awards From Prior Years that Vested in the Covered Year | Less: Fair Value as of Prior Fiscal Year-End of Stock and Option Awards Forfeited during the Covered Year | Average CAP to non-PEO NEOs | ||||||||
2026 | 2,482,481 | (1,172,200) | 1,672,853 | — | (60,485) | 139,603 | — | 3,062,252 | ||||||||
2025 | 1,970,444 | (711,388) | 1,611,686 | — | 2,850,775 | 203,005 | — | 5,924,521 | ||||||||
2024 |
| 2,390,184 | (986,649) | 1,609,794 | — | 821,826 | 239,781 | — | 4,074,936 | |||||||
2023 |
| 1,699,688 | (559,281) | 617,862 | — | (36,114) | 40,282 | — | 1,762,437 | |||||||
2022 |
| 1,851,310 | (1,047,505) | 1,078,377 | — | 3,532 | (18,643) | — | 1,867,071 |
| (2) | The following tables show amounts deducted from and added to the SCT total to calculate CAP. The fair value of the equity awards was determined consistent with the methodology used to determine the grant date fair value of the awards, with values changing primarily due to the change in stock price and our performance on the metrics applicable to those awards. |
First PEO SCT Total to CAP Reconciliation:
Fiscal Year | SCT Total for First PEO | Less: SCT Total Equity (Stock Awards + Option Awards) | Plus: Fair Value as of Fiscal Year-End of Stock and Option Awards Granted in Covered Year | Plus: Fair Value as of Vest Date of Stock and Option Awards Granted and Vested in Covered Year | Plus: Change in Fair Value of Outstanding and Unvested Stock and Option Awards From Prior Years | Plus: Change in Fair Value of Stock and Option Awards From Prior Years that Vested in the Covered Year | Less: Fair Value as of Prior Fiscal Year-End of Stock and Option Awards Forfeited during the Covered Year | CAP to First PEO | ||||||||
2026 | n/a | n/a | n/a | n/a | n/a | n/a | n/a | n/a | ||||||||
2025 | n/a | n/a | n/a | n/a | n/a | n/a | n/a | n/a | ||||||||
2024 | n/a | n/a | n/a | n/a | n/a | n/a | n/a | n/a | ||||||||
2023 | n/a | n/a | n/a | n/a | n/a | n/a | n/a | n/a | ||||||||
2022 | 6,276,069 | (4,999,803) | 5,167,325 | — | 190,398 | 123,463 | — | 6,757,452 |
Second PEO SCT Total to CAP Reconciliation:
Fiscal Year | SCT Total for Second PEO | Less: SCT Total Equity (Stock Awards + Option Awards) | Plus: Fair Value as of Fiscal Year-End of Stock and Option Awards Granted in Covered Year | Plus: Fair Value as of Vest Date of Stock and Option Awards Granted and Vested in Covered Year | Plus: Change in Fair Value of Outstanding and Unvested Stock and Option Awards From Prior Years | Plus: Change in Fair Value of Stock and Option Awards From Prior Years that Vested in the Covered Year | Less: Fair Value as of Prior Fiscal Year-End of Stock and Option Awards Forfeited during the Covered Year | CAP to Second PEO | ||||||||
2026 | 19,016,418 | (15,999,916) | 23,794,156 | — | (974,789) | 2,151,408 | — | 27,987,277 | ||||||||
2025 | 17,244,988 | (13,999,529) | 31,717,166 | — | 36,720,645 | 439,628 | — | 72,122,898 | ||||||||
2024 | 14,302,581 | (10,499,903) | 17,212,207 | — | 8,342,349 | 675,507 | — | 30,032,741 | ||||||||
2023 | 8,054,094 | (5,808,957) | 6,417,116 | — | (286,448) | 34,185 | — | 8,409,990 | ||||||||
2022 | 9,204,332 | (8,019,699) | 7,168,073 | 625,000 | 53,564 | (57,416) | — | 8,973,854 |
| (2) | The following tables show amounts deducted from and added to the SCT total to calculate CAP. The fair value of the equity awards was determined consistent with the methodology used to determine the grant date fair value of the awards, with values changing primarily due to the change in stock price and our performance on the metrics applicable to those awards. |
Non-PEO NEOs Average SCT Total to Average CAP Reconciliation:
Fiscal Year | Average SCT Total for non-PEO NEOs | Less: SCT Total Equity (Stock Awards + Option Awards) | Plus: Fair Value as of Fiscal Year-End of Stock and Option Awards Granted in Covered Year | Plus: Fair Value as of Vest Date of Stock and Option Awards Granted and Vested in Covered Year | Plus: Change in Fair Value of Outstanding and Unvested Stock and Option Awards From Prior Years | Plus: Change in Fair Value of Stock and Option Awards From Prior Years that Vested in the Covered Year | Less: Fair Value as of Prior Fiscal Year-End of Stock and Option Awards Forfeited during the Covered Year | Average CAP to non-PEO NEOs | ||||||||
2026 | 2,482,481 | (1,172,200) | 1,672,853 | — | (60,485) | 139,603 | — | 3,062,252 | ||||||||
2025 | 1,970,444 | (711,388) | 1,611,686 | — | 2,850,775 | 203,005 | — | 5,924,521 | ||||||||
2024 |
| 2,390,184 | (986,649) | 1,609,794 | — | 821,826 | 239,781 | — | 4,074,936 | |||||||
2023 |
| 1,699,688 | (559,281) | 617,862 | — | (36,114) | 40,282 | — | 1,762,437 | |||||||
2022 |
| 1,851,310 | (1,047,505) | 1,078,377 | — | 3,532 | (18,643) | — | 1,867,071 |
Most Important Financial Performance Measures
Included below are the most important metrics used to link CAP to our NEOs for FY26 and company performance.
| ● | Revenue Growth (which we selected as the “company selected measure” for purposes of the table set forth above |
| ● | Revenue |
| ● | Adjusted earnings per share |
| ● | Adjusted EBITDA margin |
| (2) | The following tables show amounts deducted from and added to the SCT total to calculate CAP. The fair value of the equity awards was determined consistent with the methodology used to determine the grant date fair value of the awards, with values changing primarily due to the change in stock price and our performance on the metrics applicable to those awards. |
First PEO SCT Total to CAP Reconciliation:
Fiscal Year | SCT Total for First PEO | Less: SCT Total Equity (Stock Awards + Option Awards) | Plus: Fair Value as of Fiscal Year-End of Stock and Option Awards Granted in Covered Year | Plus: Fair Value as of Vest Date of Stock and Option Awards Granted and Vested in Covered Year | Plus: Change in Fair Value of Outstanding and Unvested Stock and Option Awards From Prior Years | Plus: Change in Fair Value of Stock and Option Awards From Prior Years that Vested in the Covered Year | Less: Fair Value as of Prior Fiscal Year-End of Stock and Option Awards Forfeited during the Covered Year | CAP to First PEO | ||||||||
2026 | n/a | n/a | n/a | n/a | n/a | n/a | n/a | n/a | ||||||||
2025 | n/a | n/a | n/a | n/a | n/a | n/a | n/a | n/a | ||||||||
2024 | n/a | n/a | n/a | n/a | n/a | n/a | n/a | n/a | ||||||||
2023 | n/a | n/a | n/a | n/a | n/a | n/a | n/a | n/a | ||||||||
2022 | 6,276,069 | (4,999,803) | 5,167,325 | — | 190,398 | 123,463 | — | 6,757,452 |
Second PEO SCT Total to CAP Reconciliation:
Fiscal Year | SCT Total for Second PEO | Less: SCT Total Equity (Stock Awards + Option Awards) | Plus: Fair Value as of Fiscal Year-End of Stock and Option Awards Granted in Covered Year | Plus: Fair Value as of Vest Date of Stock and Option Awards Granted and Vested in Covered Year | Plus: Change in Fair Value of Outstanding and Unvested Stock and Option Awards From Prior Years | Plus: Change in Fair Value of Stock and Option Awards From Prior Years that Vested in the Covered Year | Less: Fair Value as of Prior Fiscal Year-End of Stock and Option Awards Forfeited during the Covered Year | CAP to Second PEO | ||||||||
2026 | 19,016,418 | (15,999,916) | 23,794,156 | — | (974,789) | 2,151,408 | — | 27,987,277 | ||||||||
2025 | 17,244,988 | (13,999,529) | 31,717,166 | — | 36,720,645 | 439,628 | — | 72,122,898 | ||||||||
2024 | 14,302,581 | (10,499,903) | 17,212,207 | — | 8,342,349 | 675,507 | — | 30,032,741 | ||||||||
2023 | 8,054,094 | (5,808,957) | 6,417,116 | — | (286,448) | 34,185 | — | 8,409,990 | ||||||||
2022 | 9,204,332 | (8,019,699) | 7,168,073 | 625,000 | 53,564 | (57,416) | — | 8,973,854 |
Non-PEO NEOs Average SCT Total to Average CAP Reconciliation:
Fiscal Year | Average SCT Total for non-PEO NEOs | Less: SCT Total Equity (Stock Awards + Option Awards) | Plus: Fair Value as of Fiscal Year-End of Stock and Option Awards Granted in Covered Year | Plus: Fair Value as of Vest Date of Stock and Option Awards Granted and Vested in Covered Year | Plus: Change in Fair Value of Outstanding and Unvested Stock and Option Awards From Prior Years | Plus: Change in Fair Value of Stock and Option Awards From Prior Years that Vested in the Covered Year | Less: Fair Value as of Prior Fiscal Year-End of Stock and Option Awards Forfeited during the Covered Year | Average CAP to non-PEO NEOs | ||||||||
2026 | 2,482,481 | (1,172,200) | 1,672,853 | — | (60,485) | 139,603 | — | 3,062,252 | ||||||||
2025 | 1,970,444 | (711,388) | 1,611,686 | — | 2,850,775 | 203,005 | — | 5,924,521 | ||||||||
2024 |
| 2,390,184 | (986,649) | 1,609,794 | — | 821,826 | 239,781 | — | 4,074,936 | |||||||
2023 |
| 1,699,688 | (559,281) | 617,862 | — | (36,114) | 40,282 | — | 1,762,437 | |||||||
2022 |
| 1,851,310 | (1,047,505) | 1,078,377 | — | 3,532 | (18,643) | — | 1,867,071 |
| (4) | Covista acquired Walden University on August 12, 2021 (during FY22) and the timing of the acquisition is impacting Covista’s revenue growth percentages in FY22 and 2023. |