Shareholder Report
Jul. 31, 2026
USD ($)
Holding
WHAT WERE THE FUND COSTS FOR THE LAST YEAR?
(Based on a hypothetical $10,000 investment)
Costs of a $10,000 investment |
Costs paid as a percentage of a $10,000 investment | |
PGIM Jennison Diversified Growth Fund—Class A |
$83 |
0.78% |
WHAT AFFECTED THE FUND’S PERFORMANCE DURING THE REPORTING PERIOD?
■ Equity markets generated positive returns during the reporting period despite bouts of market turbulence. Persistent inflation, evolving US Federal Reserve expectations, and Middle East geopolitical tensions, coupled with intermittent weakness in technology leadership, shaped investor sentiment.
■
Strong stock selection drove the Fund's relative outperformance versus the Russell 1000 Growth Index (the “Index”). The largest contributions
came from information technology, particularly semiconductors; consumer discretionary, led by specialty retail; and health care, driven
by pharmaceuticals.
■
In contrast, the largest detractors from relative performance were stock selection in communication services, particularly interactive media &
services, along with an overweight in consumer discretionary and a modest underweight in consumer staples.
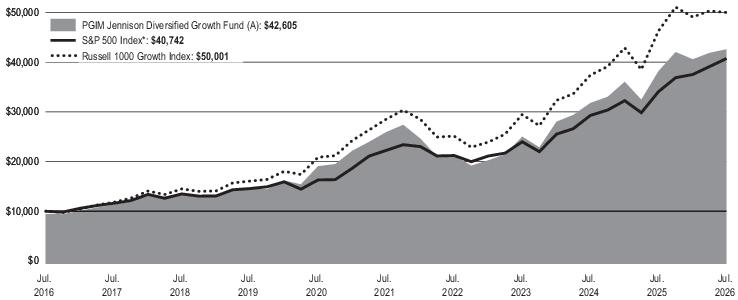
Average Annual Total Returns as of 7/31/2026 | |||
One Year (%) |
Five Years (%) |
Ten Years (%) | |
Class A with sales charges |
5.43% |
9.21% |
15.60% |
Class A without sales charges |
11.57% |
10.45% |
16.25% |
S&P 500 Index* |
19.56% |
12.86% |
15.08% |
Russell 1000 Growth Index |
8.03% |
11.88% |
17.46% |
*The Fund compares its performance against this broad-based index in response to regulatory requirements.
WHAT ARE SOME KEY FUND STATISTICS AS OF 7/31/2026?
Fund’s net assets |
$ 437,942,755 |
Number of fund holdings |
80 |
Total advisory fees paid for the year |
$ 1,683,546 |
Portfolio turnover rate for the year |
112% |
WHAT ARE SOME CHARACTERISTICS OF THE FUND’S HOLDINGS AS OF 7/31/2026?
Industry Classification |
% of Net Assets |
Semiconductors & Semiconductor Equipment |
26.1% |
Software |
12.1% |
Interactive Media & Services |
11.8% |
Technology Hardware, Storage & Peripherals |
8.1% |
Pharmaceuticals |
4.7% |
Broadline Retail |
4.7% |
Financial Services |
4.3% |
Aerospace & Defense |
3.5% |
Entertainment |
3.4% |
Specialty Retail |
3.1% |
Biotechnology |
2.0% |
Electronic Equipment, Instruments & Components |
2.0% |
Machinery |
2.0% |
Affiliated Mutual Fund - Short-Term Investment |
1.8% |
Automobiles |
1.4% |
Industry Classification |
% of Net Assets |
Textiles, Apparel & Luxury Goods |
1.3% |
Consumer Staples Distribution & Retail |
1.2% |
Construction & Engineering |
1.0% |
Consumer Finance |
0.9% |
Commercial Services & Supplies |
0.8% |
Hotels, Restaurants & Leisure |
0.7% |
IT Services |
0.5% |
Banks |
0.5% |
Others* |
2.2% |
100.1% | |
Liabilities in excess of other assets |
(0.1)% |
100.0% |
* |
Consists of Industries that each make up less than 0.5% of the Fund's net assets |
WHAT WERE THE FUND COSTS FOR THE LAST YEAR?
(Based on a hypothetical $10,000 investment)
Costs of a $10,000 investment |
Costs paid as a percentage of a $10,000 investment | |
PGIM Jennison Diversified Growth Fund—Class C |
$188 |
1.79% |
WHAT AFFECTED THE FUND’S PERFORMANCE DURING THE REPORTING PERIOD?
■ Equity markets generated positive returns during the reporting period despite bouts of market turbulence. Persistent inflation, evolving US Federal Reserve expectations, and Middle East geopolitical tensions, coupled with intermittent weakness in technology leadership, shaped investor sentiment.
■
Strong stock selection drove the Fund's relative outperformance versus the Russell 1000 Growth Index (the “Index”). The largest contributions
came from information technology, particularly semiconductors; consumer discretionary, led by specialty retail; and health care, driven
by pharmaceuticals.
■
In contrast, the largest detractors from relative performance were stock selection in communication services, particularly interactive media &
services, along with an overweight in consumer discretionary and a modest underweight in consumer staples.
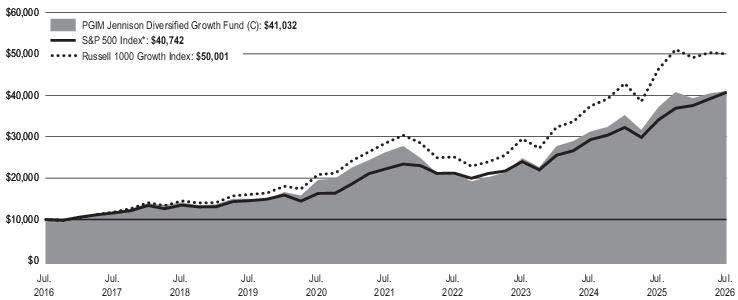
Average Annual Total Returns as of 7/31/2026 | |||
One Year (%) |
Five Years (%) |
Ten Years (%) | |
Class C with sales charges |
9.45% |
9.30% |
15.16% |
Class C without sales charges |
10.45% |
9.30% |
15.16% |
S&P 500 Index* |
19.56% |
12.86% |
15.08% |
Russell 1000 Growth Index |
8.03% |
11.88% |
17.46% |
*The Fund compares its performance against this broad-based index in response to regulatory requirements.
WHAT ARE SOME KEY FUND STATISTICS AS OF 7/31/2026?
Fund’s net assets |
$ 437,942,755 |
Number of fund holdings |
80 |
Total advisory fees paid for the year |
$ 1,683,546 |
Portfolio turnover rate for the year |
112% |
WHAT ARE SOME CHARACTERISTICS OF THE FUND’S HOLDINGS AS OF 7/31/2026?
Industry Classification |
% of Net Assets |
Semiconductors & Semiconductor Equipment |
26.1% |
Software |
12.1% |
Interactive Media & Services |
11.8% |
Technology Hardware, Storage & Peripherals |
8.1% |
Pharmaceuticals |
4.7% |
Broadline Retail |
4.7% |
Financial Services |
4.3% |
Aerospace & Defense |
3.5% |
Entertainment |
3.4% |
Specialty Retail |
3.1% |
Biotechnology |
2.0% |
Electronic Equipment, Instruments & Components |
2.0% |
Machinery |
2.0% |
Affiliated Mutual Fund - Short-Term Investment |
1.8% |
Automobiles |
1.4% |
Industry Classification |
% of Net Assets |
Textiles, Apparel & Luxury Goods |
1.3% |
Consumer Staples Distribution & Retail |
1.2% |
Construction & Engineering |
1.0% |
Consumer Finance |
0.9% |
Commercial Services & Supplies |
0.8% |
Hotels, Restaurants & Leisure |
0.7% |
IT Services |
0.5% |
Banks |
0.5% |
Others* |
2.2% |
100.1% | |
Liabilities in excess of other assets |
(0.1)% |
100.0% |
* |
Consists of Industries that each make up less than 0.5% of the Fund's net assets |
WHAT WERE THE FUND COSTS FOR THE LAST YEAR?
(Based on a hypothetical $10,000 investment)
| |
Costs of a $10,000 investment |
Costs paid as a percentage of a $10,000 investment |
| PGIM Jennison Diversified Growth Fund—Class Z |
$65 |
0.61% |
WHAT AFFECTED THE FUND’S PERFORMANCE DURING THE REPORTING PERIOD?
■ Equity markets generated positive returns during the reporting period despite bouts of market turbulence. Persistent inflation, evolving US Federal Reserve expectations, and Middle East geopolitical tensions, coupled with intermittent weakness in technology leadership, shaped investor sentiment.
■
Strong stock selection drove the Fund's relative outperformance versus the Russell 1000 Growth Index (the “Index”). The largest contributions
came from information technology, particularly semiconductors; consumer discretionary, led by specialty retail; and health care, driven
by pharmaceuticals.
■
In contrast, the largest detractors from relative performance were stock selection in communication services, particularly interactive media &
services, along with an overweight in consumer discretionary and a modest underweight in consumer staples.
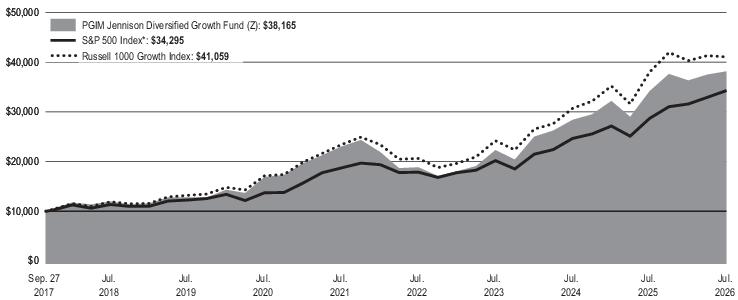
| Average Annual Total Returns as of 7/31/2026 | |||
| |
One Year (%) |
Five Years (%) |
Since Inception (%) |
Class Z |
11.71% |
10.63% |
16.35% (9/27/2017) |
| S&P 500 Index* |
19.56% |
12.86% |
14.97% |
Russell 1000 Growth Index |
8.03% |
11.88% |
17.34% |
*The Fund compares its performance against this broad-based index in response to regulatory requirements.
WHAT ARE SOME KEY FUND STATISTICS AS OF 7/31/2026?
| Fund’s net assets |
$437,942,755 |
| Number of fund holdings |
80 |
| Total advisory fees paid for the year |
$1,683,546 |
| Portfolio turnover rate for the year |
112% |
WHAT ARE SOME CHARACTERISTICS OF THE FUND’S HOLDINGS AS OF 7/31/2026?
| Industry Classification |
% of Net Assets |
| Semiconductors & Semiconductor Equipment |
26.1% |
| Software |
12.1% |
| Interactive Media & Services |
11.8% |
| Technology Hardware, Storage & Peripherals |
8.1% |
| Pharmaceuticals |
4.7% |
| Broadline Retail |
4.7% |
| Financial Services |
4.3% |
| Aerospace & Defense |
3.5% |
| Entertainment |
3.4% |
| Specialty Retail |
3.1% |
| Biotechnology |
2.0% |
| Electronic Equipment, Instruments & Components |
2.0% |
| Machinery |
2.0% |
| Affiliated Mutual Fund - Short-Term Investment |
1.8% |
| Automobiles |
1.4% |
| Industry Classification |
% of Net Assets |
| Textiles, Apparel & Luxury Goods |
1.3% |
| Consumer Staples Distribution & Retail |
1.2% |
| Construction & Engineering |
1.0% |
| Consumer Finance |
0.9% |
| Commercial Services & Supplies |
0.8% |
| Hotels, Restaurants & Leisure |
0.7% |
| IT Services |
0.5% |
| Banks |
0.5% |
| Others* |
2.2% |
| |
100.1% |
| Liabilities in excess of other assets |
(0.1)% |
| |
100.0% |
| * |
Consists of Industries that each make up less than 0.5% of the Fund's net assets |
WHAT WERE THE FUND COSTS FOR THE LAST YEAR?
(Based on a hypothetical $10,000 investment)
Costs of a $10,000 investment |
Costs paid as a percentage of a $10,000 investment | |
PGIM Jennison Diversified Growth Fund—Class R6 |
$47 |
0.44% |
WHAT AFFECTED THE FUND’S PERFORMANCE DURING THE REPORTING PERIOD?
■ Equity markets generated positive returns during the reporting period despite bouts of market turbulence. Persistent inflation, evolving US Federal Reserve expectations, and Middle East geopolitical tensions, coupled with intermittent weakness in technology leadership, shaped investor sentiment.
■
Strong stock selection drove the Fund's relative outperformance versus the Russell 1000 Growth Index (the “Index”). The largest contributions
came from information technology, particularly semiconductors; consumer discretionary, led by specialty retail; and health care, driven
by pharmaceuticals.
■
In contrast, the largest detractors from relative performance were stock selection in communication services, particularly interactive media &
services, along with an overweight in consumer discretionary and a modest underweight in consumer staples.
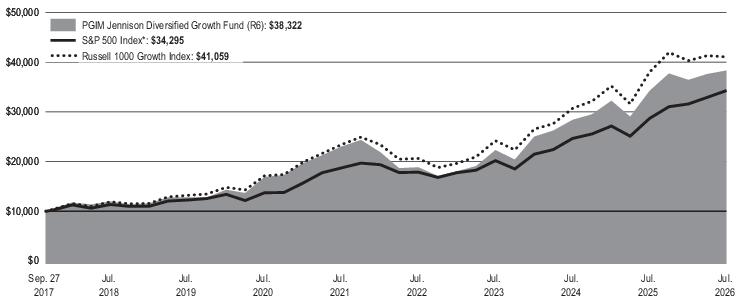
Average Annual Total Returns as of 7/31/2026 | |||
One Year (%) |
Five Years (%) |
Since Inception (%) | |
Class R6 |
11.93% |
10.73% |
16.41% (9/27/2017) |
S&P 500 Index* |
19.56% |
12.86% |
14.97% |
Russell 1000 Growth Index |
8.03% |
11.88% |
17.34% |
*The Fund compares its performance against this broad-based index in response to regulatory requirements.
WHAT ARE SOME KEY FUND STATISTICS AS OF 7/31/2026?
Fund’s net assets |
$437,942,755 |
Number of fund holdings |
80 |
Total advisory fees paid for the year |
$1,683,546 |
Portfolio turnover rate for the year |
112% |
WHAT ARE SOME CHARACTERISTICS OF THE FUND’S HOLDINGS AS OF 7/31/2026?
Industry Classification |
% of Net Assets |
Semiconductors & Semiconductor Equipment |
26.1% |
Software |
12.1% |
Interactive Media & Services |
11.8% |
Technology Hardware, Storage & Peripherals |
8.1% |
Pharmaceuticals |
4.7% |
Broadline Retail |
4.7% |
Financial Services |
4.3% |
Aerospace & Defense |
3.5% |
Entertainment |
3.4% |
Specialty Retail |
3.1% |
Biotechnology |
2.0% |
Electronic Equipment, Instruments & Components |
2.0% |
Machinery |
2.0% |
Affiliated Mutual Fund - Short-Term Investment |
1.8% |
Automobiles |
1.4% |
Industry Classification |
% of Net Assets |
Textiles, Apparel & Luxury Goods |
1.3% |
Consumer Staples Distribution & Retail |
1.2% |
Construction & Engineering |
1.0% |
Consumer Finance |
0.9% |
Commercial Services & Supplies |
0.8% |
Hotels, Restaurants & Leisure |
0.7% |
IT Services |
0.5% |
Banks |
0.5% |
Others* |
2.2% |
100.1% | |
Liabilities in excess of other assets |
(0.1)% |
100.0% |
* |
Consists of Industries that each make up less than 0.5% of the Fund's net assets |
WHAT WERE THE FUND COSTS FOR THE LAST YEAR?
(Based on a hypothetical $10,000 investment)
Costs of a $10,000 investment |
Costs paid as a percentage of a $10,000 investment | |
PGIM Jennison Rising Dividend Fund—Class A |
$136 |
1.24% |
WHAT AFFECTED THE FUND’S PERFORMANCE DURING THE REPORTING PERIOD?
■ Over the past year, equities (represented by the S&P 500 Index) delivered solid results. Dividend-paying stocks also produced solid gains for the reporting period, though they underperformed the broader U.S. equity market. In a year that had bouts of macro uncertainty and market volatility, dividend strategies benefited as investors rotated into more stable, income-generating assets amid sticky inflation, changing expectations for U.S. Federal Reserve policy, geopolitical uncertainty tied to the Middle East, and intermittent weakness in technology leadership.
■
Security selection within industrials (driven by building products, machinery, and electrical equipment), financials (primarily capital markets), and
consumer discretionary (mainly specialty retail) were the top contributors to performance relative to the S&P 500 Index (the “Index”).
■
Stock selection within energy and communication services (led by interactive media & services), along with an underweight in information
technology and an overweight in utilities, detracted the most from performance relative to the Index.
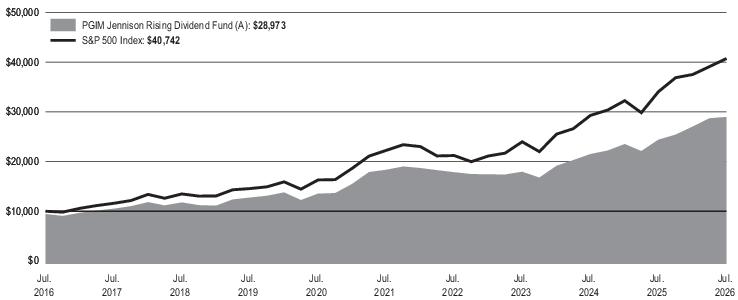
Average Annual Total Returns as of 7/31/2026 | |||
One Year (%) |
Five Years (%) |
Ten Years (%) | |
Class A with sales charges |
12.17% |
8.33% |
11.22% |
Class A without sales charges |
18.70% |
9.57% |
11.86% |
S&P 500 Index |
19.56% |
12.86% |
15.08% |
WHAT ARE SOME KEY FUND STATISTICS AS OF 7/31/2026?
Fund’s net assets |
$82,710,699 |
Number of fund holdings |
62 |
Total advisory fees paid for the year |
$493,895 |
Portfolio turnover rate for the year |
26% |
WHAT ARE SOME CHARACTERISTICS OF THE FUND’S HOLDINGS AS OF 7/31/2026?
Industry Classification |
% of Net Assets |
Oil, Gas & Consumable Fuels |
10.4% |
Semiconductors & Semiconductor Equipment |
9.8% |
Banks |
8.0% |
Electric Utilities |
5.6% |
Biotechnology |
4.3% |
Machinery |
4.3% |
Pharmaceuticals |
4.1% |
Communications Equipment |
4.0% |
Capital Markets |
3.8% |
Multi-Utilities |
3.4% |
Specialty Retail |
3.1% |
Electrical Equipment |
2.9% |
Technology Hardware, Storage & Peripherals |
2.8% |
Building Products |
2.8% |
Consumer Staples Distribution & Retail |
2.7% |
Diversified Telecommunication Services |
2.6% |
Aerospace & Defense |
2.6% |
IT Services |
2.6% |
Interactive Media & Services |
2.5% |
Hotels, Restaurants & Leisure |
2.0% |
Leisure Products |
1.9% |
Industry Classification |
% of Net Assets |
Industrial Conglomerates |
1.9% |
Affiliated Mutual Fund - Short-Term Investment |
1.7% |
Financial Services |
1.6% |
Metals & Mining |
1.4% |
Insurance |
1.4% |
Ground Transportation |
1.1% |
Air Freight & Logistics |
1.1% |
Food Products |
0.8% |
Chemicals |
0.7% |
Personal Care Products |
0.6% |
Residential REITs |
0.6% |
Independent Power & Renewable Electricity Producers |
0.5% |
Others* |
0.4% |
100.0% | |
Liabilities in excess of other assets |
(0.0)%** |
100.0% |
* |
Consists of Industries that each make up less than 0.5% of the Fund's net assets |
** |
Less than 0.05% |
WHAT WERE THE FUND COSTS FOR THE LAST YEAR?
(Based on a hypothetical $10,000 investment)
Costs of a $10,000 investment |
Costs paid as a percentage of a $10,000 investment | |
PGIM Jennison Rising Dividend Fund—Class C |
$217 |
1.99% |
WHAT AFFECTED THE FUND’S PERFORMANCE DURING THE REPORTING PERIOD?
■ Over the past year, equities (represented by the S&P 500 Index) delivered solid results. Dividend-paying stocks also produced solid gains for the reporting period, though they underperformed the broader U.S. equity market. In a year that had bouts of macro uncertainty and market volatility, dividend strategies benefited as investors rotated into more stable, income-generating assets amid sticky inflation, changing expectations for U.S. Federal Reserve policy, geopolitical uncertainty tied to the Middle East, and intermittent weakness in technology leadership.
■
Security selection within industrials (driven by building products, machinery, and electrical equipment), financials (primarily capital markets), and
consumer discretionary (mainly specialty retail) were the top contributors to performance relative to the S&P 500 Index (the “Index”).
■
Stock selection within energy and communication services (led by interactive media & services), along with an underweight in information
technology and an overweight in utilities, detracted the most from performance relative to the Index.
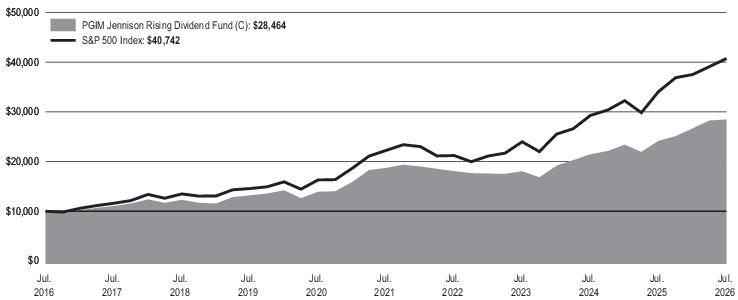
Average Annual Total Returns as of 7/31/2026 | |||
One Year (%) |
Five Years (%) |
Ten Years (%) | |
Class C with sales charges |
16.79% |
8.74% |
11.03% |
Class C without sales charges |
17.79% |
8.74% |
11.03% |
S&P 500 Index |
19.56% |
12.86% |
15.08% |
WHAT ARE SOME KEY FUND STATISTICS AS OF 7/31/2026?
Fund’s net assets |
$82,710,699 |
Number of fund holdings |
62 |
Total advisory fees paid for the year |
$493,895 |
Portfolio turnover rate for the year |
26% |
WHAT ARE SOME CHARACTERISTICS OF THE FUND’S HOLDINGS AS OF 7/31/2026?
Industry Classification |
% of Net Assets |
Oil, Gas & Consumable Fuels |
10.4% |
Semiconductors & Semiconductor Equipment |
9.8% |
Banks |
8.0% |
Electric Utilities |
5.6% |
Biotechnology |
4.3% |
Machinery |
4.3% |
Pharmaceuticals |
4.1% |
Communications Equipment |
4.0% |
Capital Markets |
3.8% |
Multi-Utilities |
3.4% |
Specialty Retail |
3.1% |
Electrical Equipment |
2.9% |
Technology Hardware, Storage & Peripherals |
2.8% |
Building Products |
2.8% |
Consumer Staples Distribution & Retail |
2.7% |
Diversified Telecommunication Services |
2.6% |
Aerospace & Defense |
2.6% |
IT Services |
2.6% |
Interactive Media & Services |
2.5% |
Hotels, Restaurants & Leisure |
2.0% |
Leisure Products |
1.9% |
Industry Classification |
% of Net Assets |
Industrial Conglomerates |
1.9% |
Affiliated Mutual Fund - Short-Term Investment |
1.7% |
Financial Services |
1.6% |
Metals & Mining |
1.4% |
Insurance |
1.4% |
Ground Transportation |
1.1% |
Air Freight & Logistics |
1.1% |
Food Products |
0.8% |
Chemicals |
0.7% |
Personal Care Products |
0.6% |
Residential REITs |
0.6% |
Independent Power & Renewable Electricity Producers |
0.5% |
Others* |
0.4% |
100.0% | |
Liabilities in excess of other assets |
(0.0)%** |
100.0% |
* |
Consists of Industries that each make up less than 0.5% of the Fund's net assets |
** |
Less than 0.05% |
WHAT WERE THE FUND COSTS FOR THE LAST YEAR?
(Based on a hypothetical $10,000 investment)
Costs of a $10,000 investment |
Costs paid as a percentage of a $10,000 investment | |
PGIM Jennison Rising Dividend Fund—Class Z |
$108 |
0.99% |
WHAT AFFECTED THE FUND’S PERFORMANCE DURING THE REPORTING PERIOD?
■ Over the past year, equities (represented by the S&P 500 Index) delivered solid results. Dividend-paying stocks also produced solid gains for the reporting period, though they underperformed the broader U.S. equity market. In a year that had bouts of macro uncertainty and market volatility, dividend strategies benefited as investors rotated into more stable, income-generating assets amid sticky inflation, changing expectations for U.S. Federal Reserve policy, geopolitical uncertainty tied to the Middle East, and intermittent weakness in technology leadership.
■
Security selection within industrials (driven by building products, machinery, and electrical equipment), financials (primarily capital markets), and
consumer discretionary (mainly specialty retail) were the top contributors to performance relative to the S&P 500 Index (the “Index”).
■
Stock selection within energy and communication services (led by interactive media & services), along with an underweight in information
technology and an overweight in utilities, detracted the most from performance relative to the Index.
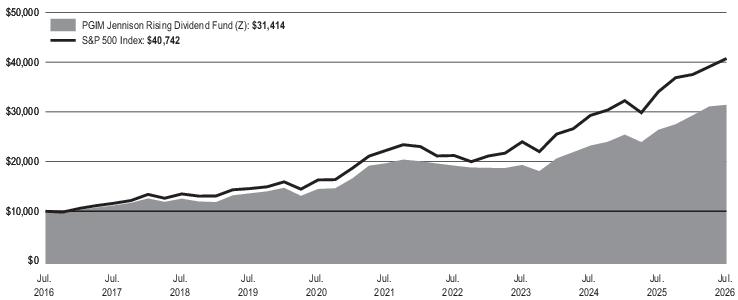
Average Annual Total Returns as of 7/31/2026 | |||
One Year (%) |
Five Years (%) |
Ten Years (%) | |
Class Z |
18.98% |
9.83% |
12.13% |
S&P 500 Index |
19.56% |
12.86% |
15.08% |
WHAT ARE SOME KEY FUND STATISTICS AS OF 7/31/2026?
Fund’s net assets |
$82,710,699 |
Number of fund holdings |
62 |
Total advisory fees paid for the year |
$493,895 |
Portfolio turnover rate for the year |
26% |
WHAT ARE SOME CHARACTERISTICS OF THE FUND’S HOLDINGS AS OF 7/31/2026?
Industry Classification |
% of Net Assets |
Oil, Gas & Consumable Fuels |
10.4% |
Semiconductors & Semiconductor Equipment |
9.8% |
Banks |
8.0% |
Electric Utilities |
5.6% |
Biotechnology |
4.3% |
Machinery |
4.3% |
Pharmaceuticals |
4.1% |
Communications Equipment |
4.0% |
Capital Markets |
3.8% |
Multi-Utilities |
3.4% |
Specialty Retail |
3.1% |
Electrical Equipment |
2.9% |
Technology Hardware, Storage & Peripherals |
2.8% |
Building Products |
2.8% |
Consumer Staples Distribution & Retail |
2.7% |
Diversified Telecommunication Services |
2.6% |
Aerospace & Defense |
2.6% |
IT Services |
2.6% |
Interactive Media & Services |
2.5% |
Hotels, Restaurants & Leisure |
2.0% |
Leisure Products |
1.9% |
Industry Classification |
% of Net Assets |
Industrial Conglomerates |
1.9% |
Affiliated Mutual Fund - Short-Term Investment |
1.7% |
Financial Services |
1.6% |
Metals & Mining |
1.4% |
Insurance |
1.4% |
Ground Transportation |
1.1% |
Air Freight & Logistics |
1.1% |
Food Products |
0.8% |
Chemicals |
0.7% |
Personal Care Products |
0.6% |
Residential REITs |
0.6% |
Independent Power & Renewable Electricity Producers |
0.5% |
Others* |
0.4% |
100.0% | |
Liabilities in excess of other assets |
(0.0)%** |
100.0% |
* |
Consists of Industries that each make up less than 0.5% of the Fund's net assets |
** |
Less than 0.05% |
WHAT WERE THE FUND COSTS FOR THE LAST YEAR?
(Based on a hypothetical $10,000 investment)
Costs of a $10,000 investment |
Costs paid as a percentage of a $10,000 investment | |
PGIM Jennison Rising Dividend Fund—Class R6 |
$108 |
0.99% |
WHAT AFFECTED THE FUND’S PERFORMANCE DURING THE REPORTING PERIOD?
■ Over the past year, equities (represented by the S&P 500 Index) delivered solid results. Dividend-paying stocks also produced solid gains for the reporting period, though they underperformed the broader U.S. equity market. In a year that had bouts of macro uncertainty and market volatility, dividend strategies benefited as investors rotated into more stable, income-generating assets amid sticky inflation, changing expectations for U.S. Federal Reserve policy, geopolitical uncertainty tied to the Middle East, and intermittent weakness in technology leadership.
■
Security selection within industrials (driven by building products, machinery, and electrical equipment), financials (primarily capital markets), and
consumer discretionary (mainly specialty retail) were the top contributors to performance relative to the S&P 500 Index (the “Index”).
■
Stock selection within energy and communication services (led by interactive media & services), along with an underweight in information
technology and an overweight in utilities, detracted the most from performance relative to the Index.
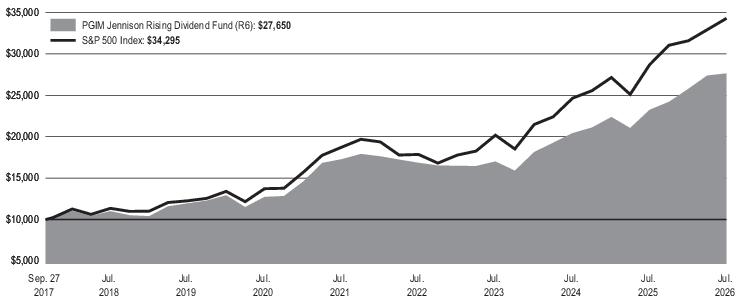
Average Annual Total Returns as of 7/31/2026 | |||
One Year (%) |
Five Years (%) |
Since Inception (%) | |
Class R6 |
18.93% |
9.85% |
12.19% (9/27/2017) |
S&P 500 Index |
19.56% |
12.86% |
14.97% |
WHAT ARE SOME KEY FUND STATISTICS AS OF 7/31/2026?
Fund’s net assets |
$82,710,699 |
Number of fund holdings |
62 |
Total advisory fees paid for the year |
$493,895 |
Portfolio turnover rate for the year |
26% |
WHAT ARE SOME CHARACTERISTICS OF THE FUND’S HOLDINGS AS OF 7/31/2026?
Industry Classification |
% of Net Assets |
Oil, Gas & Consumable Fuels |
10.4% |
Semiconductors & Semiconductor Equipment |
9.8% |
Banks |
8.0% |
Electric Utilities |
5.6% |
Biotechnology |
4.3% |
Machinery |
4.3% |
Pharmaceuticals |
4.1% |
Communications Equipment |
4.0% |
Capital Markets |
3.8% |
Multi-Utilities |
3.4% |
Specialty Retail |
3.1% |
Electrical Equipment |
2.9% |
Technology Hardware, Storage & Peripherals |
2.8% |
Building Products |
2.8% |
Consumer Staples Distribution & Retail |
2.7% |
Diversified Telecommunication Services |
2.6% |
Aerospace & Defense |
2.6% |
IT Services |
2.6% |
Interactive Media & Services |
2.5% |
Hotels, Restaurants & Leisure |
2.0% |
Leisure Products |
1.9% |
Industry Classification |
% of Net Assets |
Industrial Conglomerates |
1.9% |
Affiliated Mutual Fund - Short-Term Investment |
1.7% |
Financial Services |
1.6% |
Metals & Mining |
1.4% |
Insurance |
1.4% |
Ground Transportation |
1.1% |
Air Freight & Logistics |
1.1% |
Food Products |
0.8% |
Chemicals |
0.7% |
Personal Care Products |
0.6% |
Residential REITs |
0.6% |
Independent Power & Renewable Electricity Producers |
0.5% |
Others* |
0.4% |
100.0% | |
Liabilities in excess of other assets |
(0.0)%** |
100.0% |
* |
Consists of Industries that each make up less than 0.5% of the Fund's net assets |
** |
Less than 0.05% |
WHAT WERE THE FUND COSTS FOR THE LAST YEAR?
(Based on a hypothetical $10,000 investment)
Costs of a $10,000 investment |
Costs paid as a percentage of a $10,000 investment | |
PGIM Target Date Income Fund—Class R1 |
$71 |
0.68% |
WHAT AFFECTED THE FUND’S PERFORMANCE DURING THE REPORTING PERIOD?
■ Despite some volatility across global markets in 2026, the past 12 months were influenced by evolving monetary policy expectations, persistent inflation concerns, and heightened geopolitical uncertainty. U.S. equities generally benefited from resilient corporate earnings and economic growth, while fixed income markets experienced periodic volatility as the interest rate outlook continued to be reassessed.
■
Given the Fund is comprised of equities, fixed income, and non-traditional assets, performance saw a number of contributors to performance.
Across the asset classes included, the greatest level of performance was provided by commodities, non-U.S. developed markets equity, and
U.S. mid-cap equity, with returns of 35.5%, 24.3%, and 20.9%, respectively.
■
Given the Fund is comprised of equities, fixed income, and non-traditional assets, performance saw a number of detractors from performance.
Across the asset classes included, the lowest level of performance was provided by U.S. Treasury Inflation-Protected Securities,
U.S. aggregate bonds, and cash, with returns of 2.6%, 2.7%, and 4.0%, respectively.
■
The PGIM Target Date Funds do not use derivatives, although derivatives are used in some of the underlying funds.
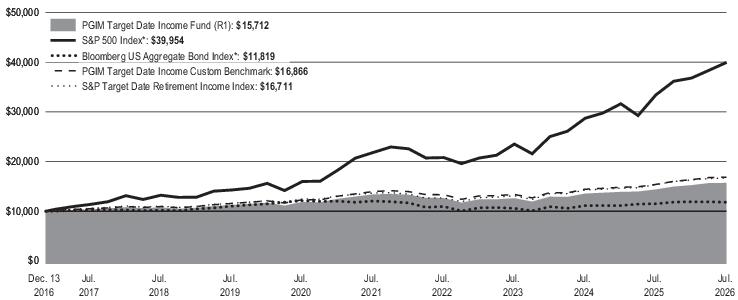
Average Annual Total Returns as of 7/31/2026 | |||
One Year (%) |
Five Years (%) |
Since Inception (%) | |
Class R1 |
9.14% |
3.25% |
4.80% (12/13/2016) |
S&P 500 Index* |
19.56% |
12.86% |
15.41% |
Bloomberg US Aggregate Bond Index* |
2.71% |
-0.40% |
1.74% |
PGIM Target Date Income Custom Benchmark |
9.48% |
3.84% |
5.56% |
S&P Target Date Retirement Income Index |
8.89% |
4.10% |
5.46% |
*The Fund compares its performance against this broad-based index in response to regulatory requirements.
WHAT ARE SOME KEY FUND STATISTICS AS OF 7/31/2026?
Fund’s net assets |
$24,049,735 |
Number of fund holdings |
9 |
Total advisory fees paid for the year |
$0 |
Portfolio turnover rate for the year |
67% |
WHAT ARE SOME CHARACTERISTICS OF THE FUND’S HOLDINGS AS OF 7/31/2026?
Investment Allocation |
% of Net Assets |
Affiliated Mutual Funds - Fixed Income |
40.5% |
Affiliated Exchange-Traded Funds - Fixed Income |
23.3% |
Affiliated Mutual Funds - Domestic Equity |
17.6% |
Affiliated Mutual Funds - International Equity |
12.4% |
Affiliated Mutual Fund - Short-Term Investment |
6.3% |
100.1% | |
Liabilities in excess of other assets |
(0.1)% |
100.0% |
WHAT WERE THE FUND COSTS FOR THE LAST YEAR?
(Based on a hypothetical $10,000 investment)
Costs of a $10,000 investment |
Costs paid as a percentage of a $10,000 investment | |
PGIM Target Date Income Fund—Class R2 |
$45 |
0.43% |
WHAT AFFECTED THE FUND’S PERFORMANCE DURING THE REPORTING PERIOD?
■ Despite some volatility across global markets in 2026, the past 12 months were influenced by evolving monetary policy expectations, persistent inflation concerns, and heightened geopolitical uncertainty. U.S. equities generally benefited from resilient corporate earnings and economic growth, while fixed income markets experienced periodic volatility as the interest rate outlook continued to be reassessed.
■
Given the Fund is comprised of equities, fixed income, and non-traditional assets, performance saw a number of contributors to performance.
Across the asset classes included, the greatest level of performance was provided by commodities, non-U.S. developed markets equity, and
U.S. mid-cap equity, with returns of 35.5%, 24.3%, and 20.9%, respectively.
■
Given the Fund is comprised of equities, fixed income, and non-traditional assets, performance saw a number of detractors from performance.
Across the asset classes included, the lowest level of performance was provided by U.S. Treasury Inflation-Protected Securities,
U.S. aggregate bonds, and cash, with returns of 2.6%, 2.7%, and 4.0%, respectively.
■
The PGIM Target Date Funds do not use derivatives, although derivatives are used in some of the underlying funds.
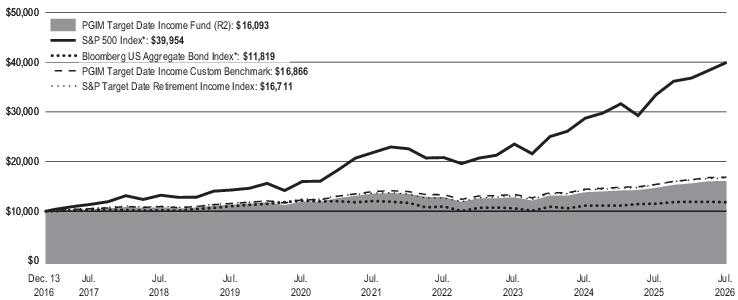
Average Annual Total Returns as of 7/31/2026 | |||
One Year (%) |
Five Years (%) |
Since Inception (%) | |
Class R2 |
9.41% |
3.51% |
5.06% (12/13/2016) |
S&P 500 Index* |
19.56% |
12.86% |
15.41% |
Bloomberg US Aggregate Bond Index* |
2.71% |
-0.40% |
1.74% |
PGIM Target Date Income Custom Benchmark |
9.48% |
3.84% |
5.56% |
S&P Target Date Retirement Income Index |
8.89% |
4.10% |
5.46% |
*The Fund compares its performance against this broad-based index in response to regulatory requirements.
WHAT ARE SOME KEY FUND STATISTICS AS OF 7/31/2026?
Fund’s net assets |
$24,049,735 |
Number of fund holdings |
9 |
Total advisory fees paid for the year |
$0 |
Portfolio turnover rate for the year |
67% |
WHAT ARE SOME CHARACTERISTICS OF THE FUND’S HOLDINGS AS OF 7/31/2026?
Investment Allocation |
% of Net Assets |
Affiliated Mutual Funds - Fixed Income |
40.5% |
Affiliated Exchange-Traded Funds - Fixed Income |
23.3% |
Affiliated Mutual Funds - Domestic Equity |
17.6% |
Affiliated Mutual Funds - International Equity |
12.4% |
Affiliated Mutual Fund - Short-Term Investment |
6.3% |
100.1% | |
Liabilities in excess of other assets |
(0.1)% |
100.0% |
WHAT WERE THE FUND COSTS FOR THE LAST YEAR?
(Based on a hypothetical $10,000 investment)
Costs of a $10,000 investment |
Costs paid as a percentage of a $10,000 investment | |
PGIM Target Date Income Fund—Class R3 |
$29 |
0.28% |
WHAT AFFECTED THE FUND’S PERFORMANCE DURING THE REPORTING PERIOD?
■ Despite some volatility across global markets in 2026, the past 12 months were influenced by evolving monetary policy expectations, persistent inflation concerns, and heightened geopolitical uncertainty. U.S. equities generally benefited from resilient corporate earnings and economic growth, while fixed income markets experienced periodic volatility as the interest rate outlook continued to be reassessed.
■
Given the Fund is comprised of equities, fixed income, and non-traditional assets, performance saw a number of contributors to performance.
Across the asset classes included, the greatest level of performance was provided by commodities, non-U.S. developed markets equity, and
U.S. mid-cap equity, with returns of 35.5%, 24.3%, and 20.9%, respectively.
■
Given the Fund is comprised of equities, fixed income, and non-traditional assets, performance saw a number of detractors from performance.
Across the asset classes included, the lowest level of performance was provided by U.S. Treasury Inflation-Protected Securities,
U.S. aggregate bonds, and cash, with returns of 2.6%, 2.7%, and 4.0%, respectively.
■
The PGIM Target Date Funds do not use derivatives, although derivatives are used in some of the underlying funds.
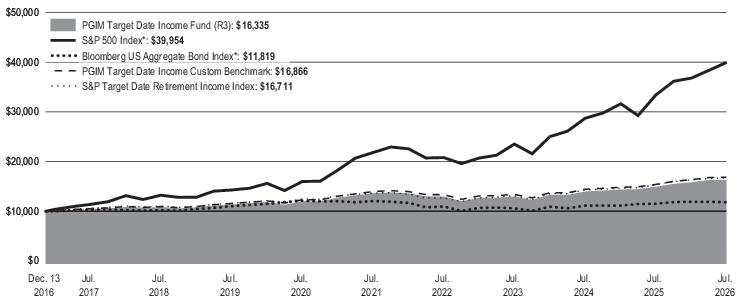
Average Annual Total Returns as of 7/31/2026 | |||
One Year (%) |
Five Years (%) |
Since Inception (%) | |
Class R3 |
9.57% |
3.67% |
5.23% (12/13/2016) |
S&P 500 Index* |
19.56% |
12.86% |
15.41% |
Bloomberg US Aggregate Bond Index* |
2.71% |
-0.40% |
1.74% |
PGIM Target Date Income Custom Benchmark |
9.48% |
3.84% |
5.56% |
S&P Target Date Retirement Income Index |
8.89% |
4.10% |
5.46% |
*The Fund compares its performance against this broad-based index in response to regulatory requirements.
WHAT ARE SOME KEY FUND STATISTICS AS OF 7/31/2026?
Fund’s net assets |
$24,049,735 |
Number of fund holdings |
9 |
Total advisory fees paid for the year |
$0 |
Portfolio turnover rate for the year |
67% |
WHAT ARE SOME CHARACTERISTICS OF THE FUND’S HOLDINGS AS OF 7/31/2026?
Investment Allocation |
% of Net Assets |
Affiliated Mutual Funds - Fixed Income |
40.5% |
Affiliated Exchange-Traded Funds - Fixed Income |
23.3% |
Affiliated Mutual Funds - Domestic Equity |
17.6% |
Affiliated Mutual Funds - International Equity |
12.4% |
Affiliated Mutual Fund - Short-Term Investment |
6.3% |
100.1% | |
Liabilities in excess of other assets |
(0.1)% |
100.0% |
WHAT WERE THE FUND COSTS FOR THE LAST YEAR?
(Based on a hypothetical $10,000 investment)
Costs of a $10,000 investment |
Costs paid as a percentage of a $10,000 investment | |
PGIM Target Date Income Fund—Class R4 |
$19 |
0.18% |
WHAT AFFECTED THE FUND’S PERFORMANCE DURING THE REPORTING PERIOD?
■ Despite some volatility across global markets in 2026, the past 12 months were influenced by evolving monetary policy expectations, persistent inflation concerns, and heightened geopolitical uncertainty. U.S. equities generally benefited from resilient corporate earnings and economic growth, while fixed income markets experienced periodic volatility as the interest rate outlook continued to be reassessed.
■
Given the Fund is comprised of equities, fixed income, and non-traditional assets, performance saw a number of contributors to performance.
Across the asset classes included, the greatest level of performance was provided by commodities, non-U.S. developed markets equity, and
U.S. mid-cap equity, with returns of 35.5%, 24.3%, and 20.9%, respectively.
■
Given the Fund is comprised of equities, fixed income, and non-traditional assets, performance saw a number of detractors from performance.
Across the asset classes included, the lowest level of performance was provided by U.S. Treasury Inflation-Protected Securities,
U.S. aggregate bonds, and cash, with returns of 2.6%, 2.7%, and 4.0%, respectively.
■
The PGIM Target Date Funds do not use derivatives, although derivatives are used in some of the underlying funds.
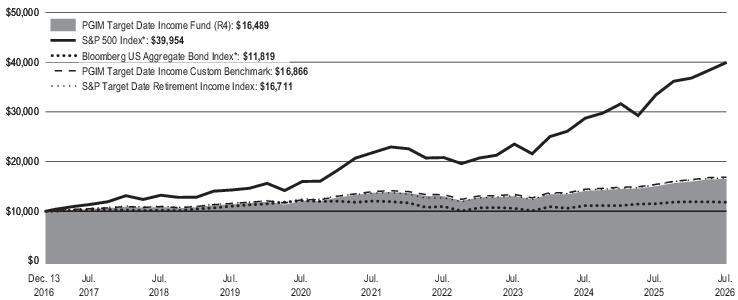
Average Annual Total Returns as of 7/31/2026 | |||
One Year (%) |
Five Years (%) |
Since Inception (%) | |
Class R4 |
9.68% |
3.76% |
5.33% (12/13/2016) |
S&P 500 Index* |
19.56% |
12.86% |
15.41% |
Bloomberg US Aggregate Bond Index* |
2.71% |
-0.40% |
1.74% |
PGIM Target Date Income Custom Benchmark |
9.48% |
3.84% |
5.56% |
S&P Target Date Retirement Income Index |
8.89% |
4.10% |
5.46% |
*The Fund compares its performance against this broad-based index in response to regulatory requirements.
WHAT ARE SOME KEY FUND STATISTICS AS OF 7/31/2026?
Fund’s net assets |
$24,049,735 |
Number of fund holdings |
9 |
Total advisory fees paid for the year |
$0 |
Portfolio turnover rate for the year |
67% |
WHAT ARE SOME CHARACTERISTICS OF THE FUND’S HOLDINGS AS OF 7/31/2026?
Investment Allocation |
% of Net Assets |
Affiliated Mutual Funds - Fixed Income |
40.5% |
Affiliated Exchange-Traded Funds - Fixed Income |
23.3% |
Affiliated Mutual Funds - Domestic Equity |
17.6% |
Affiliated Mutual Funds - International Equity |
12.4% |
Affiliated Mutual Fund - Short-Term Investment |
6.3% |
100.1% | |
Liabilities in excess of other assets |
(0.1)% |
100.0% |
WHAT WERE THE FUND COSTS FOR THE LAST YEAR?
(Based on a hypothetical $10,000 investment)
Costs of a $10,000 investment |
Costs paid as a percentage of a $10,000 investment | |
PGIM Target Date Income Fund—Class R5 |
$9 |
0.09% |
WHAT AFFECTED THE FUND’S PERFORMANCE DURING THE REPORTING PERIOD?
■ Despite some volatility across global markets in 2026, the past 12 months were influenced by evolving monetary policy expectations, persistent inflation concerns, and heightened geopolitical uncertainty. U.S. equities generally benefited from resilient corporate earnings and economic growth, while fixed income markets experienced periodic volatility as the interest rate outlook continued to be reassessed.
■
Given the Fund is comprised of equities, fixed income, and non-traditional assets, performance saw a number of contributors to performance.
Across the asset classes included, the greatest level of performance was provided by commodities, non-U.S. developed markets equity, and
U.S. mid-cap equity, with returns of 35.5%, 24.3%, and 20.9%, respectively.
■
Given the Fund is comprised of equities, fixed income, and non-traditional assets, performance saw a number of detractors from performance.
Across the asset classes included, the lowest level of performance was provided by U.S. Treasury Inflation-Protected Securities,
U.S. aggregate bonds, and cash, with returns of 2.6%, 2.7%, and 4.0%, respectively.
■
The PGIM Target Date Funds do not use derivatives, although derivatives are used in some of the underlying funds.
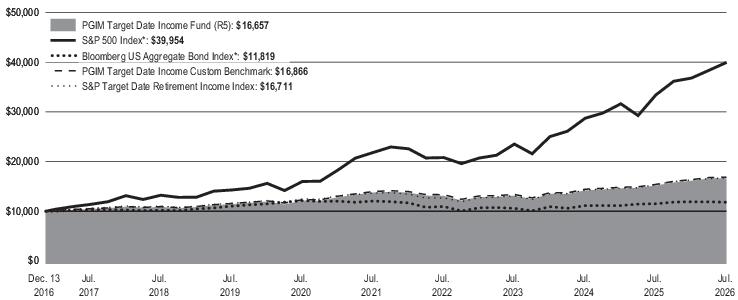
Average Annual Total Returns as of 7/31/2026 | |||
One Year (%) |
Five Years (%) |
Since Inception (%) | |
Class R5 |
9.78% |
3.87% |
5.44% (12/13/2016) |
S&P 500 Index* |
19.56% |
12.86% |
15.41% |
Bloomberg US Aggregate Bond Index* |
2.71% |
-0.40% |
1.74% |
PGIM Target Date Income Custom Benchmark |
9.48% |
3.84% |
5.56% |
S&P Target Date Retirement Income Index |
8.89% |
4.10% |
5.46% |
*The Fund compares its performance against this broad-based index in response to regulatory requirements.
WHAT ARE SOME KEY FUND STATISTICS AS OF 7/31/2026?
Fund’s net assets |
$24,049,735 |
Number of fund holdings |
9 |
Total advisory fees paid for the year |
$0 |
Portfolio turnover rate for the year |
67% |
WHAT ARE SOME CHARACTERISTICS OF THE FUND’S HOLDINGS AS OF 7/31/2026?
Investment Allocation |
% of Net Assets |
Affiliated Mutual Funds - Fixed Income |
40.5% |
Affiliated Exchange-Traded Funds - Fixed Income |
23.3% |
Affiliated Mutual Funds - Domestic Equity |
17.6% |
Affiliated Mutual Funds - International Equity |
12.4% |
Affiliated Mutual Fund - Short-Term Investment |
6.3% |
100.1% | |
Liabilities in excess of other assets |
(0.1)% |
100.0% |
WHAT WERE THE FUND COSTS FOR THE LAST YEAR?
(Based on a hypothetical $10,000 investment)
Costs of a $10,000 investment |
Costs paid as a percentage of a $10,000 investment | |
PGIM Target Date Income Fund—Class R6 |
$0 |
0.00% |
WHAT AFFECTED THE FUND’S PERFORMANCE DURING THE REPORTING PERIOD?
■ Despite some volatility across global markets in 2026, the past 12 months were influenced by evolving monetary policy expectations, persistent inflation concerns, and heightened geopolitical uncertainty. U.S. equities generally benefited from resilient corporate earnings and economic growth, while fixed income markets experienced periodic volatility as the interest rate outlook continued to be reassessed.
■
Given the Fund is comprised of equities, fixed income, and non-traditional assets, performance saw a number of contributors to performance.
Across the asset classes included, the greatest level of performance was provided by commodities, non-U.S. developed markets equity, and
U.S. mid-cap equity, with returns of 35.5%, 24.3%, and 20.9%, respectively.
■
Given the Fund is comprised of equities, fixed income, and non-traditional assets, performance saw a number of detractors from performance.
Across the asset classes included, the lowest level of performance was provided by U.S. Treasury Inflation-Protected Securities,
U.S. aggregate bonds, and cash, with returns of 2.6%, 2.7%, and 4.0%, respectively.
■
The PGIM Target Date Funds do not use derivatives, although derivatives are used in some of the underlying funds.
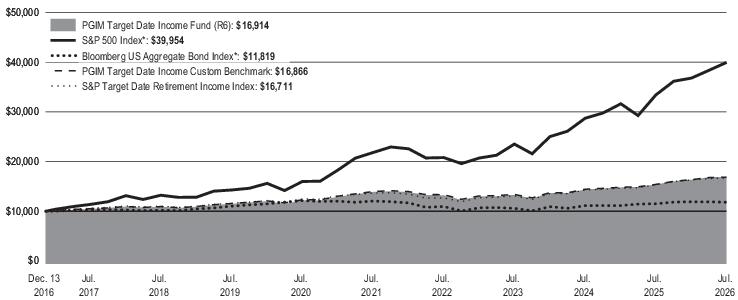
Average Annual Total Returns as of 7/31/2026 | |||
One Year (%) |
Five Years (%) |
Since Inception (%) | |
Class R6 |
10.04% |
4.02% |
5.61% (12/13/2016) |
S&P 500 Index* |
19.56% |
12.86% |
15.41% |
Bloomberg US Aggregate Bond Index* |
2.71% |
-0.40% |
1.74% |
PGIM Target Date Income Custom Benchmark |
9.48% |
3.84% |
5.56% |
S&P Target Date Retirement Income Index |
8.89% |
4.10% |
5.46% |
*The Fund compares its performance against this broad-based index in response to regulatory requirements.
WHAT ARE SOME KEY FUND STATISTICS AS OF 7/31/2026?
Fund’s net assets |
$24,049,735 |
Number of fund holdings |
9 |
Total advisory fees paid for the year |
$0 |
Portfolio turnover rate for the year |
67% |
WHAT ARE SOME CHARACTERISTICS OF THE FUND’S HOLDINGS AS OF 7/31/2026?
Investment Allocation |
% of Net Assets |
Affiliated Mutual Funds - Fixed Income |
40.5% |
Affiliated Exchange-Traded Funds - Fixed Income |
23.3% |
Affiliated Mutual Funds - Domestic Equity |
17.6% |
Affiliated Mutual Funds - International Equity |
12.4% |
Affiliated Mutual Fund - Short-Term Investment |
6.3% |
100.1% | |
Liabilities in excess of other assets |
(0.1)% |
100.0% |
WHAT WERE THE FUND COSTS FOR THE LAST YEAR?
(Based on a hypothetical $10,000 investment)
Costs of a $10,000 investment |
Costs paid as a percentage of a $10,000 investment | |
PGIM Target Date 2020 Fund—Class R1 |
$71 |
0.68% |
WHAT AFFECTED THE FUND’S PERFORMANCE DURING THE REPORTING PERIOD?
■ Despite some volatility across global markets in 2026, the past 12 months were influenced by evolving monetary policy expectations, persistent inflation concerns, and heightened geopolitical uncertainty. U.S. equities generally benefited from resilient corporate earnings and economic growth, while fixed income markets experienced periodic volatility as the interest rate outlook continued to be reassessed.
■ Given the Fund is comprised of equities, fixed income, and non-traditional assets, performance saw a number of contributors to performance. Across the asset classes included, the greatest level of performance was provided by commodities, non-U.S. developed markets equity, and U.S. mid-cap equity, with returns of 35.5%, 24.3%, and 20.9%, respectively.
■ Given the Fund is comprised of equities, fixed income, and non-traditional assets, performance saw a number of detractors from performance. Across the asset classes included, the lowest level of performance was provided by U.S. Treasury Inflation-Protected Securities, U.S. aggregate bonds, and cash, with returns of 2.6%, 2.7%, and 4.0%, respectively.
■ The PGIM Target Date Funds do not use derivatives, although derivatives are used in some of the underlying funds.
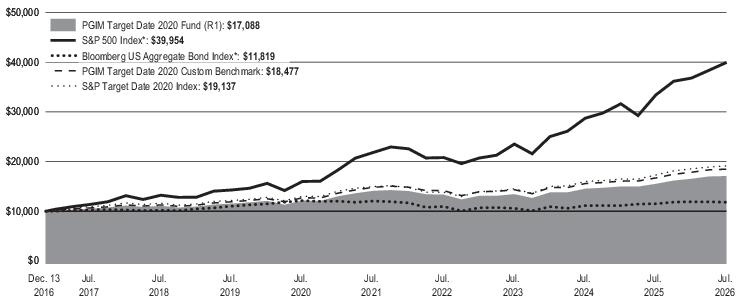
Average Annual Total Returns as of 7/31/2026 | |||
One Year (%) |
Five Years (%) |
Since Inception (%) | |
Class R1 |
10.17% |
3.93% |
5.72% (12/13/2016) |
S&P 500 Index* |
19.56% |
12.86% |
15.41% |
Bloomberg US Aggregate Bond Index* |
2.71% |
-0.40% |
1.74% |
PGIM Target Date 2020 Custom Benchmark |
10.57% |
4.52% |
6.56% |
S&P Target Date 2020 Index |
10.60% |
5.04% |
6.94% |
*The Fund
compares
its performance against this broad-based index in response to regulatory requirements.WHAT ARE SOME KEY FUND STATISTICS AS OF 7/31/2026?
Fund’s net assets |
$ 29,126,838 |
Number of fund holdings |
9 |
Total advisory fees paid for the year |
$ 0 |
Portfolio turnover rate for the year |
58% |
WHAT ARE SOME CHARACTERISTICS OF THE FUND’S HOLDINGS AS OF 7/31/2026?
Investment Allocation |
% of Net Assets |
Affiliated Mutual Funds - Fixed Income |
36.2% |
Affiliated Exchange-Traded Funds - Fixed Income |
23.1% |
Affiliated Mutual Funds - Domestic Equity |
21.5% |
Affiliated Mutual Funds - International Equity |
14.0% |
Affiliated Mutual Fund - Short-Term Investment |
5.2% |
100.0% | |
Liabilities in excess of other assets |
(0.0)%* |
100.0% |
* |
Less than 0.05% |
WHAT WERE THE FUND COSTS FOR THE LAST YEAR?
(Based on a hypothetical $10,000 investment)
Costs of a $10,000 investment |
Costs paid as a percentage of a $10,000 investment | |
PGIM Target Date 2020 Fund—Class R2 |
$45 |
0.43% |
WHAT AFFECTED THE FUND’S PERFORMANCE DURING THE REPORTING PERIOD?
■ Despite some volatility across global markets in 2026, the past 12 months were influenced by evolving monetary policy expectations, persistent inflation concerns, and heightened geopolitical uncertainty. U.S. equities generally benefited from resilient corporate earnings and economic growth, while fixed income markets experienced periodic volatility as the interest rate outlook continued to be reassessed.
■ Given the Fund is comprised of equities, fixed income, and non-traditional assets, performance saw a number of contributors to performance. Across the asset classes included, the greatest level of performance was provided by commodities, non-U.S. developed markets equity, and U.S. mid-cap equity, with returns of 35.5%, 24.3%, and 20.9%, respectively.
■ Given the Fund is comprised of equities, fixed income, and non-traditional assets, performance saw a number of detractors from performance. Across the asset classes included, the lowest level of performance was provided by U.S. Treasury Inflation-Protected Securities, U.S. aggregate bonds, and cash, with returns of 2.6%, 2.7%, and 4.0%, respectively.
■ The PGIM Target Date Funds do not use derivatives, although derivatives are used in some of the underlying funds.
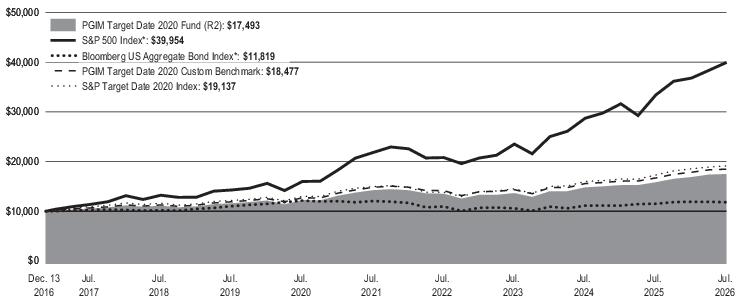
Average Annual Total Returns as of 7/31/2026 | |||
One Year (%) |
Five Years (%) |
Since Inception (%) | |
Class R2 |
10.43% |
4.20% |
5.98% (12/13/2016) |
S&P 500 Index* |
19.56% |
12.86% |
15.41% |
Bloomberg US Aggregate Bond Index* |
2.71% |
-0.40% |
1.74% |
PGIM Target Date 2020 Custom Benchmark |
10.57% |
4.52% |
6.56% |
S&P Target Date 2020 Index |
10.60% |
5.04% |
6.94% |
*The Fund
compares
its performance against this broad-based index in response to regulatory requirements.WHAT ARE SOME KEY FUND STATISTICS AS OF 7/31/2026?
Fund’s net assets |
$ 29,126,838 |
Number of fund holdings |
9 |
Total advisory fees paid for the year |
$ 0 |
Portfolio turnover rate for the year |
58% |
WHAT ARE SOME CHARACTERISTICS OF THE FUND’S HOLDINGS AS OF 7/31/2026?
Investment Allocation |
% of Net Assets |
Affiliated Mutual Funds - Fixed Income |
36.2% |
Affiliated Exchange-Traded Funds - Fixed Income |
23.1% |
Affiliated Mutual Funds - Domestic Equity |
21.5% |
Affiliated Mutual Funds - International Equity |
14.0% |
Affiliated Mutual Fund - Short-Term Investment |
5.2% |
100.0% | |
Liabilities in excess of other assets |
(0.0)%* |
100.0% |
* |
Less than 0.05% |
WHAT WERE THE FUND COSTS FOR THE LAST YEAR?
(Based on a hypothetical $10,000 investment)
Costs of a $10,000 investment |
Costs paid as a percentage of a $10,000 investment | |
PGIM Target Date 2020 Fund—Class R3 |
$29 |
0.28% |
WHAT AFFECTED THE FUND’S PERFORMANCE DURING THE REPORTING PERIOD?
■ Despite some volatility across global markets in 2026, the past 12 months were influenced by evolving monetary policy expectations, persistent inflation concerns, and heightened geopolitical uncertainty. U.S. equities generally benefited from resilient corporate earnings and economic growth, while fixed income markets experienced periodic volatility as the interest rate outlook continued to be reassessed.
■ Given the Fund is comprised of equities, fixed income, and non-traditional assets, performance saw a number of contributors to performance. Across the asset classes included, the greatest level of performance was provided by commodities, non-U.S. developed markets equity, and U.S. mid-cap equity, with returns of 35.5%, 24.3%, and 20.9%, respectively.
■ Given the Fund is comprised of equities, fixed income, and non-traditional assets, performance saw a number of detractors from performance. Across the asset classes included, the lowest level of performance was provided by U.S. Treasury Inflation-Protected Securities, U.S. aggregate bonds, and cash, with returns of 2.6%, 2.7%, and 4.0%, respectively.
■ The PGIM Target Date Funds do not use derivatives, although derivatives are used in some of the underlying funds.
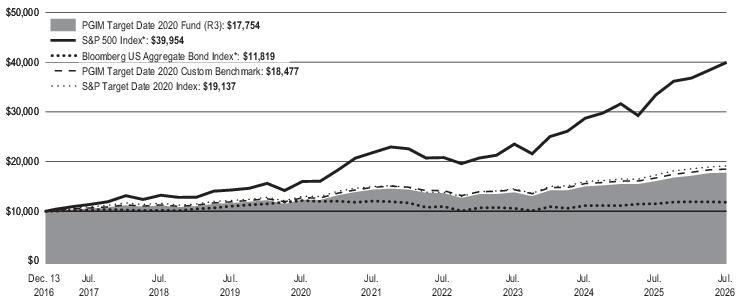
Average Annual Total Returns as of 7/31/2026 | |||
One Year (%) |
Five Years (%) |
Since Inception (%) | |
Class R3 |
10.57% |
4.34% |
6.14% (12/13/2016) |
S&P 500 Index* |
19.56% |
12.86% |
15.41% |
Bloomberg US Aggregate Bond Index* |
2.71% |
-0.40% |
1.74% |
PGIM Target Date 2020 Custom Benchmark |
10.57% |
4.52% |
6.56% |
S&P Target Date 2020 Index |
10.60% |
5.04% |
6.94% |
*The Fund compares its performance against this broad-based index in response to regulatory requirements.
WHAT ARE SOME KEY FUND STATISTICS AS OF 7/31/2026?
Fund’s net assets |
$ 29,126,838 |
Number of fund holdings |
9 |
Total advisory fees paid for the year |
$ 0 |
Portfolio turnover rate for the year |
58% |
WHAT ARE SOME CHARACTERISTICS OF THE FUND’S HOLDINGS AS OF 7/31/2026?
Investment Allocation |
% of Net Assets |
Affiliated Mutual Funds - Fixed Income |
36.2% |
Affiliated Exchange-Traded Funds - Fixed Income |
23.1% |
Affiliated Mutual Funds - Domestic Equity |
21.5% |
Affiliated Mutual Funds - International Equity |
14.0% |
Affiliated Mutual Fund - Short-Term Investment |
5.2% |
100.0% | |
Liabilities in excess of other assets |
(0.0)%* |
100.0% |
* |
Less than 0.05% |
WHAT WERE THE FUND COSTS FOR THE LAST YEAR?
(Based on a hypothetical $10,000 investment)
Costs of a $10,000 investment |
Costs paid as a percentage of a $10,000 investment | |
PGIM Target Date 2020 Fund—Class R4 |
$19 |
0.18% |
WHAT AFFECTED THE FUND’S PERFORMANCE DURING THE REPORTING PERIOD?
■ Despite some volatility across global markets in 2026, the past 12 months were influenced by evolving monetary policy expectations, persistent inflation concerns, and heightened geopolitical uncertainty. U.S. equities generally benefited from resilient corporate earnings and economic growth, while fixed income markets experienced periodic volatility as the interest rate outlook continued to be reassessed.
■ Given the Fund is comprised of equities, fixed income, and non-traditional assets, performance saw a number of contributors to performance. Across the asset classes included, the greatest level of performance was provided by commodities, non-U.S. developed markets equity, and U.S. mid-cap equity, with returns of 35.5%, 24.3%, and 20.9%, respectively.
■ Given the Fund is comprised of equities, fixed income, and non-traditional assets, performance saw a number of detractors from performance. Across the asset classes included, the lowest level of performance was provided by U.S. Treasury Inflation-Protected Securities, U.S. aggregate bonds, and cash, with returns of 2.6%, 2.7%, and 4.0%, respectively.
■ The PGIM Target Date Funds do not use derivatives, although derivatives are used in some of the underlying funds.
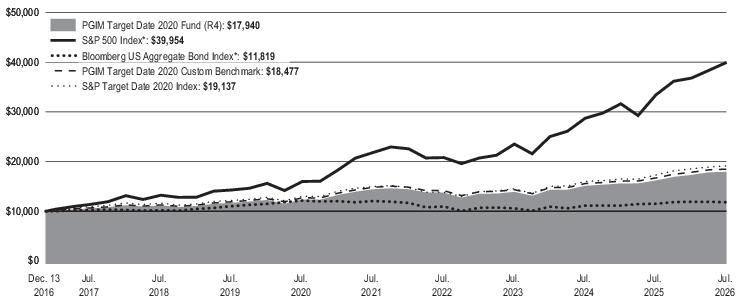
Average Annual Total Returns as of 7/31/2026 | |||
One Year (%) |
Five Years (%) |
Since Inception (%) | |
Class R4 |
10.76% |
4.46% |
6.25% (12/13/2016) |
S&P 500 Index* |
19.56% |
12.86% |
15.41% |
Bloomberg US Aggregate Bond Index* |
2.71% |
-0.40% |
1.74% |
PGIM Target Date 2020 Custom Benchmark |
10.57% |
4.52% |
6.56% |
S&P Target Date 2020 Index |
10.60% |
5.04% |
6.94% |
*The Fund compares its performance against this broad-based index in response
to
regulatory requirements.WHAT ARE SOME KEY FUND STATISTICS AS OF 7/31/2026?
Fund’s net assets |
$ 29,126,838 |
Number of fund holdings |
9 |
Total advisory fees paid for the year |
$ 0 |
Portfolio turnover rate for the year |
58% |
WHAT ARE SOME CHARACTERISTICS OF THE FUND’S HOLDINGS AS OF 7/31/2026?
Investment Allocation |
% of Net Assets |
Affiliated Mutual Funds - Fixed Income |
36.2% |
Affiliated Exchange-Traded Funds - Fixed Income |
23.1% |
Affiliated Mutual Funds - Domestic Equity |
21.5% |
Affiliated Mutual Funds - International Equity |
14.0% |
Affiliated Mutual Fund - Short-Term Investment |
5.2% |
100.0% | |
Liabilities in excess of other assets |
(0.0)%* |
100.0% |
* |
Less than 0.05% |
WHAT WERE THE FUND COSTS FOR THE LAST YEAR?
(Based on a hypothetical $10,000 investment)
Costs of a $10,000 investment |
Costs paid as a percentage of a $10,000 investment | |
PGIM Target Date 2020 Fund—Class R5 |
$9 |
0.09% |
WHAT AFFECTED THE FUND’S PERFORMANCE DURING THE REPORTING PERIOD?
■
Despite some volatility across global markets in 2026, the past 12 months were influenced by evolving monetary policy expectations, persistent
inflation concerns, and heightened geopolitical uncertainty. U.S. equities generally benefited from resilient corporate earnings and economic
growth, while fixed income markets experienced periodic volatility as the interest rate outlook continued to be reassessed.
■
Given the Fund is comprised of equities, fixed income, and non-traditional assets, performance saw a number of contributors to performance.
Across the asset classes included, the greatest level of performance was provided by commodities, non-U.S. developed markets equity, and
U.S. mid-cap equity, with returns of 35.5%, 24.3%, and 20.9%, respectively.
■
Given the Fund is comprised of equities, fixed income, and non-traditional assets, performance saw a number of detractors from performance.
Across the asset classes included, the lowest level of performance was provided by U.S. Treasury Inflation-Protected Securities,
U.S. aggregate bonds, and cash, with returns of 2.6%, 2.7%, and 4.0%, respectively.
■
The PGIM Target Date Funds do not use derivatives, although derivatives are used in some of the underlying funds.
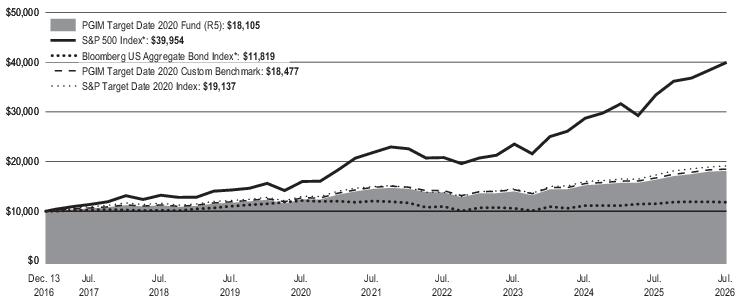
Average Annual Total Returns as of 7/31/2026 | |||
One Year (%) |
Five Years (%) |
Since Inception (%) | |
Class R5 |
10.77% |
4.55% |
6.36% (12/13/2016) |
S&P 500 Index* |
19.56% |
12.86% |
15.41% |
Bloomberg US Aggregate Bond Index* |
2.71% |
-0.40% |
1.74% |
PGIM Target Date 2020 Custom Benchmark |
10.57% |
4.52% |
6.56% |
S&P Target Date 2020 Index |
10.60% |
5.04% |
6.94% |
*The Fund
compares
its performance against this broad-based index in response to regulatory requirements.WHAT ARE SOME KEY FUND STATISTICS AS OF 7/31/2026?
Fund’s net assets |
$ 29,126,838 |
Number of fund holdings |
9 |
Total advisory fees paid for the year |
$ 0 |
Portfolio turnover rate for the year |
58% |
WHAT ARE SOME CHARACTERISTICS OF THE FUND’S HOLDINGS AS OF 7/31/2026?
Investment Allocation |
% of Net Assets |
Affiliated Mutual Funds - Fixed Income |
36.2% |
Affiliated Exchange-Traded Funds - Fixed Income |
23.1% |
Affiliated Mutual Funds - Domestic Equity |
21.5% |
Affiliated Mutual Funds - International Equity |
14.0% |
Affiliated Mutual Fund - Short-Term Investment |
5.2% |
100.0% | |
Liabilities in excess of other assets |
(0.0)%* |
100.0% |
* |
Less than 0.05% |
WHAT WERE THE FUND COSTS FOR THE LAST YEAR?
(Based on a hypothetical $10,000 investment)
Costs of a $10,000 investment |
Costs paid as a percentage of a $10,000 investment | |
PGIM Target Date 2020 Fund—Class R6 |
$0 |
0.00% |
WHAT AFFECTED THE FUND’S PERFORMANCE DURING THE REPORTING PERIOD?
■ Despite some volatility across global markets in 2026, the past 12 months were influenced by evolving monetary policy expectations, persistent inflation concerns, and heightened geopolitical uncertainty. U.S. equities generally benefited from resilient corporate earnings and economic growth, while fixed income markets experienced periodic volatility as the interest rate outlook continued to be reassessed.
■ Given the Fund is comprised of equities, fixed income, and non-traditional assets, performance saw a number of contributors to performance. Across the asset classes included, the greatest level of performance was provided by commodities, non-U.S. developed markets equity, and U.S. mid-cap equity, with returns of 35.5%, 24.3%, and 20.9%, respectively.
■ Given the Fund is comprised of equities, fixed income, and non-traditional assets, performance saw a number of detractors from performance. Across the asset classes included, the lowest level of performance was provided by U.S. Treasury Inflation-Protected Securities, U.S. aggregate bonds, and cash, with returns of 2.6%, 2.7%, and 4.0%, respectively.
■
The PGIM Target Date Funds do not use derivatives, although derivatives are used in some of the
underlying
funds.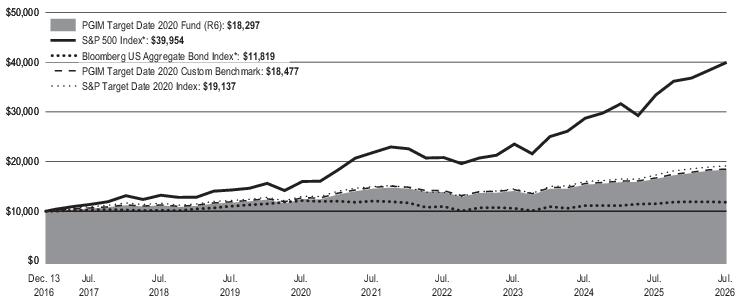
Average Annual Total Returns as of 7/31/2026 | |||
One Year (%) |
Five Years (%) |
Since Inception (%) | |
Class R6 |
10.98% |
4.70% |
6.47% (12/13/2016) |
S&P 500 Index* |
19.56% |
12.86% |
15.41% |
Bloomberg US Aggregate Bond Index* |
2.71% |
-0.40% |
1.74% |
PGIM Target Date 2020 Custom Benchmark |
10.57% |
4.52% |
6.56% |
S&P Target Date 2020 Index |
10.60% |
5.04% |
6.94% |
*The Fund compares its performance against this broad-based index in
response
to regulatory requirements.WHAT ARE SOME KEY FUND STATISTICS AS OF 7/31/2026?
Fund’s net assets |
$ 29,126,838 |
Number of fund holdings |
9 |
Total advisory fees paid for the year |
$ 0 |
Portfolio turnover rate for the year |
58% |
WHAT ARE SOME CHARACTERISTICS OF THE FUND’S HOLDINGS AS OF 7/31/2026?
Investment Allocation |
% of Net Assets |
Affiliated Mutual Funds - Fixed Income |
36.2% |
Affiliated Exchange-Traded Funds - Fixed Income |
23.1% |
Affiliated Mutual Funds - Domestic Equity |
21.5% |
Affiliated Mutual Funds - International Equity |
14.0% |
Affiliated Mutual Fund - Short-Term Investment |
5.2% |
100.0% | |
Liabilities in excess of other assets |
(0.0)%* |
100.0% |
* |
Less than 0.05% |
WHAT WERE THE FUND COSTS FOR THE LAST YEAR?
(Based on a hypothetical $10,000 investment)
Costs of a $10,000 investment |
Costs paid as a percentage of a $10,000 investment | |
PGIM Target Date 2025 Fund—Class R1 |
$73 |
0.69% |
WHAT AFFECTED THE FUND’S PERFORMANCE DURING THE REPORTING PERIOD?
■ Despite some volatility across global markets in 2026, the past 12 months were influenced by evolving monetary policy expectations, persistent inflation concerns, and heightened geopolitical uncertainty. U.S. equities generally benefited from resilient corporate earnings and economic growth, while fixed income markets experienced periodic volatility as the interest rate outlook continued to be reassessed.
■
Given the Fund is comprised of equities, fixed income, and non-traditional assets, performance saw a number of contributors to performance.
Across the asset classes included, the greatest level of performance was provided by commodities, U.S. small-cap equity, and
non-U.S. developed markets equity, with returns of 35.5%, 34.2%, and 24.3%, respectively.
■
Given the Fund is comprised of equities, fixed income, and non-traditional assets, performance saw a number of detractors from performance.
Across the asset classes included, the lowest level of performance was provided by U.S. Treasury Inflation-Protected Securities,
U.S. aggregate bonds, and cash, with returns of 2.6%, 2.7%, and 4.0%, respectively.
■
The PGIM Target Date Funds do not use derivatives, although derivatives are used in some of the underlying funds.
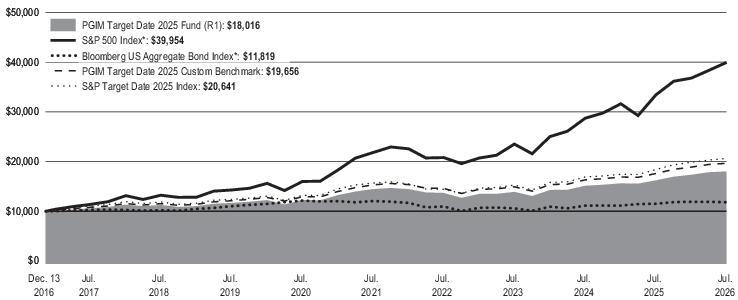
Average Annual Total Returns as of 7/31/2026 | |||
One Year (%) |
Five Years (%) |
Since Inception (%) | |
Class R1 |
11.09% |
4.49% |
6.30% (12/13/2016) |
S&P 500 Index* |
19.56% |
12.86% |
15.41% |
Bloomberg US Aggregate Bond Index* |
2.71% |
-0.40% |
1.74% |
PGIM Target Date 2025 Custom Benchmark |
11.70% |
5.13% |
7.24% |
S&P Target Date 2025 Index |
12.22% |
5.66% |
7.78% |
*The Fund compares its performance against this broad-based index in response to regulatory requirements.
WHAT ARE SOME KEY FUND STATISTICS AS OF 7/31/2026?
Fund’s net assets |
$41,437,625 |
Number of fund holdings |
10 |
Total advisory fees paid for the year |
$0 |
Portfolio turnover rate for the year |
56% |
WHAT ARE SOME CHARACTERISTICS OF THE FUND’S HOLDINGS AS OF 7/31/2026?
Investment Allocation |
% of Net Assets |
Affiliated Mutual Funds - Fixed Income |
31.9% |
Affiliated Mutual Funds - Domestic Equity |
26.9% |
Affiliated Exchange-Traded Funds - Fixed Income |
21.2% |
Affiliated Mutual Funds - International Equity |
15.6% |
Affiliated Mutual Fund - Short-Term Investment |
4.3% |
99.9% | |
Other assets in excess of liabilities |
0.1% |
100.0% |
WHAT WERE THE FUND COSTS FOR THE LAST YEAR?
(Based on a hypothetical $10,000 investment)
Costs of a $10,000 investment |
Costs paid as a percentage of a $10,000 investment | |
PGIM Target Date 2025 Fund—Class R2 |
$47 |
0.44% |
WHAT AFFECTED THE FUND’S PERFORMANCE DURING THE REPORTING PERIOD?
■ Despite some volatility across global markets in 2026, the past 12 months were influenced by evolving monetary policy expectations, persistent inflation concerns, and heightened geopolitical uncertainty. U.S. equities generally benefited from resilient corporate earnings and economic growth, while fixed income markets experienced periodic volatility as the interest rate outlook continued to be reassessed.
■
Given the Fund is comprised of equities, fixed income, and non-traditional assets, performance saw a number of contributors to performance.
Across the asset classes included, the greatest level of performance was provided by commodities, U.S. small-cap equity, and
non-U.S. developed markets equity, with returns of 35.5%, 34.2%, and 24.3%, respectively.
■
Given the Fund is comprised of equities, fixed income, and non-traditional assets, performance saw a number of detractors from performance.
Across the asset classes included, the lowest level of performance was provided by U.S. Treasury Inflation-Protected Securities,
U.S. aggregate bonds, and cash, with returns of 2.6%, 2.7%, and 4.0%, respectively.
■
The PGIM Target Date Funds do not use derivatives, although derivatives are used in some of the underlying funds.
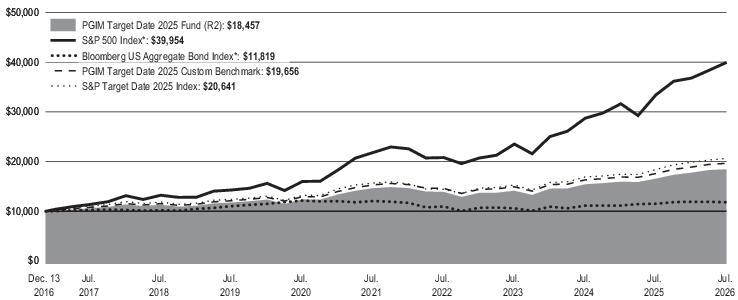
Average Annual Total Returns as of 7/31/2026 | |||
One Year (%) |
Five Years (%) |
Since Inception (%) | |
Class R2 |
11.44% |
4.75% |
6.57% (12/13/2016) |
S&P 500 Index* |
19.56% |
12.86% |
15.41% |
Bloomberg US Aggregate Bond Index* |
2.71% |
-0.40% |
1.74% |
PGIM Target Date 2025 Custom Benchmark |
11.70% |
5.13% |
7.24% |
S&P Target Date 2025 Index |
12.22% |
5.66% |
7.78% |
*The Fund compares its performance against this broad-based index in response to regulatory requirements.
WHAT ARE SOME KEY FUND STATISTICS AS OF 7/31/2026?
Fund’s net assets |
$41,437,625 |
Number of fund holdings |
10 |
Total advisory fees paid for the year |
$0 |
Portfolio turnover rate for the year |
56% |
WHAT ARE SOME CHARACTERISTICS OF THE FUND’S HOLDINGS AS OF 7/31/2026?
Investment Allocation |
% of Net Assets |
Affiliated Mutual Funds - Fixed Income |
31.9% |
Affiliated Mutual Funds - Domestic Equity |
26.9% |
Affiliated Exchange-Traded Funds - Fixed Income |
21.2% |
Affiliated Mutual Funds - International Equity |
15.6% |
Affiliated Mutual Fund - Short-Term Investment |
4.3% |
99.9% | |
Other assets in excess of liabilities |
0.1% |
100.0% |
WHAT WERE THE FUND COSTS FOR THE LAST YEAR?
(Based on a hypothetical $10,000 investment)
Costs of a $10,000 investment |
Costs paid as a percentage of a $10,000 investment | |
PGIM Target Date 2025 Fund—Class R3 |
$31 |
0.29% |
WHAT AFFECTED THE FUND’S PERFORMANCE DURING THE REPORTING PERIOD?
■ Despite some volatility across global markets in 2026, the past 12 months were influenced by evolving monetary policy expectations, persistent inflation concerns, and heightened geopolitical uncertainty. U.S. equities generally benefited from resilient corporate earnings and economic growth, while fixed income markets experienced periodic volatility as the interest rate outlook continued to be reassessed.
■
Given the Fund is comprised of equities, fixed income, and non-traditional assets, performance saw a number of contributors to performance.
Across the asset classes included, the greatest level of performance was provided by commodities, U.S. small-cap equity, and
non-U.S. developed markets equity, with returns of 35.5%, 34.2%, and 24.3%, respectively.
■
Given the Fund is comprised of equities, fixed income, and non-traditional assets, performance saw a number of detractors from performance.
Across the asset classes included, the lowest level of performance was provided by U.S. Treasury Inflation-Protected Securities,
U.S. aggregate bonds, and cash, with returns of 2.6%, 2.7%, and 4.0%, respectively.
■
The PGIM Target Date Funds do not use derivatives, although derivatives are used in some of the underlying funds.
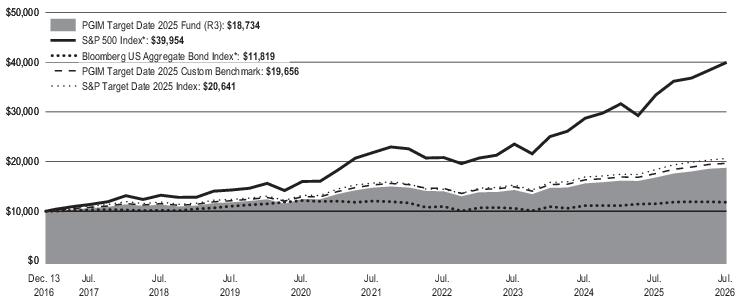
Average Annual Total Returns as of 7/31/2026 | |||
One Year (%) |
Five Years (%) |
Since Inception (%) | |
Class R3 |
11.59% |
4.90% |
6.73% (12/13/2016) |
S&P 500 Index* |
19.56% |
12.86% |
15.41% |
Bloomberg US Aggregate Bond Index* |
2.71% |
-0.40% |
1.74% |
PGIM Target Date 2025 Custom Benchmark |
11.70% |
5.13% |
7.24% |
S&P Target Date 2025 Index |
12.22% |
5.66% |
7.78% |
*The Fund compares its performance against this broad-based index in response to regulatory requirements.
WHAT ARE SOME KEY FUND STATISTICS AS OF 7/31/2026?
Fund’s net assets |
$41,437,625 |
Number of fund holdings |
10 |
Total advisory fees paid for the year |
$0 |
Portfolio turnover rate for the year |
56% |
WHAT ARE SOME CHARACTERISTICS OF THE FUND’S HOLDINGS AS OF 7/31/2026?
Investment Allocation |
% of Net Assets |
Affiliated Mutual Funds - Fixed Income |
31.9% |
Affiliated Mutual Funds - Domestic Equity |
26.9% |
Affiliated Exchange-Traded Funds - Fixed Income |
21.2% |
Affiliated Mutual Funds - International Equity |
15.6% |
Affiliated Mutual Fund - Short-Term Investment |
4.3% |
99.9% | |
Other assets in excess of liabilities |
0.1% |
100.0% |
WHAT WERE THE FUND COSTS FOR THE LAST YEAR?
(Based on a hypothetical $10,000 investment)
Costs of a $10,000 investment |
Costs paid as a percentage of a $10,000 investment | |
PGIM Target Date 2025 Fund—Class R4 |
$20 |
0.19% |
WHAT AFFECTED THE FUND’S PERFORMANCE DURING THE REPORTING PERIOD?
■ Despite some volatility across global markets in 2026, the past 12 months were influenced by evolving monetary policy expectations, persistent inflation concerns, and heightened geopolitical uncertainty. U.S. equities generally benefited from resilient corporate earnings and economic growth, while fixed income markets experienced periodic volatility as the interest rate outlook continued to be reassessed.
■
Given the Fund is comprised of equities, fixed income, and non-traditional assets, performance saw a number of contributors to performance.
Across the asset classes included, the greatest level of performance was provided by commodities, U.S. small-cap equity, and
non-U.S. developed markets equity, with returns of 35.5%, 34.2%, and 24.3%, respectively.
■
Given the Fund is comprised of equities, fixed income, and non-traditional assets, performance saw a number of detractors from performance.
Across the asset classes included, the lowest level of performance was provided by U.S. Treasury Inflation-Protected Securities,
U.S. aggregate bonds, and cash, with returns of 2.6%, 2.7%, and 4.0%, respectively.
■
The PGIM Target Date Funds do not use derivatives, although derivatives are used in some of the underlying funds.
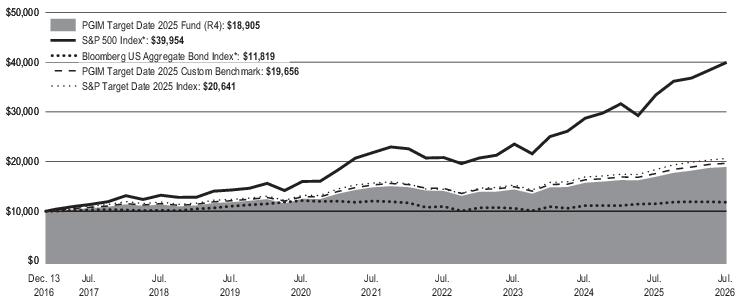
Average Annual Total Returns as of 7/31/2026 | |||
One Year (%) |
Five Years (%) |
Since Inception (%) | |
Class R4 |
11.70% |
5.01% |
6.83% (12/13/2016) |
S&P 500 Index* |
19.56% |
12.86% |
15.41% |
Bloomberg US Aggregate Bond Index* |
2.71% |
-0.40% |
1.74% |
PGIM Target Date 2025 Custom Benchmark |
11.70% |
5.13% |
7.24% |
S&P Target Date 2025 Index |
12.22% |
5.66% |
7.78% |
*The Fund compares its performance against this broad-based index in response to regulatory requirements.
WHAT ARE SOME KEY FUND STATISTICS AS OF 7/31/2026?
Fund’s net assets |
$41,437,625 |
Number of fund holdings |
10 |
Total advisory fees paid for the year |
$0 |
Portfolio turnover rate for the year |
56% |
WHAT ARE SOME CHARACTERISTICS OF THE FUND’S HOLDINGS AS OF 7/31/2026?
Investment Allocation |
% of Net Assets |
Affiliated Mutual Funds - Fixed Income |
31.9% |
Affiliated Mutual Funds - Domestic Equity |
26.9% |
Affiliated Exchange-Traded Funds - Fixed Income |
21.2% |
Affiliated Mutual Funds - International Equity |
15.6% |
Affiliated Mutual Fund - Short-Term Investment |
4.3% |
99.9% | |
Other assets in excess of liabilities |
0.1% |
100.0% |
WHAT WERE THE FUND COSTS FOR THE LAST YEAR?
(Based on a hypothetical $10,000 investment)
Costs of a $10,000 investment |
Costs paid as a percentage of a $10,000 investment | |
PGIM Target Date 2025 Fund—Class R5 |
$10 |
0.09% |
WHAT AFFECTED THE FUND’S PERFORMANCE DURING THE REPORTING PERIOD?
■ Despite some volatility across global markets in 2026, the past 12 months were influenced by evolving monetary policy expectations, persistent inflation concerns, and heightened geopolitical uncertainty. U.S. equities generally benefited from resilient corporate earnings and economic growth, while fixed income markets experienced periodic volatility as the interest rate outlook continued to be reassessed.
■
Given the Fund is comprised of equities, fixed income, and non-traditional assets, performance saw a number of contributors to performance.
Across the asset classes included, the greatest level of performance was provided by commodities, U.S. small-cap equity, and
non-U.S. developed markets equity, with returns of 35.5%, 34.2%, and 24.3%, respectively.
■
Given the Fund is comprised of equities, fixed income, and non-traditional assets, performance saw a number of detractors from performance.
Across the asset classes included, the lowest level of performance was provided by U.S. Treasury Inflation-Protected Securities,
U.S. aggregate bonds, and cash, with returns of 2.6%, 2.7%, and 4.0%, respectively.
■
The PGIM Target Date Funds do not use derivatives, although derivatives are used in some of the underlying funds.
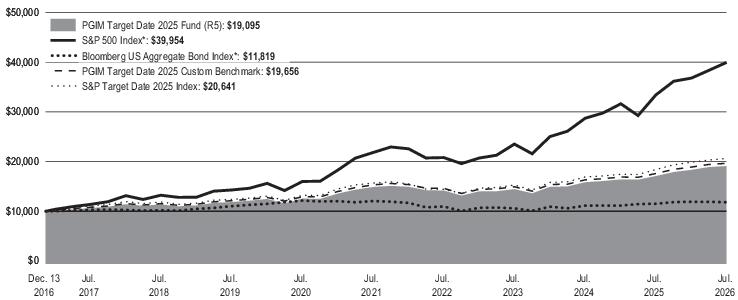
Average Annual Total Returns as of 7/31/2026 | |||
One Year (%) |
Five Years (%) |
Since Inception (%) | |
Class R5 |
11.79% |
5.13% |
6.95% (12/13/2016) |
S&P 500 Index* |
19.56% |
12.86% |
15.41% |
Bloomberg US Aggregate Bond Index* |
2.71% |
-0.40% |
1.74% |
PGIM Target Date 2025 Custom Benchmark |
11.70% |
5.13% |
7.24% |
S&P Target Date 2025 Index |
12.22% |
5.66% |
7.78% |
*The Fund compares its performance against this broad-based index in response to regulatory requirements.
WHAT ARE SOME KEY FUND STATISTICS AS OF 7/31/2026?
Fund’s net assets |
$41,437,625 |
Number of fund holdings |
10 |
Total advisory fees paid for the year |
$0 |
Portfolio turnover rate for the year |
56% |
WHAT ARE SOME CHARACTERISTICS OF THE FUND’S HOLDINGS AS OF 7/31/2026?
Investment Allocation |
% of Net Assets |
Affiliated Mutual Funds - Fixed Income |
31.9% |
Affiliated Mutual Funds - Domestic Equity |
26.9% |
Affiliated Exchange-Traded Funds - Fixed Income |
21.2% |
Affiliated Mutual Funds - International Equity |
15.6% |
Affiliated Mutual Fund - Short-Term Investment |
4.3% |
99.9% | |
Other assets in excess of liabilities |
0.1% |
100.0% |
WHAT WERE THE FUND COSTS FOR THE LAST YEAR?
(Based on a hypothetical $10,000 investment)
Costs of a $10,000 investment |
Costs paid as a percentage of a $10,000 investment | |
PGIM Target Date 2025 Fund—Class R6 |
$0 |
0.00% |
WHAT AFFECTED THE FUND’S PERFORMANCE DURING THE REPORTING PERIOD?
■ Despite some volatility across global markets in 2026, the past 12 months were influenced by evolving monetary policy expectations, persistent inflation concerns, and heightened geopolitical uncertainty. U.S. equities generally benefited from resilient corporate earnings and economic growth, while fixed income markets experienced periodic volatility as the interest rate outlook continued to be reassessed.
■
Given the Fund is comprised of equities, fixed income, and non-traditional assets, performance saw a number of contributors to performance.
Across the asset classes included, the greatest level of performance was provided by commodities, U.S. small-cap equity, and
non-U.S. developed markets equity, with returns of 35.5%, 34.2%, and 24.3%, respectively.
■
Given the Fund is comprised of equities, fixed income, and non-traditional assets, performance saw a number of detractors from performance.
Across the asset classes included, the lowest level of performance was provided by U.S. Treasury Inflation-Protected Securities,
U.S. aggregate bonds, and cash, with returns of 2.6%, 2.7%, and 4.0%, respectively.
■
The PGIM Target Date Funds do not use derivatives, although derivatives are used in some of the underlying funds.
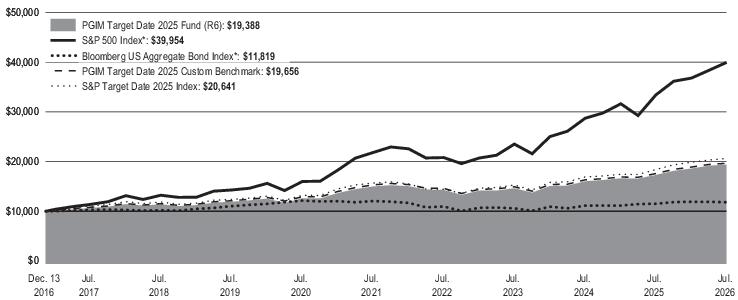
Average Annual Total Returns as of 7/31/2026 | |||
One Year (%) |
Five Years (%) |
Since Inception (%) | |
Class R6 |
12.02% |
5.27% |
7.11% (12/13/2016) |
S&P 500 Index* |
19.56% |
12.86% |
15.41% |
Bloomberg US Aggregate Bond Index* |
2.71% |
-0.40% |
1.74% |
PGIM Target Date 2025 Custom Benchmark |
11.70% |
5.13% |
7.24% |
S&P Target Date 2025 Index |
12.22% |
5.66% |
7.78% |
*The Fund compares its performance against this broad-based index in response to regulatory requirements.
WHAT ARE SOME KEY FUND STATISTICS AS OF 7/31/2026?
Fund’s net assets |
$41,437,625 |
Number of fund holdings |
10 |
Total advisory fees paid for the year |
$0 |
Portfolio turnover rate for the year |
56% |
WHAT ARE SOME CHARACTERISTICS OF THE FUND’S HOLDINGS AS OF 7/31/2026?
Investment Allocation |
% of Net Assets |
Affiliated Mutual Funds - Fixed Income |
31.9% |
Affiliated Mutual Funds - Domestic Equity |
26.9% |
Affiliated Exchange-Traded Funds - Fixed Income |
21.2% |
Affiliated Mutual Funds - International Equity |
15.6% |
Affiliated Mutual Fund - Short-Term Investment |
4.3% |
99.9% | |
Other assets in excess of liabilities |
0.1% |
100.0% |
WHAT WERE THE FUND COSTS FOR THE LAST YEAR?
(Based on a hypothetical $10,000 investment)
Costs of a $10,000 investment |
Costs paid as a percentage of a $10,000 investment | |
PGIM Target Date 2030 Fund—Class R1 |
$74 |
0.70% |
WHAT AFFECTED THE FUND’S PERFORMANCE DURING THE REPORTING PERIOD?
■ Despite some volatility across global markets in 2026, the past 12 months were influenced by evolving monetary policy expectations, persistent inflation concerns, and heightened geopolitical uncertainty. U.S. equities generally benefited from resilient corporate earnings and economic growth, while fixed income markets experienced periodic volatility as the interest rate outlook continued to be reassessed.
■
Given the Fund is comprised of equities, fixed income, and non-traditional assets, performance saw a number of contributors to performance.
Across the asset classes included, the greatest level of performance was provided by commodities, U.S. small-cap equity, and
non-U.S. developed markets equity, with returns of 35.5%, 34.2%, and 24.3%, respectively.
■
Given the Fund is comprised of equities, fixed income, and non-traditional assets, performance saw a number of detractors from performance.
Across the asset classes included, the lowest level of performance was provided by U.S. Treasury Inflation-Protected Securities,
U.S. aggregate bonds, and cash, with returns of 2.6%, 2.7%, and 4.0%, respectively.
■
The PGIM Target Date Funds do not use derivatives, although derivatives are used in some of the underlying funds.
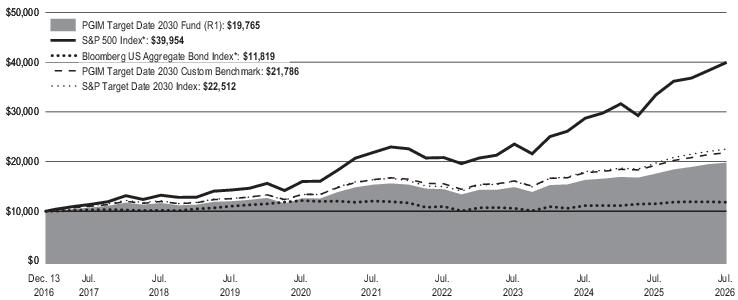
Average Annual Total Returns as of 7/31/2026 | |||
One Year (%) |
Five Years (%) |
Since Inception (%) | |
Class R1 |
12.56% |
5.20% |
7.33% (12/13/2016) |
S&P 500 Index* |
19.56% |
12.86% |
15.41% |
Bloomberg US Aggregate Bond Index* |
2.71% |
-0.40% |
1.74% |
PGIM Target Date 2030 Custom Benchmark |
13.14% |
5.89% |
8.39% |
S&P Target Date 2030 Index |
14.18% |
6.64% |
8.76% |
*The Fund compares its performance against this broad-based index in response to regulatory requirements.
WHAT ARE SOME KEY FUND STATISTICS AS OF 7/31/2026?
Fund’s net assets |
$54,867,908 |
Number of fund holdings |
10 |
Total advisory fees paid for the year |
$0 |
Portfolio turnover rate for the year |
65% |
WHAT ARE SOME CHARACTERISTICS OF THE FUND’S HOLDINGS AS OF 7/31/2026?
Investment Allocation |
% of Net Assets |
Affiliated Mutual Funds - Domestic Equity |
33.1% |
Affiliated Mutual Funds - Fixed Income |
25.6% |
Affiliated Exchange-Traded Funds - Fixed Income |
19.1% |
Affiliated Mutual Funds - International Equity |
18.9% |
Affiliated Mutual Fund - Short-Term Investment |
3.3% |
100.0% | |
Other assets in excess of liabilities |
0.0%* |
100.0% |
* |
Less than 0.05% |
WHAT WERE THE FUND COSTS FOR THE LAST YEAR?
(Based on a hypothetical $10,000 investment)
Costs of a $10,000 investment |
Costs paid as a percentage of a $10,000 investment | |
PGIM Target Date 2030 Fund—Class R2 |
$47 |
0.44% |
WHAT AFFECTED THE FUND’S PERFORMANCE DURING THE REPORTING PERIOD?
■ Despite some volatility across global markets in 2026, the past 12 months were influenced by evolving monetary policy expectations, persistent inflation concerns, and heightened geopolitical uncertainty. U.S. equities generally benefited from resilient corporate earnings and economic growth, while fixed income markets experienced periodic volatility as the interest rate outlook continued to be reassessed.
■
Given the Fund is comprised of equities, fixed income, and non-traditional assets, performance saw a number of contributors to performance.
Across the asset classes included, the greatest level of performance was provided by commodities, U.S. small-cap equity, and
non-U.S. developed markets equity, with returns of 35.5%, 34.2%, and 24.3%, respectively.
■
Given the Fund is comprised of equities, fixed income, and non-traditional assets, performance saw a number of detractors from performance.
Across the asset classes included, the lowest level of performance was provided by U.S. Treasury Inflation-Protected Securities,
U.S. aggregate bonds, and cash, with returns of 2.6%, 2.7%, and 4.0%, respectively.
■
The PGIM Target Date Funds do not use derivatives, although derivatives are used in some of the underlying funds.
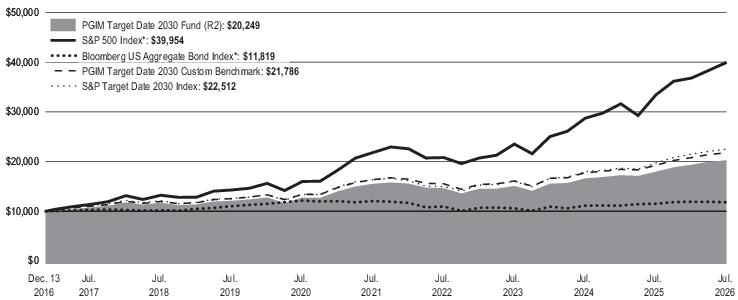
Average Annual Total Returns as of 7/31/2026 | |||
One Year (%) |
Five Years (%) |
Since Inception (%) | |
Class R2 |
12.80% |
5.46% |
7.60% (12/13/2016) |
S&P 500 Index* |
19.56% |
12.86% |
15.41% |
Bloomberg US Aggregate Bond Index* |
2.71% |
-0.40% |
1.74% |
PGIM Target Date 2030 Custom Benchmark |
13.14% |
5.89% |
8.39% |
S&P Target Date 2030 Index |
14.18% |
6.64% |
8.76% |
*The Fund compares its performance against this broad-based index in response to regulatory requirements.
WHAT ARE SOME KEY FUND STATISTICS AS OF 7/31/2026?
Fund’s net assets |
$54,867,908 |
Number of fund holdings |
10 |
Total advisory fees paid for the year |
$0 |
Portfolio turnover rate for the year |
65% |
WHAT ARE SOME CHARACTERISTICS OF THE FUND’S HOLDINGS AS OF 7/31/2026?
Investment Allocation |
% of Net Assets |
Affiliated Mutual Funds - Domestic Equity |
33.1% |
Affiliated Mutual Funds - Fixed Income |
25.6% |
Affiliated Exchange-Traded Funds - Fixed Income |
19.1% |
Affiliated Mutual Funds - International Equity |
18.9% |
Affiliated Mutual Fund - Short-Term Investment |
3.3% |
100.0% | |
Other assets in excess of liabilities |
0.0%* |
100.0% |
* |
Less than 0.05% |
WHAT WERE THE FUND COSTS FOR THE LAST YEAR?
(Based on a hypothetical $10,000 investment)
Costs of a $10,000 investment |
Costs paid as a percentage of a $10,000 investment | |
PGIM Target Date 2030 Fund—Class R3 |
$31 |
0.29% |
WHAT AFFECTED THE FUND’S PERFORMANCE DURING THE REPORTING PERIOD?
■ Despite some volatility across global markets in 2026, the past 12 months were influenced by evolving monetary policy expectations, persistent inflation concerns, and heightened geopolitical uncertainty. U.S. equities generally benefited from resilient corporate earnings and economic growth, while fixed income markets experienced periodic volatility as the interest rate outlook continued to be reassessed.
■
Given the Fund is comprised of equities, fixed income, and non-traditional assets, performance saw a number of contributors to performance.
Across the asset classes included, the greatest level of performance was provided by commodities, U.S. small-cap equity, and
non-U.S. developed markets equity, with returns of 35.5%, 34.2%, and 24.3%, respectively.
■
Given the Fund is comprised of equities, fixed income, and non-traditional assets, performance saw a number of detractors from performance.
Across the asset classes included, the lowest level of performance was provided by U.S. Treasury Inflation-Protected Securities,
U.S. aggregate bonds, and cash, with returns of 2.6%, 2.7%, and 4.0%, respectively.
■
The PGIM Target Date Funds do not use derivatives, although derivatives are used in some of the underlying funds.
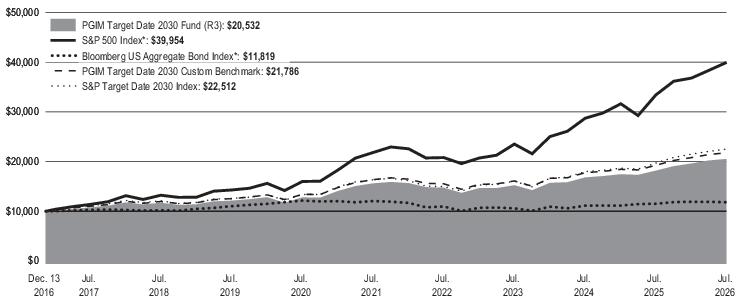
Average Annual Total Returns as of 7/31/2026 | |||
One Year (%) |
Five Years (%) |
Since Inception (%) | |
Class R3 |
12.97% |
5.63% |
7.75% (12/13/2016) |
S&P 500 Index* |
19.56% |
12.86% |
15.41% |
Bloomberg US Aggregate Bond Index* |
2.71% |
-0.40% |
1.74% |
PGIM Target Date 2030 Custom Benchmark |
13.14% |
5.89% |
8.39% |
S&P Target Date 2030 Index |
14.18% |
6.64% |
8.76% |
*The Fund compares its performance against this broad-based index in response to regulatory requirements.
WHAT ARE SOME KEY FUND STATISTICS AS OF 7/31/2026?
Fund’s net assets |
$54,867,908 |
Number of fund holdings |
10 |
Total advisory fees paid for the year |
$0 |
Portfolio turnover rate for the year |
65% |
WHAT ARE SOME CHARACTERISTICS OF THE FUND’S HOLDINGS AS OF 7/31/2026?
Investment Allocation |
% of Net Assets |
Affiliated Mutual Funds - Domestic Equity |
33.1% |
Affiliated Mutual Funds - Fixed Income |
25.6% |
Affiliated Exchange-Traded Funds - Fixed Income |
19.1% |
Affiliated Mutual Funds - International Equity |
18.9% |
Affiliated Mutual Fund - Short-Term Investment |
3.3% |
100.0% | |
Other assets in excess of liabilities |
0.0%* |
100.0% |
* |
Less than 0.05% |
WHAT WERE THE FUND COSTS FOR THE LAST YEAR?
(Based on a hypothetical $10,000 investment)
Costs of a $10,000 investment |
Costs paid as a percentage of a $10,000 investment | |
PGIM Target Date 2030 Fund—Class R4 |
$21 |
0.20% |
WHAT AFFECTED THE FUND’S PERFORMANCE DURING THE REPORTING PERIOD?
■ Despite some volatility across global markets in 2026, the past 12 months were influenced by evolving monetary policy expectations, persistent inflation concerns, and heightened geopolitical uncertainty. U.S. equities generally benefited from resilient corporate earnings and economic growth, while fixed income markets experienced periodic volatility as the interest rate outlook continued to be reassessed.
■
Given the Fund is comprised of equities, fixed income, and non-traditional assets, performance saw a number of contributors to performance.
Across the asset classes included, the greatest level of performance was provided by commodities, U.S. small-cap equity, and
non-U.S. developed markets equity, with returns of 35.5%, 34.2%, and 24.3%, respectively.
■
Given the Fund is comprised of equities, fixed income, and non-traditional assets, performance saw a number of detractors from performance.
Across the asset classes included, the lowest level of performance was provided by U.S. Treasury Inflation-Protected Securities,
U.S. aggregate bonds, and cash, with returns of 2.6%, 2.7%, and 4.0%, respectively.
■
The PGIM Target Date Funds do not use derivatives, although derivatives are used in some of the underlying funds.
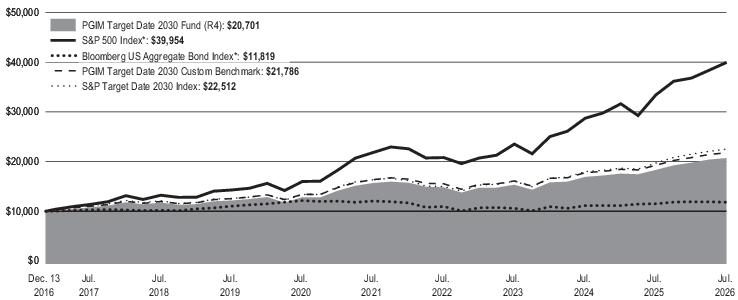
Average Annual Total Returns as of 7/31/2026 | |||
One Year (%) |
Five Years (%) |
Since Inception (%) | |
Class R4 |
12.99% |
5.72% |
7.85% (12/13/2016) |
S&P 500 Index* |
19.56% |
12.86% |
15.41% |
Bloomberg US Aggregate Bond Index* |
2.71% |
-0.40% |
1.74% |
PGIM Target Date 2030 Custom Benchmark |
13.14% |
5.89% |
8.39% |
S&P Target Date 2030 Index |
14.18% |
6.64% |
8.76% |
*The Fund compares its performance against this broad-based index in response to regulatory requirements.
WHAT ARE SOME KEY FUND STATISTICS AS OF 7/31/2026?
Fund’s net assets |
$54,867,908 |
Number of fund holdings |
10 |
Total advisory fees paid for the year |
$0 |
Portfolio turnover rate for the year |
65% |
WHAT ARE SOME CHARACTERISTICS OF THE FUND’S HOLDINGS AS OF 7/31/2026?
Investment Allocation |
% of Net Assets |
Affiliated Mutual Funds - Domestic Equity |
33.1% |
Affiliated Mutual Funds - Fixed Income |
25.6% |
Affiliated Exchange-Traded Funds - Fixed Income |
19.1% |
Affiliated Mutual Funds - International Equity |
18.9% |
Affiliated Mutual Fund - Short-Term Investment |
3.3% |
100.0% | |
Other assets in excess of liabilities |
0.0%* |
100.0% |
* |
Less than 0.05% |
WHAT WERE THE FUND COSTS FOR THE LAST YEAR?
(Based on a hypothetical $10,000 investment)
Costs of a $10,000 investment |
Costs paid as a percentage of a $10,000 investment | |
PGIM Target Date 2030 Fund—Class R5 |
$11 |
0.10% |
WHAT AFFECTED THE FUND’S PERFORMANCE DURING THE REPORTING PERIOD?
■ Despite some volatility across global markets in 2026, the past 12 months were influenced by evolving monetary policy expectations, persistent inflation concerns, and heightened geopolitical uncertainty. U.S. equities generally benefited from resilient corporate earnings and economic growth, while fixed income markets experienced periodic volatility as the interest rate outlook continued to be reassessed.
■
Given the Fund is comprised of equities, fixed income, and non-traditional assets, performance saw a number of contributors to performance.
Across the asset classes included, the greatest level of performance was provided by commodities, U.S. small-cap equity, and
non-U.S. developed markets equity, with returns of 35.5%, 34.2%, and 24.3%, respectively.
■
Given the Fund is comprised of equities, fixed income, and non-traditional assets, performance saw a number of detractors from performance.
Across the asset classes included, the lowest level of performance was provided by U.S. Treasury Inflation-Protected Securities,
U.S. aggregate bonds, and cash, with returns of 2.6%, 2.7%, and 4.0%, respectively.
■
The PGIM Target Date Funds do not use derivatives, although derivatives are used in some of the underlying funds.
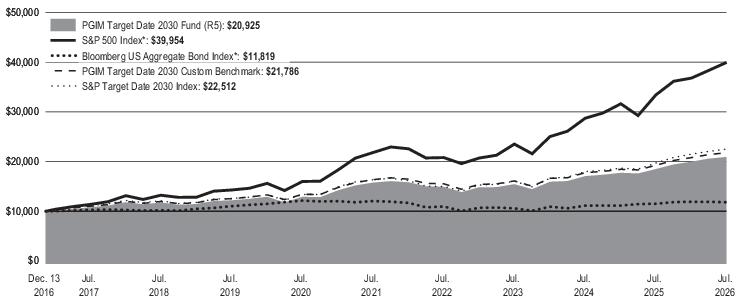
Average Annual Total Returns as of 7/31/2026 | |||
One Year (%) |
Five Years (%) |
Since Inception (%) | |
Class R5 |
13.17% |
5.83% |
7.97% (12/13/2016) |
S&P 500 Index* |
19.56% |
12.86% |
15.41% |
Bloomberg US Aggregate Bond Index* |
2.71% |
-0.40% |
1.74% |
PGIM Target Date 2030 Custom Benchmark |
13.14% |
5.89% |
8.39% |
S&P Target Date 2030 Index |
14.18% |
6.64% |
8.76% |
*The Fund compares its performance against this broad-based index in response to regulatory requirements.
WHAT ARE SOME KEY FUND STATISTICS AS OF 7/31/2026?
Fund’s net assets |
$54,867,908 |
Number of fund holdings |
10 |
Total advisory fees paid for the year |
$0 |
Portfolio turnover rate for the year |
65% |
WHAT ARE SOME CHARACTERISTICS OF THE FUND’S HOLDINGS AS OF 7/31/2026?
Investment Allocation |
% of Net Assets |
Affiliated Mutual Funds - Domestic Equity |
33.1% |
Affiliated Mutual Funds - Fixed Income |
25.6% |
Affiliated Exchange-Traded Funds - Fixed Income |
19.1% |
Affiliated Mutual Funds - International Equity |
18.9% |
Affiliated Mutual Fund - Short-Term Investment |
3.3% |
100.0% | |
Other assets in excess of liabilities |
0.0%* |
100.0% |
* |
Less than 0.05% |
WHAT WERE THE FUND COSTS FOR THE LAST YEAR?
(Based on a hypothetical $10,000 investment)
Costs of a $10,000 investment |
Costs paid as a percentage of a $10,000 investment | |
PGIM Target Date 2030 Fund—Class R6 |
$0 |
0.00% |
WHAT AFFECTED THE FUND’S PERFORMANCE DURING THE REPORTING PERIOD?
■ Despite some volatility across global markets in 2026, the past 12 months were influenced by evolving monetary policy expectations, persistent inflation concerns, and heightened geopolitical uncertainty. U.S. equities generally benefited from resilient corporate earnings and economic growth, while fixed income markets experienced periodic volatility as the interest rate outlook continued to be reassessed.
■
Given the Fund is comprised of equities, fixed income, and non-traditional assets, performance saw a number of contributors to performance.
Across the asset classes included, the greatest level of performance was provided by commodities, U.S. small-cap equity, and
non-U.S. developed markets equity, with returns of 35.5%, 34.2%, and 24.3%, respectively.
■
Given the Fund is comprised of equities, fixed income, and non-traditional assets, performance saw a number of detractors from performance.
Across the asset classes included, the lowest level of performance was provided by U.S. Treasury Inflation-Protected Securities,
U.S. aggregate bonds, and cash, with returns of 2.6%, 2.7%, and 4.0%, respectively.
■
The PGIM Target Date Funds do not use derivatives, although derivatives are used in some of the underlying funds.
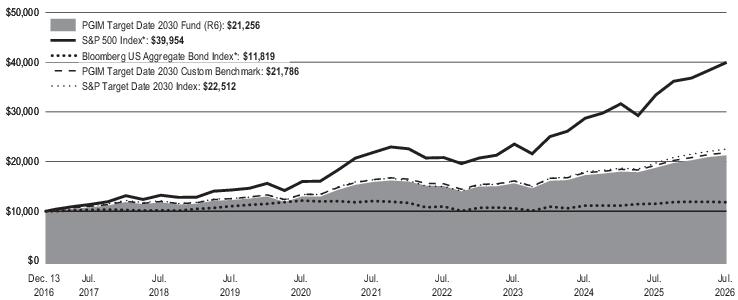
Average Annual Total Returns as of 7/31/2026 | |||
One Year (%) |
Five Years (%) |
Since Inception (%) | |
Class R6 |
13.38% |
5.99% |
8.14% (12/13/2016) |
S&P 500 Index* |
19.56% |
12.86% |
15.41% |
Bloomberg US Aggregate Bond Index* |
2.71% |
-0.40% |
1.74% |
PGIM Target Date 2030 Custom Benchmark |
13.14% |
5.89% |
8.39% |
S&P Target Date 2030 Index |
14.18% |
6.64% |
8.76% |
*The Fund compares its performance against this broad-based index in response to regulatory requirements.
WHAT ARE SOME KEY FUND STATISTICS AS OF 7/31/2026?
Fund’s net assets |
$54,867,908 |
Number of fund holdings |
10 |
Total advisory fees paid for the year |
$0 |
Portfolio turnover rate for the year |
65% |
WHAT ARE SOME CHARACTERISTICS OF THE FUND’S HOLDINGS AS OF 7/31/2026?
Investment Allocation |
% of Net Assets |
Affiliated Mutual Funds - Domestic Equity |
33.1% |
Affiliated Mutual Funds - Fixed Income |
25.6% |
Affiliated Exchange-Traded Funds - Fixed Income |
19.1% |
Affiliated Mutual Funds - International Equity |
18.9% |
Affiliated Mutual Fund - Short-Term Investment |
3.3% |
100.0% | |
Other assets in excess of liabilities |
0.0%* |
100.0% |
* |
Less than 0.05% |
WHAT WERE THE FUND COSTS FOR THE LAST YEAR?
(Based on a hypothetical $10,000 investment)
Costs of a $10,000 investment |
Costs paid as a percentage of a $10,000 investment | |
PGIM Target Date 2035 Fund—Class R1 |
$73 |
0.68% |
WHAT AFFECTED THE FUND’S PERFORMANCE DURING THE REPORTING PERIOD?
■ Despite some volatility across global markets in 2026, the past 12 months were influenced by evolving monetary policy expectations, persistent inflation concerns, and heightened geopolitical uncertainty. U.S. equities generally benefited from resilient corporate earnings and economic growth, while fixed income markets experienced periodic volatility as the interest rate outlook continued to be reassessed.
■
Given the Fund is comprised of equities, fixed income, and non-traditional assets, performance saw a number of contributors to performance.
Across the asset classes included, the greatest level of performance was provided by emerging markets equity, commodities, and
U.S. small-cap equity, with returns of 36.4%, 35.5%, and 34.2%, respectively.
■
Given the Fund is comprised of equities, fixed income, and non-traditional assets, performance saw a number of detractors from performance.
Across the asset classes included, the lowest level of performance was provided by U.S. Treasury Inflation-Protected Securities,
U.S. aggregate bonds, and cash, with returns of 2.6%, 2.7%, and 4.0%, respectively.
■
The PGIM Target Date Funds do not use derivatives, although derivatives are used in some of the underlying funds.
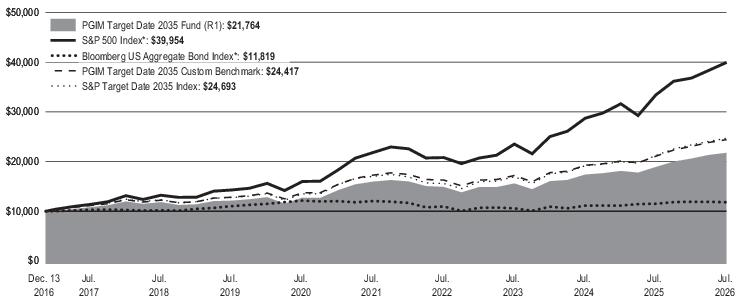
Average Annual Total Returns as of 7/31/2026 | |||
One Year (%) |
Five Years (%) |
Since Inception (%) | |
Class R1 |
15.10% |
6.40% |
8.41% (12/13/2016) |
S&P 500 Index* |
19.56% |
12.86% |
15.41% |
Bloomberg US Aggregate Bond Index* |
2.71% |
-0.40% |
1.74% |
PGIM Target Date 2035 Custom Benchmark |
15.79% |
7.17% |
9.67% |
S&P Target Date 2035 Index |
16.34% |
7.71% |
9.80% |
*The Fund compares its performance against this broad-based index in response to regulatory requirements.
WHAT ARE SOME KEY FUND STATISTICS AS OF 7/31/2026?
Fund’s net assets |
$49,548,101 |
Number of fund holdings |
11 |
Total advisory fees paid for the year |
$0 |
Portfolio turnover rate for the year |
60% |
WHAT ARE SOME CHARACTERISTICS OF THE FUND’S HOLDINGS AS OF 7/31/2026?
Investment Allocation |
% of Net Assets |
Affiliated Mutual Funds - Domestic Equity |
40.9% |
Affiliated Mutual Funds - International Equity |
23.2% |
Affiliated Mutual Funds - Fixed Income |
18.6% |
Affiliated Exchange-Traded Funds - Fixed Income |
15.0% |
Affiliated Mutual Fund - Short-Term Investment |
2.3% |
100.0% | |
Other assets in excess of liabilities |
0.0%* |
100.0% |
* |
Less than 0.05% |
WHAT WERE THE FUND COSTS FOR THE LAST YEAR?
(Based on a hypothetical $10,000 investment)
Costs of a $10,000 investment |
Costs paid as a percentage of a $10,000 investment | |
PGIM Target Date 2035 Fund—Class R2 |
$46 |
0.43% |
WHAT AFFECTED THE FUND’S PERFORMANCE DURING THE REPORTING PERIOD?
■ Despite some volatility across global markets in 2026, the past 12 months were influenced by evolving monetary policy expectations, persistent inflation concerns, and heightened geopolitical uncertainty. U.S. equities generally benefited from resilient corporate earnings and economic growth, while fixed income markets experienced periodic volatility as the interest rate outlook continued to be reassessed.
■
Given the Fund is comprised of equities, fixed income, and non-traditional assets, performance saw a number of contributors to performance.
Across the asset classes included, the greatest level of performance was provided by emerging markets equity, commodities, and
U.S. small-cap equity, with returns of 36.4%, 35.5%, and 34.2%, respectively.
■
Given the Fund is comprised of equities, fixed income, and non-traditional assets, performance saw a number of detractors from performance.
Across the asset classes included, the lowest level of performance was provided by U.S. Treasury Inflation-Protected Securities,
U.S. aggregate bonds, and cash, with returns of 2.6%, 2.7%, and 4.0%, respectively.
■
The PGIM Target Date Funds do not use derivatives, although derivatives are used in some of the underlying funds.
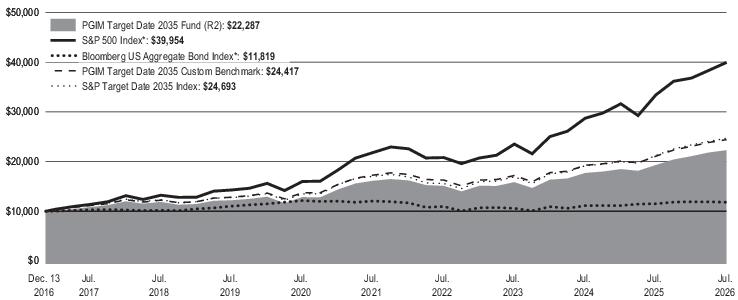
Average Annual Total Returns as of 7/31/2026 | |||
One Year (%) |
Five Years (%) |
Since Inception (%) | |
Class R2 |
15.47% |
6.68% |
8.68% (12/13/2016) |
S&P 500 Index* |
19.56% |
12.86% |
15.41% |
Bloomberg US Aggregate Bond Index* |
2.71% |
-0.40% |
1.74% |
PGIM Target Date 2035 Custom Benchmark |
15.79% |
7.17% |
9.67% |
S&P Target Date 2035 Index |
16.34% |
7.71% |
9.80% |
*The Fund compares its performance against this broad-based index in response to regulatory requirements.
WHAT ARE SOME KEY FUND STATISTICS AS OF 7/31/2026?
Fund’s net assets |
$49,548,101 |
Number of fund holdings |
11 |
Total advisory fees paid for the year |
$0 |
Portfolio turnover rate for the year |
60% |
WHAT ARE SOME CHARACTERISTICS OF THE FUND’S HOLDINGS AS OF 7/31/2026?
Investment Allocation |
% of Net Assets |
Affiliated Mutual Funds - Domestic Equity |
40.9% |
Affiliated Mutual Funds - International Equity |
23.2% |
Affiliated Mutual Funds - Fixed Income |
18.6% |
Affiliated Exchange-Traded Funds - Fixed Income |
15.0% |
Affiliated Mutual Fund - Short-Term Investment |
2.3% |
100.0% | |
Other assets in excess of liabilities |
0.0%* |
100.0% |
* |
Less than 0.05% |
WHAT WERE THE FUND COSTS FOR THE LAST YEAR?
(Based on a hypothetical $10,000 investment)
Costs of a $10,000 investment |
Costs paid as a percentage of a $10,000 investment | |
PGIM Target Date 2035 Fund—Class R3 |
$31 |
0.29% |
WHAT AFFECTED THE FUND’S PERFORMANCE DURING THE REPORTING PERIOD?
■ Despite some volatility across global markets in 2026, the past 12 months were influenced by evolving monetary policy expectations, persistent inflation concerns, and heightened geopolitical uncertainty. U.S. equities generally benefited from resilient corporate earnings and economic growth, while fixed income markets experienced periodic volatility as the interest rate outlook continued to be reassessed.
■
Given the Fund is comprised of equities, fixed income, and non-traditional assets, performance saw a number of contributors to performance.
Across the asset classes included, the greatest level of performance was provided by emerging markets equity, commodities, and
U.S. small-cap equity, with returns of 36.4%, 35.5%, and 34.2%, respectively.
■
Given the Fund is comprised of equities, fixed income, and non-traditional assets, performance saw a number of detractors from performance.
Across the asset classes included, the lowest level of performance was provided by U.S. Treasury Inflation-Protected Securities,
U.S. aggregate bonds, and cash, with returns of 2.6%, 2.7%, and 4.0%, respectively.
■
The PGIM Target Date Funds do not use derivatives, although derivatives are used in some of the underlying funds.
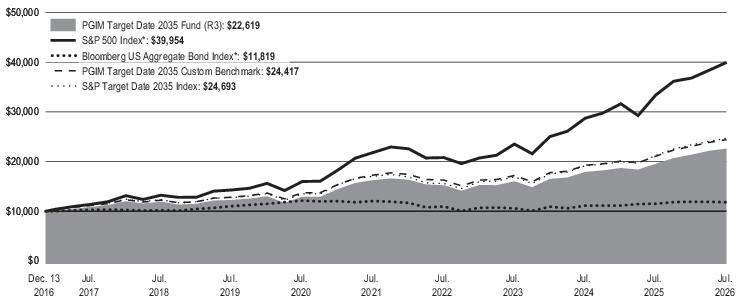
Average Annual Total Returns as of 7/31/2026 | |||
One Year (%) |
Five Years (%) |
Since Inception (%) | |
Class R3 |
15.59% |
6.83% |
8.84% (12/13/2016) |
S&P 500 Index* |
19.56% |
12.86% |
15.41% |
Bloomberg US Aggregate Bond Index* |
2.71% |
-0.40% |
1.74% |
PGIM Target Date 2035 Custom Benchmark |
15.79% |
7.17% |
9.67% |
S&P Target Date 2035 Index |
16.34% |
7.71% |
9.80% |
*The Fund compares its performance against this broad-based index in response to regulatory requirements.
WHAT ARE SOME KEY FUND STATISTICS AS OF 7/31/2026?
Fund’s net assets |
$49,548,101 |
Number of fund holdings |
11 |
Total advisory fees paid for the year |
$0 |
Portfolio turnover rate for the year |
60% |
WHAT ARE SOME CHARACTERISTICS OF THE FUND’S HOLDINGS AS OF 7/31/2026?
Investment Allocation |
% of Net Assets |
Affiliated Mutual Funds - Domestic Equity |
40.9% |
Affiliated Mutual Funds - International Equity |
23.2% |
Affiliated Mutual Funds - Fixed Income |
18.6% |
Affiliated Exchange-Traded Funds - Fixed Income |
15.0% |
Affiliated Mutual Fund - Short-Term Investment |
2.3% |
100.0% | |
Other assets in excess of liabilities |
0.0%* |
100.0% |
* |
Less than 0.05% |
WHAT WERE THE FUND COSTS FOR THE LAST YEAR?
(Based on a hypothetical $10,000 investment)
Costs of a $10,000 investment |
Costs paid as a percentage of a $10,000 investment | |
PGIM Target Date 2035 Fund—Class R4 |
$19 |
0.18% |
WHAT AFFECTED THE FUND’S PERFORMANCE DURING THE REPORTING PERIOD?
■ Despite some volatility across global markets in 2026, the past 12 months were influenced by evolving monetary policy expectations, persistent inflation concerns, and heightened geopolitical uncertainty. U.S. equities generally benefited from resilient corporate earnings and economic growth, while fixed income markets experienced periodic volatility as the interest rate outlook continued to be reassessed.
■
Given the Fund is comprised of equities, fixed income, and non-traditional assets, performance saw a number of contributors to performance.
Across the asset classes included, the greatest level of performance was provided by emerging markets equity, commodities, and
U.S. small-cap equity, with returns of 36.4%, 35.5%, and 34.2%, respectively.
■
Given the Fund is comprised of equities, fixed income, and non-traditional assets, performance saw a number of detractors from performance.
Across the asset classes included, the lowest level of performance was provided by U.S. Treasury Inflation-Protected Securities,
U.S. aggregate bonds, and cash, with returns of 2.6%, 2.7%, and 4.0%, respectively.
■
The PGIM Target Date Funds do not use derivatives, although derivatives are used in some of the underlying funds.
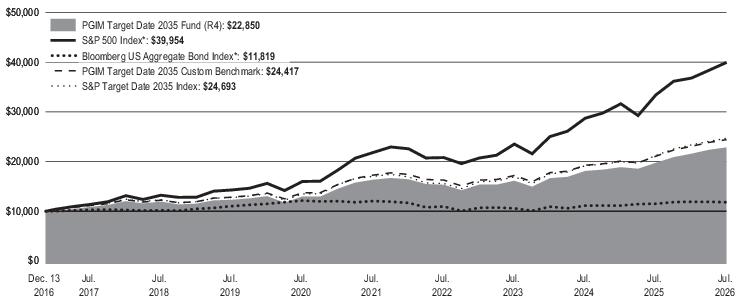
Average Annual Total Returns as of 7/31/2026 | |||
One Year (%) |
Five Years (%) |
Since Inception (%) | |
Class R4 |
15.67% |
6.93% |
8.96% (12/13/2016) |
S&P 500 Index* |
19.56% |
12.86% |
15.41% |
Bloomberg US Aggregate Bond Index* |
2.71% |
-0.40% |
1.74% |
PGIM Target Date 2035 Custom Benchmark |
15.79% |
7.17% |
9.67% |
S&P Target Date 2035 Index |
16.34% |
7.71% |
9.80% |
*The Fund compares its performance against this broad-based index in response to regulatory requirements.
WHAT ARE SOME KEY FUND STATISTICS AS OF 7/31/2026?
Fund’s net assets |
$49,548,101 |
Number of fund holdings |
11 |
Total advisory fees paid for the year |
$0 |
Portfolio turnover rate for the year |
60% |
WHAT ARE SOME CHARACTERISTICS OF THE FUND’S HOLDINGS AS OF 7/31/2026?
Investment Allocation |
% of Net Assets |
Affiliated Mutual Funds - Domestic Equity |
40.9% |
Affiliated Mutual Funds - International Equity |
23.2% |
Affiliated Mutual Funds - Fixed Income |
18.6% |
Affiliated Exchange-Traded Funds - Fixed Income |
15.0% |
Affiliated Mutual Fund - Short-Term Investment |
2.3% |
100.0% | |
Other assets in excess of liabilities |
0.0%* |
100.0% |
* |
Less than 0.05% |
WHAT WERE THE FUND COSTS FOR THE LAST YEAR?
(Based on a hypothetical $10,000 investment)
Costs of a $10,000 investment |
Costs paid as a percentage of a $10,000 investment | |
PGIM Target Date 2035 Fund—Class R5 |
$9 |
0.08% |
WHAT AFFECTED THE FUND’S PERFORMANCE DURING THE REPORTING PERIOD?
■ Despite some volatility across global markets in 2026, the past 12 months were influenced by evolving monetary policy expectations, persistent inflation concerns, and heightened geopolitical uncertainty. U.S. equities generally benefited from resilient corporate earnings and economic growth, while fixed income markets experienced periodic volatility as the interest rate outlook continued to be reassessed.
■
Given the Fund is comprised of equities, fixed income, and non-traditional assets, performance saw a number of contributors to performance.
Across the asset classes included, the greatest level of performance was provided by emerging markets equity, commodities, and
U.S. small-cap equity, with returns of 36.4%, 35.5%, and 34.2%, respectively.
■
Given the Fund is comprised of equities, fixed income, and non-traditional assets, performance saw a number of detractors from performance.
Across the asset classes included, the lowest level of performance was provided by U.S. Treasury Inflation-Protected Securities,
U.S. aggregate bonds, and cash, with returns of 2.6%, 2.7%, and 4.0%, respectively.
■
The PGIM Target Date Funds do not use derivatives, although derivatives are used in some of the underlying funds.
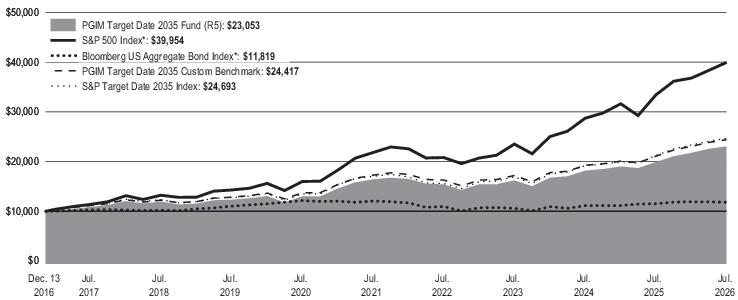
Average Annual Total Returns as of 7/31/2026 | |||
One Year (%) |
Five Years (%) |
Since Inception (%) | |
Class R5 |
15.86% |
7.04% |
9.06% (12/13/2016) |
S&P 500 Index* |
19.56% |
12.86% |
15.41% |
Bloomberg US Aggregate Bond Index* |
2.71% |
-0.40% |
1.74% |
PGIM Target Date 2035 Custom Benchmark |
15.79% |
7.17% |
9.67% |
S&P Target Date 2035 Index |
16.34% |
7.71% |
9.80% |
*The Fund compares its performance against this broad-based index in response to regulatory requirements.
WHAT ARE SOME KEY FUND STATISTICS AS OF 7/31/2026?
Fund’s net assets |
$49,548,101 |
Number of fund holdings |
11 |
Total advisory fees paid for the year |
$0 |
Portfolio turnover rate for the year |
60% |
WHAT ARE SOME CHARACTERISTICS OF THE FUND’S HOLDINGS AS OF 7/31/2026?
Investment Allocation |
% of Net Assets |
Affiliated Mutual Funds - Domestic Equity |
40.9% |
Affiliated Mutual Funds - International Equity |
23.2% |
Affiliated Mutual Funds - Fixed Income |
18.6% |
Affiliated Exchange-Traded Funds - Fixed Income |
15.0% |
Affiliated Mutual Fund - Short-Term Investment |
2.3% |
100.0% | |
Other assets in excess of liabilities |
0.0%* |
100.0% |
* |
Less than 0.05% |
WHAT WERE THE FUND COSTS FOR THE LAST YEAR?
(Based on a hypothetical $10,000 investment)
Costs of a $10,000 investment |
Costs paid as a percentage of a $10,000 investment | |
PGIM Target Date 2035 Fund—Class R6 |
$0 |
0.00% |
WHAT AFFECTED THE FUND’S PERFORMANCE DURING THE REPORTING PERIOD?
■ Despite some volatility across global markets in 2026, the past 12 months were influenced by evolving monetary policy expectations, persistent inflation concerns, and heightened geopolitical uncertainty. U.S. equities generally benefited from resilient corporate earnings and economic growth, while fixed income markets experienced periodic volatility as the interest rate outlook continued to be reassessed.
■
Given the Fund is comprised of equities, fixed income, and non-traditional assets, performance saw a number of contributors to performance.
Across the asset classes included, the greatest level of performance was provided by emerging markets equity, commodities, and
U.S. small-cap equity, with returns of 36.4%, 35.5%, and 34.2%, respectively.
■
Given the Fund is comprised of equities, fixed income, and non-traditional assets, performance saw a number of detractors from performance.
Across the asset classes included, the lowest level of performance was provided by U.S. Treasury Inflation-Protected Securities,
U.S. aggregate bonds, and cash, with returns of 2.6%, 2.7%, and 4.0%, respectively.
■
The PGIM Target Date Funds do not use derivatives, although derivatives are used in some of the underlying funds.
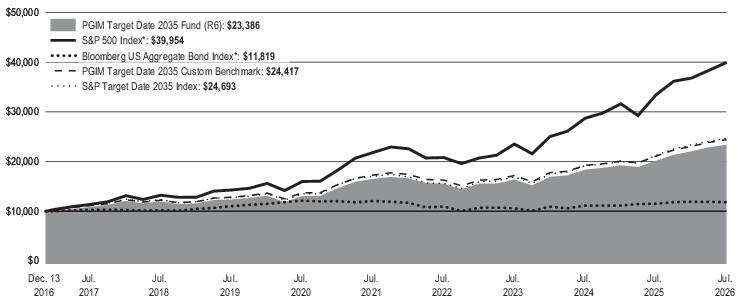
Average Annual Total Returns as of 7/31/2026 | |||
One Year (%) |
Five Years (%) |
Since Inception (%) | |
Class R6 |
16.01% |
7.21% |
9.22% (12/13/2016) |
S&P 500 Index* |
19.56% |
12.86% |
15.41% |
Bloomberg US Aggregate Bond Index* |
2.71% |
-0.40% |
1.74% |
PGIM Target Date 2035 Custom Benchmark |
15.79% |
7.17% |
9.67% |
S&P Target Date 2035 Index |
16.34% |
7.71% |
9.80% |
*The Fund compares its performance against this broad-based index in response to regulatory requirements.
WHAT ARE SOME KEY FUND STATISTICS AS OF 7/31/2026?
Fund’s net assets |
$49,548,101 |
Number of fund holdings |
11 |
Total advisory fees paid for the year |
$0 |
Portfolio turnover rate for the year |
60% |
WHAT ARE SOME CHARACTERISTICS OF THE FUND’S HOLDINGS AS OF 7/31/2026?
Investment Allocation |
% of Net Assets |
Affiliated Mutual Funds - Domestic Equity |
40.9% |
Affiliated Mutual Funds - International Equity |
23.2% |
Affiliated Mutual Funds - Fixed Income |
18.6% |
Affiliated Exchange-Traded Funds - Fixed Income |
15.0% |
Affiliated Mutual Fund - Short-Term Investment |
2.3% |
100.0% | |
Other assets in excess of liabilities |
0.0%* |
100.0% |
* |
Less than 0.05% |
WHAT WERE THE FUND COSTS FOR THE LAST YEAR?
(Based on a hypothetical $10,000 investment)
Costs of a $10,000 investment |
Costs paid as a percentage of a $10,000 investment | |
PGIM Target Date 2040 Fund—Class R1 |
$73 |
0.67% |
WHAT AFFECTED THE FUND’S PERFORMANCE DURING THE REPORTING PERIOD?
■ Despite some volatility across global markets in 2026, the past 12 months were influenced by evolving monetary policy expectations, persistent inflation concerns, and heightened geopolitical uncertainty. U.S. equities generally benefited from resilient corporate earnings and economic growth, while fixed income markets experienced periodic volatility as the interest rate outlook continued to be reassessed.
■
Given the Fund is comprised of equities, fixed income, and non-traditional assets, performance saw a number of contributors to performance.
Across the asset classes included, the greatest level of performance was provided by emerging markets equity, commodities, and
U.S. small-cap equity, with returns of 36.4%, 35.5%, and 34.2%, respectively.
■
Given the Fund is comprised of equities, fixed income, and non-traditional assets, performance saw a number of detractors from performance.
Across the asset classes included, the lowest level of performance was provided by U.S. Treasury Inflation-Protected Securities,
U.S. aggregate bonds, and global REITs, with returns of 2.6%, 2.7%, and 17.7%, respectively.
■
The PGIM Target Date Funds do not use derivatives, although derivatives are used in some of the underlying funds.
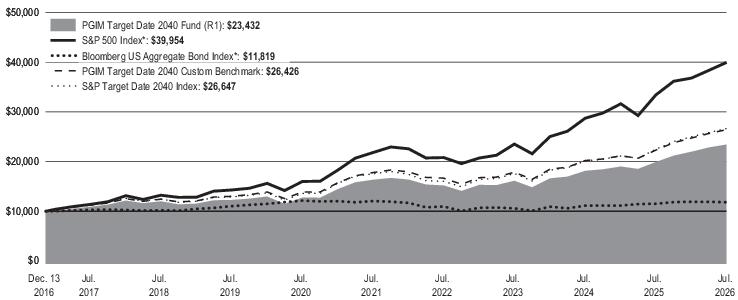
Average Annual Total Returns as of 7/31/2026 | |||
One Year (%) |
Five Years (%) |
Since Inception (%) | |
Class R1 |
17.72% |
7.47% |
9.24% (12/13/2016) |
S&P 500 Index* |
19.56% |
12.86% |
15.41% |
Bloomberg US Aggregate Bond Index* |
2.71% |
-0.40% |
1.74% |
PGIM Target Date 2040 Custom Benchmark |
18.43% |
8.23% |
10.58% |
S&P Target Date 2040 Index |
18.45% |
8.73% |
10.67% |
*The Fund compares its performance against this broad-based index in response to regulatory requirements.
WHAT ARE SOME KEY FUND STATISTICS AS OF 7/31/2026?
Fund’s net assets |
$39,166,280 |
Number of fund holdings |
11 |
Total advisory fees paid for the year |
$0 |
Portfolio turnover rate for the year |
55% |
WHAT ARE SOME CHARACTERISTICS OF THE FUND’S HOLDINGS AS OF 7/31/2026?
Investment Allocation |
% of Net Assets |
Affiliated Mutual Funds - Domestic Equity |
48.4% |
Affiliated Mutual Funds - International Equity |
27.3% |
Affiliated Mutual Funds - Fixed Income |
12.2% |
Affiliated Exchange-Traded Funds - Fixed Income |
12.0% |
Affiliated Mutual Fund - Short-Term Investment |
0.2% |
100.1% | |
Liabilities in excess of other assets |
(0.1)% |
100.0% |
WHAT WERE THE FUND COSTS FOR THE LAST YEAR?
(Based on a hypothetical $10,000 investment)
Costs of a $10,000 investment |
Costs paid as a percentage of a $10,000 investment | |
PGIM Target Date 2040 Fund—Class R2 |
$46 |
0.42% |
WHAT AFFECTED THE FUND’S PERFORMANCE DURING THE REPORTING PERIOD?
■ Despite some volatility across global markets in 2026, the past 12 months were influenced by evolving monetary policy expectations, persistent inflation concerns, and heightened geopolitical uncertainty. U.S. equities generally benefited from resilient corporate earnings and economic growth, while fixed income markets experienced periodic volatility as the interest rate outlook continued to be reassessed.
■
Given the Fund is comprised of equities, fixed income, and non-traditional assets, performance saw a number of contributors to performance.
Across the asset classes included, the greatest level of performance was provided by emerging markets equity, commodities, and
U.S. small-cap equity, with returns of 36.4%, 35.5%, and 34.2%, respectively.
■
Given the Fund is comprised of equities, fixed income, and non-traditional assets, performance saw a number of detractors from performance.
Across the asset classes included, the lowest level of performance was provided by U.S. Treasury Inflation-Protected Securities,
U.S. aggregate bonds, and global REITs, with returns of 2.6%, 2.7%, and 17.7%, respectively.
■
The PGIM Target Date Funds do not use derivatives, although derivatives are used in some of the underlying funds.
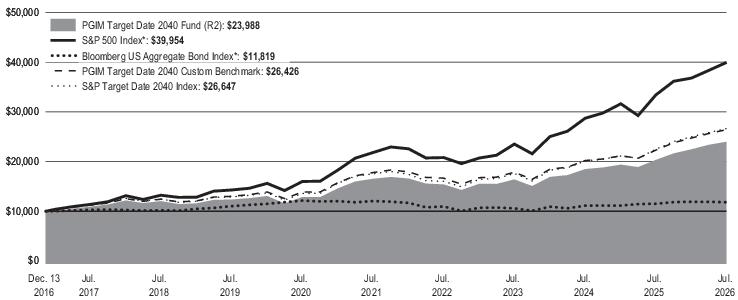
Average Annual Total Returns as of 7/31/2026 | |||
One Year (%) |
Five Years (%) |
Since Inception (%) | |
Class R2 |
17.97% |
7.73% |
9.51% (12/13/2016) |
S&P 500 Index* |
19.56% |
12.86% |
15.41% |
Bloomberg US Aggregate Bond Index* |
2.71% |
-0.40% |
1.74% |
PGIM Target Date 2040 Custom Benchmark |
18.43% |
8.23% |
10.58% |
S&P Target Date 2040 Index |
18.45% |
8.73% |
10.67% |
*The Fund compares its performance against this broad-based index in response to regulatory requirements.
WHAT ARE SOME KEY FUND STATISTICS AS OF 7/31/2026?
Fund’s net assets |
$39,166,280 |
Number of fund holdings |
11 |
Total advisory fees paid for the year |
$0 |
Portfolio turnover rate for the year |
55% |
WHAT ARE SOME CHARACTERISTICS OF THE FUND’S HOLDINGS AS OF 7/31/2026?
Investment Allocation |
% of Net Assets |
Affiliated Mutual Funds - Domestic Equity |
48.4% |
Affiliated Mutual Funds - International Equity |
27.3% |
Affiliated Mutual Funds - Fixed Income |
12.2% |
Affiliated Exchange-Traded Funds - Fixed Income |
12.0% |
Affiliated Mutual Fund - Short-Term Investment |
0.2% |
100.1% | |
Liabilities in excess of other assets |
(0.1)% |
100.0% |
WHAT WERE THE FUND COSTS FOR THE LAST YEAR?
(Based on a hypothetical $10,000 investment)
Costs of a $10,000 investment |
Costs paid as a percentage of a $10,000 investment | |
PGIM Target Date 2040 Fund—Class R3 |
$29 |
0.27% |
WHAT AFFECTED THE FUND’S PERFORMANCE DURING THE REPORTING PERIOD?
■ Despite some volatility across global markets in 2026, the past 12 months were influenced by evolving monetary policy expectations, persistent inflation concerns, and heightened geopolitical uncertainty. U.S. equities generally benefited from resilient corporate earnings and economic growth, while fixed income markets experienced periodic volatility as the interest rate outlook continued to be reassessed.
■
Given the Fund is comprised of equities, fixed income, and non-traditional assets, performance saw a number of contributors to performance.
Across the asset classes included, the greatest level of performance was provided by emerging markets equity, commodities, and
U.S. small-cap equity, with returns of 36.4%, 35.5%, and 34.2%, respectively.
■
Given the Fund is comprised of equities, fixed income, and non-traditional assets, performance saw a number of detractors from performance.
Across the asset classes included, the lowest level of performance was provided by U.S. Treasury Inflation-Protected Securities,
U.S. aggregate bonds, and global REITs, with returns of 2.6%, 2.7%, and 17.7%, respectively.
■
The PGIM Target Date Funds do not use derivatives, although derivatives are used in some of the underlying funds.
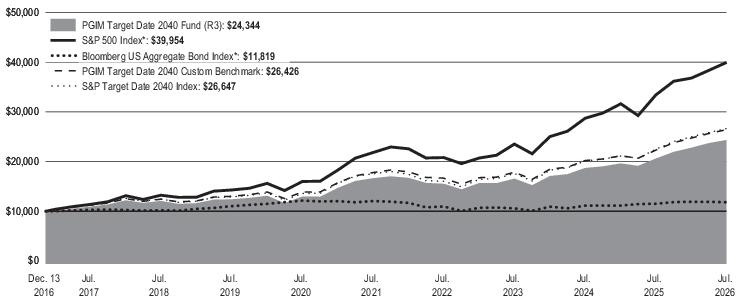
Average Annual Total Returns as of 7/31/2026 | |||
One Year (%) |
Five Years (%) |
Since Inception (%) | |
Class R3 |
18.11% |
7.90% |
9.68% (12/13/2016) |
S&P 500 Index* |
19.56% |
12.86% |
15.41% |
Bloomberg US Aggregate Bond Index* |
2.71% |
-0.40% |
1.74% |
PGIM Target Date 2040 Custom Benchmark |
18.43% |
8.23% |
10.58% |
S&P Target Date 2040 Index |
18.45% |
8.73% |
10.67% |
*The Fund compares its performance against this broad-based index in response to regulatory requirements.
WHAT ARE SOME KEY FUND STATISTICS AS OF 7/31/2026?
Fund’s net assets |
$39,166,280 |
Number of fund holdings |
11 |
Total advisory fees paid for the year |
$0 |
Portfolio turnover rate for the year |
55% |
WHAT ARE SOME CHARACTERISTICS OF THE FUND’S HOLDINGS AS OF 7/31/2026?
Investment Allocation |
% of Net Assets |
Affiliated Mutual Funds - Domestic Equity |
48.4% |
Affiliated Mutual Funds - International Equity |
27.3% |
Affiliated Mutual Funds - Fixed Income |
12.2% |
Affiliated Exchange-Traded Funds - Fixed Income |
12.0% |
Affiliated Mutual Fund - Short-Term Investment |
0.2% |
100.1% | |
Liabilities in excess of other assets |
(0.1)% |
100.0% |
WHAT WERE THE FUND COSTS FOR THE LAST YEAR?
(Based on a hypothetical $10,000 investment)
Costs of a $10,000 investment |
Costs paid as a percentage of a $10,000 investment | |
PGIM Target Date 2040 Fund—Class R4 |
$19 |
0.17% |
WHAT AFFECTED THE FUND’S PERFORMANCE DURING THE REPORTING PERIOD?
■ Despite some volatility across global markets in 2026, the past 12 months were influenced by evolving monetary policy expectations, persistent inflation concerns, and heightened geopolitical uncertainty. U.S. equities generally benefited from resilient corporate earnings and economic growth, while fixed income markets experienced periodic volatility as the interest rate outlook continued to be reassessed.
■
Given the Fund is comprised of equities, fixed income, and non-traditional assets, performance saw a number of contributors to performance.
Across the asset classes included, the greatest level of performance was provided by emerging markets equity, commodities, and
U.S. small-cap equity, with returns of 36.4%, 35.5%, and 34.2%, respectively.
■
Given the Fund is comprised of equities, fixed income, and non-traditional assets, performance saw a number of detractors from performance.
Across the asset classes included, the lowest level of performance was provided by U.S. Treasury Inflation-Protected Securities,
U.S. aggregate bonds, and global REITs, with returns of 2.6%, 2.7%, and 17.7%, respectively.
■
The PGIM Target Date Funds do not use derivatives, although derivatives are used in some of the underlying funds.
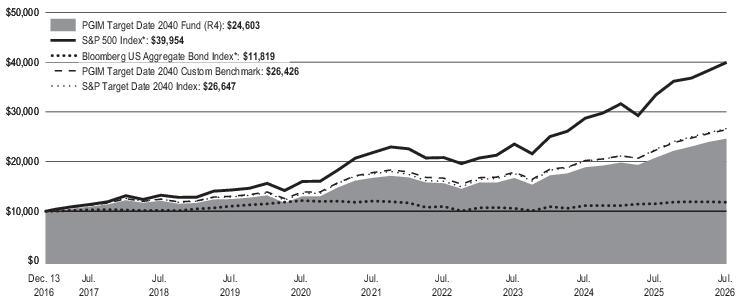
Average Annual Total Returns as of 7/31/2026 | |||
One Year (%) |
Five Years (%) |
Since Inception (%) | |
Class R4 |
18.37% |
8.02% |
9.80% (12/13/2016) |
S&P 500 Index* |
19.56% |
12.86% |
15.41% |
Bloomberg US Aggregate Bond Index* |
2.71% |
-0.40% |
1.74% |
PGIM Target Date 2040 Custom Benchmark |
18.43% |
8.23% |
10.58% |
S&P Target Date 2040 Index |
18.45% |
8.73% |
10.67% |
*The Fund compares its performance against this broad-based index in response to regulatory requirements.
WHAT ARE SOME KEY FUND STATISTICS AS OF 7/31/2026?
Fund’s net assets |
$39,166,280 |
Number of fund holdings |
11 |
Total advisory fees paid for the year |
$0 |
Portfolio turnover rate for the year |
55% |
WHAT ARE SOME CHARACTERISTICS OF THE FUND’S HOLDINGS AS OF 7/31/2026?
Investment Allocation |
% of Net Assets |
Affiliated Mutual Funds - Domestic Equity |
48.4% |
Affiliated Mutual Funds - International Equity |
27.3% |
Affiliated Mutual Funds - Fixed Income |
12.2% |
Affiliated Exchange-Traded Funds - Fixed Income |
12.0% |
Affiliated Mutual Fund - Short-Term Investment |
0.2% |
100.1% | |
Liabilities in excess of other assets |
(0.1)% |
100.0% |
WHAT WERE THE FUND COSTS FOR THE LAST YEAR?
(Based on a hypothetical $10,000 investment)
Costs of a $10,000 investment |
Costs paid as a percentage of a $10,000 investment | |
PGIM Target Date 2040 Fund—Class R5 |
$8 |
0.07% |
WHAT AFFECTED THE FUND’S PERFORMANCE DURING THE REPORTING PERIOD?
■ Despite some volatility across global markets in 2026, the past 12 months were influenced by evolving monetary policy expectations, persistent inflation concerns, and heightened geopolitical uncertainty. U.S. equities generally benefited from resilient corporate earnings and economic growth, while fixed income markets experienced periodic volatility as the interest rate outlook continued to be reassessed.
■
Given the Fund is comprised of equities, fixed income, and non-traditional assets, performance saw a number of contributors to performance.
Across the asset classes included, the greatest level of performance was provided by emerging markets equity, commodities, and
U.S. small-cap equity, with returns of 36.4%, 35.5%, and 34.2%, respectively.
■
Given the Fund is comprised of equities, fixed income, and non-traditional assets, performance saw a number of detractors from performance.
Across the asset classes included, the lowest level of performance was provided by U.S. Treasury Inflation-Protected Securities,
U.S. aggregate bonds, and global REITs, with returns of 2.6%, 2.7%, and 17.7%, respectively.
■
The PGIM Target Date Funds do not use derivatives, although derivatives are used in some of the underlying funds.
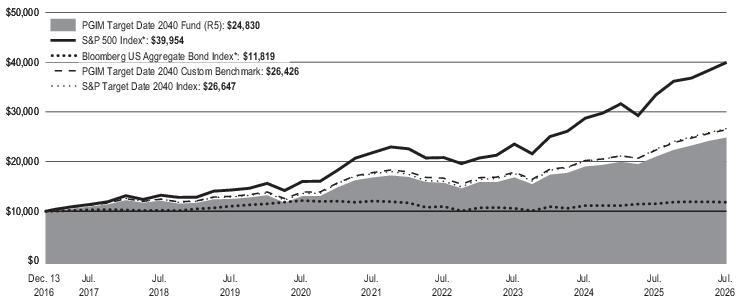
Average Annual Total Returns as of 7/31/2026 | |||
One Year (%) |
Five Years (%) |
Since Inception (%) | |
Class R5 |
18.37% |
8.12% |
9.90% (12/13/2016) |
S&P 500 Index* |
19.56% |
12.86% |
15.41% |
Bloomberg US Aggregate Bond Index* |
2.71% |
-0.40% |
1.74% |
PGIM Target Date 2040 Custom Benchmark |
18.43% |
8.23% |
10.58% |
S&P Target Date 2040 Index |
18.45% |
8.73% |
10.67% |
*The Fund compares its performance against this broad-based index in response to regulatory requirements.
WHAT ARE SOME KEY FUND STATISTICS AS OF 7/31/2026?
Fund’s net assets |
$39,166,280 |
Number of fund holdings |
11 |
Total advisory fees paid for the year |
$0 |
Portfolio turnover rate for the year |
55% |
WHAT ARE SOME CHARACTERISTICS OF THE FUND’S HOLDINGS AS OF 7/31/2026?
Investment Allocation |
% of Net Assets |
Affiliated Mutual Funds - Domestic Equity |
48.4% |
Affiliated Mutual Funds - International Equity |
27.3% |
Affiliated Mutual Funds - Fixed Income |
12.2% |
Affiliated Exchange-Traded Funds - Fixed Income |
12.0% |
Affiliated Mutual Fund - Short-Term Investment |
0.2% |
100.1% | |
Liabilities in excess of other assets |
(0.1)% |
100.0% |
This annual shareholder report contains important information about the Class R6 shares of PGIM Target Date 2040 Fund (the “Fund”) for the period of August 1, 2025 to July 31, 2026.
You can find additional information about the Fund at pgim.com/investments/target-date-prospectuses-and-fact-sheets. You can also request this information by contacting us at (800) 225-1852 or (973) 367-3529 from outside the U.S.
WHAT WERE THE FUND COSTS FOR THE LAST YEAR?
(Based on a hypothetical $10,000 investment)
Costs of a $10,000 investment |
Costs paid as a percentage of a $10,000 investment | |
PGIM Target Date 2040 Fund—Class R6 |
$0 |
0.00% |
WHAT AFFECTED THE FUND’S PERFORMANCE DURING THE REPORTING PERIOD?
■ Despite some volatility across global markets in 2026, the past 12 months were influenced by evolving monetary policy expectations, persistent inflation concerns, and heightened geopolitical uncertainty. U.S. equities generally benefited from resilient corporate earnings and economic growth, while fixed income markets experienced periodic volatility as the interest rate outlook continued to be reassessed.
■
Given the Fund is comprised of equities, fixed income, and non-traditional assets, performance saw a number of contributors to performance.
Across the asset classes included, the greatest level of performance was provided by emerging markets equity, commodities, and
U.S. small-cap equity, with returns of 36.4%, 35.5%, and 34.2%, respectively.
■
Given the Fund is comprised of equities, fixed income, and non-traditional assets, performance saw a number of detractors from performance.
Across the asset classes included, the lowest level of performance was provided by U.S. Treasury Inflation-Protected Securities,
U.S. aggregate bonds, and global REITs, with returns of 2.6%, 2.7%, and 17.7%, respectively.
■
The PGIM Target Date Funds do not use derivatives, although derivatives are used in some of the underlying funds.
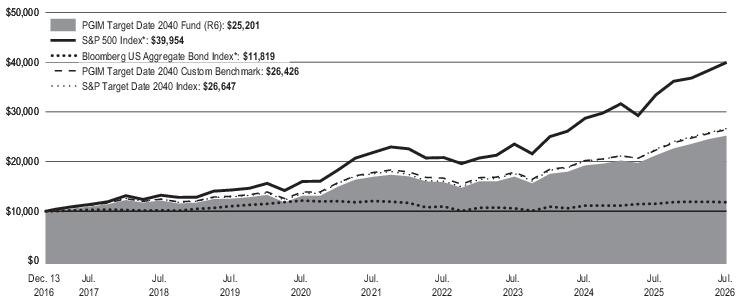
Average Annual Total Returns as of 7/31/2026 | |||
One Year (%) |
Five Years (%) |
Since Inception (%) | |
Class R6 |
18.59% |
8.29% |
10.07% (12/13/2016) |
S&P 500 Index* |
19.56% |
12.86% |
15.41% |
Bloomberg US Aggregate Bond Index* |
2.71% |
-0.40% |
1.74% |
PGIM Target Date 2040 Custom Benchmark |
18.43% |
8.23% |
10.58% |
S&P Target Date 2040 Index |
18.45% |
8.73% |
10.67% |
*The Fund compares its performance against this broad-based index in response to regulatory requirements.
WHAT ARE SOME KEY FUND STATISTICS AS OF 7/31/2026?
Fund’s net assets |
$39,166,280 |
Number of fund holdings |
11 |
Total advisory fees paid for the year |
$0 |
Portfolio turnover rate for the year |
55% |
WHAT ARE SOME CHARACTERISTICS OF THE FUND’S HOLDINGS AS OF 7/31/2026?
Investment Allocation |
% of Net Assets |
Affiliated Mutual Funds - Domestic Equity |
48.4% |
Affiliated Mutual Funds - International Equity |
27.3% |
Affiliated Mutual Funds - Fixed Income |
12.2% |
Affiliated Exchange-Traded Funds - Fixed Income |
12.0% |
Affiliated Mutual Fund - Short-Term Investment |
0.2% |
100.1% | |
Liabilities in excess of other assets |
(0.1)% |
100.0% |
WHAT WERE THE FUND COSTS FOR THE LAST YEAR?
(Based on a hypothetical $10,000 investment)
Costs of a $10,000 investment |
Costs paid as a percentage of a $10,000 investment | |
PGIM Target Date 2045 Fund—Class R1 |
$72 |
0.66% |
WHAT AFFECTED THE FUND’S PERFORMANCE DURING THE REPORTING PERIOD?
■ Despite some volatility across global markets in 2026, the past 12 months were influenced by evolving monetary policy expectations, persistent inflation concerns, and heightened geopolitical uncertainty. U.S. equities generally benefited from resilient corporate earnings and economic growth, while fixed income markets experienced periodic volatility as the interest rate outlook continued to be reassessed.
■
Given the Fund is comprised of equities, fixed income, and non-traditional assets, performance saw a number of contributors to performance.
Across the asset classes included, the greatest level of performance was provided by emerging markets equity, commodities, and
U.S. small-cap equity, with returns of 36.4%, 35.5%, and 34.2%, respectively.
■
Given the Fund is comprised of equities, fixed income, and non-traditional assets, performance saw a number of detractors from performance.
Across the asset classes included, the lowest level of performance was provided by U.S. Treasury Inflation-Protected Securities,
U.S. aggregate bonds, and global REITs, with returns of 2.6%, 2.7%, and 17.7%, respectively.
■
The PGIM Target Date Funds do not use derivatives, although derivatives are used in some of the underlying funds.
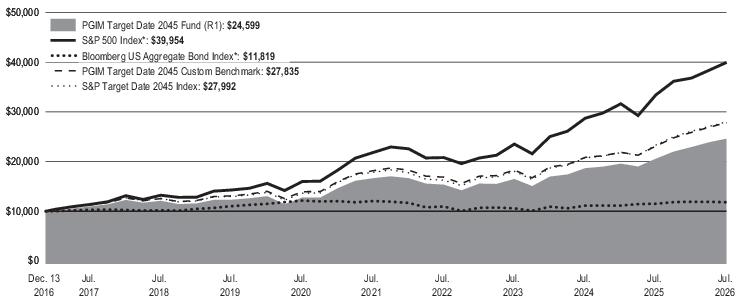
Average Annual Total Returns as of 7/31/2026 | |||
One Year (%) |
Five Years (%) |
Since Inception (%) | |
Class R1 |
19.57% |
8.13% |
9.79% (12/13/2016) |
S&P 500 Index* |
19.56% |
12.86% |
15.41% |
Bloomberg US Aggregate Bond Index* |
2.71% |
-0.40% |
1.74% |
PGIM Target Date 2045 Custom Benchmark |
20.29% |
8.92% |
11.17% |
S&P Target Date 2045 Index |
19.99% |
9.45% |
11.24% |
*The Fund compares its performance against this broad-based index in response to regulatory requirements.
WHAT ARE SOME KEY FUND STATISTICS AS OF 7/31/2026?
Fund’s net assets |
$35,391,193 |
Number of fund holdings |
11 |
Total advisory fees paid for the year |
$0 |
Portfolio turnover rate for the year |
50% |
WHAT ARE SOME CHARACTERISTICS OF THE FUND’S HOLDINGS AS OF 7/31/2026?
Investment Allocation |
% of Net Assets |
Affiliated Mutual Funds - Domestic Equity |
53.4% |
Affiliated Mutual Funds - International Equity |
31.3% |
Affiliated Exchange-Traded Funds - Fixed Income |
8.7% |
Affiliated Mutual Funds - Fixed Income |
6.5% |
Affiliated Mutual Fund - Short-Term Investment |
0.2% |
100.1% | |
Liabilities in excess of other assets |
(0.1)% |
100.0% |
WHAT WERE THE FUND COSTS FOR THE LAST YEAR?
(Based on a hypothetical $10,000 investment)
Costs of a $10,000 investment |
Costs paid as a percentage of a $10,000 investment | |
PGIM Target Date 2045 Fund—Class R2 |
$45 |
0.41% |
WHAT AFFECTED THE FUND’S PERFORMANCE DURING THE REPORTING PERIOD?
■ Despite some volatility across global markets in 2026, the past 12 months were influenced by evolving monetary policy expectations, persistent inflation concerns, and heightened geopolitical uncertainty. U.S. equities generally benefited from resilient corporate earnings and economic growth, while fixed income markets experienced periodic volatility as the interest rate outlook continued to be reassessed.
■
Given the Fund is comprised of equities, fixed income, and non-traditional assets, performance saw a number of contributors to performance.
Across the asset classes included, the greatest level of performance was provided by emerging markets equity, commodities, and
U.S. small-cap equity, with returns of 36.4%, 35.5%, and 34.2%, respectively.
■
Given the Fund is comprised of equities, fixed income, and non-traditional assets, performance saw a number of detractors from performance.
Across the asset classes included, the lowest level of performance was provided by U.S. Treasury Inflation-Protected Securities,
U.S. aggregate bonds, and global REITs, with returns of 2.6%, 2.7%, and 17.7%, respectively.
■
The PGIM Target Date Funds do not use derivatives, although derivatives are used in some of the underlying funds.
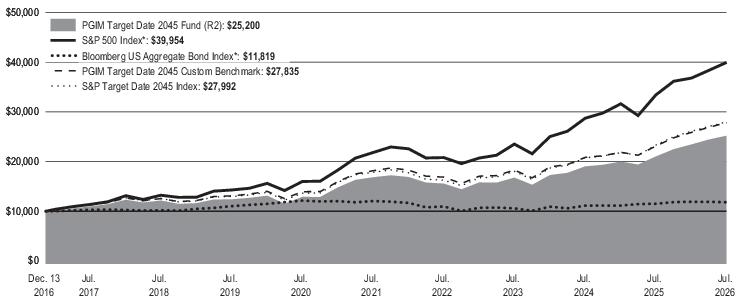
Average Annual Total Returns as of 7/31/2026 | |||
One Year (%) |
Five Years (%) |
Since Inception (%) | |
Class R2 |
19.87% |
8.39% |
10.07% (12/13/2016) |
S&P 500 Index* |
19.56% |
12.86% |
15.41% |
Bloomberg US Aggregate Bond Index* |
2.71% |
-0.40% |
1.74% |
PGIM Target Date 2045 Custom Benchmark |
20.29% |
8.92% |
11.17% |
S&P Target Date 2045 Index |
19.99% |
9.45% |
11.24% |
*The Fund compares its performance against this broad-based index in response to regulatory requirements.
WHAT ARE SOME KEY FUND STATISTICS AS OF 7/31/2026?
Fund’s net assets |
$35,391,193 |
Number of fund holdings |
11 |
Total advisory fees paid for the year |
$0 |
Portfolio turnover rate for the year |
50% |
WHAT ARE SOME CHARACTERISTICS OF THE FUND’S HOLDINGS AS OF 7/31/2026?
Investment Allocation |
% of Net Assets |
Affiliated Mutual Funds - Domestic Equity |
53.4% |
Affiliated Mutual Funds - International Equity |
31.3% |
Affiliated Exchange-Traded Funds - Fixed Income |
8.7% |
Affiliated Mutual Funds - Fixed Income |
6.5% |
Affiliated Mutual Fund - Short-Term Investment |
0.2% |
100.1% | |
Liabilities in excess of other assets |
(0.1)% |
100.0% |
WHAT WERE THE FUND COSTS FOR THE LAST YEAR?
(Based on a hypothetical $10,000 investment)
Costs of a $10,000 investment |
Costs paid as a percentage of a $10,000 investment | |
PGIM Target Date 2045 Fund—Class R3 |
$30 |
0.27% |
WHAT AFFECTED THE FUND’S PERFORMANCE DURING THE REPORTING PERIOD?
■ Despite some volatility across global markets in 2026, the past 12 months were influenced by evolving monetary policy expectations, persistent inflation concerns, and heightened geopolitical uncertainty. U.S. equities generally benefited from resilient corporate earnings and economic growth, while fixed income markets experienced periodic volatility as the interest rate outlook continued to be reassessed.
■
Given the Fund is comprised of equities, fixed income, and non-traditional assets, performance saw a number of contributors to performance.
Across the asset classes included, the greatest level of performance was provided by emerging markets equity, commodities, and
U.S. small-cap equity, with returns of 36.4%, 35.5%, and 34.2%, respectively.
■
Given the Fund is comprised of equities, fixed income, and non-traditional assets, performance saw a number of detractors from performance.
Across the asset classes included, the lowest level of performance was provided by U.S. Treasury Inflation-Protected Securities,
U.S. aggregate bonds, and global REITs, with returns of 2.6%, 2.7%, and 17.7%, respectively.
■
The PGIM Target Date Funds do not use derivatives, although derivatives are used in some of the underlying funds.
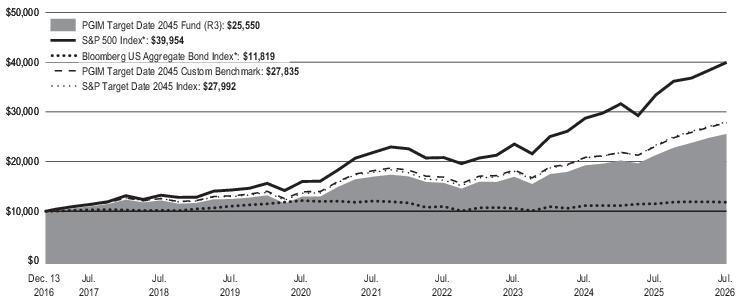
Average Annual Total Returns as of 7/31/2026 | |||
One Year (%) |
Five Years (%) |
Since Inception (%) | |
Class R3 |
19.98% |
8.55% |
10.23% (12/13/2016) |
S&P 500 Index* |
19.56% |
12.86% |
15.41% |
Bloomberg US Aggregate Bond Index* |
2.71% |
-0.40% |
1.74% |
PGIM Target Date 2045 Custom Benchmark |
20.29% |
8.92% |
11.17% |
S&P Target Date 2045 Index |
19.99% |
9.45% |
11.24% |
*The Fund compares its performance against this broad-based index in response to regulatory requirements.
WHAT ARE SOME KEY FUND STATISTICS AS OF 7/31/2026?
Fund’s net assets |
$35,391,193 |
Number of fund holdings |
11 |
Total advisory fees paid for the year |
$0 |
Portfolio turnover rate for the year |
50% |
WHAT ARE SOME CHARACTERISTICS OF THE FUND’S HOLDINGS AS OF 7/31/2026?
Investment Allocation |
% of Net Assets |
Affiliated Mutual Funds - Domestic Equity |
53.4% |
Affiliated Mutual Funds - International Equity |
31.3% |
Affiliated Exchange-Traded Funds - Fixed Income |
8.7% |
Affiliated Mutual Funds - Fixed Income |
6.5% |
Affiliated Mutual Fund - Short-Term Investment |
0.2% |
100.1% | |
Liabilities in excess of other assets |
(0.1)% |
100.0% |
WHAT WERE THE FUND COSTS FOR THE LAST YEAR?
(Based on a hypothetical $10,000 investment)
Costs of a $10,000 investment |
Costs paid as a percentage of a $10,000 investment | |
PGIM Target Date 2045 Fund—Class R4 |
$18 |
0.16% |
WHAT AFFECTED THE FUND’S PERFORMANCE DURING THE REPORTING PERIOD?
■ Despite some volatility across global markets in 2026, the past 12 months were influenced by evolving monetary policy expectations, persistent inflation concerns, and heightened geopolitical uncertainty. U.S. equities generally benefited from resilient corporate earnings and economic growth, while fixed income markets experienced periodic volatility as the interest rate outlook continued to be reassessed.
■
Given the Fund is comprised of equities, fixed income, and non-traditional assets, performance saw a number of contributors to performance.
Across the asset classes included, the greatest level of performance was provided by emerging markets equity, commodities, and
U.S. small-cap equity, with returns of 36.4%, 35.5%, and 34.2%, respectively.
■
Given the Fund is comprised of equities, fixed income, and non-traditional assets, performance saw a number of detractors from performance.
Across the asset classes included, the lowest level of performance was provided by U.S. Treasury Inflation-Protected Securities,
U.S. aggregate bonds, and global REITs, with returns of 2.6%, 2.7%, and 17.7%, respectively.
■
The PGIM Target Date Funds do not use derivatives, although derivatives are used in some of the underlying funds.
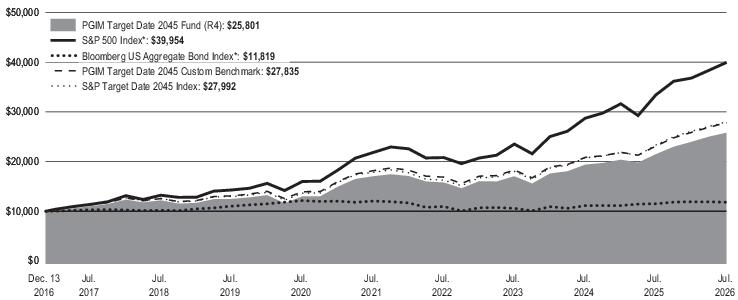
Average Annual Total Returns as of 7/31/2026 | |||
One Year (%) |
Five Years (%) |
Since Inception (%) | |
Class R4 |
20.12% |
8.66% |
10.34% (12/13/2016) |
S&P 500 Index* |
19.56% |
12.86% |
15.41% |
Bloomberg US Aggregate Bond Index* |
2.71% |
-0.40% |
1.74% |
PGIM Target Date 2045 Custom Benchmark |
20.29% |
8.92% |
11.17% |
S&P Target Date 2045 Index |
19.99% |
9.45% |
11.24% |
*The Fund compares its performance against this broad-based index in response to regulatory requirements.
WHAT ARE SOME KEY FUND STATISTICS AS OF 7/31/2026?
Fund’s net assets |
$35,391,193 |
Number of fund holdings |
11 |
Total advisory fees paid for the year |
$0 |
Portfolio turnover rate for the year |
50% |
WHAT ARE SOME CHARACTERISTICS OF THE FUND’S HOLDINGS AS OF 7/31/2026?
Investment Allocation |
% of Net Assets |
Affiliated Mutual Funds - Domestic Equity |
53.4% |
Affiliated Mutual Funds - International Equity |
31.3% |
Affiliated Exchange-Traded Funds - Fixed Income |
8.7% |
Affiliated Mutual Funds - Fixed Income |
6.5% |
Affiliated Mutual Fund - Short-Term Investment |
0.2% |
100.1% | |
Liabilities in excess of other assets |
(0.1)% |
100.0% |
WHAT WERE THE FUND COSTS FOR THE LAST YEAR?
(Based on a hypothetical $10,000 investment)
Costs of a $10,000 investment |
Costs paid as a percentage of a $10,000 investment | |
PGIM Target Date 2045 Fund—Class R5 |
$7 |
0.06% |
WHAT AFFECTED THE FUND’S PERFORMANCE DURING THE REPORTING PERIOD?
■ Despite some volatility across global markets in 2026, the past 12 months were influenced by evolving monetary policy expectations, persistent inflation concerns, and heightened geopolitical uncertainty. U.S. equities generally benefited from resilient corporate earnings and economic growth, while fixed income markets experienced periodic volatility as the interest rate outlook continued to be reassessed.
■
Given the Fund is comprised of equities, fixed income, and non-traditional assets, performance saw a number of contributors to performance.
Across the asset classes included, the greatest level of performance was provided by emerging markets equity, commodities, and
U.S. small-cap equity, with returns of 36.4%, 35.5%, and 34.2%, respectively.
■
Given the Fund is comprised of equities, fixed income, and non-traditional assets, performance saw a number of detractors from performance.
Across the asset classes included, the lowest level of performance was provided by U.S. Treasury Inflation-Protected Securities,
U.S. aggregate bonds, and global REITs, with returns of 2.6%, 2.7%, and 17.7%, respectively.
■
The PGIM Target Date Funds do not use derivatives, although derivatives are used in some of the underlying funds.
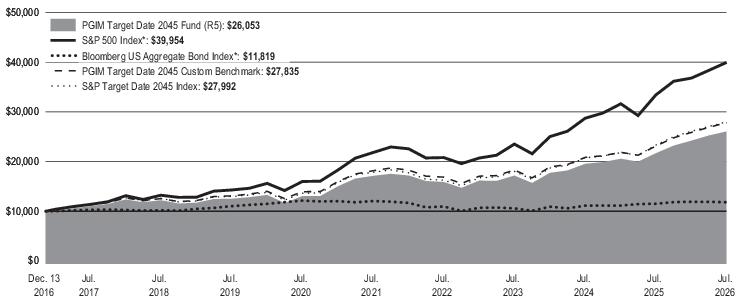
Average Annual Total Returns as of 7/31/2026 | |||
One Year (%) |
Five Years (%) |
Since Inception (%) | |
Class R5 |
20.18% |
8.76% |
10.45% (12/13/2016) |
S&P 500 Index* |
19.56% |
12.86% |
15.41% |
Bloomberg US Aggregate Bond Index* |
2.71% |
-0.40% |
1.74% |
PGIM Target Date 2045 Custom Benchmark |
20.29% |
8.92% |
11.17% |
S&P Target Date 2045 Index |
19.99% |
9.45% |
11.24% |
*The Fund compares its performance against this broad-based index in response to regulatory requirements.
WHAT ARE SOME KEY FUND STATISTICS AS OF 7/31/2026?
Fund’s net assets |
$35,391,193 |
Number of fund holdings |
11 |
Total advisory fees paid for the year |
$0 |
Portfolio turnover rate for the year |
50% |
WHAT ARE SOME CHARACTERISTICS OF THE FUND’S HOLDINGS AS OF 7/31/2026?
Investment Allocation |
% of Net Assets |
Affiliated Mutual Funds - Domestic Equity |
53.4% |
Affiliated Mutual Funds - International Equity |
31.3% |
Affiliated Exchange-Traded Funds - Fixed Income |
8.7% |
Affiliated Mutual Funds - Fixed Income |
6.5% |
Affiliated Mutual Fund - Short-Term Investment |
0.2% |
100.1% | |
Liabilities in excess of other assets |
(0.1)% |
100.0% |
WHAT WERE THE FUND COSTS FOR THE LAST YEAR?
(Based on a hypothetical $10,000 investment)
Costs of a $10,000 investment |
Costs paid as a percentage of a $10,000 investment | |
PGIM Target Date 2045 Fund—Class R6 |
$0 |
0.00% |
WHAT AFFECTED THE FUND’S PERFORMANCE DURING THE REPORTING PERIOD?
■ Despite some volatility across global markets in 2026, the past 12 months were influenced by evolving monetary policy expectations, persistent inflation concerns, and heightened geopolitical uncertainty. U.S. equities generally benefited from resilient corporate earnings and economic growth, while fixed income markets experienced periodic volatility as the interest rate outlook continued to be reassessed.
■
Given the Fund is comprised of equities, fixed income, and non-traditional assets, performance saw a number of contributors to performance.
Across the asset classes included, the greatest level of performance was provided by emerging markets equity, commodities, and
U.S. small-cap equity, with returns of 36.4%, 35.5%, and 34.2%, respectively.
■
Given the Fund is comprised of equities, fixed income, and non-traditional assets, performance saw a number of detractors from performance.
Across the asset classes included, the lowest level of performance was provided by U.S. Treasury Inflation-Protected Securities,
U.S. aggregate bonds, and global REITs, with returns of 2.6%, 2.7%, and 17.7%, respectively.
■
The PGIM Target Date Funds do not use derivatives, although derivatives are used in some of the underlying funds.
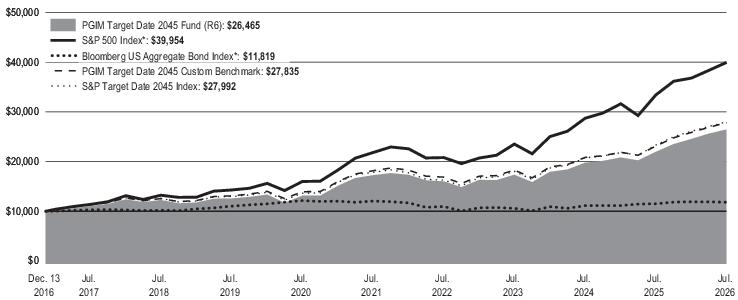
Average Annual Total Returns as of 7/31/2026 | |||
One Year (%) |
Five Years (%) |
Since Inception (%) | |
Class R6 |
20.46% |
8.93% |
10.63% (12/13/2016) |
S&P 500 Index* |
19.56% |
12.86% |
15.41% |
Bloomberg US Aggregate Bond Index* |
2.71% |
-0.40% |
1.74% |
PGIM Target Date 2045 Custom Benchmark |
20.29% |
8.92% |
11.17% |
S&P Target Date 2045 Index |
19.99% |
9.45% |
11.24% |
*The Fund compares its performance against this broad-based index in response to regulatory requirements.
WHAT ARE SOME KEY FUND STATISTICS AS OF 7/31/2026?
Fund’s net assets |
$35,391,193 |
Number of fund holdings |
11 |
Total advisory fees paid for the year |
$0 |
Portfolio turnover rate for the year |
50% |
WHAT ARE SOME CHARACTERISTICS OF THE FUND’S HOLDINGS AS OF 7/31/2026?
Investment Allocation |
% of Net Assets |
Affiliated Mutual Funds - Domestic Equity |
53.4% |
Affiliated Mutual Funds - International Equity |
31.3% |
Affiliated Exchange-Traded Funds - Fixed Income |
8.7% |
Affiliated Mutual Funds - Fixed Income |
6.5% |
Affiliated Mutual Fund - Short-Term Investment |
0.2% |
100.1% | |
Liabilities in excess of other assets |
(0.1)% |
100.0% |
WHAT WERE THE FUND COSTS FOR THE LAST YEAR?
(Based on a hypothetical $10,000 investment)
Costs of a $10,000 investment |
Costs paid as a percentage of a $10,000 investment | |
PGIM Target Date 2050 Fund—Class R1 |
$74 |
0.67% |
WHAT AFFECTED THE FUND’S PERFORMANCE DURING THE REPORTING PERIOD?
■ Despite some volatility across global markets in 2026, the past 12 months were influenced by evolving monetary policy expectations, persistent inflation concerns, and heightened geopolitical uncertainty. U.S. equities generally benefited from resilient corporate earnings and economic growth, while fixed income markets experienced periodic volatility as the interest rate outlook continued to be reassessed.
■
Given the Fund is comprised of equities, fixed income, and non-traditional assets, performance saw a number of contributors to performance.
Across the asset classes included, the greatest level of performance was provided by emerging markets equity, commodities, and
U.S. small-cap equity, with returns of 36.4%, 35.5%, and 34.2%, respectively.
■
Given the Fund is comprised of equities, fixed income, and non-traditional assets, performance saw a number of detractors from performance.
Across the asset classes included, the lowest level of performance was provided by U.S. aggregate bonds, global REITs, and U.S. large-cap
equity, with returns of 2.7%, 17.7%, and 19.6%, respectively.
■
The PGIM Target Date Funds do not use derivatives, although derivatives are used in some of the underlying funds.
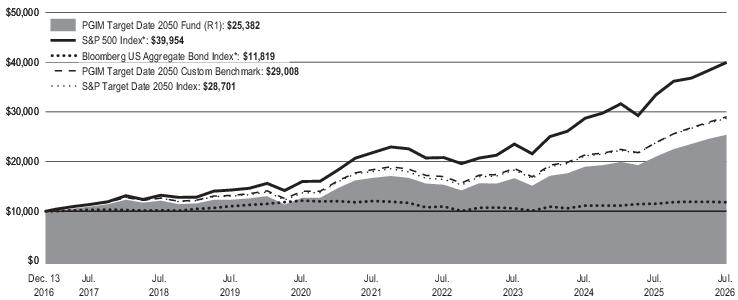
Average Annual Total Returns as of 7/31/2026 | |||
One Year (%) |
Five Years (%) |
Since Inception (%) | |
Class R1 |
21.00% |
8.72% |
10.15% (12/13/2016) |
S&P 500 Index* |
19.56% |
12.86% |
15.41% |
Bloomberg US Aggregate Bond Index* |
2.71% |
-0.40% |
1.74% |
PGIM Target Date 2050 Custom Benchmark |
21.77% |
9.56% |
11.65% |
S&P Target Date 2050 Index |
20.61% |
9.76% |
11.52% |
*The Fund compares its performance against this broad-based index in response to regulatory requirements.
WHAT ARE SOME KEY FUND STATISTICS AS OF 7/31/2026?
Fund’s net assets |
$21,239,323 |
Number of fund holdings |
9 |
Total advisory fees paid for the year |
$0 |
Portfolio turnover rate for the year |
59% |
WHAT ARE SOME CHARACTERISTICS OF THE FUND’S HOLDINGS AS OF 7/31/2026?
Investment Allocation |
% of Net Assets |
Affiliated Mutual Funds - Domestic Equity |
55.7% |
Affiliated Mutual Funds - International Equity |
34.8% |
Affiliated Exchange-Traded Funds - Fixed Income |
7.4% |
Affiliated Mutual Funds - Fixed Income |
2.0% |
Affiliated Mutual Fund - Short-Term Investment |
0.3% |
100.2% | |
Liabilities in excess of other assets |
(0.2)% |
100.0% |
WHAT WERE THE FUND COSTS FOR THE LAST YEAR?
(Based on a hypothetical $10,000 investment)
Costs of a $10,000 investment |
Costs paid as a percentage of a $10,000 investment | |
PGIM Target Date 2050 Fund—Class R2 |
$46 |
0.42% |
WHAT AFFECTED THE FUND’S PERFORMANCE DURING THE REPORTING PERIOD?
■ Despite some volatility across global markets in 2026, the past 12 months were influenced by evolving monetary policy expectations, persistent inflation concerns, and heightened geopolitical uncertainty. U.S. equities generally benefited from resilient corporate earnings and economic growth, while fixed income markets experienced periodic volatility as the interest rate outlook continued to be reassessed.
■
Given the Fund is comprised of equities, fixed income, and non-traditional assets, performance saw a number of contributors to performance.
Across the asset classes included, the greatest level of performance was provided by emerging markets equity, commodities, and
U.S. small-cap equity, with returns of 36.4%, 35.5%, and 34.2%, respectively.
■
Given the Fund is comprised of equities, fixed income, and non-traditional assets, performance saw a number of detractors from performance.
Across the asset classes included, the lowest level of performance was provided by U.S. aggregate bonds, global REITs, and U.S. large-cap
equity, with returns of 2.7%, 17.7%, and 19.6%, respectively.
■
The PGIM Target Date Funds do not use derivatives, although derivatives are used in some of the underlying funds.
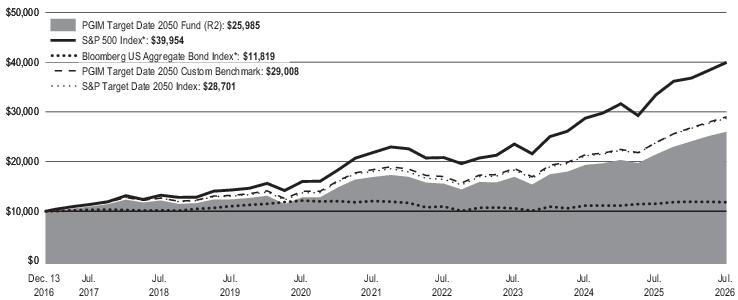
Average Annual Total Returns as of 7/31/2026 | |||
One Year (%) |
Five Years (%) |
Since Inception (%) | |
Class R2 |
21.29% |
9.00% |
10.42% (12/13/2016) |
S&P 500 Index* |
19.56% |
12.86% |
15.41% |
Bloomberg US Aggregate Bond Index* |
2.71% |
-0.40% |
1.74% |
PGIM Target Date 2050 Custom Benchmark |
21.77% |
9.56% |
11.65% |
S&P Target Date 2050 Index |
20.61% |
9.76% |
11.52% |
*The Fund compares its performance against this broad-based index in response to regulatory requirements.
WHAT ARE SOME KEY FUND STATISTICS AS OF 7/31/2026?
Fund’s net assets |
$21,239,323 |
Number of fund holdings |
9 |
Total advisory fees paid for the year |
$0 |
Portfolio turnover rate for the year |
59% |
WHAT ARE SOME CHARACTERISTICS OF THE FUND’S HOLDINGS AS OF 7/31/2026?
Investment Allocation |
% of Net Assets |
Affiliated Mutual Funds - Domestic Equity |
55.7% |
Affiliated Mutual Funds - International Equity |
34.8% |
Affiliated Exchange-Traded Funds - Fixed Income |
7.4% |
Affiliated Mutual Funds - Fixed Income |
2.0% |
Affiliated Mutual Fund - Short-Term Investment |
0.3% |
100.2% | |
Liabilities in excess of other assets |
(0.2)% |
100.0% |
WERE THERE ANY SIGNIFICANT CHANGES TO THE FUND THIS YEAR?
The following is a summary of certain changes to the Fund since August 1, 2025:
■ For the year ended July 31, 2026, total annual Fund operating expenses for Class R2 shares, after waivers and/or expense reimbursement, increased from 0.37% in the year ended July 31, 2025 to 0.42% primarily due to a decrease in the acquired fund fee and expense waiver.
For more complete information, you should review the Fund’s next prospectus, which we expect to be available by September 30, 2026 at pgim.com/mutual-fund-documents or by request at (800) 225-1852.
WHAT WERE THE FUND COSTS FOR THE LAST YEAR?
(Based on a hypothetical $10,000 investment)
Costs of a $10,000 investment |
Costs paid as a percentage of a $10,000 investment | |
PGIM Target Date 2050 Fund—Class R3 |
$30 |
0.27% |
WHAT AFFECTED THE FUND’S PERFORMANCE DURING THE REPORTING PERIOD?
■ Despite some volatility across global markets in 2026, the past 12 months were influenced by evolving monetary policy expectations, persistent inflation concerns, and heightened geopolitical uncertainty. U.S. equities generally benefited from resilient corporate earnings and economic growth, while fixed income markets experienced periodic volatility as the interest rate outlook continued to be reassessed.
■
Given the Fund is comprised of equities, fixed income, and non-traditional assets, performance saw a number of contributors to performance.
Across the asset classes included, the greatest level of performance was provided by emerging markets equity, commodities, and
U.S. small-cap equity, with returns of 36.4%, 35.5%, and 34.2%, respectively.
■
Given the Fund is comprised of equities, fixed income, and non-traditional assets, performance saw a number of detractors from performance.
Across the asset classes included, the lowest level of performance was provided by U.S. aggregate bonds, global REITs, and U.S. large-cap
equity, with returns of 2.7%, 17.7%, and 19.6%, respectively.
■
The PGIM Target Date Funds do not use derivatives, although derivatives are used in some of the underlying funds.
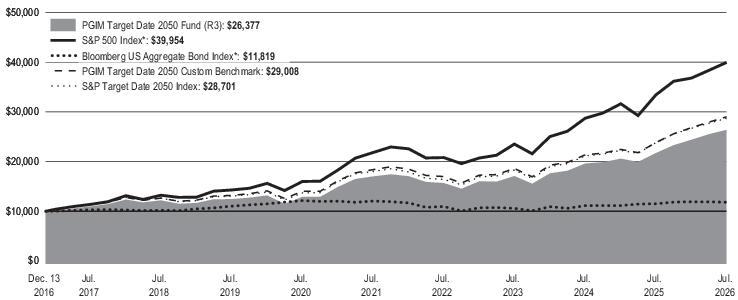
Average Annual Total Returns as of 7/31/2026 | |||
One Year (%) |
Five Years (%) |
Since Inception (%) | |
Class R3 |
21.52% |
9.16% |
10.59% (12/13/2016) |
S&P 500 Index* |
19.56% |
12.86% |
15.41% |
Bloomberg US Aggregate Bond Index* |
2.71% |
-0.40% |
1.74% |
PGIM Target Date 2050 Custom Benchmark |
21.77% |
9.56% |
11.65% |
S&P Target Date 2050 Index |
20.61% |
9.76% |
11.52% |
*The Fund compares its performance against this broad-based index in response to regulatory requirements.
WHAT ARE SOME KEY FUND STATISTICS AS OF 7/31/2026?
Fund’s net assets |
$21,239,323 |
Number of fund holdings |
9 |
Total advisory fees paid for the year |
$0 |
Portfolio turnover rate for the year |
59% |
WHAT ARE SOME CHARACTERISTICS OF THE FUND’S HOLDINGS AS OF 7/31/2026?
Investment Allocation |
% of Net Assets |
Affiliated Mutual Funds - Domestic Equity |
55.7% |
Affiliated Mutual Funds - International Equity |
34.8% |
Affiliated Exchange-Traded Funds - Fixed Income |
7.4% |
Affiliated Mutual Funds - Fixed Income |
2.0% |
Affiliated Mutual Fund - Short-Term Investment |
0.3% |
100.2% | |
Liabilities in excess of other assets |
(0.2)% |
100.0% |
WHAT WERE THE FUND COSTS FOR THE LAST YEAR?
(Based on a hypothetical $10,000 investment)
Costs of a $10,000 investment |
Costs paid as a percentage of a $10,000 investment | |
PGIM Target Date 2050 Fund—Class R4 |
$19 |
0.17% |
WHAT AFFECTED THE FUND’S PERFORMANCE DURING THE REPORTING PERIOD?
■ Despite some volatility across global markets in 2026, the past 12 months were influenced by evolving monetary policy expectations, persistent inflation concerns, and heightened geopolitical uncertainty. U.S. equities generally benefited from resilient corporate earnings and economic growth, while fixed income markets experienced periodic volatility as the interest rate outlook continued to be reassessed.
■
Given the Fund is comprised of equities, fixed income, and non-traditional assets, performance saw a number of contributors to performance.
Across the asset classes included, the greatest level of performance was provided by emerging markets equity, commodities, and
U.S. small-cap equity, with returns of 36.4%, 35.5%, and 34.2%, respectively.
■
Given the Fund is comprised of equities, fixed income, and non-traditional assets, performance saw a number of detractors from performance.
Across the asset classes included, the lowest level of performance was provided by U.S. aggregate bonds, global REITs, and U.S. large-cap
equity, with returns of 2.7%, 17.7%, and 19.6%, respectively.
■
The PGIM Target Date Funds do not use derivatives, although derivatives are used in some of the underlying funds.
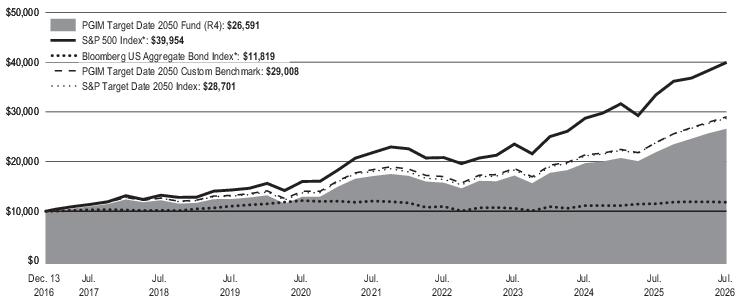
Average Annual Total Returns as of 7/31/2026 | |||
One Year (%) |
Five Years (%) |
Since Inception (%) | |
Class R4 |
21.61% |
9.27% |
10.69% (12/13/2016) |
S&P 500 Index* |
19.56% |
12.86% |
15.41% |
Bloomberg US Aggregate Bond Index* |
2.71% |
-0.40% |
1.74% |
PGIM Target Date 2050 Custom Benchmark |
21.77% |
9.56% |
11.65% |
S&P Target Date 2050 Index |
20.61% |
9.76% |
11.52% |
*The Fund compares its performance against this broad-based index in response to regulatory requirements.
WHAT ARE SOME KEY FUND STATISTICS AS OF 7/31/2026?
Fund’s net assets |
$21,239,323 |
Number of fund holdings |
9 |
Total advisory fees paid for the year |
$0 |
Portfolio turnover rate for the year |
59% |
WHAT ARE SOME CHARACTERISTICS OF THE FUND’S HOLDINGS AS OF 7/31/2026?
Investment Allocation |
% of Net Assets |
Affiliated Mutual Funds - Domestic Equity |
55.7% |
Affiliated Mutual Funds - International Equity |
34.8% |
Affiliated Exchange-Traded Funds - Fixed Income |
7.4% |
Affiliated Mutual Funds - Fixed Income |
2.0% |
Affiliated Mutual Fund - Short-Term Investment |
0.3% |
100.2% | |
Liabilities in excess of other assets |
(0.2)% |
100.0% |
WERE THERE ANY SIGNIFICANT CHANGES TO THE FUND THIS YEAR?
The following is a summary of certain changes to the Fund since August 1, 2025:
■ For the year ended July 31, 2026, total annual Fund operating expenses for Class R4 shares, after waivers and/or expense reimbursement, increased from 0.12% in the year ended July 31, 2025 to 0.17% primarily due to a decrease in the acquired fund fee and expense waiver.
For more complete information, you should review the Fund’s next prospectus, which we expect to be available by September 30, 2026 at pgim.com/mutual-fund-documents or by request at (800) 225-1852.
WHAT WERE THE FUND COSTS FOR THE LAST YEAR?
(Based on a hypothetical $10,000 investment)
Costs of a $10,000 investment |
Costs paid as a percentage of a $10,000 investment | |
PGIM Target Date 2050 Fund—Class R5 |
$7 |
0.06% |
WHAT AFFECTED THE FUND’S PERFORMANCE DURING THE REPORTING PERIOD?
■ Despite some volatility across global markets in 2026, the past 12 months were influenced by evolving monetary policy expectations, persistent inflation concerns, and heightened geopolitical uncertainty. U.S. equities generally benefited from resilient corporate earnings and economic growth, while fixed income markets experienced periodic volatility as the interest rate outlook continued to be reassessed.
■
Given the Fund is comprised of equities, fixed income, and non-traditional assets, performance saw a number of contributors to performance.
Across the asset classes included, the greatest level of performance was provided by emerging markets equity, commodities, and
U.S. small-cap equity, with returns of 36.4%, 35.5%, and 34.2%, respectively.
■
Given the Fund is comprised of equities, fixed income, and non-traditional assets, performance saw a number of detractors from performance.
Across the asset classes included, the lowest level of performance was provided by U.S. aggregate bonds, global REITs, and U.S. large-cap
equity, with returns of 2.7%, 17.7%, and 19.6%, respectively.
■
The PGIM Target Date Funds do not use derivatives, although derivatives are used in some of the underlying funds.
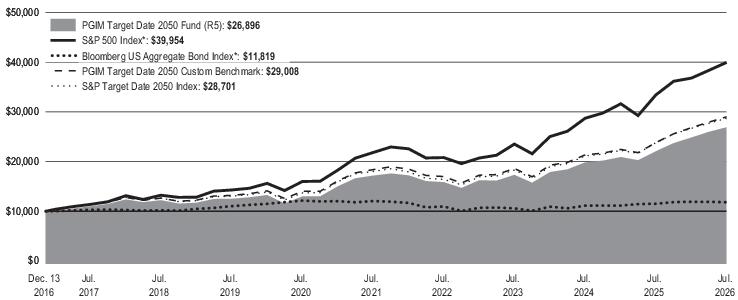
Average Annual Total Returns as of 7/31/2026 | |||
One Year (%) |
Five Years (%) |
Since Inception (%) | |
Class R5 |
21.81% |
9.39% |
10.82% (12/13/2016) |
S&P 500 Index* |
19.56% |
12.86% |
15.41% |
Bloomberg US Aggregate Bond Index* |
2.71% |
-0.40% |
1.74% |
PGIM Target Date 2050 Custom Benchmark |
21.77% |
9.56% |
11.65% |
S&P Target Date 2050 Index |
20.61% |
9.76% |
11.52% |
*The Fund compares its performance against this broad-based index in response to regulatory requirements.
WHAT ARE SOME KEY FUND STATISTICS AS OF 7/31/2026?
Fund’s net assets |
$21,239,323 |
Number of fund holdings |
9 |
Total advisory fees paid for the year |
$0 |
Portfolio turnover rate for the year |
59% |
WHAT ARE SOME CHARACTERISTICS OF THE FUND’S HOLDINGS AS OF 7/31/2026?
Investment Allocation |
% of Net Assets |
Affiliated Mutual Funds - Domestic Equity |
55.7% |
Affiliated Mutual Funds - International Equity |
34.8% |
Affiliated Exchange-Traded Funds - Fixed Income |
7.4% |
Affiliated Mutual Funds - Fixed Income |
2.0% |
Affiliated Mutual Fund - Short-Term Investment |
0.3% |
100.2% | |
Liabilities in excess of other assets |
(0.2)% |
100.0% |
WHAT WERE THE FUND COSTS FOR THE LAST YEAR?
(Based on a hypothetical $10,000 investment)
Costs of a $10,000 investment |
Costs paid as a percentage of a $10,000 investment | |
PGIM Target Date 2050 Fund—Class R6 |
$0 |
0.00% |
WHAT AFFECTED THE FUND’S PERFORMANCE DURING THE REPORTING PERIOD?
■ Despite some volatility across global markets in 2026, the past 12 months were influenced by evolving monetary policy expectations, persistent inflation concerns, and heightened geopolitical uncertainty. U.S. equities generally benefited from resilient corporate earnings and economic growth, while fixed income markets experienced periodic volatility as the interest rate outlook continued to be reassessed.
■
Given the Fund is comprised of equities, fixed income, and non-traditional assets, performance saw a number of contributors to performance.
Across the asset classes included, the greatest level of performance was provided by emerging markets equity, commodities, and
U.S. small-cap equity, with returns of 36.4%, 35.5%, and 34.2%, respectively.
■
Given the Fund is comprised of equities, fixed income, and non-traditional assets, performance saw a number of detractors from performance.
Across the asset classes included, the lowest level of performance was provided by U.S. aggregate bonds, global REITs, and U.S. large-cap
equity, with returns of 2.7%, 17.7%, and 19.6%, respectively.
■
The PGIM Target Date Funds do not use derivatives, although derivatives are used in some of the underlying funds.
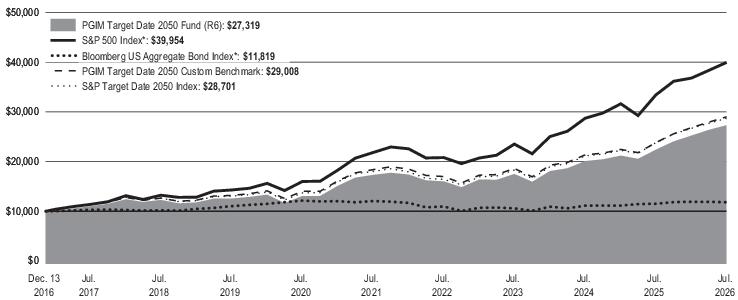
Average Annual Total Returns as of 7/31/2026 | |||
One Year (%) |
Five Years (%) |
Since Inception (%) | |
Class R6 |
21.97% |
9.55% |
11.00% (12/13/2016) |
S&P 500 Index* |
19.56% |
12.86% |
15.41% |
Bloomberg US Aggregate Bond Index* |
2.71% |
-0.40% |
1.74% |
PGIM Target Date 2050 Custom Benchmark |
21.77% |
9.56% |
11.65% |
S&P Target Date 2050 Index |
20.61% |
9.76% |
11.52% |
*The Fund compares its performance against this broad-based index in response to regulatory requirements.
WHAT ARE SOME KEY FUND STATISTICS AS OF 7/31/2026?
Fund’s net assets |
$21,239,323 |
Number of fund holdings |
9 |
Total advisory fees paid for the year |
$0 |
Portfolio turnover rate for the year |
59% |
WHAT ARE SOME CHARACTERISTICS OF THE FUND’S HOLDINGS AS OF 7/31/2026?
Investment Allocation |
% of Net Assets |
Affiliated Mutual Funds - Domestic Equity |
55.7% |
Affiliated Mutual Funds - International Equity |
34.8% |
Affiliated Exchange-Traded Funds - Fixed Income |
7.4% |
Affiliated Mutual Funds - Fixed Income |
2.0% |
Affiliated Mutual Fund - Short-Term Investment |
0.3% |
100.2% | |
Liabilities in excess of other assets |
(0.2)% |
100.0% |
WHAT WERE THE FUND COSTS FOR THE LAST YEAR?
(Based on a hypothetical $10,000 investment)
Costs of a $10,000 investment |
Costs paid as a percentage of a $10,000 investment | |
PGIM Target Date 2055 Fund—Class R1 |
$72 |
0.65% |
WHAT AFFECTED THE FUND’S PERFORMANCE DURING THE REPORTING PERIOD?
■ Despite some volatility across global markets in 2026, the past 12 months were influenced by evolving monetary policy expectations, persistent inflation concerns, and heightened geopolitical uncertainty. U.S. equities generally benefited from resilient corporate earnings and economic growth, while fixed income markets experienced periodic volatility as the interest rate outlook continued to be reassessed.
■
Given the Fund is comprised of equities, fixed income, and non-traditional assets, performance saw a number of contributors to performance.
Across the asset classes included, the greatest level of performance was provided by emerging markets equity, U.S. small-cap equity, and
non-U.S. developed markets equity, with returns of 36.4%, 34.2%, and 24.3%, respectively.
■
Given the Fund is comprised of equities, fixed income, and non-traditional assets, performance saw a number of detractors from performance.
Across the asset classes included, the lowest level of performance was provided by U.S. aggregate bonds, global REITs, and U.S. large-cap
equity, with returns of 2.7%, 17.7%, and 19.6%, respectively.
■
The PGIM Target Date Funds do not use derivatives, although derivatives are used in some of the underlying funds.
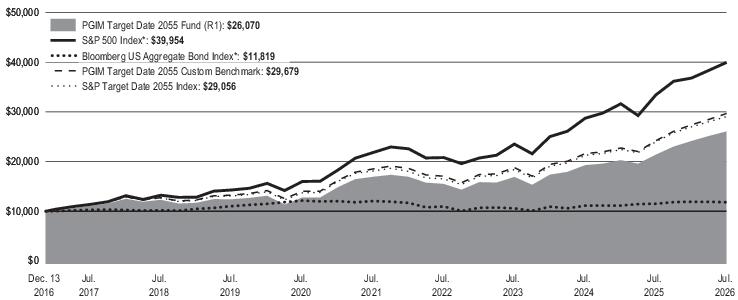
Average Annual Total Returns as of 7/31/2026 | |||
One Year (%) |
Five Years (%) |
Since Inception (%) | |
Class R1 |
21.87% |
9.01% |
10.46% (12/13/2016) |
S&P 500 Index* |
19.56% |
12.86% |
15.41% |
Bloomberg US Aggregate Bond Index* |
2.71% |
-0.40% |
1.74% |
PGIM Target Date 2055 Custom Benchmark |
22.64% |
9.89% |
11.91% |
S&P Target Date 2055 Index |
21.10% |
9.92% |
11.67% |
*The Fund compares its performance against this broad-based index in response to regulatory requirements.
WHAT ARE SOME KEY FUND STATISTICS AS OF 7/31/2026?
Fund’s net assets |
$11,799,827 |
Number of fund holdings |
8 |
Total advisory fees paid for the year |
$0 |
Portfolio turnover rate for the year |
63% |
WHAT ARE SOME CHARACTERISTICS OF THE FUND’S HOLDINGS AS OF 7/31/2026?
Investment Allocation |
% of Net Assets |
Affiliated Mutual Funds - Domestic Equity |
57.0% |
Affiliated Mutual Funds - International Equity |
38.6% |
Affiliated Exchange-Traded Funds - Fixed Income |
4.3% |
Affiliated Mutual Fund - Short-Term Investment |
0.4% |
100.3% | |
Liabilities in excess of other assets |
(0.3)% |
100.0% |
WHAT WERE THE FUND COSTS FOR THE LAST YEAR?
(Based on a hypothetical $10,000 investment)
Costs of a $10,000 investment |
Costs paid as a percentage of a $10,000 investment | |
PGIM Target Date 2055 Fund—Class R2 |
$44 |
0.40% |
WHAT AFFECTED THE FUND’S PERFORMANCE DURING THE REPORTING PERIOD?
■ Despite some volatility across global markets in 2026, the past 12 months were influenced by evolving monetary policy expectations, persistent inflation concerns, and heightened geopolitical uncertainty. U.S. equities generally benefited from resilient corporate earnings and economic growth, while fixed income markets experienced periodic volatility as the interest rate outlook continued to be reassessed.
■
Given the Fund is comprised of equities, fixed income, and non-traditional assets, performance saw a number of contributors to performance.
Across the asset classes included, the greatest level of performance was provided by emerging markets equity, U.S. small-cap equity, and
non-U.S. developed markets equity, with returns of 36.4%, 34.2%, and 24.3%, respectively.
■
Given the Fund is comprised of equities, fixed income, and non-traditional assets, performance saw a number of detractors from performance.
Across the asset classes included, the lowest level of performance was provided by U.S. aggregate bonds, global REITs, and U.S. large-cap
equity, with returns of 2.7%, 17.7%, and 19.6%, respectively.
■
The PGIM Target Date Funds do not use derivatives, although derivatives are used in some of the underlying funds.
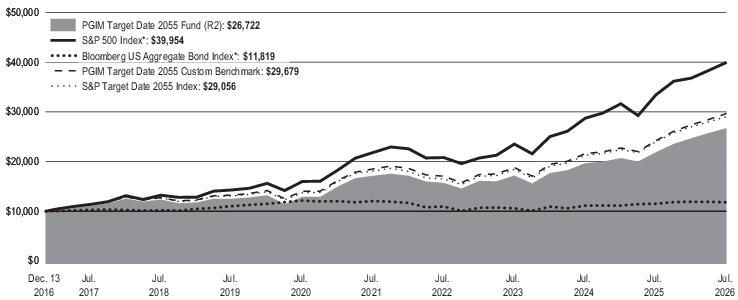
Average Annual Total Returns as of 7/31/2026 | |||
One Year (%) |
Five Years (%) |
Since Inception (%) | |
Class R2 |
22.17% |
9.29% |
10.74% (12/13/2016) |
S&P 500 Index* |
19.56% |
12.86% |
15.41% |
Bloomberg US Aggregate Bond Index* |
2.71% |
-0.40% |
1.74% |
PGIM Target Date 2055 Custom Benchmark |
22.64% |
9.89% |
11.91% |
S&P Target Date 2055 Index |
21.10% |
9.92% |
11.67% |
*The Fund compares its performance against this broad-based index in response to regulatory requirements.
WHAT ARE SOME KEY FUND STATISTICS AS OF 7/31/2026?
Fund’s net assets |
$11,799,827 |
Number of fund holdings |
8 |
Total advisory fees paid for the year |
$0 |
Portfolio turnover rate for the year |
63% |
WHAT ARE SOME CHARACTERISTICS OF THE FUND’S HOLDINGS AS OF 7/31/2026?
Investment Allocation |
% of Net Assets |
Affiliated Mutual Funds - Domestic Equity |
57.0% |
Affiliated Mutual Funds - International Equity |
38.6% |
Affiliated Exchange-Traded Funds - Fixed Income |
4.3% |
Affiliated Mutual Fund - Short-Term Investment |
0.4% |
100.3% | |
Liabilities in excess of other assets |
(0.3)% |
100.0% |
WHAT WERE THE FUND COSTS FOR THE LAST YEAR?
(Based on a hypothetical $10,000 investment)
Costs of a $10,000 investment |
Costs paid as a percentage of a $10,000 investment | |
PGIM Target Date 2055 Fund—Class R3 |
$28 |
0.25% |
WHAT AFFECTED THE FUND’S PERFORMANCE DURING THE REPORTING PERIOD?
■ Despite some volatility across global markets in 2026, the past 12 months were influenced by evolving monetary policy expectations, persistent inflation concerns, and heightened geopolitical uncertainty. U.S. equities generally benefited from resilient corporate earnings and economic growth, while fixed income markets experienced periodic volatility as the interest rate outlook continued to be reassessed.
■
Given the Fund is comprised of equities, fixed income, and non-traditional assets, performance saw a number of contributors to performance.
Across the asset classes included, the greatest level of performance was provided by emerging markets equity, U.S. small-cap equity, and
non-U.S. developed markets equity, with returns of 36.4%, 34.2%, and 24.3%, respectively.
■
Given the Fund is comprised of equities, fixed income, and non-traditional assets, performance saw a number of detractors from performance.
Across the asset classes included, the lowest level of performance was provided by U.S. aggregate bonds, global REITs, and U.S. large-cap
equity, with returns of 2.7%, 17.7%, and 19.6%, respectively.
■
The PGIM Target Date Funds do not use derivatives, although derivatives are used in some of the underlying funds.
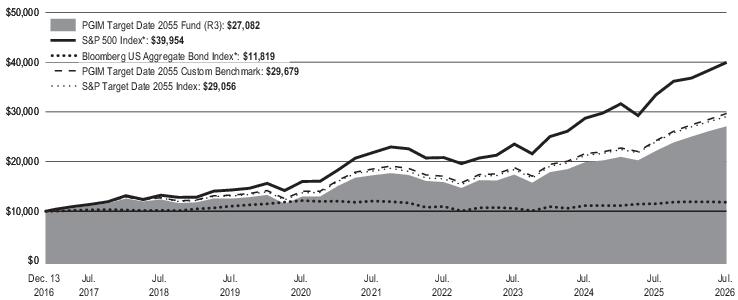
Average Annual Total Returns as of 7/31/2026 | |||
One Year (%) |
Five Years (%) |
Since Inception (%) | |
Class R3 |
22.36% |
9.45% |
10.90% (12/13/2016) |
S&P 500 Index* |
19.56% |
12.86% |
15.41% |
Bloomberg US Aggregate Bond Index* |
2.71% |
-0.40% |
1.74% |
PGIM Target Date 2055 Custom Benchmark |
22.64% |
9.89% |
11.91% |
S&P Target Date 2055 Index |
21.10% |
9.92% |
11.67% |
*The Fund compares its performance against this broad-based index in response to regulatory requirements.
WHAT ARE SOME KEY FUND STATISTICS AS OF 7/31/2026?
Fund’s net assets |
$11,799,827 |
Number of fund holdings |
8 |
Total advisory fees paid for the year |
$0 |
Portfolio turnover rate for the year |
63% |
WHAT ARE SOME CHARACTERISTICS OF THE FUND’S HOLDINGS AS OF 7/31/2026?
Investment Allocation |
% of Net Assets |
Affiliated Mutual Funds - Domestic Equity |
57.0% |
Affiliated Mutual Funds - International Equity |
38.6% |
Affiliated Exchange-Traded Funds - Fixed Income |
4.3% |
Affiliated Mutual Fund - Short-Term Investment |
0.4% |
100.3% | |
Liabilities in excess of other assets |
(0.3)% |
100.0% |
WHAT WERE THE FUND COSTS FOR THE LAST YEAR?
(Based on a hypothetical $10,000 investment)
Costs of a $10,000 investment |
Costs paid as a percentage of a $10,000 investment | |
PGIM Target Date 2055 Fund—Class R4 |
$17 |
0.15% |
WHAT AFFECTED THE FUND’S PERFORMANCE DURING THE REPORTING PERIOD?
■ Despite some volatility across global markets in 2026, the past 12 months were influenced by evolving monetary policy expectations, persistent inflation concerns, and heightened geopolitical uncertainty. U.S. equities generally benefited from resilient corporate earnings and economic growth, while fixed income markets experienced periodic volatility as the interest rate outlook continued to be reassessed.
■
Given the Fund is comprised of equities, fixed income, and non-traditional assets, performance saw a number of contributors to performance.
Across the asset classes included, the greatest level of performance was provided by emerging markets equity, U.S. small-cap equity, and
non-U.S. developed markets equity, with returns of 36.4%, 34.2%, and 24.3%, respectively.
■
Given the Fund is comprised of equities, fixed income, and non-traditional assets, performance saw a number of detractors from performance.
Across the asset classes included, the lowest level of performance was provided by U.S. aggregate bonds, global REITs, and U.S. large-cap
equity, with returns of 2.7%, 17.7%, and 19.6%, respectively.
■
The PGIM Target Date Funds do not use derivatives, although derivatives are used in some of the underlying funds.
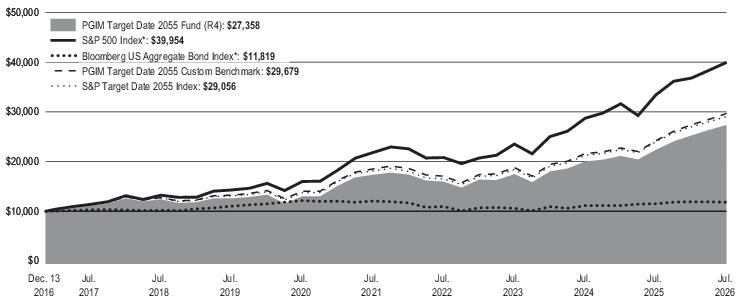
Average Annual Total Returns as of 7/31/2026 | |||
One Year (%) |
Five Years (%) |
Since Inception (%) | |
Class R4 |
22.43% |
9.55% |
11.01% (12/13/2016) |
S&P 500 Index* |
19.56% |
12.86% |
15.41% |
Bloomberg US Aggregate Bond Index* |
2.71% |
-0.40% |
1.74% |
PGIM Target Date 2055 Custom Benchmark |
22.64% |
9.89% |
11.91% |
S&P Target Date 2055 Index |
21.10% |
9.92% |
11.67% |
*The Fund compares its performance against this broad-based index in response to regulatory requirements.
WHAT ARE SOME KEY FUND STATISTICS AS OF 7/31/2026?
Fund’s net assets |
$11,799,827 |
Number of fund holdings |
8 |
Total advisory fees paid for the year |
$0 |
Portfolio turnover rate for the year |
63% |
WHAT ARE SOME CHARACTERISTICS OF THE FUND’S HOLDINGS AS OF 7/31/2026?
Investment Allocation |
% of Net Assets |
Affiliated Mutual Funds - Domestic Equity |
57.0% |
Affiliated Mutual Funds - International Equity |
38.6% |
Affiliated Exchange-Traded Funds - Fixed Income |
4.3% |
Affiliated Mutual Fund - Short-Term Investment |
0.4% |
100.3% | |
Liabilities in excess of other assets |
(0.3)% |
100.0% |
WHAT WERE THE FUND COSTS FOR THE LAST YEAR?
(Based on a hypothetical $10,000 investment)
Costs of a $10,000 investment |
Costs paid as a percentage of a $10,000 investment | |
PGIM Target Date 2055 Fund—Class R5 |
$6 |
0.05% |
WHAT AFFECTED THE FUND’S PERFORMANCE DURING THE REPORTING PERIOD?
■ Despite some volatility across global markets in 2026, the past 12 months were influenced by evolving monetary policy expectations, persistent inflation concerns, and heightened geopolitical uncertainty. U.S. equities generally benefited from resilient corporate earnings and economic growth, while fixed income markets experienced periodic volatility as the interest rate outlook continued to be reassessed.
■
Given the Fund is comprised of equities, fixed income, and non-traditional assets, performance saw a number of contributors to performance.
Across the asset classes included, the greatest level of performance was provided by emerging markets equity, U.S. small-cap equity, and
non-U.S. developed markets equity, with returns of 36.4%, 34.2%, and 24.3%, respectively.
■
Given the Fund is comprised of equities, fixed income, and non-traditional assets, performance saw a number of detractors from performance.
Across the asset classes included, the lowest level of performance was provided by U.S. aggregate bonds, global REITs, and U.S. large-cap
equity, with returns of 2.7%, 17.7%, and 19.6%, respectively.
■
The PGIM Target Date Funds do not use derivatives, although derivatives are used in some of the underl
yi
ng funds.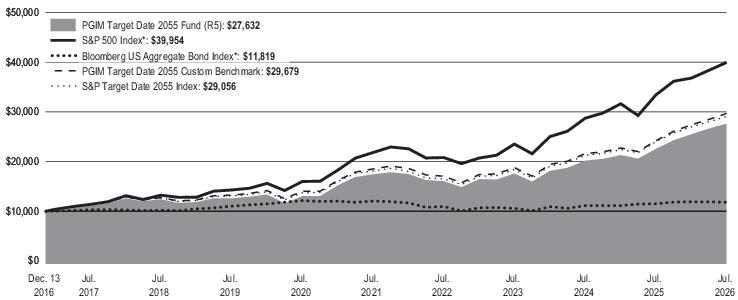
Average Annual Total Returns as of 7/31/2026 | |||
One Year (%) |
Five Years (%) |
Since Inception (%) | |
Class R5 |
22.55% |
9.67% |
11.13% (12/13/2016) |
S&P 500 Index* |
19.56% |
12.86% |
15.41% |
Bloomberg US Aggregate Bond Index* |
2.71% |
-0.40% |
1.74% |
PGIM Target Date 2055 Custom Benchmark |
22.64% |
9.89% |
11.91% |
S&P Target Date 2055 Index |
21.10% |
9.92% |
11.67% |
*The Fund compares its performance against this broad-based index in response to regulatory requirements.
WHAT ARE SOME KEY FUND STATISTICS AS OF 7/31/2026?
Fund’s net assets |
$ 11,799,827 |
Number of fund holdings |
8 |
Total advisory fees paid for the year |
$ 0 |
Portfolio turnover rate for the year |
63% |
WHAT ARE SOME CHARACTERISTICS OF THE FUND’S HOLDINGS AS OF 7/31/2026?
Investment Allocation |
% of Net Assets |
Affiliated Mutual Funds - Domestic Equity |
57.0% |
Affiliated Mutual Funds - International Equity |
38.6% |
Affiliated Exchange-Traded Funds - Fixed Income |
4.3% |
Affiliated Mutual Fund - Short-Term Investment |
0.4% |
100.3% | |
Liabilities in excess of other assets |
(0.3)% |
100.0% |
WHAT WERE THE FUND COSTS FOR THE LAST YEAR?
(Based on a hypothetical $10,000 investment)
Costs of a $10,000 investment |
Costs paid as a percentage of a $10,000 investment | |
PGIM Target Date 2055 Fund—Class R6 |
$0 |
0.00% |
WHAT AFFECTED THE FUND’S PERFORMANCE DURING THE REPORTING PERIOD?
■ Despite some volatility across global markets in 2026, the past 12 months were influenced by evolving monetary policy expectations, persistent inflation concerns, and heightened geopolitical uncertainty. U.S. equities generally benefited from resilient corporate earnings and economic growth, while fixed income markets experienced periodic volatility as the interest rate outlook continued to be reassessed.
■
Given the Fund is comprised of equities, fixed income, and non-traditional assets, performance saw a number of contributors to performance.
Across the asset classes included, the greatest level of performance was provided by emerging markets equity, U.S. small-cap equity, and
non-U.S. developed markets equity, with returns of 36.4%, 34.2%, and 24.3%, respectively.
■
Given the Fund is comprised of equities, fixed income, and non-traditional assets, performance saw a number of detractors from performance.
Across the asset classes included, the lowest level of performance was provided by U.S. aggregate bonds, global REITs, and U.S. large-cap
equity, with returns of 2.7%, 17.7%, and 19.6%, respectively.
■
The PGIM Target Date Funds do not use derivatives, although derivatives are used in some of the und
er
lying funds.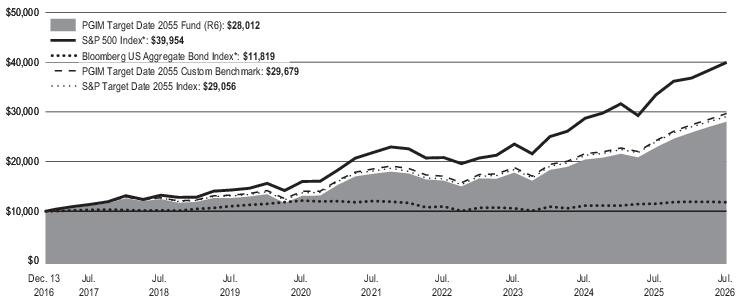
Average Annual Total Returns as of 7/31/2026 | |||
One Year (%) |
Five Years (%) |
Since Inception (%) | |
Class R6 |
22.77% |
9.83% |
11.29% (12/13/2016) |
S&P 500 Index* |
19.56% |
12.86% |
15.41% |
Bloomberg US Aggregate Bond Index* |
2.71% |
-0.40% |
1.74% |
PGIM Target Date 2055 Custom Benchmark |
22.64% |
9.89% |
11.91% |
S&P Target Date 2055 Index |
21.10% |
9.92% |
11.67% |
*The Fund compares its performance against this broad-based index in response to regulatory requirements.
WHAT ARE SOME KEY FUND STATISTICS AS OF 7/31/2026?
Fund’s net assets |
$ 11,799,827 |
Number of fund holdings |
8 |
Total advisory fees paid for the year |
$ 0 |
Portfolio turnover rate for the year |
63% |
WHAT ARE SOME CHARACTERISTICS OF THE FUND’S HOLDINGS AS OF 7/31/2026?
Investment Allocation |
% of Net Assets |
Affiliated Mutual Funds - Domestic Equity |
57.0% |
Affiliated Mutual Funds - International Equity |
38.6% |
Affiliated Exchange-Traded Funds - Fixed Income |
4.3% |
Affiliated Mutual Fund - Short-Term Investment |
0.4% |
100.3% | |
Liabilities in excess of other assets |
(0.3)% |
100.0% |
WHAT WERE THE FUND COSTS FOR THE LAST YEAR?
(Based on a hypothetical $10,000 investment)
Costs of a $10,000 investment |
Costs paid as a percentage of a $10,000 investment | |
PGIM Target Date 2060 Fund—Class R1 |
$71 |
0.64% |
WHAT AFFECTED THE FUND’S PERFORMANCE DURING THE REPORTING PERIOD?
■ Despite some volatility across global markets in 2026, the past 12 months were influenced by evolving monetary policy expectations, persistent inflation concerns, and heightened geopolitical uncertainty. U.S. equities generally benefited from resilient corporate earnings and economic growth, while fixed income markets experienced periodic volatility as the interest rate outlook continued to be reassessed.
■
Given the Fund is comprised of equities, fixed income, and non-traditional assets, performance saw a number of contributors to performance.
Across the asset classes included, the greatest level of performance was provided by emerging markets equity, U.S. small-cap equity, and
non-U.S. developed markets equity, with returns of 36.4%, 34.2%, and 24.3%, respectively.
■
Given the Fund is comprised of equities, fixed income, and non-traditional assets, performance saw a number of detractors from performance.
Across the asset classes included, the lowest level of performance was provided by U.S. aggregate bonds, global REITs, and U.S. large-cap
equity, with returns of 2.7%, 17.7%, and 19.6%, respectively.
■
The PGIM Target Date Funds do not use derivatives, although derivatives are used in some of the unde
rlyin
g funds.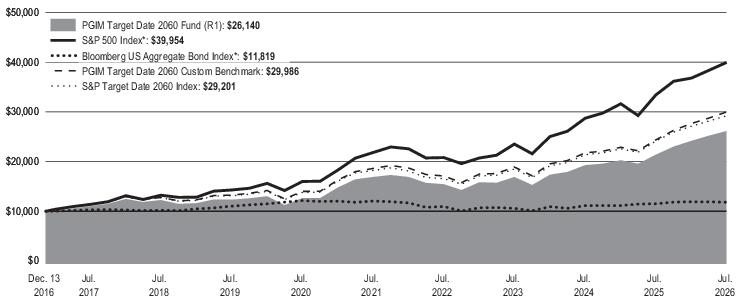
Average Annual Total Returns as of 7/31/2026 | |||
One Year (%) |
Five Years (%) |
Since Inception (%) | |
Class R1 |
22.22% |
9.11% |
10.49% (12/13/2016) |
S&P 500 Index* |
19.56% |
12.86% |
15.41% |
Bloomberg US Aggregate Bond Index* |
2.71% |
-0.40% |
1.74% |
PGIM Target Date 2060 Custom Benchmark |
23.03% |
10.01% |
12.03% |
S&P Target Date 2060 Index |
21.04% |
9.92% |
11.72% |
*The Fund compares its performance against this broad-based index in response to regulatory requirements.
WHAT ARE SOME KEY FUND STATISTICS AS OF 7/31/2026?
Fund’s net assets |
$ 11,418,315 |
Number of fund holdings |
8 |
Total advisory fees paid for the year |
$ 0 |
Portfolio turnover rate for the year |
55% |
WHAT ARE SOME CHARACTERISTICS OF THE FUND’S HOLDINGS AS OF 7/31/2026?
Investment Allocation |
% of Net Assets |
Affiliated Mutual Funds - Domestic Equity |
56.3% |
Affiliated Mutual Funds - International Equity |
40.5% |
Affiliated Exchange-Traded Funds - Fixed Income |
3.1% |
Affiliated Mutual Fund - Short-Term Investment |
0.4% |
100.3% | |
Liabilities in excess of other assets |
(0.3)% |
100.0% |
WHAT WERE THE FUND COSTS FOR THE LAST YEAR?
(Based on a hypothetical $10,000 investment)
Costs of a $10,000 investment |
Costs paid as a percentage of a $10,000 investment | |
PGIM Target Date 2060 Fund—Class R2 |
$43 |
0.39% |
WHAT AFFECTED THE FUND’S PERFORMANCE DURING THE REPORTING PERIOD?
■ Despite some volatility across global markets in 2026, the past 12 months were influenced by evolving monetary policy expectations, persistent inflation concerns, and heightened geopolitical uncertainty. U.S. equities generally benefited from resilient corporate earnings and economic growth, while fixed income markets experienced periodic volatility as the interest rate outlook continued to be reassessed.
■
Given the Fund is comprised of equities, fixed income, and non-traditional assets, performance saw a number of contributors to performance.
Across the asset classes included, the greatest level of performance was provided by emerging markets equity, U.S. small-cap equity, and
non-U.S. developed markets equity, with returns of 36.4%, 34.2%, and 24.3%, respectively.
■
Given the Fund is comprised of equities, fixed income, and non-traditional assets, performance saw a number of detractors from performance.
Across the asset classes included, the lowest level of performance was provided by U.S. aggregate bonds, global REITs, and U.S. large-cap
equity, with returns of 2.7%, 17.7%, and 19.6%, respectively.
■
The PGIM Target Date Funds do not use derivatives, although derivatives are used in some of the und
er
lying funds.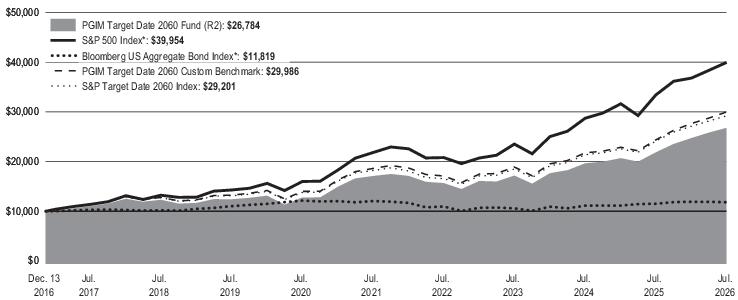
Average Annual Total Returns as of 7/31/2026 | |||
One Year (%) |
Five Years (%) |
Since Inception (%) | |
Class R2 |
22.54% |
9.40% |
10.77% (12/13/2016) |
S&P 500 Index* |
19.56% |
12.86% |
15.41% |
Bloomberg US Aggregate Bond Index* |
2.71% |
-0.40% |
1.74% |
PGIM Target Date 2060 Custom Benchmark |
23.03% |
10.01% |
12.03% |
S&P Target Date 2060 Index |
21.04% |
9.92% |
11.72% |
*The Fund compares its performance against this broad-based index in response to regulatory requirements.
WHAT ARE SOME KEY FUND STATISTICS AS OF 7/31/2026?
Fund’s net assets |
$ 11,418,315 |
Number of fund holdings |
8 |
Total advisory fees paid for the year |
$ 0 |
Portfolio turnover rate for the year |
55% |
WHAT ARE SOME CHARACTERISTICS OF THE FUND’S HOLDINGS AS OF 7/31/2026?
Investment Allocation |
% of Net Assets |
Affiliated Mutual Funds - Domestic Equity |
56.3% |
Affiliated Mutual Funds - International Equity |
40.5% |
Affiliated Exchange-Traded Funds - Fixed Income |
3.1% |
Affiliated Mutual Fund - Short-Term Investment |
0.4% |
100.3% | |
Liabilities in excess of other assets |
(0.3)% |
100.0% |
WHAT WERE THE FUND COSTS FOR THE LAST YEAR?
(Based on a hypothetical $10,000 investment)
Costs of a $10,000 investment |
Costs paid as a percentage of a $10,000 investment | |
PGIM Target Date 2060 Fund—Class R3 |
$27 |
0.24% |
WHAT AFFECTED THE FUND’S PERFORMANCE DURING THE REPORTING PERIOD?
■ Despite some volatility across global markets in 2026, the past 12 months were influenced by evolving monetary policy expectations, persistent inflation concerns, and heightened geopolitical uncertainty. U.S. equities generally benefited from resilient corporate earnings and economic growth, while fixed income markets experienced periodic volatility as the interest rate outlook continued to be reassessed.
■
Given the Fund is comprised of equities, fixed income, and non-traditional assets, performance saw a number of contributors to performance.
Across the asset classes included, the greatest level of performance was provided by emerging markets equity, U.S. small-cap equity, and
non-U.S. developed markets equity, with returns of 36.4%, 34.2%, and 24.3%, respectively.
■
Given the Fund is comprised of equities, fixed income, and non-traditional assets, performance saw a number of detractors from performance.
Across the asset classes included, the lowest level of performance was provided by U.S. aggregate bonds, global REITs, and U.S. large-cap
equity, with returns of 2.7%, 17.7%, and 19.6%, respectively.
■
The PGIM Target Date Funds do not use derivatives, although derivatives are used in some of the u
nde
rlying funds.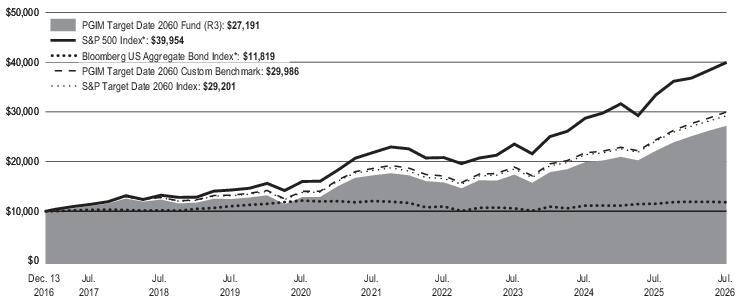
Average Annual Total Returns as of 7/31/2026 | |||
One Year (%) |
Five Years (%) |
Since Inception (%) | |
Class R3 |
22.72% |
9.57% |
10.94% (12/13/2016) |
S&P 500 Index* |
19.56% |
12.86% |
15.41% |
Bloomberg US Aggregate Bond Index* |
2.71% |
-0.40% |
1.74% |
PGIM Target Date 2060 Custom Benchmark |
23.03% |
10.01% |
12.03% |
S&P Target Date 2060 Index |
21.04% |
9.92% |
11.72% |
*The Fund compares its performance against this broad-based index in response to regulatory requirements.
WHAT ARE SOME KEY FUND STATISTICS AS OF 7/31/2026?
Fund’s net assets |
$ 11,418,315 |
Number of fund holdings |
8 |
Total advisory fees paid for the year |
$ 0 |
Portfolio turnover rate for the year |
55% |
WHAT ARE SOME CHARACTERISTICS OF THE FUND’S HOLDINGS AS OF 7/31/2026?
Investment Allocation |
% of Net Assets |
Affiliated Mutual Funds - Domestic Equity |
56.3% |
Affiliated Mutual Funds - International Equity |
40.5% |
Affiliated Exchange-Traded Funds - Fixed Income |
3.1% |
Affiliated Mutual Fund - Short-Term Investment |
0.4% |
100.3% | |
Liabilities in excess of other assets |
(0.3)% |
100.0% |
WHAT WERE THE FUND COSTS FOR THE LAST YEAR?
(Based on a hypothetical $10,000 investment)
Costs of a $10,000 investment |
Costs paid as a percentage of a $10,000 investment | |
PGIM Target Date 2060 Fund—Class R4 |
$16 |
0.14% |
WHAT AFFECTED THE FUND’S PERFORMANCE DURING THE REPORTING PERIOD?
■
Despite some volatility across global markets in 2026, the past 12 months were influenced by evolving monetary policy expectations, persistent
inflation concerns, and heightened geopolitical uncertainty. U.S. equities generally benefited from resilient corporate earnings and economic
growth, while fixed income markets experienced periodic volatility as the interest rate outlook continued to be reassessed.
■
Given the Fund is comprised of equities, fixed income, and non-traditional assets, performance saw a number of contributors to performance.
Across the asset classes included, the greatest level of performance was provided by emerging markets equity, U.S. small-cap equity, and
non-U.S. developed markets equity, with returns of 36.4%, 34.2%, and 24.3%, respectively.
■
Given the Fund is comprised of equities, fixed income, and non-traditional assets, performance saw a number of detractors from performance.
Across the asset classes included, the lowest level of performance was provided by U.S. aggregate bonds, global REITs, and U.S. large-cap
equity, with returns of 2.7%, 17.7%, and 19.6%, respectively.
■
The PGIM Target Date Funds do not use derivatives, although derivatives are used in some of the unde
rlyi
ng funds.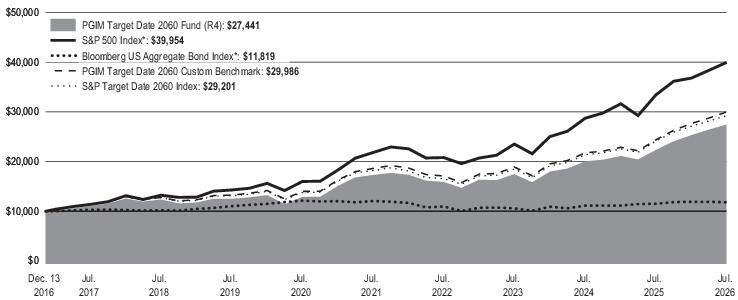
Average Annual Total Returns as of 7/31/2026 | |||
One Year (%) |
Five Years (%) |
Since Inception (%) | |
Class R4 |
22.85% |
9.67% |
11.05% (12/13/2016) |
S&P 500 Index* |
19.56% |
12.86% |
15.41% |
Bloomberg US Aggregate Bond Index* |
2.71% |
-0.40% |
1.74% |
PGIM Target Date 2060 Custom Benchmark |
23.03% |
10.01% |
12.03% |
S&P Target Date 2060 Index |
21.04% |
9.92% |
11.72% |
*The Fund compares its performance against this broad-based index in response to regulatory requirements.
WHAT ARE SOME KEY FUND STATISTICS AS OF 7/31/2026?
Fund’s net assets |
$ 11,418,315 |
Number of fund holdings |
8 |
Total advisory fees paid for the year |
$ 0 |
Portfolio turnover rate for the year |
55% |
WHAT ARE SOME CHARACTERISTICS OF THE FUND’S HOLDINGS AS OF 7/31/2026?
Investment Allocation |
% of Net Assets |
Affiliated Mutual Funds - Domestic Equity |
56.3% |
Affiliated Mutual Funds - International Equity |
40.5% |
Affiliated Exchange-Traded Funds - Fixed Income |
3.1% |
Affiliated Mutual Fund - Short-Term Investment |
0.4% |
100.3% | |
Liabilities in excess of other assets |
(0.3)% |
100.0% |
WHAT WERE THE FUND COSTS FOR THE LAST YEAR?
(Based on a hypothetical $10,000 investment)
Costs of a $10,000 investment |
Costs paid as a percentage of a $10,000 investment | |
PGIM Target Date 2060 Fund—Class R5 |
$4 |
0.04% |
WHAT AFFECTED THE FUND’S PERFORMANCE DURING THE REPORTING PERIOD?
■ Despite some volatility across global markets in 2026, the past 12 months were influenced by evolving monetary policy expectations, persistent inflation concerns, and heightened geopolitical uncertainty. U.S. equities generally benefited from resilient corporate earnings and economic growth, while fixed income markets experienced periodic volatility as the interest rate outlook continued to be reassessed.
■
Given the Fund is comprised of equities, fixed income, and non-traditional assets, performance saw a number of contributors to performance.
Across the asset classes included, the greatest level of performance was provided by emerging markets equity, U.S. small-cap equity, and
non-U.S. developed markets equity, with returns of 36.4%, 34.2%, and 24.3%, respectively.
■
Given the Fund is comprised of equities, fixed income, and non-traditional assets, performance saw a number of detractors from performance.
Across the asset classes included, the lowest level of performance was provided by U.S. aggregate bonds, global REITs, and U.S. large-cap
equity, with returns of 2.7%, 17.7%, and 19.6%, respectively.
■
The PGIM Target Date Funds do not use derivatives, although derivatives are used in some of the unde
rlyi
ng funds.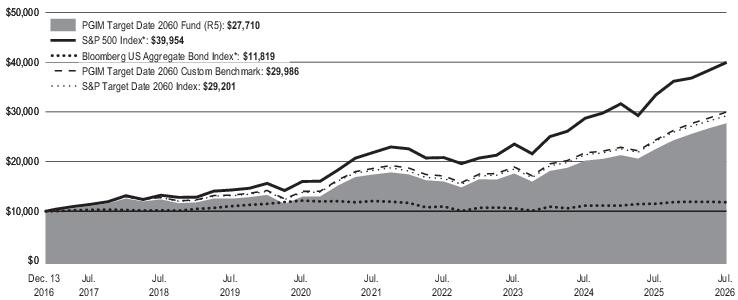
Average Annual Total Returns as of 7/31/2026 | |||
One Year (%) |
Five Years (%) |
Since Inception (%) | |
Class R5 |
22.99% |
9.78% |
11.16% (12/13/2016) |
S&P 500 Index* |
19.56% |
12.86% |
15.41% |
Bloomberg US Aggregate Bond Index* |
2.71% |
-0.40% |
1.74% |
PGIM Target Date 2060 Custom Benchmark |
23.03% |
10.01% |
12.03% |
S&P Target Date 2060 Index |
21.04% |
9.92% |
11.72% |
*The Fund compares its performance against this broad-based index in response to regulatory requirements.
WHAT ARE SOME KEY FUND STATISTICS AS OF 7/31/2026?
Fund’s net assets |
$ 11,418,315 |
Number of fund holdings |
8 |
Total advisory fees paid for the year |
$ 0 |
Portfolio turnover rate for the year |
55% |
WHAT ARE SOME CHARACTERISTICS OF THE FUND’S HOLDINGS AS OF 7/31/2026?
Investment Allocation |
% of Net Assets |
Affiliated Mutual Funds - Domestic Equity |
56.3% |
Affiliated Mutual Funds - International Equity |
40.5% |
Affiliated Exchange-Traded Funds - Fixed Income |
3.1% |
Affiliated Mutual Fund - Short-Term Investment |
0.4% |
100.3% | |
Liabilities in excess of other assets |
(0.3)% |
100.0% |
WHAT WERE THE FUND COSTS FOR THE LAST YEAR?
(Based on a hypothetical $10,000 investment)
Costs of a $10,000 investment |
Costs paid as a percentage of a $10,000 investment | |
PGIM Target Date 2060 Fund—Class R6 |
$0 |
0.00% |
WHAT AFFECTED THE FUND’S PERFORMANCE DURING THE REPORTING PERIOD?
■ Despite some volatility across global markets in 2026, the past 12 months were influenced by evolving monetary policy expectations, persistent inflation concerns, and heightened geopolitical uncertainty. U.S. equities generally benefited from resilient corporate earnings and economic growth, while fixed income markets experienced periodic volatility as the interest rate outlook continued to be reassessed.
■
Given the Fund is comprised of equities, fixed income, and non-traditional assets, performance saw a number of contributors to performance.
Across the asset classes included, the greatest level of performance was provided by emerging markets equity, U.S. small-cap equity, and
non-U.S. developed markets equity, with returns of 36.4%, 34.2%, and 24.3%, respectively.
■
Given the Fund is comprised of equities, fixed income, and non-traditional assets, performance saw a number of detractors from performance.
Across the asset classes included, the lowest level of performance was provided by U.S. aggregate bonds, global REITs, and U.S. large-cap
equity, with returns of 2.7%, 17.7%, and 19.6%, respectively.
■
The PGIM Target Date Funds do not use derivatives, although derivatives are used in some of the underly
i
ng funds.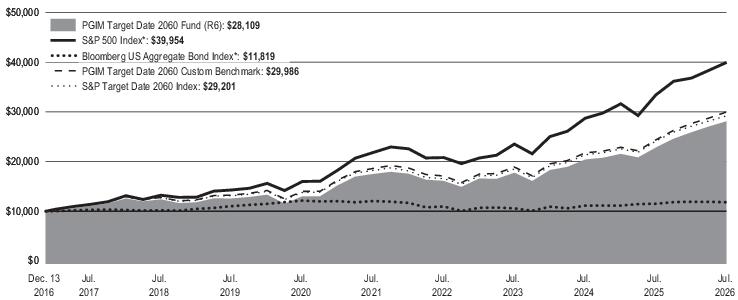
Average Annual Total Returns as of 7/31/2026 | |||
One Year (%) |
Five Years (%) |
Since Inception (%) | |
Class R6 |
23.17% |
9.95% |
11.33% (12/13/2016) |
S&P 500 Index* |
19.56% |
12.86% |
15.41% |
Bloomberg US Aggregate Bond Index* |
2.71% |
-0.40% |
1.74% |
PGIM Target Date 2060 Custom Benchmark |
23.03% |
10.01% |
12.03% |
S&P Target Date 2060 Index |
21.04% |
9.92% |
11.72% |
*The Fund compares its performance against this broad-based index in response to regulatory requirements.
WHAT ARE SOME KEY FUND STATISTICS AS OF 7/31/2026?
Fund’s net assets |
$ 11,418,315 |
Number of fund holdings |
8 |
Total advisory fees paid for the year |
$ 0 |
Portfolio turnover rate for the year |
55% |
WHAT ARE SOME CHARACTERISTICS OF THE FUND’S HOLDINGS AS OF 7/31/2026?
Investment Allocation |
% of Net Assets |
Affiliated Mutual Funds - Domestic Equity |
56.3% |
Affiliated Mutual Funds - International Equity |
40.5% |
Affiliated Exchange-Traded Funds - Fixed Income |
3.1% |
Affiliated Mutual Fund - Short-Term Investment |
0.4% |
100.3% | |
Liabilities in excess of other assets |
(0.3)% |
100.0% |
WHAT WERE THE FUND COSTS FOR THE LAST YEAR?
(Based on a hypothetical $10,000 investment)
Costs of a $10,000 investment |
Costs paid as a percentage of a $10,000 investment | |
PGIM Target Date 2065 Fund—Class R1 |
$71 |
0.64% |
WHAT AFFECTED THE FUND’S PERFORMANCE DURING THE REPORTING PERIOD?
■ Despite some volatility across global markets in 2026, the past 12 months were influenced by evolving monetary policy expectations, persistent inflation concerns, and heightened geopolitical uncertainty. U.S. equities generally benefited from resilient corporate earnings and economic growth, while fixed income markets experienced periodic volatility as the interest rate outlook continued to be reassessed.
■
Given the Fund is comprised of equities, fixed income, and non-traditional assets, performance saw a number of contributors to performance.
Across the asset classes included, the greatest level of performance was provided by emerging markets equity, U.S. small-cap equity, and
non-U.S. developed markets equity, with returns of 36.4%, 34.2%, and 24.3%, respectively.
■
Given the Fund is comprised of equities, fixed income, and non-traditional assets, performance saw a number of detractors from performance.
Across the asset classes included, the lowest level of performance was provided by U.S. aggregate bonds, global REITs, an
d
U.S. large-cap equity, with returns of 2.7%, 17.7%, and 19.6%, respectively.
■
The PGIM Target Date Funds do not use derivatives, although derivatives are used in some of the underlying funds.
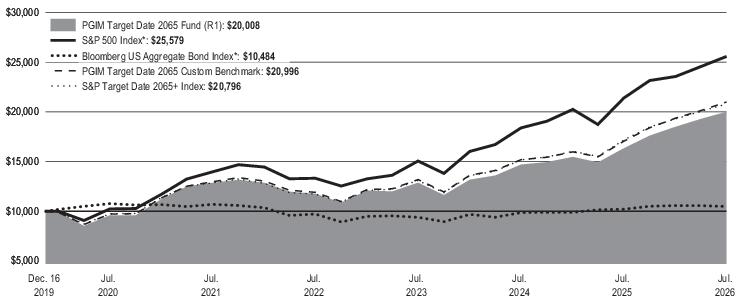
Average Annual Total Returns as of 7/31/2026 | |||
One Year (%) |
Five Years (%) |
Since Inception (%) | |
Class R1 |
22.46% |
9.23% |
11.03% (12/16/2019) |
S&P 500 Index* |
19.56% |
12.86% |
15.33% |
Bloomberg US Aggregate Bond Index* |
2.71% |
-0.40% |
0.72% |
PGIM Target Date 2065 Custom Benchmark |
23.16% |
10.11% |
11.93% |
S&P Target Date 2065+ Index |
21.12% |
10.09% |
11.76% |
*The Fund compares its performance against this broad-based index in response to regulatory requirements.
WHAT ARE SOME KEY FUND STATISTICS AS OF 7/31/2026?
Fund’s net assets |
$ 2,569,754 |
Number of fund holdings |
8 |
Total advisory fees paid for the year |
$ 0 |
Portfolio turnover rate for the year |
72% |
WHAT ARE SOME CHARACTERISTICS OF THE FUND’S HOLDINGS AS OF 7/31/2026?
Investment Allocation |
% of Net Assets |
Affiliated Mutual Funds - Domestic Equity |
56.1% |
Affiliated Mutual Funds - International Equity |
40.8% |
Affiliated Exchange-Traded Funds - Fixed Income |
3.0% |
Affiliated Mutual Fund - Short-Term Investment |
0.2% |
100.1% | |
Liabilities in excess of other assets |
(0.1)% |
100.0% |
WHAT WERE THE FUND COSTS FOR THE LAST YEAR?
(Based on a hypothetical $10,000 investment)
Costs of a $10,000 investment |
Costs paid as a percentage of a $10,000 investment | |
PGIM Target Date 2065 Fund—Class R2 |
$43 |
0.39% |
WHAT AFFECTED THE FUND’S PERFORMANCE DURING THE REPORTING PERIOD?
■ Despite some volatility across global markets in 2026, the past 12 months were influenced by evolving monetary policy expectations, persistent inflation concerns, and heightened geopolitical uncertainty. U.S. equities generally benefited from resilient corporate earnings and economic growth, while fixed income markets experienced periodic volatility as the interest rate outlook continued to be reassessed.
■
Given the Fund is comprised of equities, fixed income, and non-traditional assets, performance saw a number of contributors to performance.
Across the asset classes included, the greatest level of performance was provided by emerging markets equity, U.S. small-cap equity, and
non-U.S. developed markets equity, with returns of 36.4%, 34.2%, and 24.3%, respectively.
■
Given the Fund is comprised of equities, fixed income, and non-traditional assets, performance saw a number of detractors from performance.
Across the asset classes included, the lowest level of performance was provided by U.S. aggregate bonds, global REITs, and U.S. large-cap
equity, with returns of 2.7%, 17.7%, and 19.6%, respectively.
■
The PGIM Target Date Funds do not use derivatives, although derivatives are used in some of the und
erlyin
g funds.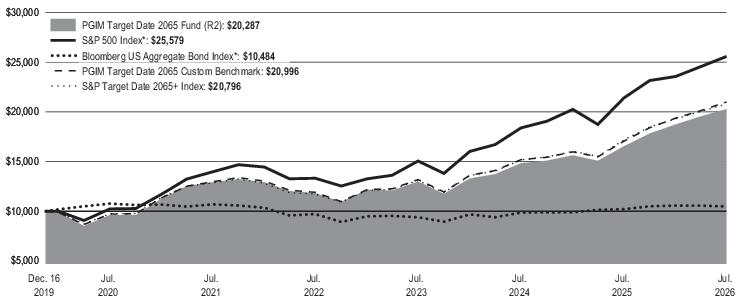
Average Annual Total Returns as of 7/31/2026 | |||
One Year (%) |
Five Years (%) |
Since Inception (%) | |
Class R2 |
22.65% |
9.43% |
11.26% (12/16/2019) |
S&P 500 Index* |
19.56% |
12.86% |
15.33% |
Bloomberg US Aggregate Bond Index* |
2.71% |
-0.40% |
0.72% |
PGIM Target Date 2065 Custom Benchmark |
23.16% |
10.11% |
11.93% |
S&P Target Date 2065+ Index |
21.12% |
10.09% |
11.76% |
*The Fund compares its performance against this broad-based index in response to regulatory requirements.
WHAT ARE SOME KEY FUND STATISTICS AS OF 7/31/2026?
Fund’s net assets |
$ 2,569,754 |
Number of fund holdings |
8 |
Total advisory fees paid for the year |
$ 0 |
Portfolio turnover rate for the year |
72% |
WHAT ARE SOME CHARACTERISTICS OF THE FUND’S HOLDINGS AS OF 7/31/2026?
Investment Allocation |
% of Net Assets |
Affiliated Mutual Funds - Domestic Equity |
56.1% |
Affiliated Mutual Funds - International Equity |
40.8% |
Affiliated Exchange-Traded Funds - Fixed Income |
3.0% |
Affiliated Mutual Fund - Short-Term Investment |
0.2% |
100.1% | |
Liabilities in excess of other assets |
(0.1)% |
100.0% |
WHAT WERE THE FUND COSTS FOR THE LAST YEAR?
(Based on a hypothetical $10,000 investment)
Costs of a $10,000 investment |
Costs paid as a percentage of a $10,000 investment | |
PGIM Target Date 2065 Fund—Class R3 |
$27 |
0.24% |
WHAT AFFECTED THE FUND’S PERFORMANCE DURING THE REPORTING PERIOD?
■ Despite some volatility across global markets in 2026, the past 12 months were influenced by evolving monetary policy expectations, persistent inflation concerns, and heightened geopolitical uncertainty. U.S. equities generally benefited from resilient corporate earnings and economic growth, while fixed income markets experienced periodic volatility as the interest rate outlook continued to be reassessed.
■
Given the Fund is comprised of equities, fixed income, and non-traditional assets, performance saw a number of contributors to performance.
Across the asset classes included, the greatest level of performance was provided by emerging markets equity, U.S. small-cap equity, and
non-U.S. developed markets equity, with returns of 36.4%, 34.2%, and 24.3%, respectively.
■
Given the Fund is comprised of equities, fixed income, and non-traditional assets, performance saw a number of detractors from performance.
Across the asset classes included, the lowest level of performance was provided by U.S. aggregate bonds, global REITs, and U.S. large-cap
equity, with returns of 2.7%, 17.7%, and 19.6%, respectively.
■
The PGIM Target Date Funds do not use deri
vat
ives, although derivatives are used in some of the underlying funds.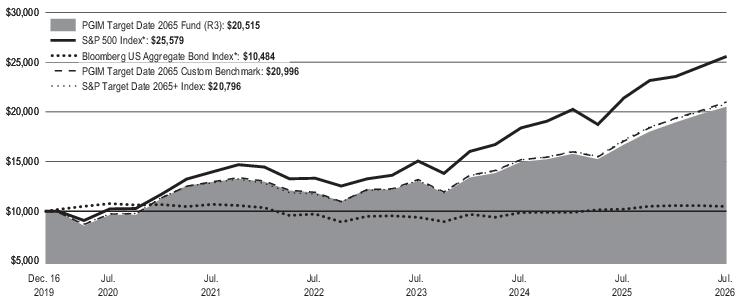
Average Annual Total Returns as of 7/31/2026 | |||
One Year (%) |
Five Years (%) |
Since Inception (%) | |
Class R3 |
22.89% |
9.63% |
11.45% (12/16/2019) |
S&P 500 Index* |
19.56% |
12.86% |
15.33% |
Bloomberg US Aggregate Bond Index* |
2.71% |
-0.40% |
0.72% |
PGIM Target Date 2065 Custom Benchmark |
23.16% |
10.11% |
11.93% |
S&P Target Date 2065+ Index |
21.12% |
10.09% |
11.76% |
*The Fund compares its performance against this broad-based index in response to regulatory requirements.
WHAT ARE SOME KEY FUND STATISTICS AS OF 7/31/2026?
Fund’s net assets |
$ 2,569,754 |
Number of fund holdings |
8 |
Total advisory fees paid for the year |
$ 0 |
Portfolio turnover rate for the year |
72% |
WHAT ARE SOME CHARACTERISTICS OF THE FUND’S HOLDINGS AS OF 7/31/2026?
Investment Allocation |
% of Net Assets |
Affiliated Mutual Funds - Domestic Equity |
56.1% |
Affiliated Mutual Funds - International Equity |
40.8% |
Affiliated Exchange-Traded Funds - Fixed Income |
3.0% |
Affiliated Mutual Fund - Short-Term Investment |
0.2% |
100.1% | |
Liabilities in excess of other assets |
(0.1)% |
100.0% |
WHAT WERE THE FUND COSTS FOR THE LAST YEAR?
(Based on a hypothetical $10,000 investment)
Costs of a $10,000 investment |
Costs paid as a percentage of a $10,000 investment | |
PGIM Target Date 2065 Fund—Class R4 |
$16 |
0.14% |
WHAT AFFECTED THE FUND’S PERFORMANCE DURING THE REPORTING PERIOD?
■ Despite some volatility across global markets in 2026, the past 12 months were influenced by evolving monetary policy expectations, persistent inflation concerns, and heightened geopolitical uncertainty. U.S. equities generally benefited from resilient corporate earnings and economic growth, while fixed income markets experienced periodic volatility as the interest rate outlook continued to be reassessed.
■
Given the Fund is comprised of equities, fixed income, and non-traditional assets, performance saw a number of contributors to performance.
Across the asset classes included, the greatest level of performance was provided by emerging markets equity, U.S. small-cap equity, and
non-U.S. developed markets equity, with returns of 36.4%, 34.2%, and 24.3%, respectively.
■
Given the Fund is comprised of equities, fixed income, and non-traditional assets, performance saw a number of detractors from performance.
Across the asset classes included, the lowest level of performance was provided by U.S. aggregate bonds, global REITs, and U.S. large-cap
equity, with returns of 2.7%, 17.7%, and 19.6%, respectively.
■
The PGIM Target Date Funds do not use derivatives, although derivatives are used in some of the underl
ying
funds.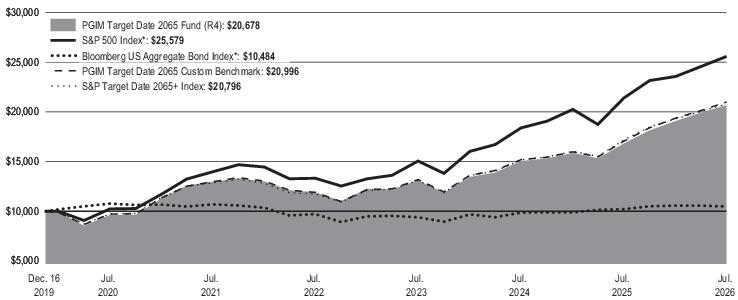
Average Annual Total Returns as of 7/31/2026 | |||
One Year (%) |
Five Years (%) |
Since Inception (%) | |
Class R4 |
23.01% |
9.77% |
11.59% (12/16/2019) |
S&P 500 Index* |
19.56% |
12.86% |
15.33% |
Bloomberg US Aggregate Bond Index* |
2.71% |
-0.40% |
0.72% |
PGIM Target Date 2065 Custom Benchmark |
23.16% |
10.11% |
11.93% |
S&P Target Date 2065+ Index |
21.12% |
10.09% |
11.76% |
*The Fund compares its performance against this broad-based index in response to regulatory requirements.
WHAT ARE SOME KEY FUND STATISTICS AS OF 7/31/2026?
Fund’s net assets |
$ 2,569,754 |
Number of fund holdings |
8 |
Total advisory fees paid for the year |
$ 0 |
Portfolio turnover rate for the year |
72% |
WHAT ARE SOME CHARACTERISTICS OF THE FUND’S HOLDINGS AS OF 7/31/2026?
Investment Allocation |
% of Net Assets |
Affiliated Mutual Funds - Domestic Equity |
56.1% |
Affiliated Mutual Funds - International Equity |
40.8% |
Affiliated Exchange-Traded Funds - Fixed Income |
3.0% |
Affiliated Mutual Fund - Short-Term Investment |
0.2% |
100.1% | |
Liabilities in excess of other assets |
(0.1)% |
100.0% |
WHAT WERE THE FUND COSTS FOR THE LAST YEAR?
(Based on a hypothetical $10,000 investment)
Costs of a $10,000 investment |
Costs paid as a percentage of a $10,000 investment | |
PGIM Target Date 2065 Fund—Class R5 |
$4 |
0.04% |
WHAT AFFECTED THE FUND’S PERFORMANCE DURING THE REPORTING PERIOD?
■ Despite some volatility across global markets in 2026, the past 12 months were influenced by evolving monetary policy expectations, persistent inflation concerns, and heightened geopolitical uncertainty. U.S. equities generally benefited from resilient corporate earnings and economic growth, while fixed income markets experienced periodic volatility as the interest rate outlook continued to be reassessed.
■
Given the Fund is comprised of equities, fixed income, and non-traditional assets, performance saw a number of contributors to performance.
Across the asset classes included, the greatest level of performance was provided by emerging markets equity, U.S. small-cap equity, and
non-U.S. developed markets equity, with returns of 36.4%, 34.2%, and 24.3%, respectively.
■
Given the Fund is comprised of equities, fixed income, and non-traditional assets, performance saw a number of detractors from performance.
Across the asset classes included, the lowest level of performance was provided by U.S. aggregate bonds, global REITs, and U.S. large-cap
equity, with returns of 2.7%, 17.7%, and 19.6%, respectively.
■
The PGIM Target Date Funds do not use derivatives, although derivatives are used in some of the underlying funds.
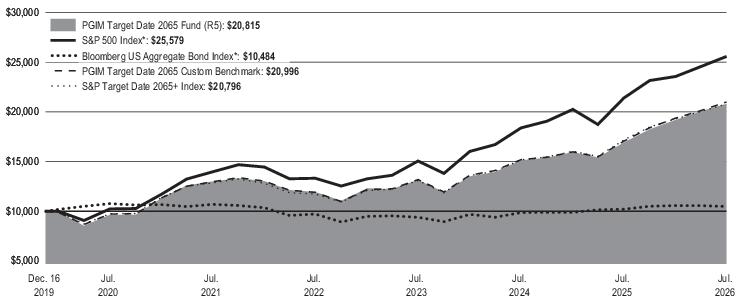
Average Annual Total Returns as of 7/31/2026 | |||
One Year (%) |
Five Years (%) |
Since Inception (%) | |
Class R5 |
23.09% |
9.88% |
11.70% (12/16/2019) |
S&P 500 Index* |
19.56% |
12.86% |
15.33% |
Bloomberg US Aggregate Bond Index* |
2.71% |
-0.40% |
0.72% |
PGIM Target Date 2065 Custom Benchmark |
23.16% |
10.11% |
11.93% |
S&P Target Date 2065+ Index |
21.12% |
10.09% |
11.76% |
*The Fund compares its performance against this broad-based index in response to regulatory requirements.
WHAT ARE SOME KEY FUND STATISTICS AS OF 7/31/2026?
Fund’s net assets |
$2,569,754 |
Number of fund holdings |
8 |
Total advisory fees paid for the year |
$0 |
Portfolio turnover rate for the year |
72% |
WHAT ARE SOME CHARACTERISTICS OF THE FUND’S HOLDINGS AS OF 7/31/2026?
Investment Allocation |
% of Net Assets |
Affiliated Mutual Funds - Domestic Equity |
56.1% |
Affiliated Mutual Funds - International Equity |
40.8% |
Affiliated Exchange-Traded Funds - Fixed Income |
3.0% |
Affiliated Mutual Fund - Short-Term Investment |
0.2% |
100.1% | |
Liabilities in excess of other assets |
(0.1)% |
100.0% |
WHAT WERE THE FUND COSTS FOR THE LAST YEAR?
(Based on a hypothetical $10,000 investment)
Costs of a $10,000 investment |
Costs paid as a percentage of a $10,000 investment | |
PGIM Target Date 2065 Fund—Class R6 |
$0 |
0.00% |
WHAT AFFECTED THE FUND’S PERFORMANCE DURING THE REPORTING PERIOD?
■ Despite some volatility across global markets in 2026, the past 12 months were influenced by evolving monetary policy expectations, persistent inflation concerns, and heightened geopolitical uncertainty. U.S. equities generally benefited from resilient corporate earnings and economic growth, while fixed income markets experienced periodic volatility as the interest rate outlook continued to be reassessed.
■
Given the Fund is comprised of equities, fixed income, and non-traditional assets, performance saw a number of contributors to performance.
Across the asset classes included, the greatest level of performance was provided by emerging markets equity, U.S. small-cap equity, and
non-U.S. developed markets equity, with returns of 36.4%, 34.2%, and 24.3%, respectively.
■
Given the Fund is comprised of equities, fixed income, and non-traditional assets, performance saw a number of detractors from performance.
Across the asset classes included, the lowest level of performance was provided by U.S. aggregate bonds, global REITs, and U.S. large-cap
equity, with returns of 2.7%, 17.7%, and 19.6%, respectively.
■
The PGIM Target Date Funds do not use derivatives, although derivatives are used in some of the underlying funds.
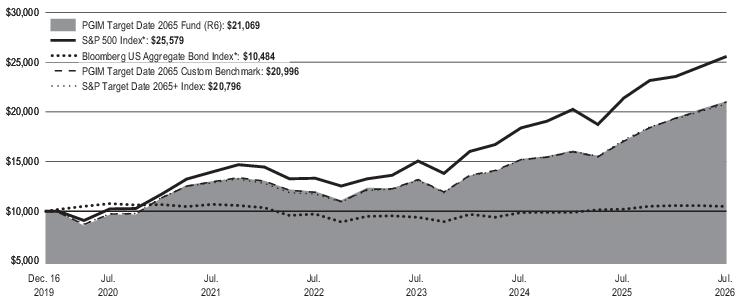
Average Annual Total Returns as of 7/31/2026 | |||
One Year (%) |
Five Years (%) |
Since Inception (%) | |
Class R6 |
23.32% |
10.10% |
11.90% (12/16/2019) |
S&P 500 Index* |
19.56% |
12.86% |
15.33% |
Bloomberg US Aggregate Bond Index* |
2.71% |
-0.40% |
0.72% |
PGIM Target Date 2065 Custom Benchmark |
23.16% |
10.11% |
11.93% |
S&P Target Date 2065+ Index |
21.12% |
10.09% |
11.76% |
*The Fund compares its performance against this broad-based index in response to regulatory requirements.
WHAT ARE SOME KEY FUND STATISTICS AS OF 7/31/2026?
Fund’s net assets |
$2,569,754 |
Number of fund holdings |
8 |
Total advisory fees paid for the year |
$0 |
Portfolio turnover rate for the year |
72% |
WHAT ARE SOME CHARACTERISTICS OF THE FUND’S HOLDINGS AS OF 7/31/2026?
Investment Allocation |
% of Net Assets |
Affiliated Mutual Funds - Domestic Equity |
56.1% |
Affiliated Mutual Funds - International Equity |
40.8% |
Affiliated Exchange-Traded Funds - Fixed Income |
3.0% |
Affiliated Mutual Fund - Short-Term Investment |
0.2% |
100.1% | |
Liabilities in excess of other assets |
(0.1)% |
100.0% |
WHAT WERE THE FUND COSTS FOR THE LAST YEAR?
(Based on a hypothetical $10,000 investment)
Costs of a $10,000 investment |
Costs paid as a percentage of a $10,000 investment | |
PGIM Target Date 2070 Fund—Class R1 |
$72 |
0.65% |
WHAT AFFECTED THE FUND’S PERFORMANCE DURING THE REPORTING PERIOD?
■ Despite some volatility across global markets in 2026, the past 12 months were influenced by evolving monetary policy expectations, persistent inflation concerns, and heightened geopolitical uncertainty. U.S. equities generally benefited from resilient corporate earnings and economic growth, while fixed income markets experienced periodic volatility as the interest rate outlook continued to be reassessed.
■
Given the Fund is comprised of equities, fixed income, and non-traditional assets, performance saw a number of contributors to performance.
Across the asset classes included, the greatest level of performance was provided by emerging markets equity, U.S. small-cap equity, and
non-U.S. developed markets equity, with returns of 36.4%, 34.2%, and 24.3%, respectively.
■
Given the Fund is comprised of equities, fixed income, and non-traditional assets, performance saw a number of detractors from performance.
Across the asset classes included, the lowest level of performance was provided by U.S. aggregate bonds, global REITs, and U.S. large-cap
equity, with returns of 2.7%, 17.7%, and 19.6%, respectively.
■
The PGIM Target Date Funds do not use derivatives, although derivatives are used in some of the underlying funds.
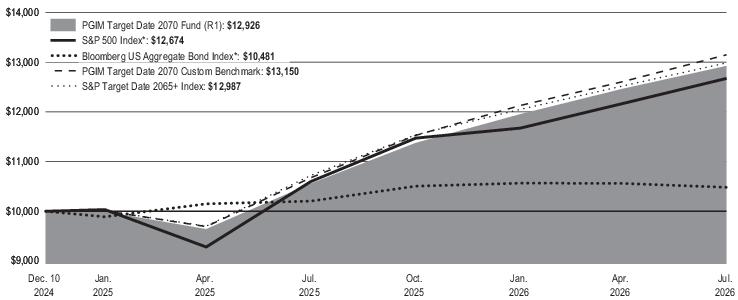
Average Annual Total Returns as of 7/31/2026 | ||
One Year (%) |
Since Inception (%) | |
Class R1 |
22.41% |
16.93% (12/10/2024) |
S&P 500 Index* |
19.56% |
15.28% |
Bloomberg US Aggregate Bond Index* |
2.71% |
2.86% |
PGIM Target Date 2070 Custom Benchmark |
23.16% |
17.85% |
S&P Target Date 2065+ Index |
21.12% |
16.98% |
*The Fund compares its performance against this broad-based index in response to regulatory requirements.
WHAT ARE SOME KEY FUND STATISTICS AS OF 7/31/2026?
Fund’s net assets |
$ 100,726 |
Number of fund holdings |
8 |
Total advisory fees paid for the year |
$ 0 |
Portfolio turnover rate for the year |
21% |
WHAT ARE SOME CHARACTERISTICS OF THE FUND’S HOLDINGS AS OF 7/31/2026?
Investment Allocation |
% of Net Assets |
Affiliated Mutual Funds - Domestic Equity |
56.1% |
Affiliated Mutual Funds - International Equity |
40.8% |
Affiliated Exchange-Traded Funds - Fixed Income |
3.0% |
Affiliated Mutual Fund - Short-Term Investment |
0.3% |
100.2% | |
Liabilities in excess of other assets |
(0.2)% |
100.0% |
WHAT WERE THE FUND COSTS FOR THE LAST YEAR?
(Based on a hypothetical $10,000 investment)
Costs of a $10,000 investment |
Costs paid as a percentage of a $10,000 investment | |
PGIM Target Date 2070 Fund—Class R2 |
$45 |
0.40% |
WHAT AFFECTED THE FUND’S PERFORMANCE DURING THE REPORTING PERIOD?
■ Despite some volatility across global markets in 2026, the past 12 months were influenced by evolving monetary policy expectations, persistent inflation concerns, and heightened geopolitical uncertainty. U.S. equities generally benefited from resilient corporate earnings and economic growth, while fixed income markets experienced periodic volatility as the interest rate outlook continued to be reassessed.
■
Given the Fund is comprised of equities, fixed income, and non-traditional assets, performance saw a number of contributors to performance.
Across the asset classes included, the greatest level of performance was provided by emerging markets equity, U.S. small-cap equity, and
non-U.S. developed markets equity, with returns of 36.4%, 34.2%, and 24.3%, respectively.
■
Given the Fund is comprised of equities, fixed income, and non-traditional assets, performance saw a number of detractors from performance.
Across the asset classes included, the lowest level of performance was provided by U.S. aggregate bonds, global REITs, and U.S. large-cap
equity, with returns of 2.7%, 17.7%, and 19.6%, respectively.
■
The PGIM Target Date Funds do not use derivatives, although derivatives are used in some of the underlying funds.
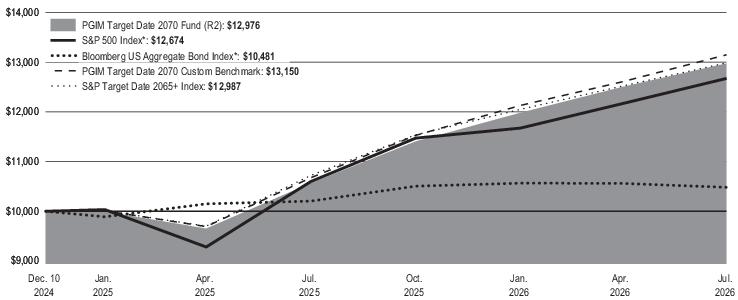
Average Annual Total Returns as of 7/31/2026 | ||
One Year (%) |
Since Inception (%) | |
Class R2 |
22.77% |
17.20% (12/10/2024) |
S&P 500 Index* |
19.56% |
15.28% |
Bloomberg US Aggregate Bond Index* |
2.71% |
2.86% |
PGIM Target Date 2070 Custom Benchmark |
23.16% |
17.85% |
S&P Target Date 2065+ Index |
21.12% |
16.98% |
*The Fund compares its performance against this broad-based index in response to regulatory requirements.
WHAT ARE SOME KEY FUND STATISTICS AS OF 7/31/2026?
Fund’s net assets |
$100,726 |
Number of fund holdings |
8 |
Total advisory fees paid for the year |
$0 |
Portfolio turnover rate for the year |
21% |
WHAT ARE SOME CHARACTERISTICS OF THE FUND’S HOLDINGS AS OF 7/31/2026?
Investment Allocation |
% of Net Assets |
Affiliated Mutual Funds - Domestic Equity |
56.1% |
Affiliated Mutual Funds - International Equity |
40.8% |
Affiliated Exchange-Traded Funds - Fixed Income |
3.0% |
Affiliated Mutual Fund - Short-Term Investment |
0.3% |
100.2% | |
Liabilities in excess of other assets |
(0.2)% |
100.0% |
WHAT WERE THE FUND COSTS FOR THE LAST YEAR?
(Based on a hypothetical $10,000 investment)
Costs of a $10,000 investment |
Costs paid as a percentage of a $10,000 investment | |
PGIM Target Date 2070 Fund—Class R3 |
$28 |
0.25% |
WHAT AFFECTED THE FUND’S PERFORMANCE DURING THE REPORTING PERIOD?
■ Despite some volatility across global markets in 2026, the past 12 months were influenced by evolving monetary policy expectations, persistent inflation concerns, and heightened geopolitical uncertainty. U.S. equities generally benefited from resilient corporate earnings and economic growth, while fixed income markets experienced periodic volatility as the interest rate outlook continued to be reassessed.
■
Given the Fund is comprised of equities, fixed income, and non-traditional assets, performance saw a number of contributors to performance.
Across the asset classes included, the greatest level of performance was provided by emerging markets equity, U.S. small-cap equity, and
non-U.S. developed markets equity, with returns of 36.4%, 34.2%, and 24.3%, respectively.
■
Given the Fund is comprised of equities, fixed income, and non-traditional assets, performance saw a number of detractors from performance.
Across the asset classes included, the lowest level of performance was provided by U.S. aggregate bonds, global REITs, and U.S. large-cap
equity, with returns of 2.7%, 17.7%, and 19.6%, respectively.
■
The PGIM Target Date Funds do not use derivatives, although derivatives are used in some of the underlying funds.
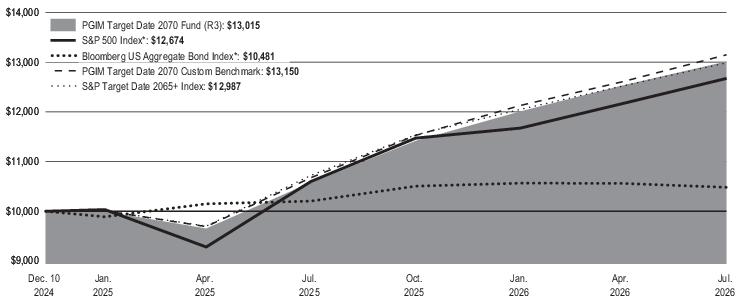
Average Annual Total Returns as of 7/31/2026 | ||
One Year (%) |
Since Inception (%) | |
Class R3 |
23.01% |
17.42% (12/10/2024) |
S&P 500 Index* |
19.56% |
15.28% |
Bloomberg US Aggregate Bond Index* |
2.71% |
2.86% |
PGIM Target Date 2070 Custom Benchmark |
23.16% |
17.85% |
S&P Target Date 2065+ Index |
21.12% |
16.98% |
*The Fund compares its performance against this broad-based index in response to regulatory requirements.
WHAT ARE SOME KEY FUND STATISTICS AS OF 7/31/2026?
Fund’s net assets |
$100,726 |
Number of fund holdings |
8 |
Total advisory fees paid for the year |
$0 |
Portfolio turnover rate for the year |
21% |
WHAT ARE SOME CHARACTERISTICS OF THE FUND’S HOLDINGS AS OF 7/31/2026?
Investment Allocation |
% of Net Assets |
Affiliated Mutual Funds - Domestic Equity |
56.1% |
Affiliated Mutual Funds - International Equity |
40.8% |
Affiliated Exchange-Traded Funds - Fixed Income |
3.0% |
Affiliated Mutual Fund - Short-Term Investment |
0.3% |
100.2% | |
Liabilities in excess of other assets |
(0.2)% |
100.0% |
WHAT WERE THE FUND COSTS FOR THE LAST YEAR?
(Based on a hypothetical $10,000 investment)
Costs of a $10,000 investment |
Costs paid as a percentage of a $10,000 investment | |
PGIM Target Date 2070 Fund—Class R4 |
$17 |
0.15% |
WHAT AFFECTED THE FUND’S PERFORMANCE DURING THE REPORTING PERIOD?
■ Despite some volatility across global markets in 2026, the past 12 months were influenced by evolving monetary policy expectations, persistent inflation concerns, and heightened geopolitical uncertainty. U.S. equities generally benefited from resilient corporate earnings and economic growth, while fixed income markets experienced periodic volatility as the interest rate outlook continued to be reassessed.
■
Given the Fund is comprised of equities, fixed income, and non-traditional assets, performance saw a number of contributors to performance.
Across the asset classes included, the greatest level of performance was provided by emerging markets equity, U.S. small-cap equity, and
non-U.S. developed markets equity, with returns of 36.4%, 34.2%, and 24.3%, respectively.
■
Given the Fund is comprised of equities, fixed income, and non-traditional assets, performance saw a number of detractors from performance.
Across the asset classes included, the lowest level of performance was provided by U.S. aggregate bonds, global REITs, and U.S. large-cap
equity, with returns of 2.7%, 17.7%, and 19.6%, respectively.
■
The PGIM Target Date Funds do not use derivatives, although derivatives are used in some of the underlying funds.
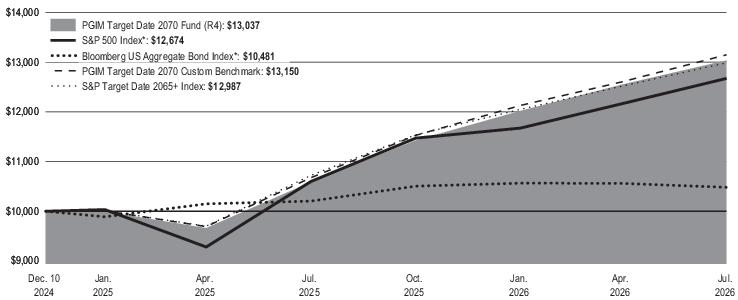
Average Annual Total Returns as of 7/31/2026 | ||
One Year (%) |
Since Inception (%) | |
Class R4 |
23.10% |
17.54% (12/10/2024) |
S&P 500 Index* |
19.56% |
15.28% |
Bloomberg US Aggregate Bond Index* |
2.71% |
2.86% |
PGIM Target Date 2070 Custom Benchmark |
23.16% |
17.85% |
S&P Target Date 2065+ Index |
21.12% |
16.98% |
*The Fund compares its performance against this broad-based index in response to regulatory requirements.
WHAT ARE SOME KEY FUND STATISTICS AS OF 7/31/2026?
Fund’s net assets |
$100,726 |
Number of fund holdings |
8 |
Total advisory fees paid for the year |
$0 |
Portfolio turnover rate for the year |
21% |
WHAT ARE SOME CHARACTERISTICS OF THE FUND’S HOLDINGS AS OF 7/31/2026?
Investment Allocation |
% of Net Assets |
Affiliated Mutual Funds - Domestic Equity |
56.1% |
Affiliated Mutual Funds - International Equity |
40.8% |
Affiliated Exchange-Traded Funds - Fixed Income |
3.0% |
Affiliated Mutual Fund - Short-Term Investment |
0.3% |
100.2% | |
Liabilities in excess of other assets |
(0.2)% |
100.0% |
WHAT WERE THE FUND COSTS FOR THE LAST YEAR?
(Based on a hypothetical $10,000 investment)
Costs of a $10,000 investment |
Costs paid as a percentage of a $10,000 investment | |
PGIM Target Date 2070 Fund—Class R5 |
$6 |
0.05% |
WHAT AFFECTED THE FUND’S PERFORMANCE DURING THE REPORTING PERIOD?
■ Despite some volatility across global markets in 2026, the past 12 months were influenced by evolving monetary policy expectations, persistent inflation concerns, and heightened geopolitical uncertainty. U.S. equities generally benefited from resilient corporate earnings and economic growth, while fixed income markets experienced periodic volatility as the interest rate outlook continued to be reassessed.
■
Given the Fund is comprised of equities, fixed income, and non-traditional assets, performance saw a number of contributors to performance.
Across the asset classes included, the greatest level of performance was provided by emerging markets equity, U.S. small-cap equity, and
non-U.S. developed markets equity, with returns of 36.4%, 34.2%, and 24.3%, respectively.
■
Given the Fund is comprised of equities, fixed income, and non-traditional assets, performance saw a number of detractors from performance.
Across the asset classes included, the lowest level of performance was provided by U.S. aggregate bonds, global REITs, and U.S. large-cap
equity, with returns of 2.7%, 17.7%, and 19.6%, respectively.
■
The PGIM Target Date Funds do not use derivatives, although derivatives are used in some of the underlying funds.
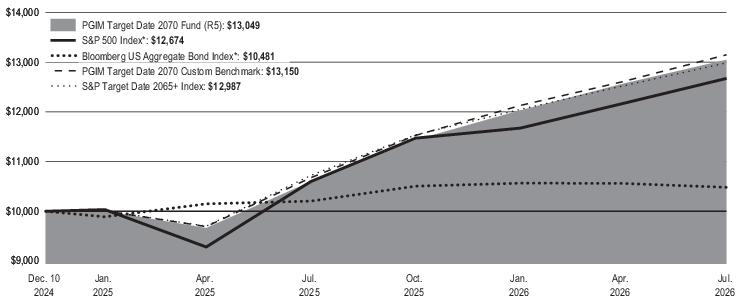
Average Annual Total Returns as of 7/31/2026 | ||
One Year (%) |
Since Inception (%) | |
Class R5 |
23.10% |
17.61% (12/10/2024) |
S&P 500 Index* |
19.56% |
15.28% |
Bloomberg US Aggregate Bond Index* |
2.71% |
2.86% |
PGIM Target Date 2070 Custom Benchmark |
23.16% |
17.85% |
S&P Target Date 2065+ Index |
21.12% |
16.98% |
*The Fund compares its performance against this broad-based index in response to regulatory requirements.
WHAT ARE SOME KEY FUND STATISTICS AS OF 7/31/2026?
Fund’s net assets |
$100,726 |
Number of fund holdings |
8 |
Total advisory fees paid for the year |
$0 |
Portfolio turnover rate for the year |
21% |
WHAT ARE SOME CHARACTERISTICS OF THE FUND’S HOLDINGS AS OF 7/31/2026?
Investment Allocation |
% of Net Assets |
Affiliated Mutual Funds - Domestic Equity |
56.1% |
Affiliated Mutual Funds - International Equity |
40.8% |
Affiliated Exchange-Traded Funds - Fixed Income |
3.0% |
Affiliated Mutual Fund - Short-Term Investment |
0.3% |
100.2% | |
Liabilities in excess of other assets |
(0.2)% |
100.0% |
WHAT WERE THE FUND COSTS FOR THE LAST YEAR?
(Based on a hypothetical $10,000 investment)
Costs of a $10,000 investment |
Costs paid as a percentage of a $10,000 investment | |
PGIM Target Date 2070 Fund—Class R6 |
$0 |
0.00% |
WHAT AFFECTED THE FUND’S PERFORMANCE DURING THE REPORTING PERIOD?
■ Despite some volatility across global markets in 2026, the past 12 months were influenced by evolving monetary policy expectations, persistent inflation concerns, and heightened geopolitical uncertainty. U.S. equities generally benefited from resilient corporate earnings and economic growth, while fixed income markets experienced periodic volatility as the interest rate outlook continued to be reassessed.
■
Given the Fund is comprised of equities, fixed income, and non-traditional assets, performance saw a number of contributors to performance.
Across the asset classes included, the greatest level of performance was provided by emerging markets equity, U.S. small-cap equity, and
non-U.S. developed markets equity, with returns of 36.4%, 34.2%, and 24.3%, respectively.
■
Given the Fund is comprised of equities, fixed income, and non-traditional assets, performance saw a number of detractors from performance.
Across the asset classes included, the lowest level of performance was provided by U.S. aggregate bonds, global REITs, and U.S. large-cap
equity, with returns of 2.7%, 17.7%, and 19.6%, respectively.
■
The PGIM Target Date Funds do not use derivatives, although derivatives are used in some of the underlying funds.
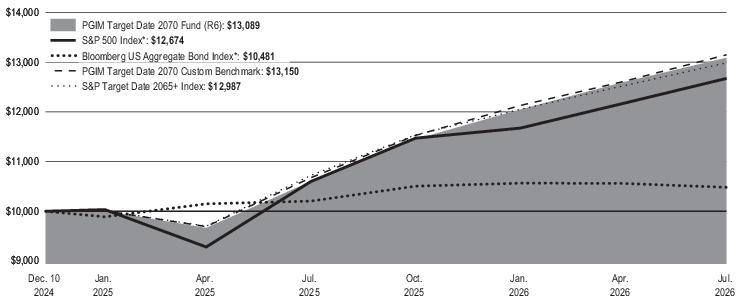
Average Annual Total Returns as of 7/31/2026 | ||
One Year (%) |
Since Inception (%) | |
Class R6 |
23.46% |
17.83% (12/10/2024) |
S&P 500 Index* |
19.56% |
15.28% |
Bloomberg US Aggregate Bond Index* |
2.71% |
2.86% |
PGIM Target Date 2070 Custom Benchmark |
23.16% |
17.85% |
S&P Target Date 2065+ Index |
21.12% |
16.98% |
*The Fund compares its performance against this broad-based index in response to regulatory requirements.
WHAT ARE SOME KEY FUND STATISTICS AS OF 7/31/2026?
Fund’s net assets |
$100,726 |
Number of fund holdings |
8 |
Total advisory fees paid for the year |
$0 |
Portfolio turnover rate for the year |
21% |
WHAT ARE SOME CHARACTERISTICS OF THE FUND’S HOLDINGS AS OF 7/31/2026?
Investment Allocation |
% of Net Assets |
Affiliated Mutual Funds - Domestic Equity |
56.1% |
Affiliated Mutual Funds - International Equity |
40.8% |
Affiliated Exchange-Traded Funds - Fixed Income |
3.0% |
Affiliated Mutual Fund - Short-Term Investment |
0.3% |
100.2% | |
Liabilities in excess of other assets |
(0.2)% |
100.0% |
WHAT WERE THE FUND COSTS FOR THE LAST YEAR?
(Based on a hypothetical $10,000 investment)
Costs of a $10,000 investment |
Costs paid as a percentage of a $10,000 investment | |
PGIM 60/40 Allocation Fund—Class R6 |
$1 |
0.01% |
WHAT AFFECTED THE FUND’S PERFORMANCE DURING THE REPORTING PERIOD?
■ Despite some volatility across global markets in 2026, the past 12 months provided strong returns across U.S. equities, with the S&P 500 Index returning 19.6%, significantly outpacing the returns of bonds, with the Bloomberg US Aggregate Bond Index returning 2.7%.
■
As the Fund invests solely in U.S. large-cap equities and U.S. bonds, the largest contributor to performance was exposure to U.S. large-cap
equities, which provided a return of 19.6% during the reporting period.
■
During the period, the underlying funds—the PGIM Quant Solutions Large-Cap Core Fund and the PGIM Total Return Bond Fund—
outperformed their respective indexes by 3.2% and 0.5%, respectively.
■
The PGIM 60/40 Allocation Fund does not use derivatives. Derivatives are used in the Total Return Bond Fund, which is an underlying fund.
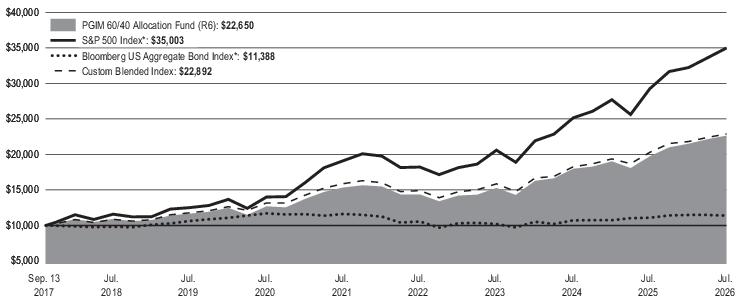
Average Annual Total Returns as of 7/31/2026 | |||
One Year (%) |
Five Years (%) |
Since Inception (%) | |
Class R6 |
14.74% |
8.10% |
9.64% (9/13/2017) |
S&P 500 Index* |
19.56% |
12.86% |
15.09% |
Bloomberg US Aggregate Bond Index* |
2.71% |
-0.40% |
1.47% |
Custom Blended Index |
12.72% |
7.58% |
9.73% |
*The Fund compares its performance against this broad-based index in response to regulatory requirements.
WHAT ARE SOME KEY FUND STATISTICS AS OF 7/31/2026?
Fund’s net assets |
$157,287,891 |
Number of fund holdings |
3 |
Total advisory fees paid for the year |
$0 |
Portfolio turnover rate for the year |
58% |
WHAT ARE SOME CHARACTERISTICS OF THE FUND’S HOLDINGS AS OF 7/31/2026?
Investment Allocation |
% of Net Assets |
Affiliated Mutual Funds - Domestic Equity |
60.2% |
Affiliated Exchange-Traded Funds - Fixed Income |
39.6% |
Affiliated Mutual Fund - Short-Term Investment |
0.0%* |
99.8% | |
Other assets in excess of liabilities |
0.2% |
100.0% |
* |
Less than 0.05% |