Shareholder Report
|
12 Months Ended |
|
Jul. 31, 2026
USD ($)
Holding
|
|---|
| Shareholder Report [Line Items] |
|
| Document Type |
N-CSR
|
| Amendment Flag |
false
|
| Registrant Name |
LORD ABBETT DEVELOPING GROWTH FUND, INC.
|
| Entity Central Index Key |
0000276914
|
| Entity Investment Company Type |
N-1A
|
| Document Period End Date |
Jul. 31, 2026
|
| Shareholder Report Annual or Semi-Annual |
Annual Shareholder Report
|
| C000018473 |
|
| Shareholder Report [Line Items] |
|
| Fund Name |
Lord Abbett Developing Growth Fund
|
| Class Name |
Class A
|
| Trading Symbol |
LAGWX
|
| Annual or Semi-Annual Statement [Text Block] |
This annual shareholder report contains important information about the Lord Abbett Developing Growth Fund for the period of August 1, 2025 to July 31, 2026 (the "reporting period").
|
| Additional Information [Text Block] |
You can find additional information about the Fund at lordabbett.com/FundDocuments. You can also request this information by contacting us at 888-522-2388.
|
| Additional Information Phone Number |
888-522-2388
|
| Additional Information Website |
<span style="box-sizing: border-box; color: rgb(0, 0, 0); display: inline; flex-wrap: nowrap; font-size: 13.3333px; font-weight: 400; grid-area: auto; line-height: 20px; margin: 0px; overflow: visible; text-align: left; text-align-last: auto; white-space-collapse: preserve-breaks;">lordabbett.com/FundDocuments</span>
|
| Expenses [Text Block] |
What were the Fund costs for the reporting period?(based on a hypothetical $10,000 investment) Table SummaryClass Name | Costs of a $10,000 investment | Costs paid as a percentage of a $10,000 investment |
|---|
Class A | $107 | 0.91% |
|---|
|
| Expenses Paid, Amount |
$ 107
|
| Expense Ratio, Percent |
0.91%
|
| Factors Affecting Performance [Text Block] |
How did the Fund perform last year and what affected its performance?For the fiscal year ended July 31, 2026, the Fund returned 34.29%, reflecting performance at the net asset value (NAV) of Class A shares, with all distributions reinvested, compared to the 28.42% return of a securities market index with investment characteristics similar to those of the Fund, the Russell 2000 Growth Index. The Fund's broad-based securities market index, the S&P 500 Index, returned 19.56% over the same period. Markets navigated a resilient economic backdrop amid geopolitical and inflation uncertainty. Healthy consumer spending, labor markets, and corporate earnings supported the outlook, while artificial intelligence ("AI") disruption concerns and U.S.-Iran tensions drove volatility and higher energy prices. A June ceasefire stabilized oil markets, though geopolitical tensions continued to influence Treasury yields. Meanwhile, Kevin Warsh became Fed Chair, and the Fed held rates unchanged in July amid resilient economic data. Top contributors to performance: Security selection within the Industrials sector contributed to relative performance over the period, driven by an allocation to Comfort Systems USA, a provider of commercial heating, cooling, and electrical services. Security selection within the Information Technology sector also contributed to relative performance, driven by an allocation to Astera Labs, a semiconductor technology company. Top detractors from performance: Security selection within the Consumer Discretionary sector detracted from relative performance over the period, driven by an allocation to Planet Fitness, a fitness center operator and franchisor. Security selection within the Consumer Staples sector also detracted from relative performance, driven by an allocation to Celsius Holdings, an energy drink company. |
| Performance Past Does Not Indicate Future [Text] |
The Fund's past performance is no guarantee of future results.
|
| Line Graph [Table Text Block] |
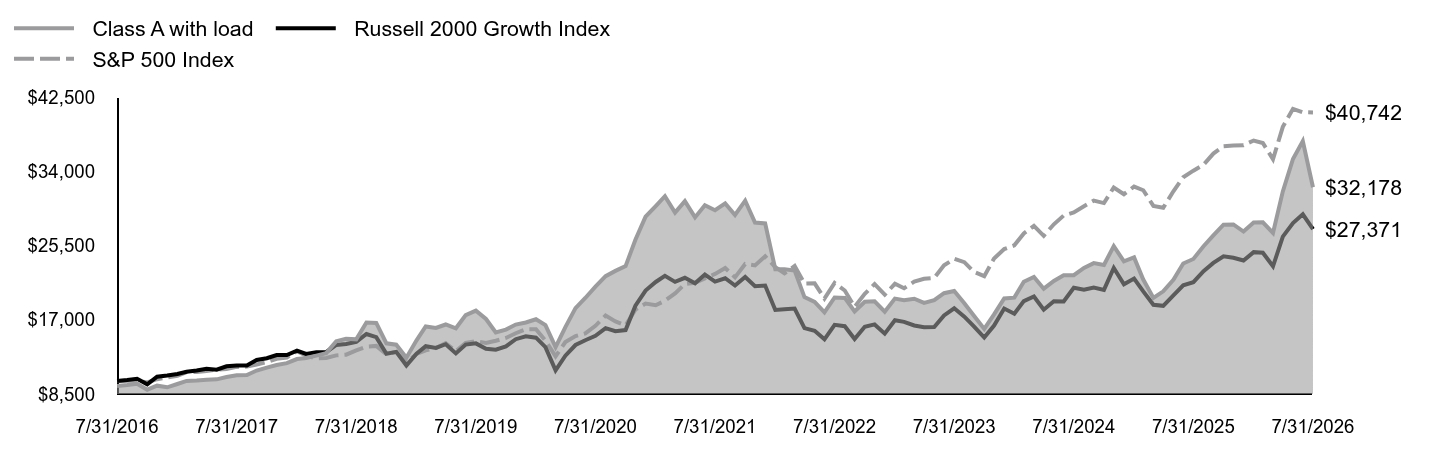 Table Summary | Class A with load | Russell 2000 Growth Index | S&P 500 Index |
|---|
7/31/2016 | $9,427 | $10,000 | $10,000 |
|---|
8/31/2016 | $9,520 | $10,106 | $10,014 |
|---|
9/30/2016 | $9,685 | $10,252 | $10,016 |
|---|
10/31/2016 | $8,998 | $9,615 | $9,833 |
|---|
11/30/2016 | $9,453 | $10,475 | $10,197 |
|---|
12/31/2016 | $9,267 | $10,618 | $10,399 |
|---|
1/31/2017 | $9,644 | $10,790 | $10,596 |
|---|
2/28/2017 | $10,000 | $11,055 | $11,017 |
|---|
3/31/2017 | $10,041 | $11,186 | $11,030 |
|---|
4/30/2017 | $10,119 | $11,392 | $11,143 |
|---|
5/31/2017 | $10,176 | $11,288 | $11,300 |
|---|
6/30/2017 | $10,449 | $11,677 | $11,370 |
|---|
7/31/2017 | $10,640 | $11,776 | $11,604 |
|---|
8/31/2017 | $10,676 | $11,762 | $11,640 |
|---|
9/30/2017 | $11,187 | $12,403 | $11,880 |
|---|
10/31/2017 | $11,528 | $12,595 | $12,157 |
|---|
11/30/2017 | $11,817 | $12,957 | $12,530 |
|---|
12/31/2017 | $12,039 | $12,971 | $12,669 |
|---|
1/31/2018 | $12,504 | $13,477 | $13,395 |
|---|
2/28/2018 | $12,623 | $13,093 | $12,901 |
|---|
3/31/2018 | $12,901 | $13,270 | $12,573 |
|---|
4/30/2018 | $13,185 | $13,283 | $12,621 |
|---|
5/31/2018 | $14,543 | $14,119 | $12,925 |
|---|
6/30/2018 | $14,832 | $14,229 | $13,005 |
|---|
7/31/2018 | $14,760 | $14,474 | $13,489 |
|---|
8/31/2018 | $16,680 | $15,375 | $13,928 |
|---|
9/30/2018 | $16,639 | $15,015 | $14,008 |
|---|
10/31/2018 | $14,306 | $13,115 | $13,050 |
|---|
11/30/2018 | $14,148 | $13,321 | $13,316 |
|---|
12/31/2018 | $12,652 | $11,764 | $12,114 |
|---|
1/31/2019 | $14,649 | $13,123 | $13,085 |
|---|
2/28/2019 | $16,241 | $13,970 | $13,505 |
|---|
3/31/2019 | $16,069 | $13,781 | $13,767 |
|---|
4/30/2019 | $16,460 | $14,201 | $14,324 |
|---|
5/31/2019 | $16,028 | $13,147 | $13,414 |
|---|
6/30/2019 | $17,531 | $14,160 | $14,360 |
|---|
7/31/2019 | $18,045 | $14,298 | $14,566 |
|---|
8/31/2019 | $17,092 | $13,681 | $14,335 |
|---|
9/30/2019 | $15,541 | $13,569 | $14,603 |
|---|
10/31/2019 | $15,877 | $13,955 | $14,920 |
|---|
11/30/2019 | $16,452 | $14,776 | $15,461 |
|---|
12/31/2019 | $16,690 | $15,115 | $15,928 |
|---|
1/31/2020 | $17,055 | $14,948 | $15,922 |
|---|
2/29/2020 | $16,392 | $13,869 | $14,611 |
|---|
3/31/2020 | $13,867 | $11,221 | $12,806 |
|---|
4/30/2020 | $16,162 | $12,892 | $14,448 |
|---|
5/31/2020 | $18,331 | $14,110 | $15,136 |
|---|
6/30/2020 | $19,495 | $14,652 | $15,437 |
|---|
7/31/2020 | $20,796 | $15,156 | $16,308 |
|---|
8/31/2020 | $21,995 | $16,045 | $17,480 |
|---|
9/30/2020 | $22,599 | $15,701 | $16,816 |
|---|
10/31/2020 | $23,143 | $15,820 | $16,369 |
|---|
11/30/2020 | $26,163 | $18,610 | $18,160 |
|---|
12/31/2020 | $28,802 | $20,350 | $18,859 |
|---|
1/31/2021 | $30,027 | $21,331 | $18,668 |
|---|
2/28/2021 | $31,158 | $22,035 | $19,183 |
|---|
3/31/2021 | $29,273 | $21,342 | $20,023 |
|---|
4/30/2021 | $30,592 | $21,807 | $21,092 |
|---|
5/31/2021 | $28,726 | $21,184 | $21,239 |
|---|
6/30/2021 | $30,112 | $22,178 | $21,735 |
|---|
7/31/2021 | $29,546 | $21,370 | $22,251 |
|---|
8/31/2021 | $30,329 | $21,758 | $22,928 |
|---|
9/30/2021 | $29,009 | $20,924 | $21,861 |
|---|
10/31/2021 | $30,640 | $21,904 | $23,393 |
|---|
11/30/2021 | $28,132 | $20,834 | $23,231 |
|---|
12/31/2021 | $28,037 | $20,926 | $24,272 |
|---|
1/31/2022 | $22,783 | $18,122 | $23,016 |
|---|
2/28/2022 | $22,793 | $18,201 | $22,327 |
|---|
3/31/2022 | $22,635 | $18,284 | $23,156 |
|---|
4/30/2022 | $19,601 | $16,041 | $21,137 |
|---|
5/31/2022 | $19,051 | $15,738 | $21,175 |
|---|
6/30/2022 | $17,846 | $14,763 | $19,427 |
|---|
7/31/2022 | $19,558 | $16,416 | $21,219 |
|---|
8/31/2022 | $19,505 | $16,262 | $20,353 |
|---|
9/30/2022 | $17,951 | $14,799 | $18,479 |
|---|
10/31/2022 | $19,061 | $16,204 | $19,975 |
|---|
11/30/2022 | $19,114 | $16,468 | $21,091 |
|---|
12/31/2022 | $17,920 | $15,411 | $19,876 |
|---|
1/31/2023 | $19,421 | $16,944 | $21,125 |
|---|
2/28/2023 | $19,241 | $16,760 | $20,610 |
|---|
3/31/2023 | $19,410 | $16,347 | $21,366 |
|---|
4/30/2023 | $18,935 | $16,157 | $21,700 |
|---|
5/31/2023 | $19,241 | $16,160 | $21,794 |
|---|
6/30/2023 | $20,045 | $17,499 | $23,234 |
|---|
7/31/2023 | $20,298 | $18,318 | $23,980 |
|---|
8/31/2023 | $18,903 | $17,364 | $23,599 |
|---|
9/30/2023 | $17,444 | $16,219 | $22,474 |
|---|
10/31/2023 | $15,953 | $14,968 | $22,001 |
|---|
11/30/2023 | $17,624 | $16,331 | $24,010 |
|---|
12/31/2023 | $19,442 | $18,286 | $25,101 |
|---|
1/31/2024 | $19,537 | $17,700 | $25,523 |
|---|
2/29/2024 | $21,356 | $19,137 | $26,886 |
|---|
3/31/2024 | $21,895 | $19,673 | $27,751 |
|---|
4/30/2024 | $20,563 | $18,158 | $26,617 |
|---|
5/31/2024 | $21,451 | $19,130 | $27,937 |
|---|
6/30/2024 | $22,096 | $19,098 | $28,939 |
|---|
7/31/2024 | $22,106 | $20,662 | $29,292 |
|---|
8/31/2024 | $22,941 | $20,433 | $30,002 |
|---|
9/30/2024 | $23,491 | $20,704 | $30,643 |
|---|
10/31/2024 | $23,269 | $20,430 | $30,365 |
|---|
11/30/2024 | $25,442 | $22,935 | $32,148 |
|---|
12/31/2024 | $23,697 | $21,057 | $31,381 |
|---|
1/31/2025 | $24,142 | $21,723 | $32,255 |
|---|
2/28/2025 | $21,604 | $20,252 | $31,834 |
|---|
3/31/2025 | $19,510 | $18,717 | $30,041 |
|---|
4/30/2025 | $20,261 | $18,597 | $29,837 |
|---|
5/31/2025 | $21,583 | $19,791 | $31,715 |
|---|
6/30/2025 | $23,444 | $20,956 | $33,328 |
|---|
7/31/2025 | $23,962 | $21,313 | $34,076 |
|---|
8/31/2025 | $25,421 | $22,574 | $34,766 |
|---|
9/30/2025 | $26,658 | $23,511 | $36,035 |
|---|
10/31/2025 | $27,896 | $24,272 | $36,879 |
|---|
11/30/2025 | $27,917 | $24,106 | $36,970 |
|---|
12/31/2025 | $27,102 | $23,797 | $36,992 |
|---|
1/31/2026 | $28,139 | $24,744 | $37,529 |
|---|
2/28/2026 | $28,160 | $24,684 | $37,243 |
|---|
3/31/2026 | $26,954 | $23,129 | $35,389 |
|---|
4/30/2026 | $31,702 | $26,527 | $39,102 |
|---|
5/31/2026 | $35,414 | $28,077 | $41,160 |
|---|
6/30/2026 | $37,466 | $29,075 | $40,768 |
|---|
7/31/2026 | $32,178 | $27,371 | $40,742 |
|---|
|
| Average Annual Return [Table Text Block] |
Table SummaryAATR | 1 Year | 5 Years | 10 Years |
|---|
Class A at NAV | 34.29% | 1.72% | 13.06% |
|---|
Class A with sales charge | 26.58% | 0.53% | 12.40% |
|---|
Russell 2000 Growth Index | 28.42% | 5.07% | 10.59% |
|---|
S&P 500 Index | 19.56% | 12.86% | 15.08% |
|---|
|
| No Deduction of Taxes [Text Block] |
The returns do not reflect the deduction of taxes that a shareholder would pay on Fund distributions or redemption of Fund shares.
|
| AssetsNet |
$ 2,220,280,642
|
| Holdings Count | Holding |
92
|
| Advisory Fees Paid, Amount |
$ 10,884,699
|
| InvestmentCompanyPortfolioTurnover |
110.00%
|
| Additional Fund Statistics [Text Block] |
Table SummaryTotal Net Assets | $2,220,280,642 |
|---|
# of Portfolio Holdings | 92 |
|---|
Portfolio Turnover Rate | 110% |
|---|
Total Advisory Fees Paid | $10,884,699 |
|---|
|
| Holdings [Text Block] |
Table SummaryPortfolio Holdings Presented by SectorFootnote Reference* | % Footnote Reference** |
|---|
Communication Services | 2.33% | Consumer Discretionary | 7.16% | Consumer Staples | 1.11% | Financials | 4.44% | Health Care | 28.41% | Industrials | 25.56% | Information Technology | 27.42% | Repurchase Agreements | 2.09% | Money Market FundsFootnote Reference† | 1.33% | Time DepositsFootnote Reference† | 0.15% | Total | 100.00% | | Footnote | Description | Footnote* | A sector may comprise several industries. | Footnote** | Represents percent of total investments, which excludes derivatives. | Footnote† | Securities were purchased with the cash collateral from loaned securities. |
|
| Material Fund Change [Text Block] |
There were no material changes to the Fund during the reporting period. |
| Summary of Change Legend [Text Block] |
There were no material changes to the Fund during the reporting period.
|
| C000018475 |
|
| Shareholder Report [Line Items] |
|
| Fund Name |
Lord Abbett Developing Growth Fund
|
| Class Name |
Class C
|
| Trading Symbol |
LADCX
|
| Annual or Semi-Annual Statement [Text Block] |
This annual shareholder report contains important information about the Lord Abbett Developing Growth Fund for the period of August 1, 2025 to July 31, 2026 (the "reporting period").
|
| Additional Information [Text Block] |
You can find additional information about the Fund at lordabbett.com/FundDocuments. You can also request this information by contacting us at 888-522-2388.
|
| Additional Information Phone Number |
888-522-2388
|
| Additional Information Website |
<span style="box-sizing: border-box; color: rgb(0, 0, 0); display: inline; flex-wrap: nowrap; font-size: 13.3333px; font-weight: 400; grid-area: auto; line-height: 20px; margin: 0px; overflow: visible; text-align: left; text-align-last: auto; white-space-collapse: preserve-breaks;">lordabbett.com/FundDocuments</span>
|
| Expenses [Text Block] |
What were the Fund costs for the reporting period?(based on a hypothetical $10,000 investment) Table SummaryClass Name | Costs of a $10,000 investment | Costs paid as a percentage of a $10,000 investment |
|---|
Class C | $193 | 1.66% |
|---|
|
| Expenses Paid, Amount |
$ 193
|
| Expense Ratio, Percent |
1.66%
|
| Factors Affecting Performance [Text Block] |
How did the Fund perform last year and what affected its performance?For the fiscal year ended July 31, 2026, the Fund returned 33.13%, reflecting performance at the net asset value (NAV) of Class C shares, with all distributions reinvested, compared to the 28.42% return of a securities market index with investment characteristics similar to those of the Fund, the Russell 2000 Growth Index. The Fund's broad-based securities market index, the S&P 500 Index, returned 19.56% over the same period. Markets navigated a resilient economic backdrop amid geopolitical and inflation uncertainty. Healthy consumer spending, labor markets, and corporate earnings supported the outlook, while artificial intelligence ("AI") disruption concerns and U.S.-Iran tensions drove volatility and higher energy prices. A June ceasefire stabilized oil markets, though geopolitical tensions continued to influence Treasury yields. Meanwhile, Kevin Warsh became Fed Chair, and the Fed held rates unchanged in July amid resilient economic data. Top contributors to performance: Security selection within the Industrials sector contributed to relative performance over the period, driven by an allocation to Comfort Systems USA, a provider of commercial heating, cooling, and electrical services. Security selection within the Information Technology sector also contributed to relative performance, driven by an allocation to Astera Labs, a semiconductor technology company. Top detractors from performance: Security selection within the Consumer Discretionary sector detracted from relative performance over the period, driven by an allocation to Planet Fitness, a fitness center operator and franchisor. Security selection within the Consumer Staples sector also detracted from relative performance, driven by an allocation to Celsius Holdings, an energy drink company. |
| Performance Past Does Not Indicate Future [Text] |
The Fund's past performance is no guarantee of future results.
|
| Line Graph [Table Text Block] |
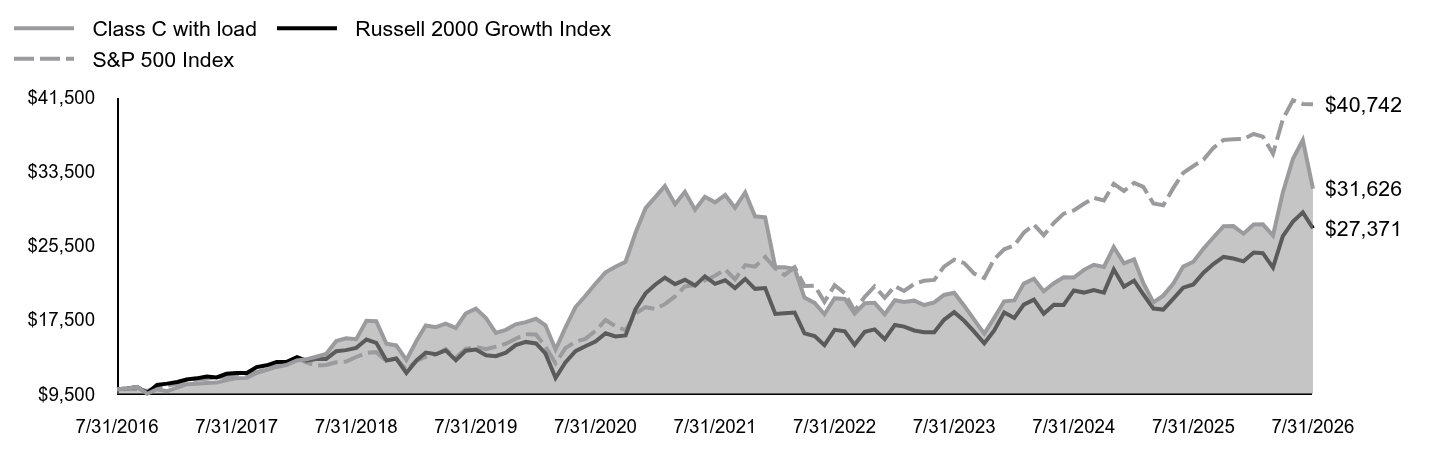 Table Summary | Class C with load | Russell 2000 Growth Index | S&P 500 Index |
|---|
7/31/2016 | $10,000 | $10,000 | $10,000 |
|---|
8/31/2016 | $10,094 | $10,106 | $10,014 |
|---|
9/30/2016 | $10,260 | $10,252 | $10,016 |
|---|
10/31/2016 | $9,530 | $9,615 | $9,833 |
|---|
11/30/2016 | $10,007 | $10,475 | $10,197 |
|---|
12/31/2016 | $9,805 | $10,618 | $10,399 |
|---|
1/31/2017 | $10,195 | $10,790 | $10,596 |
|---|
2/28/2017 | $10,564 | $11,055 | $11,017 |
|---|
3/31/2017 | $10,601 | $11,186 | $11,030 |
|---|
4/30/2017 | $10,673 | $11,392 | $11,143 |
|---|
5/31/2017 | $10,731 | $11,288 | $11,300 |
|---|
6/30/2017 | $11,013 | $11,677 | $11,370 |
|---|
7/31/2017 | $11,208 | $11,776 | $11,604 |
|---|
8/31/2017 | $11,237 | $11,762 | $11,640 |
|---|
9/30/2017 | $11,766 | $12,403 | $11,880 |
|---|
10/31/2017 | $12,113 | $12,595 | $12,157 |
|---|
11/30/2017 | $12,417 | $12,957 | $12,530 |
|---|
12/31/2017 | $12,641 | $12,971 | $12,669 |
|---|
1/31/2018 | $13,119 | $13,477 | $13,395 |
|---|
2/28/2018 | $13,234 | $13,093 | $12,901 |
|---|
3/31/2018 | $13,517 | $13,270 | $12,573 |
|---|
4/30/2018 | $13,813 | $13,283 | $12,621 |
|---|
5/31/2018 | $15,217 | $14,119 | $12,925 |
|---|
6/30/2018 | $15,499 | $14,229 | $13,005 |
|---|
7/31/2018 | $15,412 | $14,474 | $13,489 |
|---|
8/31/2018 | $17,402 | $15,375 | $13,928 |
|---|
9/30/2018 | $17,352 | $15,015 | $14,008 |
|---|
10/31/2018 | $14,913 | $13,115 | $13,050 |
|---|
11/30/2018 | $14,736 | $13,321 | $13,316 |
|---|
12/31/2018 | $13,173 | $11,764 | $12,114 |
|---|
1/31/2019 | $15,246 | $13,123 | $13,085 |
|---|
2/28/2019 | $16,884 | $13,970 | $13,505 |
|---|
3/31/2019 | $16,700 | $13,781 | $13,767 |
|---|
4/30/2019 | $17,090 | $14,201 | $14,324 |
|---|
5/31/2019 | $16,624 | $13,147 | $13,414 |
|---|
6/30/2019 | $18,176 | $14,160 | $14,360 |
|---|
7/31/2019 | $18,707 | $14,298 | $14,566 |
|---|
8/31/2019 | $17,698 | $13,681 | $14,335 |
|---|
9/30/2019 | $16,081 | $13,569 | $14,603 |
|---|
10/31/2019 | $16,418 | $13,955 | $14,920 |
|---|
11/30/2019 | $17,011 | $14,776 | $15,461 |
|---|
12/31/2019 | $17,242 | $15,115 | $15,928 |
|---|
1/31/2020 | $17,611 | $14,948 | $15,922 |
|---|
2/29/2020 | $16,903 | $13,869 | $14,611 |
|---|
3/31/2020 | $14,301 | $11,221 | $12,806 |
|---|
4/30/2020 | $16,657 | $12,892 | $14,448 |
|---|
5/31/2020 | $18,874 | $14,110 | $15,136 |
|---|
6/30/2020 | $20,059 | $14,652 | $15,437 |
|---|
7/31/2020 | $21,383 | $15,156 | $16,308 |
|---|
8/31/2020 | $22,614 | $16,045 | $17,480 |
|---|
9/30/2020 | $23,215 | $15,701 | $16,816 |
|---|
10/31/2020 | $23,754 | $15,820 | $16,369 |
|---|
11/30/2020 | $26,853 | $18,610 | $18,160 |
|---|
12/31/2020 | $29,532 | $20,350 | $18,859 |
|---|
1/31/2021 | $30,779 | $21,331 | $18,668 |
|---|
2/28/2021 | $31,914 | $22,035 | $19,183 |
|---|
3/31/2021 | $29,960 | $21,342 | $20,023 |
|---|
4/30/2021 | $31,300 | $21,807 | $21,092 |
|---|
5/31/2021 | $29,365 | $21,184 | $21,239 |
|---|
6/30/2021 | $30,761 | $22,178 | $21,735 |
|---|
7/31/2021 | $30,165 | $21,370 | $22,251 |
|---|
8/31/2021 | $30,947 | $21,758 | $22,928 |
|---|
9/30/2021 | $29,570 | $20,924 | $21,861 |
|---|
10/31/2021 | $31,226 | $21,904 | $23,393 |
|---|
11/30/2021 | $28,657 | $20,834 | $23,231 |
|---|
12/31/2021 | $28,539 | $20,926 | $24,272 |
|---|
1/31/2022 | $23,166 | $18,122 | $23,016 |
|---|
2/28/2022 | $23,166 | $18,201 | $22,327 |
|---|
3/31/2022 | $23,001 | $18,284 | $23,156 |
|---|
4/30/2022 | $19,890 | $16,041 | $21,137 |
|---|
5/31/2022 | $19,324 | $15,738 | $21,175 |
|---|
6/30/2022 | $18,099 | $14,763 | $19,427 |
|---|
7/31/2022 | $19,819 | $16,416 | $21,219 |
|---|
8/31/2022 | $19,749 | $16,262 | $20,353 |
|---|
9/30/2022 | $18,170 | $14,799 | $18,479 |
|---|
10/31/2022 | $19,277 | $16,204 | $19,975 |
|---|
11/30/2022 | $19,324 | $16,468 | $21,091 |
|---|
12/31/2022 | $18,099 | $15,411 | $19,876 |
|---|
1/31/2023 | $19,607 | $16,944 | $21,125 |
|---|
2/28/2023 | $19,419 | $16,760 | $20,610 |
|---|
3/31/2023 | $19,560 | $16,347 | $21,366 |
|---|
4/30/2023 | $19,089 | $16,157 | $21,700 |
|---|
5/31/2023 | $19,372 | $16,160 | $21,794 |
|---|
6/30/2023 | $20,173 | $17,499 | $23,234 |
|---|
7/31/2023 | $20,408 | $18,318 | $23,980 |
|---|
8/31/2023 | $18,994 | $17,364 | $23,599 |
|---|
9/30/2023 | $17,510 | $16,219 | $22,474 |
|---|
10/31/2023 | $16,002 | $14,968 | $22,001 |
|---|
11/30/2023 | $17,675 | $16,331 | $24,010 |
|---|
12/31/2023 | $19,489 | $18,286 | $25,101 |
|---|
1/31/2024 | $19,584 | $17,700 | $25,523 |
|---|
2/29/2024 | $21,398 | $19,137 | $26,886 |
|---|
3/31/2024 | $21,917 | $19,673 | $27,751 |
|---|
4/30/2024 | $20,573 | $18,158 | $26,617 |
|---|
5/31/2024 | $21,445 | $19,130 | $27,937 |
|---|
6/30/2024 | $22,082 | $19,098 | $28,939 |
|---|
7/31/2024 | $22,058 | $20,662 | $29,292 |
|---|
8/31/2024 | $22,883 | $20,433 | $30,002 |
|---|
9/30/2024 | $23,425 | $20,704 | $30,643 |
|---|
10/31/2024 | $23,189 | $20,430 | $30,365 |
|---|
11/30/2024 | $25,334 | $22,935 | $32,148 |
|---|
12/31/2024 | $23,590 | $21,057 | $31,381 |
|---|
1/31/2025 | $24,014 | $21,723 | $32,255 |
|---|
2/28/2025 | $21,469 | $20,252 | $31,834 |
|---|
3/31/2025 | $19,372 | $18,717 | $30,041 |
|---|
4/30/2025 | $20,102 | $18,597 | $29,837 |
|---|
5/31/2025 | $21,398 | $19,791 | $31,715 |
|---|
6/30/2025 | $23,236 | $20,956 | $33,328 |
|---|
7/31/2025 | $23,755 | $21,313 | $34,076 |
|---|
8/31/2025 | $25,169 | $22,574 | $34,766 |
|---|
9/30/2025 | $26,371 | $23,511 | $36,035 |
|---|
10/31/2025 | $27,573 | $24,272 | $36,879 |
|---|
11/30/2025 | $27,596 | $24,106 | $36,970 |
|---|
12/31/2025 | $26,771 | $23,797 | $36,992 |
|---|
1/31/2026 | $27,761 | $24,744 | $37,529 |
|---|
2/28/2026 | $27,785 | $24,684 | $37,243 |
|---|
3/31/2026 | $26,583 | $23,129 | $35,389 |
|---|
4/30/2026 | $31,225 | $26,527 | $39,102 |
|---|
5/31/2026 | $34,855 | $28,077 | $41,160 |
|---|
6/30/2026 | $36,858 | $29,075 | $40,768 |
|---|
7/31/2026 | $31,626 | $27,371 | $40,742 |
|---|
|
| Average Annual Return [Table Text Block] |
Table SummaryAATR | 1 Year | 5 Years | 10 Years |
|---|
Class C at NAV | 33.13% | 0.95% | 12.20% |
|---|
Class C with sales charge | 32.13% | 0.95% | 12.20% |
|---|
Russell 2000 Growth Index | 28.42% | 5.07% | 10.59% |
|---|
S&P 500 Index | 19.56% | 12.86% | 15.08% |
|---|
|
| No Deduction of Taxes [Text Block] |
The returns do not reflect the deduction of taxes that a shareholder would pay on Fund distributions or redemption of Fund shares.
|
| AssetsNet |
$ 2,220,280,642
|
| Holdings Count | Holding |
92
|
| Advisory Fees Paid, Amount |
$ 10,884,699
|
| InvestmentCompanyPortfolioTurnover |
110.00%
|
| Additional Fund Statistics [Text Block] |
Table SummaryTotal Net Assets | $2,220,280,642 |
|---|
# of Portfolio Holdings | 92 |
|---|
Portfolio Turnover Rate | 110% |
|---|
Total Advisory Fees Paid | $10,884,699 |
|---|
|
| Holdings [Text Block] |
Table SummaryPortfolio Holdings Presented by SectorFootnote Reference* | % Footnote Reference** |
|---|
Communication Services | 2.33% | Consumer Discretionary | 7.16% | Consumer Staples | 1.11% | Financials | 4.44% | Health Care | 28.41% | Industrials | 25.56% | Information Technology | 27.42% | Repurchase Agreements | 2.09% | Money Market FundsFootnote Reference† | 1.33% | Time DepositsFootnote Reference† | 0.15% | Total | 100.00% | | Footnote | Description | Footnote* | A sector may comprise several industries. | Footnote** | Represents percent of total investments, which excludes derivatives. | Footnote† | Securities were purchased with the cash collateral from loaned securities. |
|
| Material Fund Change [Text Block] |
There were no material changes to the Fund during the reporting period. |
| Summary of Change Legend [Text Block] |
There were no material changes to the Fund during the reporting period.
|
| C000054855 |
|
| Shareholder Report [Line Items] |
|
| Fund Name |
Lord Abbett Developing Growth Fund
|
| Class Name |
Class F
|
| Trading Symbol |
LADFX
|
| Annual or Semi-Annual Statement [Text Block] |
This annual shareholder report contains important information about the Lord Abbett Developing Growth Fund for the period of August 1, 2025 to July 31, 2026 (the "reporting period").
|
| Additional Information [Text Block] |
You can find additional information about the Fund at lordabbett.com/FundDocuments. You can also request this information by contacting us at 888-522-2388.
|
| Additional Information Phone Number |
888-522-2388
|
| Additional Information Website |
<span style="box-sizing: border-box; color: rgb(0, 0, 0); display: inline; flex-wrap: nowrap; font-size: 13.3333px; font-weight: 400; grid-area: auto; line-height: 20px; margin: 0px; overflow: visible; text-align: left; text-align-last: auto; white-space-collapse: preserve-breaks;">lordabbett.com/FundDocuments</span>
|
| Expenses [Text Block] |
What were the Fund costs for the reporting period?(based on a hypothetical $10,000 investment) Table SummaryClass Name | Costs of a $10,000 investment | Costs paid as a percentage of a $10,000 investment |
|---|
Class F | $89 | 0.76% |
|---|
|
| Expenses Paid, Amount |
$ 89
|
| Expense Ratio, Percent |
0.76%
|
| Factors Affecting Performance [Text Block] |
How did the Fund perform last year and what affected its performance?For the fiscal year ended July 31, 2026, the Fund returned 34.50%, reflecting performance at the net asset value (NAV) of Class F shares, with all distributions reinvested, compared to the 28.42% return of a securities market index with investment characteristics similar to those of the Fund, the Russell 2000 Growth Index. The Fund's broad-based securities market index, the S&P 500 Index, returned 19.56% over the same period. Markets navigated a resilient economic backdrop amid geopolitical and inflation uncertainty. Healthy consumer spending, labor markets, and corporate earnings supported the outlook, while artificial intelligence ("AI") disruption concerns and U.S.-Iran tensions drove volatility and higher energy prices. A June ceasefire stabilized oil markets, though geopolitical tensions continued to influence Treasury yields. Meanwhile, Kevin Warsh became Fed Chair, and the Fed held rates unchanged in July amid resilient economic data. Top contributors to performance: Security selection within the Industrials sector contributed to relative performance over the period, driven by an allocation to Comfort Systems USA, a provider of commercial heating, cooling, and electrical services. Security selection within the Information Technology sector also contributed to relative performance, driven by an allocation to Astera Labs, a semiconductor technology company. Top detractors from performance: Security selection within the Consumer Discretionary sector detracted from relative performance over the period, driven by an allocation to Planet Fitness, a fitness center operator and franchisor. Security selection within the Consumer Staples sector also detracted from relative performance, driven by an allocation to Celsius Holdings, an energy drink company. |
| Performance Past Does Not Indicate Future [Text] |
The Fund's past performance is no guarantee of future results.
|
| Line Graph [Table Text Block] |
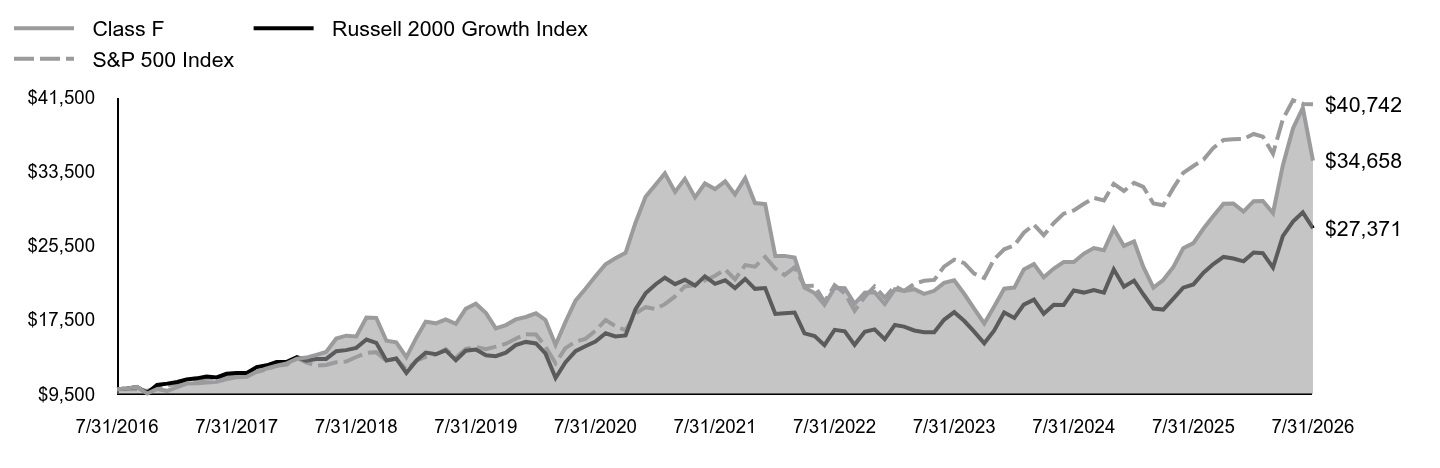 Table Summary | Class F | Russell 2000 Growth Index | S&P 500 Index |
|---|
7/31/2016 | $10,000 | $10,000 | $10,000 |
|---|
8/31/2016 | $10,106 | $10,106 | $10,014 |
|---|
9/30/2016 | $10,276 | $10,252 | $10,016 |
|---|
10/31/2016 | $9,549 | $9,615 | $9,833 |
|---|
11/30/2016 | $10,037 | $10,475 | $10,197 |
|---|
12/31/2016 | $9,841 | $10,618 | $10,399 |
|---|
1/31/2017 | $10,239 | $10,790 | $10,596 |
|---|
2/28/2017 | $10,620 | $11,055 | $11,017 |
|---|
3/31/2017 | $10,663 | $11,186 | $11,030 |
|---|
4/30/2017 | $10,748 | $11,392 | $11,143 |
|---|
5/31/2017 | $10,806 | $11,288 | $11,300 |
|---|
6/30/2017 | $11,103 | $11,677 | $11,370 |
|---|
7/31/2017 | $11,304 | $11,776 | $11,604 |
|---|
8/31/2017 | $11,347 | $11,762 | $11,640 |
|---|
9/30/2017 | $11,893 | $12,403 | $11,880 |
|---|
10/31/2017 | $12,253 | $12,595 | $12,157 |
|---|
11/30/2017 | $12,561 | $12,957 | $12,530 |
|---|
12/31/2017 | $12,805 | $12,971 | $12,669 |
|---|
1/31/2018 | $13,298 | $13,477 | $13,395 |
|---|
2/28/2018 | $13,425 | $13,093 | $12,901 |
|---|
3/31/2018 | $13,722 | $13,270 | $12,573 |
|---|
4/30/2018 | $14,030 | $13,283 | $12,621 |
|---|
5/31/2018 | $15,472 | $14,119 | $12,925 |
|---|
6/30/2018 | $15,785 | $14,229 | $13,005 |
|---|
7/31/2018 | $15,710 | $14,474 | $13,489 |
|---|
8/31/2018 | $17,752 | $15,375 | $13,928 |
|---|
9/30/2018 | $17,709 | $15,015 | $14,008 |
|---|
10/31/2018 | $15,233 | $13,115 | $13,050 |
|---|
11/30/2018 | $15,068 | $13,321 | $13,316 |
|---|
12/31/2018 | $13,473 | $11,764 | $12,114 |
|---|
1/31/2019 | $15,604 | $13,123 | $13,085 |
|---|
2/28/2019 | $17,304 | $13,970 | $13,505 |
|---|
3/31/2019 | $17,116 | $13,781 | $13,767 |
|---|
4/30/2019 | $17,541 | $14,201 | $14,324 |
|---|
5/31/2019 | $17,074 | $13,147 | $13,414 |
|---|
6/30/2019 | $18,683 | $14,160 | $14,360 |
|---|
7/31/2019 | $19,234 | $14,298 | $14,566 |
|---|
8/31/2019 | $18,217 | $13,681 | $14,335 |
|---|
9/30/2019 | $16,566 | $13,569 | $14,603 |
|---|
10/31/2019 | $16,928 | $13,955 | $14,920 |
|---|
11/30/2019 | $17,538 | $14,776 | $15,461 |
|---|
12/31/2019 | $17,803 | $15,115 | $15,928 |
|---|
1/31/2020 | $18,195 | $14,948 | $15,922 |
|---|
2/29/2020 | $17,478 | $13,869 | $14,611 |
|---|
3/31/2020 | $14,790 | $11,221 | $12,806 |
|---|
4/30/2020 | $17,248 | $12,892 | $14,448 |
|---|
5/31/2020 | $19,561 | $14,110 | $15,136 |
|---|
6/30/2020 | $20,807 | $14,652 | $15,437 |
|---|
7/31/2020 | $22,189 | $15,156 | $16,308 |
|---|
8/31/2020 | $23,478 | $16,045 | $17,480 |
|---|
9/30/2020 | $24,135 | $15,701 | $16,816 |
|---|
10/31/2020 | $24,715 | $15,820 | $16,369 |
|---|
11/30/2020 | $27,935 | $18,610 | $18,160 |
|---|
12/31/2020 | $30,764 | $20,350 | $18,859 |
|---|
1/31/2021 | $32,080 | $21,331 | $18,668 |
|---|
2/28/2021 | $33,293 | $22,035 | $19,183 |
|---|
3/31/2021 | $31,281 | $21,342 | $20,023 |
|---|
4/30/2021 | $32,691 | $21,807 | $21,092 |
|---|
5/31/2021 | $30,698 | $21,184 | $21,239 |
|---|
6/30/2021 | $32,193 | $22,178 | $21,735 |
|---|
7/31/2021 | $31,591 | $21,370 | $22,251 |
|---|
8/31/2021 | $32,428 | $21,758 | $22,928 |
|---|
9/30/2021 | $31,018 | $20,924 | $21,861 |
|---|
10/31/2021 | $32,766 | $21,904 | $23,393 |
|---|
11/30/2021 | $30,087 | $20,834 | $23,231 |
|---|
12/31/2021 | $29,982 | $20,926 | $24,272 |
|---|
1/31/2022 | $24,377 | $18,122 | $23,016 |
|---|
2/28/2022 | $24,387 | $18,201 | $22,327 |
|---|
3/31/2022 | $24,220 | $18,284 | $23,156 |
|---|
4/30/2022 | $20,978 | $16,041 | $21,137 |
|---|
5/31/2022 | $20,392 | $15,738 | $21,175 |
|---|
6/30/2022 | $19,106 | $14,763 | $19,427 |
|---|
7/31/2022 | $20,947 | $16,416 | $21,219 |
|---|
8/31/2022 | $20,894 | $16,262 | $20,353 |
|---|
9/30/2022 | $19,221 | $14,799 | $18,479 |
|---|
10/31/2022 | $20,413 | $16,204 | $19,975 |
|---|
11/30/2022 | $20,476 | $16,468 | $21,091 |
|---|
12/31/2022 | $19,200 | $15,411 | $19,876 |
|---|
1/31/2023 | $20,800 | $16,944 | $21,125 |
|---|
2/28/2023 | $20,612 | $16,760 | $20,610 |
|---|
3/31/2023 | $20,800 | $16,347 | $21,366 |
|---|
4/30/2023 | $20,288 | $16,157 | $21,700 |
|---|
5/31/2023 | $20,623 | $16,160 | $21,794 |
|---|
6/30/2023 | $21,480 | $17,499 | $23,234 |
|---|
7/31/2023 | $21,762 | $18,318 | $23,980 |
|---|
8/31/2023 | $20,277 | $17,364 | $23,599 |
|---|
9/30/2023 | $18,709 | $16,219 | $22,474 |
|---|
10/31/2023 | $17,109 | $14,968 | $22,001 |
|---|
11/30/2023 | $18,907 | $16,331 | $24,010 |
|---|
12/31/2023 | $20,853 | $18,286 | $25,101 |
|---|
1/31/2024 | $20,968 | $17,700 | $25,523 |
|---|
2/29/2024 | $22,923 | $19,137 | $26,886 |
|---|
3/31/2024 | $23,498 | $19,673 | $27,751 |
|---|
4/30/2024 | $22,076 | $18,158 | $26,617 |
|---|
5/31/2024 | $23,028 | $19,130 | $27,937 |
|---|
6/30/2024 | $23,728 | $19,098 | $28,939 |
|---|
7/31/2024 | $23,728 | $20,662 | $29,292 |
|---|
8/31/2024 | $24,638 | $20,433 | $30,002 |
|---|
9/30/2024 | $25,234 | $20,704 | $30,643 |
|---|
10/31/2024 | $24,994 | $20,430 | $30,365 |
|---|
11/30/2024 | $27,328 | $22,935 | $32,148 |
|---|
12/31/2024 | $25,465 | $21,057 | $31,381 |
|---|
1/31/2025 | $25,936 | $21,723 | $32,255 |
|---|
2/28/2025 | $23,224 | $20,252 | $31,834 |
|---|
3/31/2025 | $20,962 | $18,717 | $30,041 |
|---|
4/30/2025 | $21,779 | $18,597 | $29,837 |
|---|
5/31/2025 | $23,203 | $19,791 | $31,715 |
|---|
6/30/2025 | $25,213 | $20,956 | $33,328 |
|---|
7/31/2025 | $25,768 | $21,313 | $34,076 |
|---|
8/31/2025 | $27,339 | $22,574 | $34,766 |
|---|
9/30/2025 | $28,679 | $23,511 | $36,035 |
|---|
10/31/2025 | $30,009 | $24,272 | $36,879 |
|---|
11/30/2025 | $30,040 | $24,106 | $36,970 |
|---|
12/31/2025 | $29,161 | $23,797 | $36,992 |
|---|
1/31/2026 | $30,281 | $24,744 | $37,529 |
|---|
2/28/2026 | $30,302 | $24,684 | $37,243 |
|---|
3/31/2026 | $29,014 | $23,129 | $35,389 |
|---|
4/30/2026 | $34,134 | $26,527 | $39,102 |
|---|
5/31/2026 | $38,124 | $28,077 | $41,160 |
|---|
6/30/2026 | $40,343 | $29,075 | $40,768 |
|---|
7/31/2026 | $34,658 | $27,371 | $40,742 |
|---|
|
| Average Annual Return [Table Text Block] |
Table SummaryAATR | 1 Year | 5 Years | 10 Years |
|---|
Class F at NAV | 34.50% | 1.87% | 13.23% |
|---|
Russell 2000 Growth Index | 28.42% | 5.07% | 10.59% |
|---|
S&P 500 Index | 19.56% | 12.86% | 15.08% |
|---|
|
| No Deduction of Taxes [Text Block] |
The returns do not reflect the deduction of taxes that a shareholder would pay on Fund distributions or redemption of Fund shares.
|
| AssetsNet |
$ 2,220,280,642
|
| Holdings Count | Holding |
92
|
| Advisory Fees Paid, Amount |
$ 10,884,699
|
| InvestmentCompanyPortfolioTurnover |
110.00%
|
| Additional Fund Statistics [Text Block] |
Table SummaryTotal Net Assets | $2,220,280,642 |
|---|
# of Portfolio Holdings | 92 |
|---|
Portfolio Turnover Rate | 110% |
|---|
Total Advisory Fees Paid | $10,884,699 |
|---|
|
| Holdings [Text Block] |
Table SummaryPortfolio Holdings Presented by SectorFootnote Reference* | % Footnote Reference** |
|---|
Communication Services | 2.33% | Consumer Discretionary | 7.16% | Consumer Staples | 1.11% | Financials | 4.44% | Health Care | 28.41% | Industrials | 25.56% | Information Technology | 27.42% | Repurchase Agreements | 2.09% | Money Market FundsFootnote Reference† | 1.33% | Time DepositsFootnote Reference† | 0.15% | Total | 100.00% | | Footnote | Description | Footnote* | A sector may comprise several industries. | Footnote** | Represents percent of total investments, which excludes derivatives. | Footnote† | Securities were purchased with the cash collateral from loaned securities. |
|
| Material Fund Change [Text Block] |
There were no material changes to the Fund during the reporting period. |
| Summary of Change Legend [Text Block] |
There were no material changes to the Fund during the reporting period.
|
| C000188220 |
|
| Shareholder Report [Line Items] |
|
| Fund Name |
Lord Abbett Developing Growth Fund
|
| Class Name |
Class F3
|
| Trading Symbol |
LOGWX
|
| Annual or Semi-Annual Statement [Text Block] |
This annual shareholder report contains important information about the Lord Abbett Developing Growth Fund for the period of August 1, 2025 to July 31, 2026 (the "reporting period").
|
| Additional Information [Text Block] |
You can find additional information about the Fund at lordabbett.com/FundDocuments. You can also request this information by contacting us at 888-522-2388.
|
| Additional Information Phone Number |
888-522-2388
|
| Additional Information Website |
<span style="box-sizing: border-box; color: rgb(0, 0, 0); display: inline; flex-wrap: nowrap; font-size: 13.3333px; font-weight: 400; grid-area: auto; line-height: 20px; margin: 0px; overflow: visible; text-align: left; text-align-last: auto; white-space-collapse: preserve-breaks;">lordabbett.com/FundDocuments</span>
|
| Expenses [Text Block] |
What were the Fund costs for the reporting period?(based on a hypothetical $10,000 investment) Table SummaryClass Name | Costs of a $10,000 investment | Costs paid as a percentage of a $10,000 investment |
|---|
Class F3 | $69 | 0.59% |
|---|
|
| Expenses Paid, Amount |
$ 69
|
| Expense Ratio, Percent |
0.59%
|
| Factors Affecting Performance [Text Block] |
How did the Fund perform last year and what affected its performance?For the fiscal year ended July 31, 2026, the Fund returned 34.67%, reflecting performance at the net asset value (NAV) of Class F3 shares, with all distributions reinvested, compared to the 28.42% return of a securities market index with investment characteristics similar to those of the Fund, the Russell 2000 Growth Index. The Fund's broad-based securities market index, the S&P 500 Index, returned 19.56% over the same period. Markets navigated a resilient economic backdrop amid geopolitical and inflation uncertainty. Healthy consumer spending, labor markets, and corporate earnings supported the outlook, while artificial intelligence ("AI") disruption concerns and U.S.-Iran tensions drove volatility and higher energy prices. A June ceasefire stabilized oil markets, though geopolitical tensions continued to influence Treasury yields. Meanwhile, Kevin Warsh became Fed Chair, and the Fed held rates unchanged in July amid resilient economic data. Top contributors to performance: Security selection within the Industrials sector contributed to relative performance over the period, driven by an allocation to Comfort Systems USA, a provider of commercial heating, cooling, and electrical services. Security selection within the Information Technology sector also contributed to relative performance, driven by an allocation to Astera Labs, a semiconductor technology company. Top detractors from performance: Security selection within the Consumer Discretionary sector detracted from relative performance over the period, driven by an allocation to Planet Fitness, a fitness center operator and franchisor. Security selection within the Consumer Staples sector also detracted from relative performance, driven by an allocation to Celsius Holdings, an energy drink company. |
| Performance Past Does Not Indicate Future [Text] |
The Fund's past performance is no guarantee of future results.
|
| Line Graph [Table Text Block] |
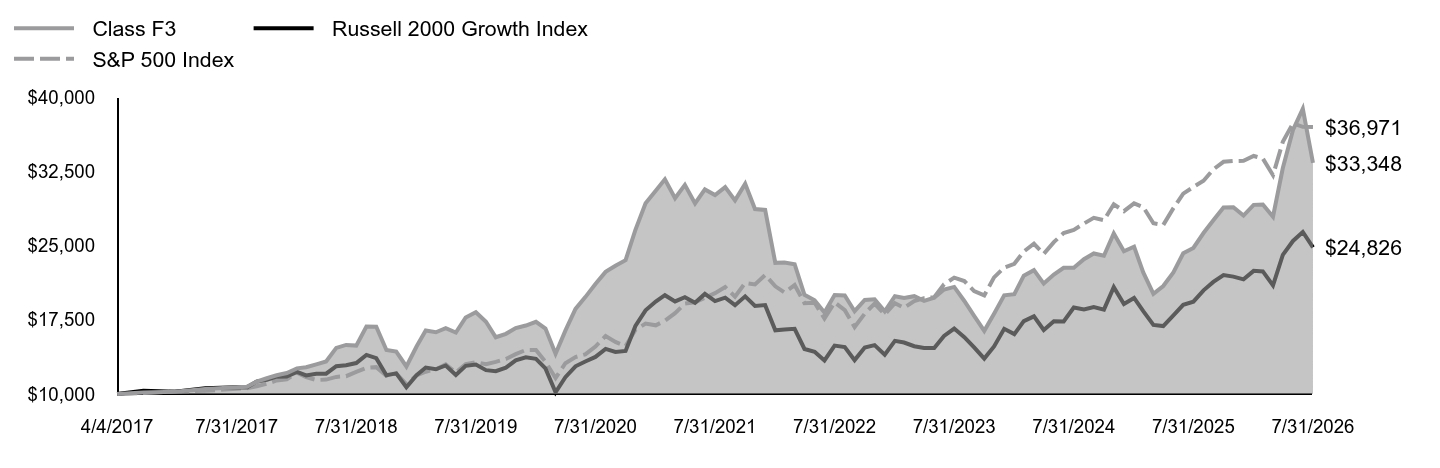 Table Summary | Class F3 | Russell 2000 Growth Index | S&P 500 Index |
|---|
4/4/2017 | $10,000 | $10,000 | $10,000 |
|---|
4/30/2017 | $10,158 | $10,333 | $10,112 |
|---|
5/31/2017 | $10,217 | $10,239 | $10,254 |
|---|
6/30/2017 | $10,498 | $10,591 | $10,318 |
|---|
7/31/2017 | $10,693 | $10,681 | $10,530 |
|---|
8/31/2017 | $10,733 | $10,669 | $10,562 |
|---|
9/30/2017 | $11,249 | $11,250 | $10,780 |
|---|
10/31/2017 | $11,593 | $11,424 | $11,032 |
|---|
11/30/2017 | $11,892 | $11,752 | $11,370 |
|---|
12/31/2017 | $12,119 | $11,765 | $11,496 |
|---|
1/31/2018 | $12,589 | $12,224 | $12,155 |
|---|
2/28/2018 | $12,712 | $11,876 | $11,707 |
|---|
3/31/2018 | $12,997 | $12,036 | $11,409 |
|---|
4/30/2018 | $13,287 | $12,048 | $11,453 |
|---|
5/31/2018 | $14,658 | $12,806 | $11,729 |
|---|
6/30/2018 | $14,957 | $12,906 | $11,801 |
|---|
7/31/2018 | $14,889 | $13,128 | $12,240 |
|---|
8/31/2018 | $16,827 | $13,946 | $12,639 |
|---|
9/30/2018 | $16,790 | $13,619 | $12,711 |
|---|
10/31/2018 | $14,441 | $11,896 | $11,842 |
|---|
11/30/2018 | $14,286 | $12,082 | $12,083 |
|---|
12/31/2018 | $12,781 | $10,670 | $10,992 |
|---|
1/31/2019 | $14,799 | $11,902 | $11,873 |
|---|
2/28/2019 | $16,414 | $12,671 | $12,254 |
|---|
3/31/2019 | $16,241 | $12,500 | $12,493 |
|---|
4/30/2019 | $16,645 | $12,880 | $12,998 |
|---|
5/31/2019 | $16,207 | $11,925 | $12,172 |
|---|
6/30/2019 | $17,735 | $12,843 | $13,030 |
|---|
7/31/2019 | $18,260 | $12,969 | $13,218 |
|---|
8/31/2019 | $17,302 | $12,409 | $13,008 |
|---|
9/30/2019 | $15,734 | $12,307 | $13,252 |
|---|
10/31/2019 | $16,080 | $12,657 | $13,539 |
|---|
11/30/2019 | $16,667 | $13,402 | $14,030 |
|---|
12/31/2019 | $16,921 | $13,709 | $14,453 |
|---|
1/31/2020 | $17,292 | $13,559 | $14,448 |
|---|
2/29/2020 | $16,619 | $12,580 | $13,258 |
|---|
3/31/2020 | $14,064 | $10,177 | $11,621 |
|---|
4/30/2020 | $16,399 | $11,693 | $13,111 |
|---|
5/31/2020 | $18,603 | $12,798 | $13,735 |
|---|
6/30/2020 | $19,791 | $13,290 | $14,008 |
|---|
7/31/2020 | $21,110 | $13,747 | $14,798 |
|---|
8/31/2020 | $22,339 | $14,553 | $15,862 |
|---|
9/30/2020 | $22,964 | $14,241 | $15,259 |
|---|
10/31/2020 | $23,520 | $14,349 | $14,853 |
|---|
11/30/2020 | $26,592 | $16,880 | $16,479 |
|---|
12/31/2020 | $29,280 | $18,457 | $17,113 |
|---|
1/31/2021 | $30,538 | $19,347 | $16,940 |
|---|
2/28/2021 | $31,693 | $19,986 | $17,407 |
|---|
3/31/2021 | $29,786 | $19,357 | $18,169 |
|---|
4/30/2021 | $31,134 | $19,779 | $19,139 |
|---|
5/31/2021 | $29,250 | $19,214 | $19,273 |
|---|
6/30/2021 | $30,672 | $20,116 | $19,723 |
|---|
7/31/2021 | $30,106 | $19,383 | $20,191 |
|---|
8/31/2021 | $30,911 | $19,735 | $20,805 |
|---|
9/30/2021 | $29,570 | $18,978 | $19,838 |
|---|
10/31/2021 | $31,238 | $19,867 | $21,227 |
|---|
11/30/2021 | $28,691 | $18,897 | $21,080 |
|---|
12/31/2021 | $28,602 | $18,981 | $22,025 |
|---|
1/31/2022 | $23,252 | $16,437 | $20,885 |
|---|
2/28/2022 | $23,277 | $16,508 | $20,260 |
|---|
3/31/2022 | $23,114 | $16,584 | $21,012 |
|---|
4/30/2022 | $20,025 | $14,549 | $19,180 |
|---|
5/31/2022 | $19,464 | $14,274 | $19,215 |
|---|
6/30/2022 | $18,244 | $13,391 | $17,629 |
|---|
7/31/2022 | $20,000 | $14,890 | $19,254 |
|---|
8/31/2022 | $19,951 | $14,750 | $18,469 |
|---|
9/30/2022 | $18,366 | $13,423 | $16,768 |
|---|
10/31/2022 | $19,504 | $14,697 | $18,126 |
|---|
11/30/2022 | $19,569 | $14,937 | $19,139 |
|---|
12/31/2022 | $18,350 | $13,978 | $18,036 |
|---|
1/31/2023 | $19,886 | $15,368 | $19,169 |
|---|
2/28/2023 | $19,708 | $15,202 | $18,702 |
|---|
3/31/2023 | $19,886 | $14,827 | $19,388 |
|---|
4/30/2023 | $19,407 | $14,654 | $19,691 |
|---|
5/31/2023 | $19,732 | $14,657 | $19,777 |
|---|
6/30/2023 | $20,553 | $15,872 | $21,083 |
|---|
7/31/2023 | $20,821 | $16,614 | $21,761 |
|---|
8/31/2023 | $19,399 | $15,749 | $21,414 |
|---|
9/30/2023 | $17,903 | $14,711 | $20,393 |
|---|
10/31/2023 | $16,382 | $13,576 | $19,964 |
|---|
11/30/2023 | $18,106 | $14,812 | $21,788 |
|---|
12/31/2023 | $19,968 | $16,586 | $22,777 |
|---|
1/31/2024 | $20,082 | $16,054 | $23,160 |
|---|
2/29/2024 | $21,960 | $17,358 | $24,397 |
|---|
3/31/2024 | $22,512 | $17,843 | $25,182 |
|---|
4/30/2024 | $21,155 | $16,469 | $24,153 |
|---|
5/31/2024 | $22,065 | $17,351 | $25,351 |
|---|
6/30/2024 | $22,748 | $17,322 | $26,260 |
|---|
7/31/2024 | $22,756 | $18,741 | $26,580 |
|---|
8/31/2024 | $23,626 | $18,533 | $27,225 |
|---|
9/30/2024 | $24,204 | $18,779 | $27,806 |
|---|
10/31/2024 | $23,976 | $18,530 | $27,554 |
|---|
11/30/2024 | $26,220 | $20,802 | $29,172 |
|---|
12/31/2024 | $24,428 | $19,099 | $28,476 |
|---|
1/31/2025 | $24,892 | $19,703 | $29,269 |
|---|
2/28/2025 | $22,286 | $18,369 | $28,887 |
|---|
3/31/2025 | $20,127 | $16,976 | $27,260 |
|---|
4/30/2025 | $20,909 | $16,868 | $27,075 |
|---|
5/31/2025 | $22,278 | $17,950 | $28,779 |
|---|
6/30/2025 | $24,216 | $19,008 | $30,243 |
|---|
7/31/2025 | $24,762 | $19,331 | $30,921 |
|---|
8/31/2025 | $26,269 | $20,475 | $31,548 |
|---|
9/30/2025 | $27,556 | $21,325 | $32,700 |
|---|
10/31/2025 | $28,843 | $22,015 | $33,465 |
|---|
11/30/2025 | $28,875 | $21,865 | $33,547 |
|---|
12/31/2025 | $28,037 | $21,585 | $33,568 |
|---|
1/31/2026 | $29,112 | $22,443 | $34,054 |
|---|
2/28/2026 | $29,145 | $22,389 | $33,796 |
|---|
3/31/2026 | $27,915 | $20,979 | $32,113 |
|---|
4/30/2026 | $32,835 | $24,060 | $35,482 |
|---|
5/31/2026 | $36,680 | $25,466 | $37,350 |
|---|
6/30/2026 | $38,822 | $26,371 | $36,994 |
|---|
7/31/2026 | $33,348 | $24,826 | $36,971 |
|---|
|
| Average Annual Return [Table Text Block] |
Table SummaryAATR | 1 Year | 5 Years | Since Inception
4/4/17 |
|---|
Class F3 at NAV | 34.67% | 2.07% | 13.79% |
|---|
Russell 2000 Growth Index | 28.42% | 5.07% | 10.24% |
|---|
S&P 500 Index | 19.56% | 12.86% | 15.06% |
|---|
|
| Performance Inception Date |
Apr. 04, 2017
|
| No Deduction of Taxes [Text Block] |
The returns do not reflect the deduction of taxes that a shareholder would pay on Fund distributions or redemption of Fund shares.
|
| AssetsNet |
$ 2,220,280,642
|
| Holdings Count | Holding |
92
|
| Advisory Fees Paid, Amount |
$ 10,884,699
|
| InvestmentCompanyPortfolioTurnover |
110.00%
|
| Additional Fund Statistics [Text Block] |
Table SummaryTotal Net Assets | $2,220,280,642 |
|---|
# of Portfolio Holdings | 92 |
|---|
Portfolio Turnover Rate | 110% |
|---|
Total Advisory Fees Paid | $10,884,699 |
|---|
|
| Holdings [Text Block] |
Table SummaryPortfolio Holdings Presented by SectorFootnote Reference* | % Footnote Reference** |
|---|
Communication Services | 2.33% | Consumer Discretionary | 7.16% | Consumer Staples | 1.11% | Financials | 4.44% | Health Care | 28.41% | Industrials | 25.56% | Information Technology | 27.42% | Repurchase Agreements | 2.09% | Money Market FundsFootnote Reference† | 1.33% | Time DepositsFootnote Reference† | 0.15% | Total | 100.00% | | Footnote | Description | Footnote* | A sector may comprise several industries. | Footnote** | Represents percent of total investments, which excludes derivatives. | Footnote† | Securities were purchased with the cash collateral from loaned securities. |
|
| Material Fund Change [Text Block] |
There were no material changes to the Fund during the reporting period. |
| Summary of Change Legend [Text Block] |
There were no material changes to the Fund during the reporting period.
|
| C000018477 |
|
| Shareholder Report [Line Items] |
|
| Fund Name |
Lord Abbett Developing Growth Fund
|
| Class Name |
Class I
|
| Trading Symbol |
LADYX
|
| Annual or Semi-Annual Statement [Text Block] |
This annual shareholder report contains important information about the Lord Abbett Developing Growth Fund for the period of August 1, 2025 to July 31, 2026 (the "reporting period").
|
| Additional Information [Text Block] |
You can find additional information about the Fund at lordabbett.com/FundDocuments. You can also request this information by contacting us at 888-522-2388.
|
| Additional Information Phone Number |
888-522-2388
|
| Additional Information Website |
<span style="box-sizing: border-box; color: rgb(0, 0, 0); display: inline; flex-wrap: nowrap; font-size: 13.3333px; font-weight: 400; grid-area: auto; line-height: 20px; margin: 0px; overflow: visible; text-align: left; text-align-last: auto; white-space-collapse: preserve-breaks;">lordabbett.com/FundDocuments</span>
|
| Expenses [Text Block] |
What were the Fund costs for the reporting period?(based on a hypothetical $10,000 investment) Table SummaryClass Name | Costs of a $10,000 investment | Costs paid as a percentage of a $10,000 investment |
|---|
Class I | $77 | 0.66% |
|---|
|
| Expenses Paid, Amount |
$ 77
|
| Expense Ratio, Percent |
0.66%
|
| Factors Affecting Performance [Text Block] |
How did the Fund perform last year and what affected its performance?For the fiscal year ended July 31, 2026, the Fund returned 34.58%, reflecting performance at the net asset value (NAV) of Class I shares, with all distributions reinvested, compared to the 28.42% return of a securities market index with investment characteristics similar to those of the Fund, the Russell 2000 Growth Index. The Fund's broad-based securities market index, the S&P 500 Index, returned 19.56% over the same period. Markets navigated a resilient economic backdrop amid geopolitical and inflation uncertainty. Healthy consumer spending, labor markets, and corporate earnings supported the outlook, while artificial intelligence ("AI") disruption concerns and U.S.-Iran tensions drove volatility and higher energy prices. A June ceasefire stabilized oil markets, though geopolitical tensions continued to influence Treasury yields. Meanwhile, Kevin Warsh became Fed Chair, and the Fed held rates unchanged in July amid resilient economic data. Top contributors to performance: Security selection within the Industrials sector contributed to relative performance over the period, driven by an allocation to Comfort Systems USA, a provider of commercial heating, cooling, and electrical services. Security selection within the Information Technology sector also contributed to relative performance, driven by an allocation to Astera Labs, a semiconductor technology company. Top detractors from performance: Security selection within the Consumer Discretionary sector detracted from relative performance over the period, driven by an allocation to Planet Fitness, a fitness center operator and franchisor. Security selection within the Consumer Staples sector also detracted from relative performance, driven by an allocation to Celsius Holdings, an energy drink company. |
| Performance Past Does Not Indicate Future [Text] |
The Fund's past performance is no guarantee of future results.
|
| Line Graph [Table Text Block] |
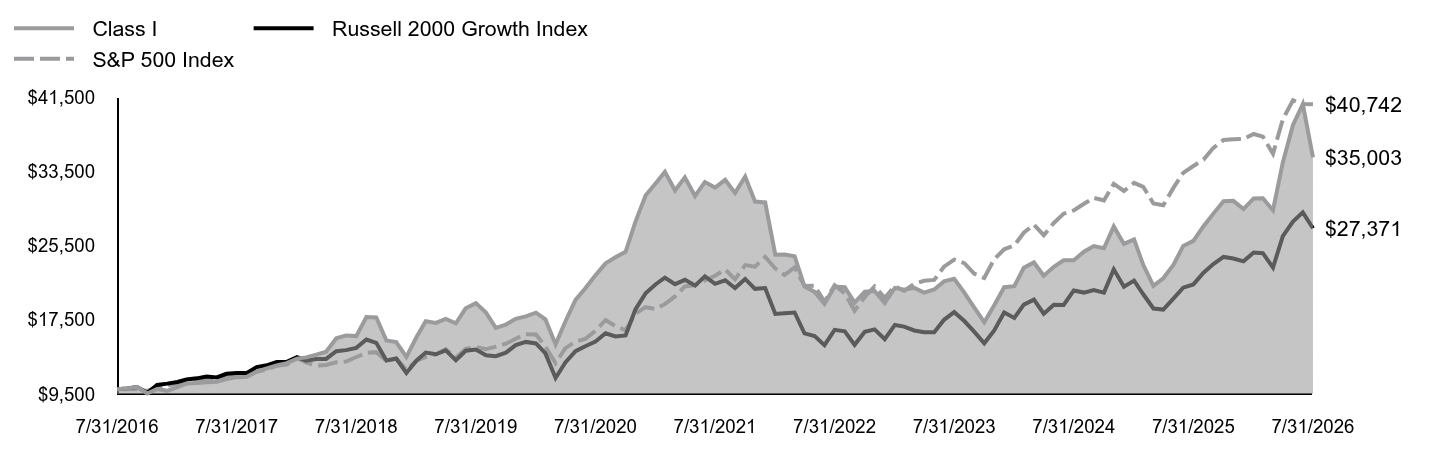 Table Summary | Class I | Russell 2000 Growth Index | S&P 500 Index |
|---|
7/31/2016 | $10,000 | $10,000 | $10,000 |
|---|
8/31/2016 | $10,106 | $10,106 | $10,014 |
|---|
9/30/2016 | $10,279 | $10,252 | $10,016 |
|---|
10/31/2016 | $9,553 | $9,615 | $9,833 |
|---|
11/30/2016 | $10,038 | $10,475 | $10,197 |
|---|
12/31/2016 | $9,841 | $10,618 | $10,399 |
|---|
1/31/2017 | $10,245 | $10,790 | $10,596 |
|---|
2/28/2017 | $10,625 | $11,055 | $11,017 |
|---|
3/31/2017 | $10,673 | $11,186 | $11,030 |
|---|
4/30/2017 | $10,754 | $11,392 | $11,143 |
|---|
5/31/2017 | $10,817 | $11,288 | $11,300 |
|---|
6/30/2017 | $11,110 | $11,677 | $11,370 |
|---|
7/31/2017 | $11,317 | $11,776 | $11,604 |
|---|
8/31/2017 | $11,355 | $11,762 | $11,640 |
|---|
9/30/2017 | $11,908 | $12,403 | $11,880 |
|---|
10/31/2017 | $12,268 | $12,595 | $12,157 |
|---|
11/30/2017 | $12,580 | $12,957 | $12,530 |
|---|
12/31/2017 | $12,821 | $12,971 | $12,669 |
|---|
1/31/2018 | $13,316 | $13,477 | $13,395 |
|---|
2/28/2018 | $13,445 | $13,093 | $12,901 |
|---|
3/31/2018 | $13,743 | $13,270 | $12,573 |
|---|
4/30/2018 | $14,051 | $13,283 | $12,621 |
|---|
5/31/2018 | $15,502 | $14,119 | $12,925 |
|---|
6/30/2018 | $15,815 | $14,229 | $13,005 |
|---|
7/31/2018 | $15,742 | $14,474 | $13,489 |
|---|
8/31/2018 | $17,790 | $15,375 | $13,928 |
|---|
9/30/2018 | $17,751 | $15,015 | $14,008 |
|---|
10/31/2018 | $15,267 | $13,115 | $13,050 |
|---|
11/30/2018 | $15,102 | $13,321 | $13,316 |
|---|
12/31/2018 | $13,509 | $11,764 | $12,114 |
|---|
1/31/2019 | $15,642 | $13,123 | $13,085 |
|---|
2/28/2019 | $17,346 | $13,970 | $13,505 |
|---|
3/31/2019 | $17,162 | $13,781 | $13,767 |
|---|
4/30/2019 | $17,585 | $14,201 | $14,324 |
|---|
5/31/2019 | $17,125 | $13,147 | $13,414 |
|---|
6/30/2019 | $18,737 | $14,160 | $14,360 |
|---|
7/31/2019 | $19,295 | $14,298 | $14,566 |
|---|
8/31/2019 | $18,277 | $13,681 | $14,335 |
|---|
9/30/2019 | $16,622 | $13,569 | $14,603 |
|---|
10/31/2019 | $16,984 | $13,955 | $14,920 |
|---|
11/30/2019 | $17,602 | $14,776 | $15,461 |
|---|
12/31/2019 | $17,865 | $15,115 | $15,928 |
|---|
1/31/2020 | $18,260 | $14,948 | $15,922 |
|---|
2/29/2020 | $17,544 | $13,869 | $14,611 |
|---|
3/31/2020 | $14,848 | $11,221 | $12,806 |
|---|
4/30/2020 | $17,317 | $12,892 | $14,448 |
|---|
5/31/2020 | $19,641 | $14,110 | $15,136 |
|---|
6/30/2020 | $20,890 | $14,652 | $15,437 |
|---|
7/31/2020 | $22,286 | $15,156 | $16,308 |
|---|
8/31/2020 | $23,579 | $16,045 | $17,480 |
|---|
9/30/2020 | $24,230 | $15,701 | $16,816 |
|---|
10/31/2020 | $24,821 | $15,820 | $16,369 |
|---|
11/30/2020 | $28,060 | $18,610 | $18,160 |
|---|
12/31/2020 | $30,899 | $20,350 | $18,859 |
|---|
1/31/2021 | $32,223 | $21,331 | $18,668 |
|---|
2/28/2021 | $33,444 | $22,035 | $19,183 |
|---|
3/31/2021 | $31,430 | $21,342 | $20,023 |
|---|
4/30/2021 | $32,849 | $21,807 | $21,092 |
|---|
5/31/2021 | $30,851 | $21,184 | $21,239 |
|---|
6/30/2021 | $32,350 | $22,178 | $21,735 |
|---|
7/31/2021 | $31,747 | $21,370 | $22,251 |
|---|
8/31/2021 | $32,588 | $21,758 | $22,928 |
|---|
9/30/2021 | $31,176 | $20,924 | $21,861 |
|---|
10/31/2021 | $32,937 | $21,904 | $23,393 |
|---|
11/30/2021 | $30,248 | $20,834 | $23,231 |
|---|
12/31/2021 | $30,153 | $20,926 | $24,272 |
|---|
1/31/2022 | $24,512 | $18,122 | $23,016 |
|---|
2/28/2022 | $24,530 | $18,201 | $22,327 |
|---|
3/31/2022 | $24,356 | $18,284 | $23,156 |
|---|
4/30/2022 | $21,098 | $16,041 | $21,137 |
|---|
5/31/2022 | $20,509 | $15,738 | $21,175 |
|---|
6/30/2022 | $19,218 | $14,763 | $19,427 |
|---|
7/31/2022 | $21,072 | $16,416 | $21,219 |
|---|
8/31/2022 | $21,020 | $16,262 | $20,353 |
|---|
9/30/2022 | $19,348 | $14,799 | $18,479 |
|---|
10/31/2022 | $20,535 | $16,204 | $19,975 |
|---|
11/30/2022 | $20,604 | $16,468 | $21,091 |
|---|
12/31/2022 | $19,322 | $15,411 | $19,876 |
|---|
1/31/2023 | $20,942 | $16,944 | $21,125 |
|---|
2/28/2023 | $20,752 | $16,760 | $20,610 |
|---|
3/31/2023 | $20,942 | $16,347 | $21,366 |
|---|
4/30/2023 | $20,431 | $16,157 | $21,700 |
|---|
5/31/2023 | $20,769 | $16,160 | $21,794 |
|---|
6/30/2023 | $21,636 | $17,499 | $23,234 |
|---|
7/31/2023 | $21,913 | $18,318 | $23,980 |
|---|
8/31/2023 | $20,423 | $17,364 | $23,599 |
|---|
9/30/2023 | $18,837 | $16,219 | $22,474 |
|---|
10/31/2023 | $17,234 | $14,968 | $22,001 |
|---|
11/30/2023 | $19,045 | $16,331 | $24,010 |
|---|
12/31/2023 | $21,012 | $18,286 | $25,101 |
|---|
1/31/2024 | $21,124 | $17,700 | $25,523 |
|---|
2/29/2024 | $23,100 | $19,137 | $26,886 |
|---|
3/31/2024 | $23,680 | $19,673 | $27,751 |
|---|
4/30/2024 | $22,251 | $18,158 | $26,617 |
|---|
5/31/2024 | $23,204 | $19,130 | $27,937 |
|---|
6/30/2024 | $23,914 | $19,098 | $28,939 |
|---|
7/31/2024 | $23,923 | $20,662 | $29,292 |
|---|
8/31/2024 | $24,841 | $20,433 | $30,002 |
|---|
9/30/2024 | $25,448 | $20,704 | $30,643 |
|---|
10/31/2024 | $25,205 | $20,430 | $30,365 |
|---|
11/30/2024 | $27,562 | $22,935 | $32,148 |
|---|
12/31/2024 | $25,679 | $21,057 | $31,381 |
|---|
1/31/2025 | $26,165 | $21,723 | $32,255 |
|---|
2/28/2025 | $23,422 | $20,252 | $31,834 |
|---|
3/31/2025 | $21,147 | $18,717 | $30,041 |
|---|
4/30/2025 | $21,972 | $18,597 | $29,837 |
|---|
5/31/2025 | $23,404 | $19,791 | $31,715 |
|---|
6/30/2025 | $25,444 | $20,956 | $33,328 |
|---|
7/31/2025 | $26,009 | $21,313 | $34,076 |
|---|
8/31/2025 | $27,588 | $22,574 | $34,766 |
|---|
9/30/2025 | $28,943 | $23,511 | $36,035 |
|---|
10/31/2025 | $30,288 | $24,272 | $36,879 |
|---|
11/30/2025 | $30,323 | $24,106 | $36,970 |
|---|
12/31/2025 | $29,438 | $23,797 | $36,992 |
|---|
1/31/2026 | $30,576 | $24,744 | $37,529 |
|---|
2/28/2026 | $30,602 | $24,684 | $37,243 |
|---|
3/31/2026 | $29,308 | $23,129 | $35,389 |
|---|
4/30/2026 | $34,465 | $26,527 | $39,102 |
|---|
5/31/2026 | $38,510 | $28,077 | $41,160 |
|---|
6/30/2026 | $40,750 | $29,075 | $40,768 |
|---|
7/31/2026 | $35,003 | $27,371 | $40,742 |
|---|
|
| Average Annual Return [Table Text Block] |
Table SummaryAATR | 1 Year | 5 Years | 10 Years |
|---|
Class I at NAV | 34.58% | 1.97% | 13.35% |
|---|
Russell 2000 Growth Index | 28.42% | 5.07% | 10.59% |
|---|
S&P 500 Index | 19.56% | 12.86% | 15.08% |
|---|
|
| No Deduction of Taxes [Text Block] |
The returns do not reflect the deduction of taxes that a shareholder would pay on Fund distributions or redemption of Fund shares.
|
| AssetsNet |
$ 2,220,280,642
|
| Holdings Count | Holding |
92
|
| Advisory Fees Paid, Amount |
$ 10,884,699
|
| InvestmentCompanyPortfolioTurnover |
110.00%
|
| Additional Fund Statistics [Text Block] |
Table SummaryTotal Net Assets | $2,220,280,642 |
|---|
# of Portfolio Holdings | 92 |
|---|
Portfolio Turnover Rate | 110% |
|---|
Total Advisory Fees Paid | $10,884,699 |
|---|
|
| Holdings [Text Block] |
Table SummaryPortfolio Holdings Presented by SectorFootnote Reference* | % Footnote Reference** |
|---|
Communication Services | 2.33% | Consumer Discretionary | 7.16% | Consumer Staples | 1.11% | Financials | 4.44% | Health Care | 28.41% | Industrials | 25.56% | Information Technology | 27.42% | Repurchase Agreements | 2.09% | Money Market FundsFootnote Reference† | 1.33% | Time DepositsFootnote Reference† | 0.15% | Total | 100.00% | | Footnote | Description | Footnote* | A sector may comprise several industries. | Footnote** | Represents percent of total investments, which excludes derivatives. | Footnote† | Securities were purchased with the cash collateral from loaned securities. |
|
| Material Fund Change [Text Block] |
There were no material changes to the Fund during the reporting period. |
| Summary of Change Legend [Text Block] |
There were no material changes to the Fund during the reporting period.
|
| C000018476 |
|
| Shareholder Report [Line Items] |
|
| Fund Name |
Lord Abbett Developing Growth Fund
|
| Class Name |
Class P
|
| Trading Symbol |
LADPX
|
| Annual or Semi-Annual Statement [Text Block] |
This annual shareholder report contains important information about the Lord Abbett Developing Growth Fund for the period of August 1, 2025 to July 31, 2026 (the "reporting period").
|
| Additional Information [Text Block] |
You can find additional information about the Fund at lordabbett.com/FundDocuments. You can also request this information by contacting us at 888-522-2388.
|
| Additional Information Phone Number |
888-522-2388
|
| Additional Information Website |
<span style="box-sizing: border-box; color: rgb(0, 0, 0); display: inline; flex-wrap: nowrap; font-size: 13.3333px; font-weight: 400; grid-area: auto; line-height: 20px; margin: 0px; overflow: visible; text-align: left; text-align-last: auto; white-space-collapse: preserve-breaks;">lordabbett.com/FundDocuments</span>
|
| Expenses [Text Block] |
What were the Fund costs for the reporting period?(based on a hypothetical $10,000 investment) Table SummaryClass Name | Costs of a $10,000 investment | Costs paid as a percentage of a $10,000 investment |
|---|
Class P | $130 | 1.11% |
|---|
|
| Expenses Paid, Amount |
$ 130
|
| Expense Ratio, Percent |
1.11%
|
| Factors Affecting Performance [Text Block] |
How did the Fund perform last year and what affected its performance?For the fiscal year ended July 31, 2026, the Fund returned 33.97%, reflecting performance at the net asset value (NAV) of Class P shares, with all distributions reinvested, compared to the 28.42% return of a securities market index with investment characteristics similar to those of the Fund, the Russell 2000 Growth Index. The Fund's broad-based securities market index, the S&P 500 Index, returned 19.56% over the same period. Markets navigated a resilient economic backdrop amid geopolitical and inflation uncertainty. Healthy consumer spending, labor markets, and corporate earnings supported the outlook, while artificial intelligence ("AI") disruption concerns and U.S.-Iran tensions drove volatility and higher energy prices. A June ceasefire stabilized oil markets, though geopolitical tensions continued to influence Treasury yields. Meanwhile, Kevin Warsh became Fed Chair, and the Fed held rates unchanged in July amid resilient economic data. Top contributors to performance: Security selection within the Industrials sector contributed to relative performance over the period, driven by an allocation to Comfort Systems USA, a provider of commercial heating, cooling, and electrical services. Security selection within the Information Technology sector also contributed to relative performance, driven by an allocation to Astera Labs, a semiconductor technology company. Top detractors from performance: Security selection within the Consumer Discretionary sector detracted from relative performance over the period, driven by an allocation to Planet Fitness, a fitness center operator and franchisor. Security selection within the Consumer Staples sector also detracted from relative performance, driven by an allocation to Celsius Holdings, an energy drink company. |
| Performance Past Does Not Indicate Future [Text] |
The Fund's past performance is no guarantee of future results.
|
| Line Graph [Table Text Block] |
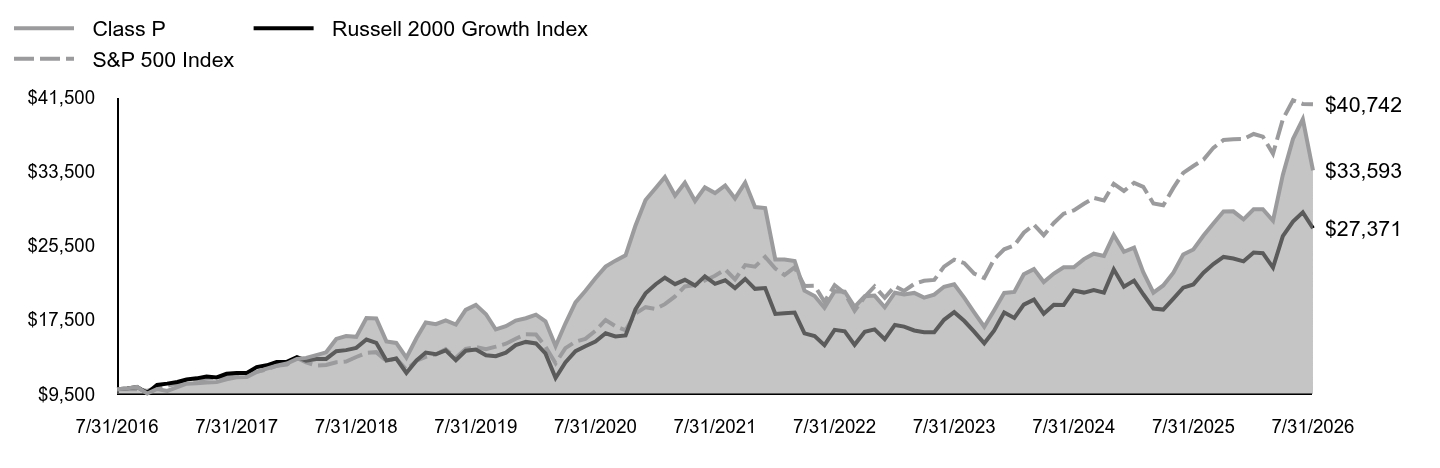 Table Summary | Class P | Russell 2000 Growth Index | S&P 500 Index |
|---|
7/31/2016 | $10,000 | $10,000 | $10,000 |
|---|
8/31/2016 | $10,107 | $10,106 | $10,014 |
|---|
9/30/2016 | $10,277 | $10,252 | $10,016 |
|---|
10/31/2016 | $9,548 | $9,615 | $9,833 |
|---|
11/30/2016 | $10,034 | $10,475 | $10,197 |
|---|
12/31/2016 | $9,836 | $10,618 | $10,399 |
|---|
1/31/2017 | $10,237 | $10,790 | $10,596 |
|---|
2/28/2017 | $10,610 | $11,055 | $11,017 |
|---|
3/31/2017 | $10,655 | $11,186 | $11,030 |
|---|
4/30/2017 | $10,740 | $11,392 | $11,143 |
|---|
5/31/2017 | $10,797 | $11,288 | $11,300 |
|---|
6/30/2017 | $11,090 | $11,677 | $11,370 |
|---|
7/31/2017 | $11,294 | $11,776 | $11,604 |
|---|
8/31/2017 | $11,328 | $11,762 | $11,640 |
|---|
9/30/2017 | $11,876 | $12,403 | $11,880 |
|---|
10/31/2017 | $12,232 | $12,595 | $12,157 |
|---|
11/30/2017 | $12,542 | $12,957 | $12,530 |
|---|
12/31/2017 | $12,780 | $12,971 | $12,669 |
|---|
1/31/2018 | $13,271 | $13,477 | $13,395 |
|---|
2/28/2018 | $13,395 | $13,093 | $12,901 |
|---|
3/31/2018 | $13,689 | $13,270 | $12,573 |
|---|
4/30/2018 | $13,994 | $13,283 | $12,621 |
|---|
5/31/2018 | $15,435 | $14,119 | $12,925 |
|---|
6/30/2018 | $15,740 | $14,229 | $13,005 |
|---|
7/31/2018 | $15,661 | $14,474 | $13,489 |
|---|
8/31/2018 | $17,695 | $15,375 | $13,928 |
|---|
9/30/2018 | $17,644 | $15,015 | $14,008 |
|---|
10/31/2018 | $15,169 | $13,115 | $13,050 |
|---|
11/30/2018 | $15,004 | $13,321 | $13,316 |
|---|
12/31/2018 | $13,411 | $11,764 | $12,114 |
|---|
1/31/2019 | $15,528 | $13,123 | $13,085 |
|---|
2/28/2019 | $17,213 | $13,970 | $13,505 |
|---|
3/31/2019 | $17,023 | $13,781 | $13,767 |
|---|
4/30/2019 | $17,441 | $14,201 | $14,324 |
|---|
5/31/2019 | $16,978 | $13,147 | $13,414 |
|---|
6/30/2019 | $18,564 | $14,160 | $14,360 |
|---|
7/31/2019 | $19,110 | $14,298 | $14,566 |
|---|
8/31/2019 | $18,093 | $13,681 | $14,335 |
|---|
9/30/2019 | $16,454 | $13,569 | $14,603 |
|---|
10/31/2019 | $16,803 | $13,955 | $14,920 |
|---|
11/30/2019 | $17,408 | $14,776 | $15,461 |
|---|
12/31/2019 | $17,665 | $15,115 | $15,928 |
|---|
1/31/2020 | $18,045 | $14,948 | $15,922 |
|---|
2/29/2020 | $17,332 | $13,869 | $14,611 |
|---|
3/31/2020 | $14,661 | $11,221 | $12,806 |
|---|
4/30/2020 | $17,095 | $12,892 | $14,448 |
|---|
5/31/2020 | $19,376 | $14,110 | $15,136 |
|---|
6/30/2020 | $20,603 | $14,652 | $15,437 |
|---|
7/31/2020 | $21,972 | $15,156 | $16,308 |
|---|
8/31/2020 | $23,236 | $16,045 | $17,480 |
|---|
9/30/2020 | $23,873 | $15,701 | $16,816 |
|---|
10/31/2020 | $24,444 | $15,820 | $16,369 |
|---|
11/30/2020 | $27,631 | $18,610 | $18,160 |
|---|
12/31/2020 | $30,410 | $20,350 | $18,859 |
|---|
1/31/2021 | $31,704 | $21,331 | $18,668 |
|---|
2/28/2021 | $32,892 | $22,035 | $19,183 |
|---|
3/31/2021 | $30,898 | $21,342 | $20,023 |
|---|
4/30/2021 | $32,277 | $21,807 | $21,092 |
|---|
5/31/2021 | $30,304 | $21,184 | $21,239 |
|---|
6/30/2021 | $31,768 | $22,178 | $21,735 |
|---|
7/31/2021 | $31,163 | $21,370 | $22,251 |
|---|
8/31/2021 | $31,980 | $21,758 | $22,928 |
|---|
9/30/2021 | $30,580 | $20,924 | $21,861 |
|---|
10/31/2021 | $32,288 | $21,904 | $23,393 |
|---|
11/30/2021 | $29,646 | $20,834 | $23,231 |
|---|
12/31/2021 | $29,538 | $20,926 | $24,272 |
|---|
1/31/2022 | $24,007 | $18,122 | $23,016 |
|---|
2/28/2022 | $24,007 | $18,201 | $22,327 |
|---|
3/31/2022 | $23,839 | $18,284 | $23,156 |
|---|
4/30/2022 | $20,636 | $16,041 | $21,137 |
|---|
5/31/2022 | $20,060 | $15,738 | $21,175 |
|---|
6/30/2022 | $18,788 | $14,763 | $19,427 |
|---|
7/31/2022 | $20,588 | $16,416 | $21,219 |
|---|
8/31/2022 | $20,528 | $16,262 | $20,353 |
|---|
9/30/2022 | $18,884 | $14,799 | $18,479 |
|---|
10/31/2022 | $20,048 | $16,204 | $19,975 |
|---|
11/30/2022 | $20,108 | $16,468 | $21,091 |
|---|
12/31/2022 | $18,848 | $15,411 | $19,876 |
|---|
1/31/2023 | $20,420 | $16,944 | $21,125 |
|---|
2/28/2023 | $20,228 | $16,760 | $20,610 |
|---|
3/31/2023 | $20,396 | $16,347 | $21,366 |
|---|
4/30/2023 | $19,892 | $16,157 | $21,700 |
|---|
5/31/2023 | $20,216 | $16,160 | $21,794 |
|---|
6/30/2023 | $21,056 | $17,499 | $23,234 |
|---|
7/31/2023 | $21,320 | $18,318 | $23,980 |
|---|
8/31/2023 | $19,856 | $17,364 | $23,599 |
|---|
9/30/2023 | $18,308 | $16,219 | $22,474 |
|---|
10/31/2023 | $16,749 | $14,968 | $22,001 |
|---|
11/30/2023 | $18,500 | $16,331 | $24,010 |
|---|
12/31/2023 | $20,396 | $18,286 | $25,101 |
|---|
1/31/2024 | $20,504 | $17,700 | $25,523 |
|---|
2/29/2024 | $22,412 | $19,137 | $26,886 |
|---|
3/31/2024 | $22,964 | $19,673 | $27,751 |
|---|
4/30/2024 | $21,572 | $18,158 | $26,617 |
|---|
5/31/2024 | $22,484 | $19,130 | $27,937 |
|---|
6/30/2024 | $23,167 | $19,098 | $28,939 |
|---|
7/31/2024 | $23,167 | $20,662 | $29,292 |
|---|
8/31/2024 | $24,043 | $20,433 | $30,002 |
|---|
9/30/2024 | $24,619 | $20,704 | $30,643 |
|---|
10/31/2024 | $24,379 | $20,430 | $30,365 |
|---|
11/30/2024 | $26,647 | $22,935 | $32,148 |
|---|
12/31/2024 | $24,823 | $21,057 | $31,381 |
|---|
1/31/2025 | $25,279 | $21,723 | $32,255 |
|---|
2/28/2025 | $22,628 | $20,252 | $31,834 |
|---|
3/31/2025 | $20,420 | $18,717 | $30,041 |
|---|
4/30/2025 | $21,200 | $18,597 | $29,837 |
|---|
5/31/2025 | $22,580 | $19,791 | $31,715 |
|---|
6/30/2025 | $24,535 | $20,956 | $33,328 |
|---|
7/31/2025 | $25,075 | $21,313 | $34,076 |
|---|
8/31/2025 | $26,587 | $22,574 | $34,766 |
|---|
9/30/2025 | $27,883 | $23,511 | $36,035 |
|---|
10/31/2025 | $29,166 | $24,272 | $36,879 |
|---|
11/30/2025 | $29,190 | $24,106 | $36,970 |
|---|
12/31/2025 | $28,326 | $23,797 | $36,992 |
|---|
1/31/2026 | $29,406 | $24,744 | $37,529 |
|---|
2/28/2026 | $29,418 | $24,684 | $37,243 |
|---|
3/31/2026 | $28,171 | $23,129 | $35,389 |
|---|
4/30/2026 | $33,114 | $26,527 | $39,102 |
|---|
5/31/2026 | $36,989 | $28,077 | $41,160 |
|---|
6/30/2026 | $39,124 | $29,075 | $40,768 |
|---|
7/31/2026 | $33,593 | $27,371 | $40,742 |
|---|
|
| Average Annual Return [Table Text Block] |
Table SummaryAATR | 1 Year | 5 Years | 10 Years |
|---|
Class P at NAV | 33.97% | 1.51% | 12.88% |
|---|
Russell 2000 Growth Index | 28.42% | 5.07% | 10.59% |
|---|
S&P 500 Index | 19.56% | 12.86% | 15.08% |
|---|
|
| No Deduction of Taxes [Text Block] |
The returns do not reflect the deduction of taxes that a shareholder would pay on Fund distributions or redemption of Fund shares.
|
| AssetsNet |
$ 2,220,280,642
|
| Holdings Count | Holding |
92
|
| Advisory Fees Paid, Amount |
$ 10,884,699
|
| InvestmentCompanyPortfolioTurnover |
110.00%
|
| Additional Fund Statistics [Text Block] |
Table SummaryTotal Net Assets | $2,220,280,642 |
|---|
# of Portfolio Holdings | 92 |
|---|
Portfolio Turnover Rate | 110% |
|---|
Total Advisory Fees Paid | $10,884,699 |
|---|
|
| Holdings [Text Block] |
Table SummaryPortfolio Holdings Presented by SectorFootnote Reference* | % Footnote Reference** |
|---|
Communication Services | 2.33% | Consumer Discretionary | 7.16% | Consumer Staples | 1.11% | Financials | 4.44% | Health Care | 28.41% | Industrials | 25.56% | Information Technology | 27.42% | Repurchase Agreements | 2.09% | Money Market FundsFootnote Reference† | 1.33% | Time DepositsFootnote Reference† | 0.15% | Total | 100.00% | | Footnote | Description | Footnote* | A sector may comprise several industries. | Footnote** | Represents percent of total investments, which excludes derivatives. | Footnote† | Securities were purchased with the cash collateral from loaned securities. |
|
| Material Fund Change [Text Block] |
There were no material changes to the Fund during the reporting period. |
| Summary of Change Legend [Text Block] |
There were no material changes to the Fund during the reporting period.
|
| C000054856 |
|
| Shareholder Report [Line Items] |
|
| Fund Name |
Lord Abbett Developing Growth Fund
|
| Class Name |
Class R2
|
| Trading Symbol |
LADQX
|
| Annual or Semi-Annual Statement [Text Block] |
This annual shareholder report contains important information about the Lord Abbett Developing Growth Fund for the period of August 1, 2025 to July 31, 2026 (the "reporting period").
|
| Additional Information [Text Block] |
You can find additional information about the Fund at lordabbett.com/FundDocuments. You can also request this information by contacting us at 888-522-2388.
|
| Additional Information Phone Number |
888-522-2388
|
| Additional Information Website |
<span style="box-sizing: border-box; color: rgb(0, 0, 0); display: inline; flex-wrap: nowrap; font-size: 13.3333px; font-weight: 400; grid-area: auto; line-height: 20px; margin: 0px; overflow: visible; text-align: left; text-align-last: auto; white-space-collapse: preserve-breaks;">lordabbett.com/FundDocuments</span>
|
| Expenses [Text Block] |
What were the Fund costs for the reporting period?(based on a hypothetical $10,000 investment) Table SummaryClass Name | Costs of a $10,000 investment | Costs paid as a percentage of a $10,000 investment |
|---|
Class R2 | $147 | 1.26% |
|---|
|
| Expenses Paid, Amount |
$ 147
|
| Expense Ratio, Percent |
1.26%
|
| Factors Affecting Performance [Text Block] |
How did the Fund perform last year and what affected its performance?For the fiscal year ended July 31, 2026, the Fund returned 33.75%, reflecting performance at the net asset value (NAV) of Class R2 shares, with all distributions reinvested, compared to the 28.42% return of a securities market index with investment characteristics similar to those of the Fund, the Russell 2000 Growth Index. The Fund's broad-based securities market index, the S&P 500 Index, returned 19.56% over the same period. Markets navigated a resilient economic backdrop amid geopolitical and inflation uncertainty. Healthy consumer spending, labor markets, and corporate earnings supported the outlook, while artificial intelligence ("AI") disruption concerns and U.S.-Iran tensions drove volatility and higher energy prices. A June ceasefire stabilized oil markets, though geopolitical tensions continued to influence Treasury yields. Meanwhile, Kevin Warsh became Fed Chair, and the Fed held rates unchanged in July amid resilient economic data. Top contributors to performance: Security selection within the Industrials sector contributed to relative performance over the period, driven by an allocation to Comfort Systems USA, a provider of commercial heating, cooling, and electrical services. Security selection within the Information Technology sector also contributed to relative performance, driven by an allocation to Astera Labs, a semiconductor technology company. Top detractors from performance: Security selection within the Consumer Discretionary sector detracted from relative performance over the period, driven by an allocation to Planet Fitness, a fitness center operator and franchisor. Security selection within the Consumer Staples sector also detracted from relative performance, driven by an allocation to Celsius Holdings, an energy drink company. |
| Performance Past Does Not Indicate Future [Text] |
The Fund's past performance is no guarantee of future results.
|
| Line Graph [Table Text Block] |
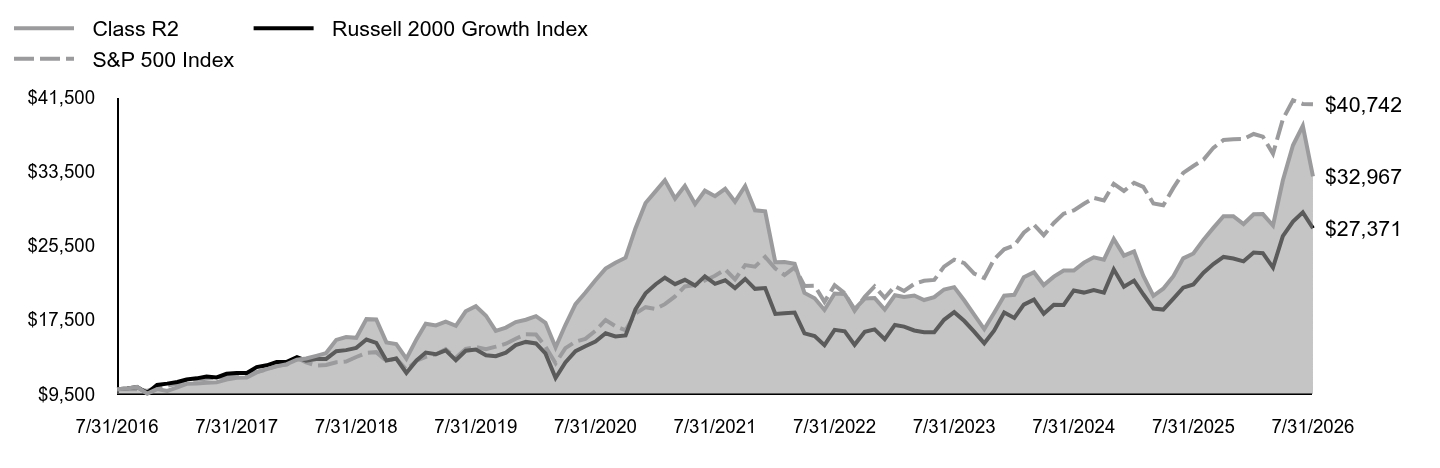 Table Summary | Class R2 | Russell 2000 Growth Index | S&P 500 Index |
|---|
7/31/2016 | $10,000 | $10,000 | $10,000 |
|---|
8/31/2016 | $10,102 | $10,106 | $10,014 |
|---|
9/30/2016 | $10,273 | $10,252 | $10,016 |
|---|
10/31/2016 | $9,539 | $9,615 | $9,833 |
|---|
11/30/2016 | $10,023 | $10,475 | $10,197 |
|---|
12/31/2016 | $9,824 | $10,618 | $10,399 |
|---|
1/31/2017 | $10,216 | $10,790 | $10,596 |
|---|
2/28/2017 | $10,592 | $11,055 | $11,017 |
|---|
3/31/2017 | $10,632 | $11,186 | $11,030 |
|---|
4/30/2017 | $10,711 | $11,392 | $11,143 |
|---|
5/31/2017 | $10,768 | $11,288 | $11,300 |
|---|
6/30/2017 | $11,053 | $11,677 | $11,370 |
|---|
7/31/2017 | $11,252 | $11,776 | $11,604 |
|---|
8/31/2017 | $11,286 | $11,762 | $11,640 |
|---|
9/30/2017 | $11,827 | $12,403 | $11,880 |
|---|
10/31/2017 | $12,180 | $12,595 | $12,157 |
|---|
11/30/2017 | $12,482 | $12,957 | $12,530 |
|---|
12/31/2017 | $12,715 | $12,971 | $12,669 |
|---|
1/31/2018 | $13,199 | $13,477 | $13,395 |
|---|
2/28/2018 | $13,324 | $13,093 | $12,901 |
|---|
3/31/2018 | $13,614 | $13,270 | $12,573 |
|---|
4/30/2018 | $13,910 | $13,283 | $12,621 |
|---|
5/31/2018 | $15,333 | $14,119 | $12,925 |
|---|
6/30/2018 | $15,635 | $14,229 | $13,005 |
|---|
7/31/2018 | $15,555 | $14,474 | $13,489 |
|---|
8/31/2018 | $17,570 | $15,375 | $13,928 |
|---|
9/30/2018 | $17,524 | $15,015 | $14,008 |
|---|
10/31/2018 | $15,065 | $13,115 | $13,050 |
|---|
11/30/2018 | $14,891 | $13,321 | $13,316 |
|---|
12/31/2018 | $13,316 | $11,764 | $12,114 |
|---|
1/31/2019 | $15,414 | $13,123 | $13,085 |
|---|
2/28/2019 | $17,081 | $13,970 | $13,505 |
|---|
3/31/2019 | $16,897 | $13,781 | $13,767 |
|---|
4/30/2019 | $17,304 | $14,201 | $14,324 |
|---|
5/31/2019 | $16,843 | $13,147 | $13,414 |
|---|
6/30/2019 | $18,418 | $14,160 | $14,360 |
|---|
7/31/2019 | $18,956 | $14,298 | $14,566 |
|---|
8/31/2019 | $17,942 | $13,681 | $14,335 |
|---|
9/30/2019 | $16,313 | $13,569 | $14,603 |
|---|
10/31/2019 | $16,659 | $13,955 | $14,920 |
|---|
11/30/2019 | $17,255 | $14,776 | $15,461 |
|---|
12/31/2019 | $17,507 | $15,115 | $15,928 |
|---|
1/31/2020 | $17,884 | $14,948 | $15,922 |
|---|
2/29/2020 | $17,178 | $13,869 | $14,611 |
|---|
3/31/2020 | $14,526 | $11,221 | $12,806 |
|---|
4/30/2020 | $16,936 | $12,892 | $14,448 |
|---|
5/31/2020 | $19,191 | $14,110 | $15,136 |
|---|
6/30/2020 | $20,410 | $14,652 | $15,437 |
|---|
7/31/2020 | $21,755 | $15,156 | $16,308 |
|---|
8/31/2020 | $23,013 | $16,045 | $17,480 |
|---|
9/30/2020 | $23,642 | $15,701 | $16,816 |
|---|
10/31/2020 | $24,194 | $15,820 | $16,369 |
|---|
11/30/2020 | $27,341 | $18,610 | $18,160 |
|---|
12/31/2020 | $30,092 | $20,350 | $18,859 |
|---|
1/31/2021 | $31,371 | $21,331 | $18,668 |
|---|
2/28/2021 | $32,541 | $22,035 | $19,183 |
|---|
3/31/2021 | $30,569 | $21,342 | $20,023 |
|---|
4/30/2021 | $31,934 | $21,807 | $21,092 |
|---|
5/31/2021 | $29,973 | $21,184 | $21,239 |
|---|
6/30/2021 | $31,414 | $22,178 | $21,735 |
|---|
7/31/2021 | $30,818 | $21,370 | $22,251 |
|---|
8/31/2021 | $31,620 | $21,758 | $22,928 |
|---|
9/30/2021 | $30,233 | $20,924 | $21,861 |
|---|
10/31/2021 | $31,923 | $21,904 | $23,393 |
|---|
11/30/2021 | $29,300 | $20,834 | $23,231 |
|---|
12/31/2021 | $29,189 | $20,926 | $24,272 |
|---|
1/31/2022 | $23,713 | $18,122 | $23,016 |
|---|
2/28/2022 | $23,726 | $18,201 | $22,327 |
|---|
3/31/2022 | $23,541 | $18,284 | $23,156 |
|---|
4/30/2022 | $20,391 | $16,041 | $21,137 |
|---|
5/31/2022 | $19,812 | $15,738 | $21,175 |
|---|
6/30/2022 | $18,557 | $14,763 | $19,427 |
|---|
7/31/2022 | $20,329 | $16,416 | $21,219 |
|---|
8/31/2022 | $20,268 | $16,262 | $20,353 |
|---|
9/30/2022 | $18,643 | $14,799 | $18,479 |
|---|
10/31/2022 | $19,788 | $16,204 | $19,975 |
|---|
11/30/2022 | $19,849 | $16,468 | $21,091 |
|---|
12/31/2022 | $18,594 | $15,411 | $19,876 |
|---|
1/31/2023 | $20,145 | $16,944 | $21,125 |
|---|
2/28/2023 | $19,948 | $16,760 | $20,610 |
|---|
3/31/2023 | $20,120 | $16,347 | $21,366 |
|---|
4/30/2023 | $19,628 | $16,157 | $21,700 |
|---|
5/31/2023 | $19,935 | $16,160 | $21,794 |
|---|
6/30/2023 | $20,760 | $17,499 | $23,234 |
|---|
7/31/2023 | $21,018 | $18,318 | $23,980 |
|---|
8/31/2023 | $19,579 | $17,364 | $23,599 |
|---|
9/30/2023 | $18,053 | $16,219 | $22,474 |
|---|
10/31/2023 | $16,502 | $14,968 | $22,001 |
|---|
11/30/2023 | $18,225 | $16,331 | $24,010 |
|---|
12/31/2023 | $20,095 | $18,286 | $25,101 |
|---|
1/31/2024 | $20,194 | $17,700 | $25,523 |
|---|
2/29/2024 | $22,077 | $19,137 | $26,886 |
|---|
3/31/2024 | $22,618 | $19,673 | $27,751 |
|---|
4/30/2024 | $21,240 | $18,158 | $26,617 |
|---|
5/31/2024 | $22,150 | $19,130 | $27,937 |
|---|
6/30/2024 | $22,815 | $19,098 | $28,939 |
|---|
7/31/2024 | $22,803 | $20,662 | $29,292 |
|---|
8/31/2024 | $23,664 | $20,433 | $30,002 |
|---|
9/30/2024 | $24,230 | $20,704 | $30,643 |
|---|
10/31/2024 | $23,984 | $20,430 | $30,365 |
|---|
11/30/2024 | $26,224 | $22,935 | $32,148 |
|---|
12/31/2024 | $24,415 | $21,057 | $31,381 |
|---|
1/31/2025 | $24,870 | $21,723 | $32,255 |
|---|
2/28/2025 | $22,249 | $20,252 | $31,834 |
|---|
3/31/2025 | $20,083 | $18,717 | $30,041 |
|---|
4/30/2025 | $20,846 | $18,597 | $29,837 |
|---|
5/31/2025 | $22,200 | $19,791 | $31,715 |
|---|
6/30/2025 | $24,119 | $20,956 | $33,328 |
|---|
7/31/2025 | $24,649 | $21,313 | $34,076 |
|---|
8/31/2025 | $26,138 | $22,574 | $34,766 |
|---|
9/30/2025 | $27,405 | $23,511 | $36,035 |
|---|
10/31/2025 | $28,660 | $24,272 | $36,879 |
|---|
11/30/2025 | $28,672 | $24,106 | $36,970 |
|---|
12/31/2025 | $27,823 | $23,797 | $36,992 |
|---|
1/31/2026 | $28,882 | $24,744 | $37,529 |
|---|
2/28/2026 | $28,894 | $24,684 | $37,243 |
|---|
3/31/2026 | $27,663 | $23,129 | $35,389 |
|---|
4/30/2026 | $32,512 | $26,527 | $39,102 |
|---|
5/31/2026 | $36,314 | $28,077 | $41,160 |
|---|
6/30/2026 | $38,406 | $29,075 | $40,768 |
|---|
7/31/2026 | $32,967 | $27,371 | $40,742 |
|---|
|
| Average Annual Return [Table Text Block] |
Table SummaryAATR | 1 Year | 5 Years | 10 Years |
|---|
Class R2 at NAV | 33.75% | 1.36% | 12.67% |
|---|
Russell 2000 Growth Index | 28.42% | 5.07% | 10.59% |
|---|
S&P 500 Index | 19.56% | 12.86% | 15.08% |
|---|
|
| No Deduction of Taxes [Text Block] |
The returns do not reflect the deduction of taxes that a shareholder would pay on Fund distributions or redemption of Fund shares.
|
| AssetsNet |
$ 2,220,280,642
|
| Holdings Count | Holding |
92
|
| Advisory Fees Paid, Amount |
$ 10,884,699
|
| InvestmentCompanyPortfolioTurnover |
110.00%
|
| Additional Fund Statistics [Text Block] |
Table SummaryTotal Net Assets | $2,220,280,642 |
|---|
# of Portfolio Holdings | 92 |
|---|
Portfolio Turnover Rate | 110% |
|---|
Total Advisory Fees Paid | $10,884,699 |
|---|
|
| Holdings [Text Block] |
Table SummaryPortfolio Holdings Presented by SectorFootnote Reference* | % Footnote Reference** |
|---|
Communication Services | 2.33% | Consumer Discretionary | 7.16% | Consumer Staples | 1.11% | Financials | 4.44% | Health Care | 28.41% | Industrials | 25.56% | Information Technology | 27.42% | Repurchase Agreements | 2.09% | Money Market FundsFootnote Reference† | 1.33% | Time DepositsFootnote Reference† | 0.15% | Total | 100.00% | | Footnote | Description | Footnote* | A sector may comprise several industries. | Footnote** | Represents percent of total investments, which excludes derivatives. | Footnote† | Securities were purchased with the cash collateral from loaned securities. |
|
| Material Fund Change [Text Block] |
There were no material changes to the Fund during the reporting period. |
| Summary of Change Legend [Text Block] |
There were no material changes to the Fund during the reporting period.
|
| C000054857 |
|
| Shareholder Report [Line Items] |
|
| Fund Name |
Lord Abbett Developing Growth Fund
|
| Class Name |
Class R3
|
| Trading Symbol |
LADRX
|
| Annual or Semi-Annual Statement [Text Block] |
This annual shareholder report contains important information about the Lord Abbett Developing Growth Fund for the period of August 1, 2025 to July 31, 2026 (the "reporting period").
|
| Additional Information [Text Block] |
You can find additional information about the Fund at lordabbett.com/FundDocuments. You can also request this information by contacting us at 888-522-2388.
|
| Additional Information Phone Number |
888-522-2388
|
| Additional Information Website |
<span style="box-sizing: border-box; color: rgb(0, 0, 0); display: inline; flex-wrap: nowrap; font-size: 13.3333px; font-weight: 400; grid-area: auto; line-height: 20px; margin: 0px; overflow: visible; text-align: left; text-align-last: auto; white-space-collapse: preserve-breaks;">lordabbett.com/FundDocuments</span>
|
| Expenses [Text Block] |
What were the Fund costs for the reporting period?(based on a hypothetical $10,000 investment) Table SummaryClass Name | Costs of a $10,000 investment | Costs paid as a percentage of a $10,000 investment |
|---|
Class R3 | $136 | 1.16% |
|---|
|
| Expenses Paid, Amount |
$ 136
|
| Expense Ratio, Percent |
1.16%
|
| Factors Affecting Performance [Text Block] |
How did the Fund perform last year and what affected its performance?For the fiscal year ended July 31, 2026, the Fund returned 33.89%, reflecting performance at the net asset value (NAV) of Class R3 shares, with all distributions reinvested, compared to the 28.42% return of a securities market index with investment characteristics similar to those of the Fund, the Russell 2000 Growth Index. The Fund's broad-based securities market index, the S&P 500 Index, returned 19.56% over the same period. Markets navigated a resilient economic backdrop amid geopolitical and inflation uncertainty. Healthy consumer spending, labor markets, and corporate earnings supported the outlook, while artificial intelligence ("AI") disruption concerns and U.S.-Iran tensions drove volatility and higher energy prices. A June ceasefire stabilized oil markets, though geopolitical tensions continued to influence Treasury yields. Meanwhile, Kevin Warsh became Fed Chair, and the Fed held rates unchanged in July amid resilient economic data. Top contributors to performance: Security selection within the Industrials sector contributed to relative performance over the period, driven by an allocation to Comfort Systems USA, a provider of commercial heating, cooling, and electrical services. Security selection within the Information Technology sector also contributed to relative performance, driven by an allocation to Astera Labs, a semiconductor technology company. Top detractors from performance: Security selection within the Consumer Discretionary sector detracted from relative performance over the period, driven by an allocation to Planet Fitness, a fitness center operator and franchisor. Security selection within the Consumer Staples sector also detracted from relative performance, driven by an allocation to Celsius Holdings, an energy drink company. |
| Performance Past Does Not Indicate Future [Text] |
The Fund's past performance is no guarantee of future results.
|
| Line Graph [Table Text Block] |
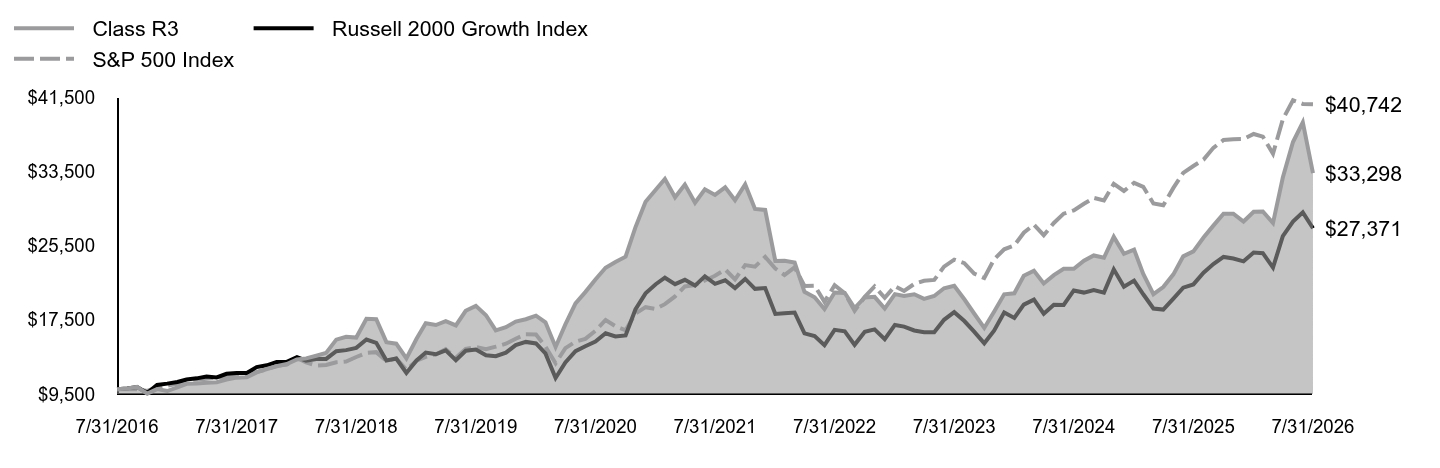 Table Summary | Class R3 | Russell 2000 Growth Index | S&P 500 Index |
|---|
7/31/2016 | $10,000 | $10,000 | $10,000 |
|---|
8/31/2016 | $10,101 | $10,106 | $10,014 |
|---|
9/30/2016 | $10,269 | $10,252 | $10,016 |
|---|
10/31/2016 | $9,540 | $9,615 | $9,833 |
|---|
11/30/2016 | $10,022 | $10,475 | $10,197 |
|---|
12/31/2016 | $9,821 | $10,618 | $10,399 |
|---|
1/31/2017 | $10,219 | $10,790 | $10,596 |
|---|
2/28/2017 | $10,595 | $11,055 | $11,017 |
|---|
3/31/2017 | $10,634 | $11,186 | $11,030 |
|---|
4/30/2017 | $10,712 | $11,392 | $11,143 |
|---|
5/31/2017 | $10,774 | $11,288 | $11,300 |
|---|
6/30/2017 | $11,060 | $11,677 | $11,370 |
|---|
7/31/2017 | $11,262 | $11,776 | $11,604 |
|---|
8/31/2017 | $11,296 | $11,762 | $11,640 |
|---|
9/30/2017 | $11,834 | $12,403 | $11,880 |
|---|
10/31/2017 | $12,193 | $12,595 | $12,157 |
|---|
11/30/2017 | $12,496 | $12,957 | $12,530 |
|---|
12/31/2017 | $12,731 | $12,971 | $12,669 |
|---|
1/31/2018 | $13,214 | $13,477 | $13,395 |
|---|
2/28/2018 | $13,337 | $13,093 | $12,901 |
|---|
3/31/2018 | $13,629 | $13,270 | $12,573 |
|---|
4/30/2018 | $13,932 | $13,283 | $12,621 |
|---|
5/31/2018 | $15,362 | $14,119 | $12,925 |
|---|
6/30/2018 | $15,665 | $14,229 | $13,005 |
|---|
7/31/2018 | $15,586 | $14,474 | $13,489 |
|---|
8/31/2018 | $17,605 | $15,375 | $13,928 |
|---|
9/30/2018 | $17,560 | $15,015 | $14,008 |
|---|
10/31/2018 | $15,093 | $13,115 | $13,050 |
|---|
11/30/2018 | $14,922 | $13,321 | $13,316 |
|---|
12/31/2018 | $13,341 | $11,764 | $12,114 |
|---|
1/31/2019 | $15,449 | $13,123 | $13,085 |
|---|
2/28/2019 | $17,121 | $13,970 | $13,505 |
|---|
3/31/2019 | $16,932 | $13,781 | $13,767 |
|---|
4/30/2019 | $17,346 | $14,201 | $14,324 |
|---|
5/31/2019 | $16,887 | $13,147 | $13,414 |
|---|
6/30/2019 | $18,468 | $14,160 | $14,360 |
|---|
7/31/2019 | $19,003 | $14,298 | $14,566 |
|---|
8/31/2019 | $17,994 | $13,681 | $14,335 |
|---|
9/30/2019 | $16,360 | $13,569 | $14,603 |
|---|
10/31/2019 | $16,706 | $13,955 | $14,920 |
|---|
11/30/2019 | $17,307 | $14,776 | $15,461 |
|---|
12/31/2019 | $17,561 | $15,115 | $15,928 |
|---|
1/31/2020 | $17,938 | $14,948 | $15,922 |
|---|
2/29/2020 | $17,231 | $13,869 | $14,611 |
|---|
3/31/2020 | $14,573 | $11,221 | $12,806 |
|---|
4/30/2020 | $16,996 | $12,892 | $14,448 |
|---|
5/31/2020 | $19,267 | $14,110 | $15,136 |
|---|
6/30/2020 | $20,483 | $14,652 | $15,437 |
|---|
7/31/2020 | $21,841 | $15,156 | $16,308 |
|---|
8/31/2020 | $23,104 | $16,045 | $17,480 |
|---|
9/30/2020 | $23,735 | $15,701 | $16,816 |
|---|
10/31/2020 | $24,301 | $15,820 | $16,369 |
|---|
11/30/2020 | $27,461 | $18,610 | $18,160 |
|---|
12/31/2020 | $30,226 | $20,350 | $18,859 |
|---|
1/31/2021 | $31,509 | $21,331 | $18,668 |
|---|
2/28/2021 | $32,686 | $22,035 | $19,183 |
|---|
3/31/2021 | $30,699 | $21,342 | $20,023 |
|---|
4/30/2021 | $32,076 | $21,807 | $21,092 |
|---|
5/31/2021 | $30,121 | $21,184 | $21,239 |
|---|
6/30/2021 | $31,561 | $22,178 | $21,735 |
|---|
7/31/2021 | $30,962 | $21,370 | $22,251 |
|---|
8/31/2021 | $31,771 | $21,758 | $22,928 |
|---|
9/30/2021 | $30,384 | $20,924 | $21,861 |
|---|
10/31/2021 | $32,087 | $21,904 | $23,393 |
|---|
11/30/2021 | $29,446 | $20,834 | $23,231 |
|---|
12/31/2021 | $29,339 | $20,926 | $24,272 |
|---|
1/31/2022 | $23,847 | $18,122 | $23,016 |
|---|
2/28/2022 | $23,859 | $18,201 | $22,327 |
|---|
3/31/2022 | $23,681 | $18,284 | $23,156 |
|---|
4/30/2022 | $20,507 | $16,041 | $21,137 |
|---|
5/31/2022 | $19,924 | $15,738 | $21,175 |
|---|
6/30/2022 | $18,664 | $14,763 | $19,427 |
|---|
7/31/2022 | $20,447 | $16,416 | $21,219 |
|---|
8/31/2022 | $20,388 | $16,262 | $20,353 |
|---|
9/30/2022 | $18,759 | $14,799 | $18,479 |
|---|
10/31/2022 | $19,912 | $16,204 | $19,975 |
|---|
11/30/2022 | $19,972 | $16,468 | $21,091 |
|---|
12/31/2022 | $18,712 | $15,411 | $19,876 |
|---|
1/31/2023 | $20,269 | $16,944 | $21,125 |
|---|
2/28/2023 | $20,079 | $16,760 | $20,610 |
|---|
3/31/2023 | $20,257 | $16,347 | $21,366 |
|---|
4/30/2023 | $19,758 | $16,157 | $21,700 |
|---|
5/31/2023 | $20,067 | $16,160 | $21,794 |
|---|
6/30/2023 | $20,899 | $17,499 | $23,234 |
|---|
7/31/2023 | $21,161 | $18,318 | $23,980 |
|---|
8/31/2023 | $19,710 | $17,364 | $23,599 |
|---|
9/30/2023 | $18,177 | $16,219 | $22,474 |
|---|
10/31/2023 | $16,619 | $14,968 | $22,001 |
|---|
11/30/2023 | $18,367 | $16,331 | $24,010 |
|---|
12/31/2023 | $20,245 | $18,286 | $25,101 |
|---|
1/31/2024 | $20,352 | $17,700 | $25,523 |
|---|
2/29/2024 | $22,242 | $19,137 | $26,886 |
|---|
3/31/2024 | $22,789 | $19,673 | $27,751 |
|---|
4/30/2024 | $21,410 | $18,158 | $26,617 |
|---|
5/31/2024 | $22,314 | $19,130 | $27,937 |
|---|
6/30/2024 | $22,991 | $19,098 | $28,939 |
|---|
7/31/2024 | $22,991 | $20,662 | $29,292 |
|---|
8/31/2024 | $23,859 | $20,433 | $30,002 |
|---|
9/30/2024 | $24,430 | $20,704 | $30,643 |
|---|
10/31/2024 | $24,180 | $20,430 | $30,365 |
|---|
11/30/2024 | $26,439 | $22,935 | $32,148 |
|---|
12/31/2024 | $24,620 | $21,057 | $31,381 |
|---|
1/31/2025 | $25,072 | $21,723 | $32,255 |
|---|
2/28/2025 | $22,433 | $20,252 | $31,834 |
|---|
3/31/2025 | $20,257 | $18,717 | $30,041 |
|---|
4/30/2025 | $21,030 | $18,597 | $29,837 |
|---|
5/31/2025 | $22,397 | $19,791 | $31,715 |
|---|
6/30/2025 | $24,335 | $20,956 | $33,328 |
|---|
7/31/2025 | $24,870 | $21,313 | $34,076 |
|---|
8/31/2025 | $26,368 | $22,574 | $34,766 |
|---|
9/30/2025 | $27,651 | $23,511 | $36,035 |
|---|
10/31/2025 | $28,923 | $24,272 | $36,879 |
|---|
11/30/2025 | $28,935 | $24,106 | $36,970 |
|---|
12/31/2025 | $28,091 | $23,797 | $36,992 |
|---|
1/31/2026 | $29,149 | $24,744 | $37,529 |
|---|
2/28/2026 | $29,173 | $24,684 | $37,243 |
|---|
3/31/2026 | $27,925 | $23,129 | $35,389 |
|---|
4/30/2026 | $32,835 | $26,527 | $39,102 |
|---|
5/31/2026 | $36,662 | $28,077 | $41,160 |
|---|
6/30/2026 | $38,779 | $29,075 | $40,768 |
|---|
7/31/2026 | $33,298 | $27,371 | $40,742 |
|---|
|
| Average Annual Return [Table Text Block] |
Table SummaryAATR | 1 Year | 5 Years | 10 Years |
|---|
Class R3 at NAV | 33.89% | 1.47% | 12.78% |
|---|
Russell 2000 Growth Index | 28.42% | 5.07% | 10.59% |
|---|
S&P 500 Index | 19.56% | 12.86% | 15.08% |
|---|
|
| No Deduction of Taxes [Text Block] |
The returns do not reflect the deduction of taxes that a shareholder would pay on Fund distributions or redemption of Fund shares.
|
| AssetsNet |
$ 2,220,280,642
|
| Holdings Count | Holding |
92
|
| Advisory Fees Paid, Amount |
$ 10,884,699
|
| InvestmentCompanyPortfolioTurnover |
110.00%
|
| Additional Fund Statistics [Text Block] |
Table SummaryTotal Net Assets | $2,220,280,642 |
|---|
# of Portfolio Holdings | 92 |
|---|
Portfolio Turnover Rate | 110% |
|---|
Total Advisory Fees Paid | $10,884,699 |
|---|
|
| Holdings [Text Block] |
Table SummaryPortfolio Holdings Presented by SectorFootnote Reference* | % Footnote Reference** |
|---|
Communication Services | 2.33% | Consumer Discretionary | 7.16% | Consumer Staples | 1.11% | Financials | 4.44% | Health Care | 28.41% | Industrials | 25.56% | Information Technology | 27.42% | Repurchase Agreements | 2.09% | Money Market FundsFootnote Reference† | 1.33% | Time DepositsFootnote Reference† | 0.15% | Total | 100.00% | | Footnote | Description | Footnote* | A sector may comprise several industries. | Footnote** | Represents percent of total investments, which excludes derivatives. | Footnote† | Securities were purchased with the cash collateral from loaned securities. |
|
| Material Fund Change [Text Block] |
There were no material changes to the Fund during the reporting period. |
| Summary of Change Legend [Text Block] |
There were no material changes to the Fund during the reporting period.
|
| C000151972 |
|
| Shareholder Report [Line Items] |
|
| Fund Name |
Lord Abbett Developing Growth Fund
|
| Class Name |
Class R4
|
| Trading Symbol |
LADSX
|
| Annual or Semi-Annual Statement [Text Block] |
This annual shareholder report contains important information about the Lord Abbett Developing Growth Fund for the period of August 1, 2025 to July 31, 2026 (the "reporting period").
|
| Additional Information [Text Block] |
You can find additional information about the Fund at lordabbett.com/FundDocuments. You can also request this information by contacting us at 888-522-2388.
|
| Additional Information Phone Number |
888-522-2388
|
| Additional Information Website |
<span style="box-sizing: border-box; color: rgb(0, 0, 0); display: inline; flex-wrap: nowrap; font-size: 13.3333px; font-weight: 400; grid-area: auto; line-height: 20px; margin: 0px; overflow: visible; text-align: left; text-align-last: auto; white-space-collapse: preserve-breaks;">lordabbett.com/FundDocuments</span>
|
| Expenses [Text Block] |
What were the Fund costs for the reporting period?(based on a hypothetical $10,000 investment) Table SummaryClass Name | Costs of a $10,000 investment | Costs paid as a percentage of a $10,000 investment |
|---|
Class R4 | $107 | 0.91% |
|---|
|
| Expenses Paid, Amount |
$ 107
|
| Expense Ratio, Percent |
0.91%
|
| Factors Affecting Performance [Text Block] |
How did the Fund perform last year and what affected its performance?For the fiscal year ended July 31, 2026, the Fund returned 34.25%, reflecting performance at the net asset value (NAV) of Class R4 shares, with all distributions reinvested, compared to the 28.42% return of a securities market index with investment characteristics similar to those of the Fund, the Russell 2000 Growth Index. The Fund's broad-based securities market index, the S&P 500 Index, returned 19.56% over the same period. Markets navigated a resilient economic backdrop amid geopolitical and inflation uncertainty. Healthy consumer spending, labor markets, and corporate earnings supported the outlook, while artificial intelligence ("AI") disruption concerns and U.S.-Iran tensions drove volatility and higher energy prices. A June ceasefire stabilized oil markets, though geopolitical tensions continued to influence Treasury yields. Meanwhile, Kevin Warsh became Fed Chair, and the Fed held rates unchanged in July amid resilient economic data. Top contributors to performance: Security selection within the Industrials sector contributed to relative performance over the period, driven by an allocation to Comfort Systems USA, a provider of commercial heating, cooling, and electrical services. Security selection within the Information Technology sector also contributed to relative performance, driven by an allocation to Astera Labs, a semiconductor technology company. Top detractors from performance: Security selection within the Consumer Discretionary sector detracted from relative performance over the period, driven by an allocation to Planet Fitness, a fitness center operator and franchisor. Security selection within the Consumer Staples sector also detracted from relative performance, driven by an allocation to Celsius Holdings, an energy drink company. |
| Performance Past Does Not Indicate Future [Text] |
The Fund's past performance is no guarantee of future results.
|
| Line Graph [Table Text Block] |
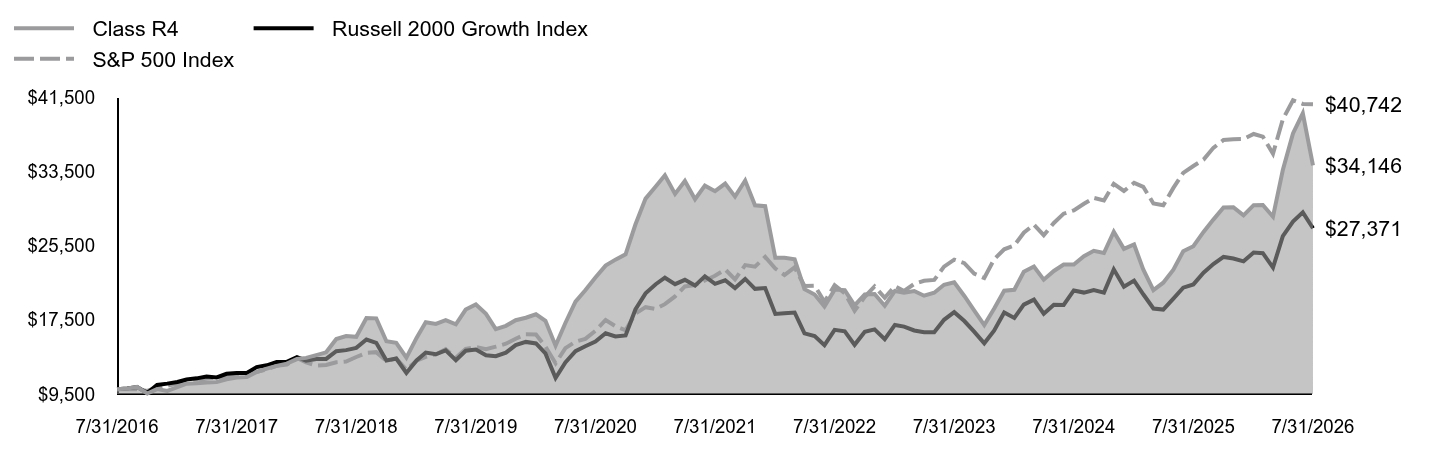 Table Summary | Class R4 | Russell 2000 Growth Index | S&P 500 Index |
|---|
7/31/2016 | $10,000 | $10,000 | $10,000 |
|---|
8/31/2016 | $10,104 | $10,106 | $10,014 |
|---|
9/30/2016 | $10,274 | $10,252 | $10,016 |
|---|
10/31/2016 | $9,551 | $9,615 | $9,833 |
|---|
11/30/2016 | $10,033 | $10,475 | $10,197 |
|---|
12/31/2016 | $9,836 | $10,618 | $10,399 |
|---|
1/31/2017 | $10,236 | $10,790 | $10,596 |
|---|
2/28/2017 | $10,614 | $11,055 | $11,017 |
|---|
3/31/2017 | $10,652 | $11,186 | $11,030 |
|---|
4/30/2017 | $10,734 | $11,392 | $11,143 |
|---|
5/31/2017 | $10,795 | $11,288 | $11,300 |
|---|
6/30/2017 | $11,085 | $11,677 | $11,370 |
|---|
7/31/2017 | $11,288 | $11,776 | $11,604 |
|---|
8/31/2017 | $11,326 | $11,762 | $11,640 |
|---|
9/30/2017 | $11,874 | $12,403 | $11,880 |
|---|
10/31/2017 | $12,230 | $12,595 | $12,157 |
|---|
11/30/2017 | $12,537 | $12,957 | $12,530 |
|---|
12/31/2017 | $12,778 | $12,971 | $12,669 |
|---|
1/31/2018 | $13,266 | $13,477 | $13,395 |
|---|
2/28/2018 | $13,392 | $13,093 | $12,901 |
|---|
3/31/2018 | $13,688 | $13,270 | $12,573 |
|---|
4/30/2018 | $13,995 | $13,283 | $12,621 |
|---|
5/31/2018 | $15,430 | $14,119 | $12,925 |
|---|
6/30/2018 | $15,742 | $14,229 | $13,005 |
|---|
7/31/2018 | $15,666 | $14,474 | $13,489 |
|---|
8/31/2018 | $17,699 | $15,375 | $13,928 |
|---|
9/30/2018 | $17,655 | $15,015 | $14,008 |
|---|
10/31/2018 | $15,184 | $13,115 | $13,050 |
|---|
11/30/2018 | $15,018 | $13,321 | $13,316 |
|---|
12/31/2018 | $13,423 | $11,764 | $12,114 |
|---|
1/31/2019 | $15,550 | $13,123 | $13,085 |
|---|
2/28/2019 | $17,240 | $13,970 | $13,505 |
|---|
3/31/2019 | $17,050 | $13,781 | $13,767 |
|---|
4/30/2019 | $17,466 | $14,201 | $14,324 |
|---|
5/31/2019 | $17,007 | $13,147 | $13,414 |
|---|
6/30/2019 | $18,602 | $14,160 | $14,360 |
|---|
7/31/2019 | $19,148 | $14,298 | $14,566 |
|---|
8/31/2019 | $18,136 | $13,681 | $14,335 |
|---|
9/30/2019 | $16,490 | $13,569 | $14,603 |
|---|
10/31/2019 | $16,846 | $13,955 | $14,920 |
|---|
11/30/2019 | $17,456 | $14,776 | $15,461 |
|---|
12/31/2019 | $17,718 | $15,115 | $15,928 |
|---|
1/31/2020 | $18,097 | $14,948 | $15,922 |
|---|
2/29/2020 | $17,393 | $13,869 | $14,611 |
|---|
3/31/2020 | $14,712 | $11,221 | $12,806 |
|---|
4/30/2020 | $17,158 | $12,892 | $14,448 |
|---|
5/31/2020 | $19,451 | $14,110 | $15,136 |
|---|
6/30/2020 | $20,688 | $14,652 | $15,437 |
|---|
7/31/2020 | $22,059 | $15,156 | $16,308 |
|---|
8/31/2020 | $23,341 | $16,045 | $17,480 |
|---|
9/30/2020 | $23,982 | $15,701 | $16,816 |
|---|
10/31/2020 | $24,560 | $15,820 | $16,369 |
|---|
11/30/2020 | $27,767 | $18,610 | $18,160 |
|---|
12/31/2020 | $30,559 | $20,350 | $18,859 |
|---|
1/31/2021 | $31,869 | $21,331 | $18,668 |
|---|
2/28/2021 | $33,070 | $22,035 | $19,183 |
|---|
3/31/2021 | $31,069 | $21,342 | $20,023 |
|---|
4/30/2021 | $32,460 | $21,807 | $21,092 |
|---|
5/31/2021 | $30,489 | $21,184 | $21,239 |
|---|
6/30/2021 | $31,959 | $22,178 | $21,735 |
|---|
7/31/2021 | $31,359 | $21,370 | $22,251 |
|---|
8/31/2021 | $32,180 | $21,758 | $22,928 |
|---|
9/30/2021 | $30,779 | $20,924 | $21,861 |
|---|
10/31/2021 | $32,510 | $21,904 | $23,393 |
|---|
11/30/2021 | $29,846 | $20,834 | $23,231 |
|---|
12/31/2021 | $29,745 | $20,926 | $24,272 |
|---|
1/31/2022 | $24,178 | $18,122 | $23,016 |
|---|
2/28/2022 | $24,189 | $18,201 | $22,327 |
|---|
3/31/2022 | $24,021 | $18,284 | $23,156 |
|---|
4/30/2022 | $20,799 | $16,041 | $21,137 |
|---|
5/31/2022 | $20,216 | $15,738 | $21,175 |
|---|
6/30/2022 | $18,936 | $14,763 | $19,427 |
|---|
7/31/2022 | $20,754 | $16,416 | $21,219 |
|---|
8/31/2022 | $20,698 | $16,262 | $20,353 |
|---|
9/30/2022 | $19,048 | $14,799 | $18,479 |
|---|
10/31/2022 | $20,227 | $16,204 | $19,975 |
|---|
11/30/2022 | $20,283 | $16,468 | $21,091 |
|---|
12/31/2022 | $19,015 | $15,411 | $19,876 |
|---|
1/31/2023 | $20,609 | $16,944 | $21,125 |
|---|
2/28/2023 | $20,418 | $16,760 | $20,610 |
|---|
3/31/2023 | $20,597 | $16,347 | $21,366 |
|---|
4/30/2023 | $20,092 | $16,157 | $21,700 |
|---|
5/31/2023 | $20,418 | $16,160 | $21,794 |
|---|
6/30/2023 | $21,271 | $17,499 | $23,234 |
|---|
7/31/2023 | $21,540 | $18,318 | $23,980 |
|---|
8/31/2023 | $20,070 | $17,364 | $23,599 |
|---|
9/30/2023 | $18,510 | $16,219 | $22,474 |
|---|
10/31/2023 | $16,927 | $14,968 | $22,001 |
|---|
11/30/2023 | $18,700 | $16,331 | $24,010 |
|---|
12/31/2023 | $20,631 | $18,286 | $25,101 |
|---|
1/31/2024 | $20,732 | $17,700 | $25,523 |
|---|
2/29/2024 | $22,674 | $19,137 | $26,886 |
|---|
3/31/2024 | $23,235 | $19,673 | $27,751 |
|---|
4/30/2024 | $21,821 | $18,158 | $26,617 |
|---|
5/31/2024 | $22,764 | $19,130 | $27,937 |
|---|
6/30/2024 | $23,448 | $19,098 | $28,939 |
|---|
7/31/2024 | $23,460 | $20,662 | $29,292 |
|---|
8/31/2024 | $24,346 | $20,433 | $30,002 |
|---|
9/30/2024 | $24,930 | $20,704 | $30,643 |
|---|
10/31/2024 | $24,694 | $20,430 | $30,365 |
|---|
11/30/2024 | $26,995 | $22,935 | $32,148 |
|---|
12/31/2024 | $25,143 | $21,057 | $31,381 |
|---|
1/31/2025 | $25,615 | $21,723 | $32,255 |
|---|
2/28/2025 | $22,932 | $20,252 | $31,834 |
|---|
3/31/2025 | $20,698 | $18,717 | $30,041 |
|---|
4/30/2025 | $21,495 | $18,597 | $29,837 |
|---|
5/31/2025 | $22,898 | $19,791 | $31,715 |
|---|
6/30/2025 | $24,885 | $20,956 | $33,328 |
|---|
7/31/2025 | $25,435 | $21,313 | $34,076 |
|---|
8/31/2025 | $26,973 | $22,574 | $34,766 |
|---|
9/30/2025 | $28,297 | $23,511 | $36,035 |
|---|
10/31/2025 | $29,600 | $24,272 | $36,879 |
|---|
11/30/2025 | $29,633 | $24,106 | $36,970 |
|---|
12/31/2025 | $28,758 | $23,797 | $36,992 |
|---|
1/31/2026 | $29,858 | $24,744 | $37,529 |
|---|
2/28/2026 | $29,880 | $24,684 | $37,243 |
|---|
3/31/2026 | $28,612 | $23,129 | $35,389 |
|---|
4/30/2026 | $33,640 | $26,527 | $39,102 |
|---|
5/31/2026 | $37,580 | $28,077 | $41,160 |
|---|
6/30/2026 | $39,758 | $29,075 | $40,768 |
|---|
7/31/2026 | $34,146 | $27,371 | $40,742 |
|---|
|
| Average Annual Return [Table Text Block] |
Table SummaryAATR | 1 Year | 5 Years | 10 Years |
|---|
Class R4 at NAV | 34.25% | 1.72% | 13.07% |
|---|
Russell 2000 Growth Index | 28.42% | 5.07% | 10.59% |
|---|
S&P 500 Index | 19.56% | 12.86% | 15.08% |
|---|
|
| No Deduction of Taxes [Text Block] |
The returns do not reflect the deduction of taxes that a shareholder would pay on Fund distributions or redemption of Fund shares.
|
| AssetsNet |
$ 2,220,280,642
|
| Holdings Count | Holding |
92
|
| Advisory Fees Paid, Amount |
$ 10,884,699
|
| InvestmentCompanyPortfolioTurnover |
110.00%
|
| Additional Fund Statistics [Text Block] |
Table SummaryTotal Net Assets | $2,220,280,642 |
|---|
# of Portfolio Holdings | 92 |
|---|
Portfolio Turnover Rate | 110% |
|---|
Total Advisory Fees Paid | $10,884,699 |
|---|
|
| Holdings [Text Block] |
Table SummaryPortfolio Holdings Presented by SectorFootnote Reference* | % Footnote Reference** |
|---|
Communication Services | 2.33% | Consumer Discretionary | 7.16% | Consumer Staples | 1.11% | Financials | 4.44% | Health Care | 28.41% | Industrials | 25.56% | Information Technology | 27.42% | Repurchase Agreements | 2.09% | Money Market FundsFootnote Reference† | 1.33% | Time DepositsFootnote Reference† | 0.15% | Total | 100.00% | | Footnote | Description | Footnote* | A sector may comprise several industries. | Footnote** | Represents percent of total investments, which excludes derivatives. | Footnote† | Securities were purchased with the cash collateral from loaned securities. |
|
| Material Fund Change [Text Block] |
There were no material changes to the Fund during the reporting period. |
| Summary of Change Legend [Text Block] |
There were no material changes to the Fund during the reporting period.
|
| C000151973 |
|
| Shareholder Report [Line Items] |
|
| Fund Name |
Lord Abbett Developing Growth Fund
|
| Class Name |
Class R5
|
| Trading Symbol |
LADTX
|
| Annual or Semi-Annual Statement [Text Block] |
This annual shareholder report contains important information about the Lord Abbett Developing Growth Fund for the period of August 1, 2025 to July 31, 2026 (the "reporting period").
|
| Additional Information [Text Block] |
You can find additional information about the Fund at lordabbett.com/FundDocuments. You can also request this information by contacting us at 888-522-2388.
|
| Additional Information Phone Number |
888-522-2388
|
| Additional Information Website |
<span style="box-sizing: border-box; color: rgb(0, 0, 0); display: inline; flex-wrap: nowrap; font-size: 13.3333px; font-weight: 400; grid-area: auto; line-height: 20px; margin: 0px; overflow: visible; text-align: left; text-align-last: auto; white-space-collapse: preserve-breaks;">lordabbett.com/FundDocuments</span>
|
| Expenses [Text Block] |
What were the Fund costs for the reporting period?(based on a hypothetical $10,000 investment) Table SummaryClass Name | Costs of a $10,000 investment | Costs paid as a percentage of a $10,000 investment |
|---|
Class R5 | $77 | 0.66% |
|---|
|
| Expenses Paid, Amount |
$ 77
|
| Expense Ratio, Percent |
0.66%
|
| Factors Affecting Performance [Text Block] |
How did the Fund perform last year and what affected its performance?For the fiscal year ended July 31, 2026, the Fund returned 34.58%, reflecting performance at the net asset value (NAV) of Class R5 shares, with all distributions reinvested, compared to the 28.42% return of a securities market index with investment characteristics similar to those of the Fund, the Russell 2000 Growth Index. The Fund's broad-based securities market index, the S&P 500 Index, returned 19.56% over the same period. Markets navigated a resilient economic backdrop amid geopolitical and inflation uncertainty. Healthy consumer spending, labor markets, and corporate earnings supported the outlook, while artificial intelligence ("AI") disruption concerns and U.S.-Iran tensions drove volatility and higher energy prices. A June ceasefire stabilized oil markets, though geopolitical tensions continued to influence Treasury yields. Meanwhile, Kevin Warsh became Fed Chair, and the Fed held rates unchanged in July amid resilient economic data. Top contributors to performance: Security selection within the Industrials sector contributed to relative performance over the period, driven by an allocation to Comfort Systems USA, a provider of commercial heating, cooling, and electrical services. Security selection within the Information Technology sector also contributed to relative performance, driven by an allocation to Astera Labs, a semiconductor technology company. Top detractors from performance: Security selection within the Consumer Discretionary sector detracted from relative performance over the period, driven by an allocation to Planet Fitness, a fitness center operator and franchisor. Security selection within the Consumer Staples sector also detracted from relative performance, driven by an allocation to Celsius Holdings, an energy drink company. |
| Performance Past Does Not Indicate Future [Text] |
The Fund's past performance is no guarantee of future results.
|
| Line Graph [Table Text Block] |
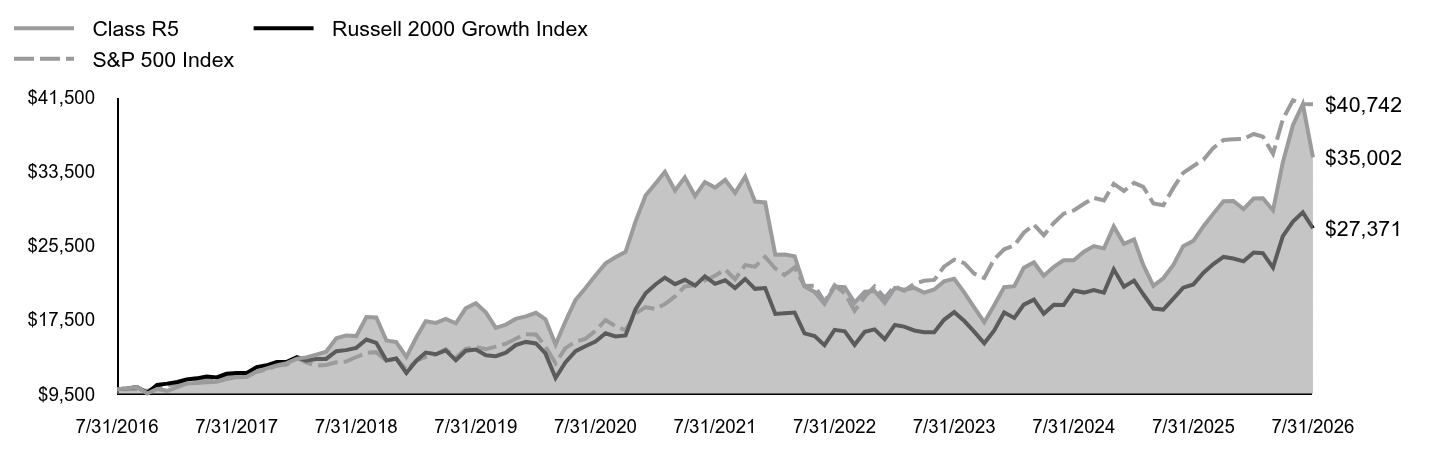 Table Summary | Class R5 | Russell 2000 Growth Index | S&P 500 Index |
|---|
7/31/2016 | $10,000 | $10,000 | $10,000 |
|---|
8/31/2016 | $10,106 | $10,106 | $10,014 |
|---|
9/30/2016 | $10,279 | $10,252 | $10,016 |
|---|
10/31/2016 | $9,553 | $9,615 | $9,833 |
|---|
11/30/2016 | $10,038 | $10,475 | $10,197 |
|---|
12/31/2016 | $9,841 | $10,618 | $10,399 |
|---|
1/31/2017 | $10,245 | $10,790 | $10,596 |
|---|
2/28/2017 | $10,625 | $11,055 | $11,017 |
|---|
3/31/2017 | $10,673 | $11,186 | $11,030 |
|---|
4/30/2017 | $10,754 | $11,392 | $11,143 |
|---|
5/31/2017 | $10,817 | $11,288 | $11,300 |
|---|
6/30/2017 | $11,110 | $11,677 | $11,370 |
|---|
7/31/2017 | $11,317 | $11,776 | $11,604 |
|---|
8/31/2017 | $11,355 | $11,762 | $11,640 |
|---|
9/30/2017 | $11,903 | $12,403 | $11,880 |
|---|
10/31/2017 | $12,268 | $12,595 | $12,157 |
|---|
11/30/2017 | $12,580 | $12,957 | $12,530 |
|---|
12/31/2017 | $12,821 | $12,971 | $12,669 |
|---|
1/31/2018 | $13,316 | $13,477 | $13,395 |
|---|
2/28/2018 | $13,445 | $13,093 | $12,901 |
|---|
3/31/2018 | $13,743 | $13,270 | $12,573 |
|---|
4/30/2018 | $14,051 | $13,283 | $12,621 |
|---|
5/31/2018 | $15,502 | $14,119 | $12,925 |
|---|
6/30/2018 | $15,815 | $14,229 | $13,005 |
|---|
7/31/2018 | $15,742 | $14,474 | $13,489 |
|---|
8/31/2018 | $17,790 | $15,375 | $13,928 |
|---|
9/30/2018 | $17,746 | $15,015 | $14,008 |
|---|
10/31/2018 | $15,267 | $13,115 | $13,050 |
|---|
11/30/2018 | $15,102 | $13,321 | $13,316 |
|---|
12/31/2018 | $13,503 | $11,764 | $12,114 |
|---|
1/31/2019 | $15,642 | $13,123 | $13,085 |
|---|
2/28/2019 | $17,346 | $13,970 | $13,505 |
|---|
3/31/2019 | $17,162 | $13,781 | $13,767 |
|---|
4/30/2019 | $17,585 | $14,201 | $14,324 |
|---|
5/31/2019 | $17,125 | $13,147 | $13,414 |
|---|
6/30/2019 | $18,737 | $14,160 | $14,360 |
|---|
7/31/2019 | $19,289 | $14,298 | $14,566 |
|---|
8/31/2019 | $18,271 | $13,681 | $14,335 |
|---|
9/30/2019 | $16,622 | $13,569 | $14,603 |
|---|
10/31/2019 | $16,984 | $13,955 | $14,920 |
|---|
11/30/2019 | $17,595 | $14,776 | $15,461 |
|---|
12/31/2019 | $17,865 | $15,115 | $15,928 |
|---|
1/31/2020 | $18,253 | $14,948 | $15,922 |
|---|
2/29/2020 | $17,544 | $13,869 | $14,611 |
|---|
3/31/2020 | $14,840 | $11,221 | $12,806 |
|---|
4/30/2020 | $17,310 | $12,892 | $14,448 |
|---|
5/31/2020 | $19,641 | $14,110 | $15,136 |
|---|
6/30/2020 | $20,890 | $14,652 | $15,437 |
|---|
7/31/2020 | $22,279 | $15,156 | $16,308 |
|---|
8/31/2020 | $23,579 | $16,045 | $17,480 |
|---|
9/30/2020 | $24,230 | $15,701 | $16,816 |
|---|
10/31/2020 | $24,821 | $15,820 | $16,369 |
|---|
11/30/2020 | $28,060 | $18,610 | $18,160 |
|---|
12/31/2020 | $30,899 | $20,350 | $18,859 |
|---|
1/31/2021 | $32,223 | $21,331 | $18,668 |
|---|
2/28/2021 | $33,444 | $22,035 | $19,183 |
|---|
3/31/2021 | $31,430 | $21,342 | $20,023 |
|---|
4/30/2021 | $32,849 | $21,807 | $21,092 |
|---|
5/31/2021 | $30,851 | $21,184 | $21,239 |
|---|
6/30/2021 | $32,350 | $22,178 | $21,735 |
|---|
7/31/2021 | $31,747 | $21,370 | $22,251 |
|---|
8/31/2021 | $32,588 | $21,758 | $22,928 |
|---|
9/30/2021 | $31,176 | $20,924 | $21,861 |
|---|
10/31/2021 | $32,937 | $21,904 | $23,393 |
|---|
11/30/2021 | $30,248 | $20,834 | $23,231 |
|---|
12/31/2021 | $30,153 | $20,926 | $24,272 |
|---|
1/31/2022 | $24,512 | $18,122 | $23,016 |
|---|
2/28/2022 | $24,530 | $18,201 | $22,327 |
|---|
3/31/2022 | $24,356 | $18,284 | $23,156 |
|---|
4/30/2022 | $21,098 | $16,041 | $21,137 |
|---|
5/31/2022 | $20,509 | $15,738 | $21,175 |
|---|
6/30/2022 | $19,218 | $14,763 | $19,427 |
|---|
7/31/2022 | $21,072 | $16,416 | $21,219 |
|---|
8/31/2022 | $21,020 | $16,262 | $20,353 |
|---|
9/30/2022 | $19,348 | $14,799 | $18,479 |
|---|
10/31/2022 | $20,535 | $16,204 | $19,975 |
|---|
11/30/2022 | $20,604 | $16,468 | $21,091 |
|---|
12/31/2022 | $19,322 | $15,411 | $19,876 |
|---|
1/31/2023 | $20,942 | $16,944 | $21,125 |
|---|
2/28/2023 | $20,752 | $16,760 | $20,610 |
|---|
3/31/2023 | $20,942 | $16,347 | $21,366 |
|---|
4/30/2023 | $20,431 | $16,157 | $21,700 |
|---|
5/31/2023 | $20,769 | $16,160 | $21,794 |
|---|
6/30/2023 | $21,636 | $17,499 | $23,234 |
|---|
7/31/2023 | $21,913 | $18,318 | $23,980 |
|---|
8/31/2023 | $20,423 | $17,364 | $23,599 |
|---|
9/30/2023 | $18,837 | $16,219 | $22,474 |
|---|
10/31/2023 | $17,234 | $14,968 | $22,001 |
|---|
11/30/2023 | $19,045 | $16,331 | $24,010 |
|---|
12/31/2023 | $21,012 | $18,286 | $25,101 |
|---|
1/31/2024 | $21,124 | $17,700 | $25,523 |
|---|
2/29/2024 | $23,100 | $19,137 | $26,886 |
|---|
3/31/2024 | $23,680 | $19,673 | $27,751 |
|---|
4/30/2024 | $22,251 | $18,158 | $26,617 |
|---|
5/31/2024 | $23,204 | $19,130 | $27,937 |
|---|
6/30/2024 | $23,914 | $19,098 | $28,939 |
|---|
7/31/2024 | $23,923 | $20,662 | $29,292 |
|---|
8/31/2024 | $24,841 | $20,433 | $30,002 |
|---|
9/30/2024 | $25,439 | $20,704 | $30,643 |
|---|
10/31/2024 | $25,197 | $20,430 | $30,365 |
|---|
11/30/2024 | $27,562 | $22,935 | $32,148 |
|---|
12/31/2024 | $25,679 | $21,057 | $31,381 |
|---|
1/31/2025 | $26,165 | $21,723 | $32,255 |
|---|
2/28/2025 | $23,421 | $20,252 | $31,834 |
|---|
3/31/2025 | $21,147 | $18,717 | $30,041 |
|---|
4/30/2025 | $21,972 | $18,597 | $29,837 |
|---|
5/31/2025 | $23,404 | $19,791 | $31,715 |
|---|
6/30/2025 | $25,435 | $20,956 | $33,328 |
|---|
7/31/2025 | $26,008 | $21,313 | $34,076 |
|---|
8/31/2025 | $27,588 | $22,574 | $34,766 |
|---|
9/30/2025 | $28,943 | $23,511 | $36,035 |
|---|
10/31/2025 | $30,288 | $24,272 | $36,879 |
|---|
11/30/2025 | $30,314 | $24,106 | $36,970 |
|---|
12/31/2025 | $29,438 | $23,797 | $36,992 |
|---|
1/31/2026 | $30,566 | $24,744 | $37,529 |
|---|
2/28/2026 | $30,601 | $24,684 | $37,243 |
|---|
3/31/2026 | $29,299 | $23,129 | $35,389 |
|---|
4/30/2026 | $34,464 | $26,527 | $39,102 |
|---|
5/31/2026 | $38,501 | $28,077 | $41,160 |
|---|
6/30/2026 | $40,749 | $29,075 | $40,768 |
|---|
7/31/2026 | $35,002 | $27,371 | $40,742 |
|---|
|
| Average Annual Return [Table Text Block] |
Table SummaryAATR | 1 Year | 5 Years | 10 Years |
|---|
Class R5 at NAV | 34.58% | 1.97% | 13.35% |
|---|
Russell 2000 Growth Index | 28.42% | 5.07% | 10.59% |
|---|
S&P 500 Index | 19.56% | 12.86% | 15.08% |
|---|
|
| No Deduction of Taxes [Text Block] |
The returns do not reflect the deduction of taxes that a shareholder would pay on Fund distributions or redemption of Fund shares.
|
| AssetsNet |
$ 2,220,280,642
|
| Holdings Count | Holding |
92
|
| Advisory Fees Paid, Amount |
$ 10,884,699
|
| InvestmentCompanyPortfolioTurnover |
110.00%
|
| Additional Fund Statistics [Text Block] |
Table SummaryTotal Net Assets | $2,220,280,642 |
|---|
# of Portfolio Holdings | 92 |
|---|
Portfolio Turnover Rate | 110% |
|---|
Total Advisory Fees Paid | $10,884,699 |
|---|
|
| Holdings [Text Block] |
Table SummaryPortfolio Holdings Presented by SectorFootnote Reference* | % Footnote Reference** |
|---|
Communication Services | 2.33% | Consumer Discretionary | 7.16% | Consumer Staples | 1.11% | Financials | 4.44% | Health Care | 28.41% | Industrials | 25.56% | Information Technology | 27.42% | Repurchase Agreements | 2.09% | Money Market FundsFootnote Reference† | 1.33% | Time DepositsFootnote Reference† | 0.15% | Total | 100.00% | | Footnote | Description | Footnote* | A sector may comprise several industries. | Footnote** | Represents percent of total investments, which excludes derivatives. | Footnote† | Securities were purchased with the cash collateral from loaned securities. |
|
| Material Fund Change [Text Block] |
There were no material changes to the Fund during the reporting period. |
| Summary of Change Legend [Text Block] |
There were no material changes to the Fund during the reporting period.
|
| C000151974 |
|
| Shareholder Report [Line Items] |
|
| Fund Name |
Lord Abbett Developing Growth Fund
|
| Class Name |
Class R6
|
| Trading Symbol |
LADVX
|
| Annual or Semi-Annual Statement [Text Block] |
This annual shareholder report contains important information about the Lord Abbett Developing Growth Fund for the period of August 1, 2025 to July 31, 2026 (the "reporting period").
|
| Additional Information [Text Block] |
You can find additional information about the Fund at lordabbett.com/FundDocuments. You can also request this information by contacting us at 888-522-2388.
|
| Additional Information Phone Number |
888-522-2388
|
| Additional Information Website |
<span style="box-sizing: border-box; color: rgb(0, 0, 0); display: inline; flex-wrap: nowrap; font-size: 13.3333px; font-weight: 400; grid-area: auto; line-height: 20px; margin: 0px; overflow: visible; text-align: left; text-align-last: auto; white-space-collapse: preserve-breaks;">lordabbett.com/FundDocuments</span>
|
| Expenses [Text Block] |
What were the Fund costs for the reporting period?(based on a hypothetical $10,000 investment) Table SummaryClass Name | Costs of a $10,000 investment | Costs paid as a percentage of a $10,000 investment |
|---|
Class R6 | $69 | 0.59% |
|---|
|
| Expenses Paid, Amount |
$ 69
|
| Expense Ratio, Percent |
0.59%
|
| Factors Affecting Performance [Text Block] |
How did the Fund perform last year and what affected its performance?For the fiscal year ended July 31, 2026, the Fund returned 34.67%, reflecting performance at the net asset value (NAV) of Class R6 shares, with all distributions reinvested, compared to the 28.42% return of a securities market index with investment characteristics similar to those of the Fund, the Russell 2000 Growth Index. The Fund's broad-based securities market index, the S&P 500 Index, returned 19.56% over the same period. Markets navigated a resilient economic backdrop amid geopolitical and inflation uncertainty. Healthy consumer spending, labor markets, and corporate earnings supported the outlook, while artificial intelligence ("AI") disruption concerns and U.S.-Iran tensions drove volatility and higher energy prices. A June ceasefire stabilized oil markets, though geopolitical tensions continued to influence Treasury yields. Meanwhile, Kevin Warsh became Fed Chair, and the Fed held rates unchanged in July amid resilient economic data. Top contributors to performance: Security selection within the Industrials sector contributed to relative performance over the period, driven by an allocation to Comfort Systems USA, a provider of commercial heating, cooling, and electrical services. Security selection within the Information Technology sector also contributed to relative performance, driven by an allocation to Astera Labs, a semiconductor technology company. Top detractors from performance: Security selection within the Consumer Discretionary sector detracted from relative performance over the period, driven by an allocation to Planet Fitness, a fitness center operator and franchisor. Security selection within the Consumer Staples sector also detracted from relative performance, driven by an allocation to Celsius Holdings, an energy drink company. |
| Performance Past Does Not Indicate Future [Text] |
The Fund's past performance is no guarantee of future results.
|
| Line Graph [Table Text Block] |
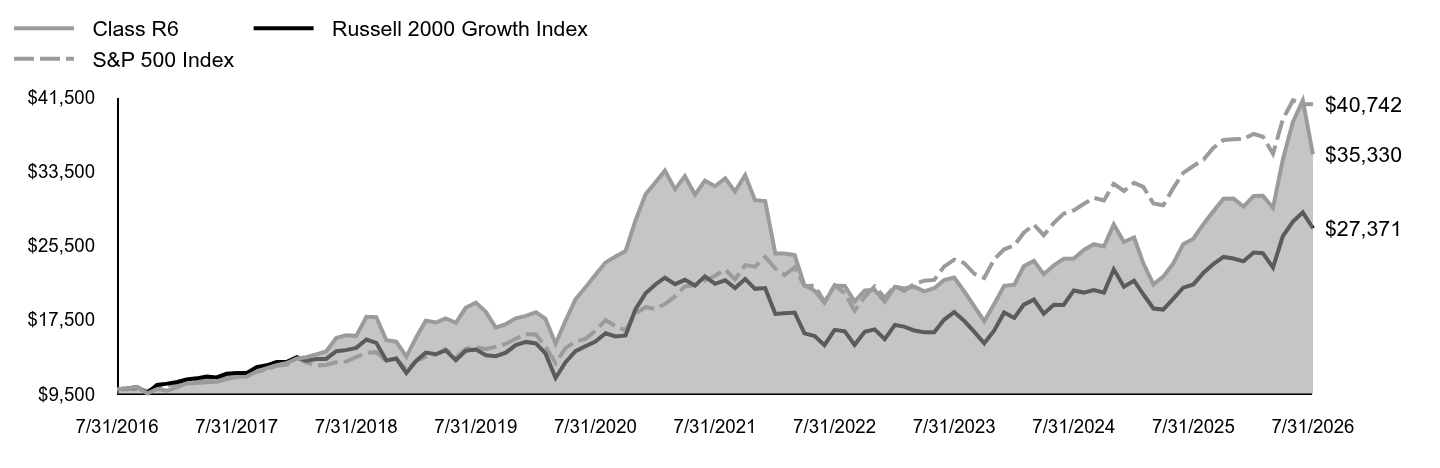 Table Summary | Class R6 | Russell 2000 Growth Index | S&P 500 Index |
|---|
7/31/2016 | $10,000 | $10,000 | $10,000 |
|---|
8/31/2016 | $10,106 | $10,106 | $10,014 |
|---|
9/30/2016 | $10,278 | $10,252 | $10,016 |
|---|
10/31/2016 | $9,554 | $9,615 | $9,833 |
|---|
11/30/2016 | $10,038 | $10,475 | $10,197 |
|---|
12/31/2016 | $9,847 | $10,618 | $10,399 |
|---|
1/31/2017 | $10,249 | $10,790 | $10,596 |
|---|
2/28/2017 | $10,633 | $11,055 | $11,017 |
|---|
3/31/2017 | $10,681 | $11,186 | $11,030 |
|---|
4/30/2017 | $10,763 | $11,392 | $11,143 |
|---|
5/31/2017 | $10,830 | $11,288 | $11,300 |
|---|
6/30/2017 | $11,122 | $11,677 | $11,370 |
|---|
7/31/2017 | $11,329 | $11,776 | $11,604 |
|---|
8/31/2017 | $11,372 | $11,762 | $11,640 |
|---|
9/30/2017 | $11,918 | $12,403 | $11,880 |
|---|
10/31/2017 | $12,283 | $12,595 | $12,157 |
|---|
11/30/2017 | $12,600 | $12,957 | $12,530 |
|---|
12/31/2017 | $12,839 | $12,971 | $12,669 |
|---|
1/31/2018 | $13,338 | $13,477 | $13,395 |
|---|
2/28/2018 | $13,468 | $13,093 | $12,901 |
|---|
3/31/2018 | $13,770 | $13,270 | $12,573 |
|---|
4/30/2018 | $14,077 | $13,283 | $12,621 |
|---|
5/31/2018 | $15,530 | $14,119 | $12,925 |
|---|
6/30/2018 | $15,842 | $14,229 | $13,005 |
|---|
7/31/2018 | $15,770 | $14,474 | $13,489 |
|---|
8/31/2018 | $17,827 | $15,375 | $13,928 |
|---|
9/30/2018 | $17,784 | $15,015 | $14,008 |
|---|
10/31/2018 | $15,300 | $13,115 | $13,050 |
|---|
11/30/2018 | $15,136 | $13,321 | $13,316 |
|---|
12/31/2018 | $13,535 | $11,764 | $12,114 |
|---|
1/31/2019 | $15,679 | $13,123 | $13,085 |
|---|
2/28/2019 | $17,390 | $13,970 | $13,505 |
|---|
3/31/2019 | $17,207 | $13,781 | $13,767 |
|---|
4/30/2019 | $17,635 | $14,201 | $14,324 |
|---|
5/31/2019 | $17,170 | $13,147 | $13,414 |
|---|
6/30/2019 | $18,790 | $14,160 | $14,360 |
|---|
7/31/2019 | $19,346 | $14,298 | $14,566 |
|---|
8/31/2019 | $18,325 | $13,681 | $14,335 |
|---|
9/30/2019 | $16,669 | $13,569 | $14,603 |
|---|
10/31/2019 | $17,036 | $13,955 | $14,920 |
|---|
11/30/2019 | $17,658 | $14,776 | $15,461 |
|---|
12/31/2019 | $17,920 | $15,115 | $15,928 |
|---|
1/31/2020 | $18,320 | $14,948 | $15,922 |
|---|
2/29/2020 | $17,607 | $13,869 | $14,611 |
|---|
3/31/2020 | $14,900 | $11,221 | $12,806 |
|---|
4/30/2020 | $17,374 | $12,892 | $14,448 |
|---|
5/31/2020 | $19,710 | $14,110 | $15,136 |
|---|
6/30/2020 | $20,968 | $14,652 | $15,437 |
|---|
7/31/2020 | $22,365 | $15,156 | $16,308 |
|---|
8/31/2020 | $23,667 | $16,045 | $17,480 |
|---|
9/30/2020 | $24,322 | $15,701 | $16,816 |
|---|
10/31/2020 | $24,912 | $15,820 | $16,369 |
|---|
11/30/2020 | $28,173 | $18,610 | $18,160 |
|---|
12/31/2020 | $31,021 | $20,350 | $18,859 |
|---|
1/31/2021 | $32,355 | $21,331 | $18,668 |
|---|
2/28/2021 | $33,577 | $22,035 | $19,183 |
|---|
3/31/2021 | $31,558 | $21,342 | $20,023 |
|---|
4/30/2021 | $32,986 | $21,807 | $21,092 |
|---|
5/31/2021 | $30,982 | $21,184 | $21,239 |
|---|
6/30/2021 | $32,497 | $22,178 | $21,735 |
|---|
7/31/2021 | $31,897 | $21,370 | $22,251 |
|---|
8/31/2021 | $32,741 | $21,758 | $22,928 |
|---|
9/30/2021 | $31,329 | $20,924 | $21,861 |
|---|
10/31/2021 | $33,096 | $21,904 | $23,393 |
|---|
11/30/2021 | $30,398 | $20,834 | $23,231 |
|---|
12/31/2021 | $30,303 | $20,926 | $24,272 |
|---|
1/31/2022 | $24,635 | $18,122 | $23,016 |
|---|
2/28/2022 | $24,652 | $18,201 | $22,327 |
|---|
3/31/2022 | $24,489 | $18,284 | $23,156 |
|---|
4/30/2022 | $21,216 | $16,041 | $21,137 |
|---|
5/31/2022 | $20,621 | $15,738 | $21,175 |
|---|
6/30/2022 | $19,329 | $14,763 | $19,427 |
|---|
7/31/2022 | $21,190 | $16,416 | $21,219 |
|---|
8/31/2022 | $21,138 | $16,262 | $20,353 |
|---|
9/30/2022 | $19,458 | $14,799 | $18,479 |
|---|
10/31/2022 | $20,664 | $16,204 | $19,975 |
|---|
11/30/2022 | $20,733 | $16,468 | $21,091 |
|---|
12/31/2022 | $19,441 | $15,411 | $19,876 |
|---|
1/31/2023 | $21,069 | $16,944 | $21,125 |
|---|
2/28/2023 | $20,880 | $16,760 | $20,610 |
|---|
3/31/2023 | $21,069 | $16,347 | $21,366 |
|---|
4/30/2023 | $20,561 | $16,157 | $21,700 |
|---|
5/31/2023 | $20,897 | $16,160 | $21,794 |
|---|
6/30/2023 | $21,775 | $17,499 | $23,234 |
|---|
7/31/2023 | $22,051 | $18,318 | $23,980 |
|---|
8/31/2023 | $20,552 | $17,364 | $23,599 |
|---|
9/30/2023 | $18,967 | $16,219 | $22,474 |
|---|
10/31/2023 | $17,348 | $14,968 | $22,001 |
|---|
11/30/2023 | $19,174 | $16,331 | $24,010 |
|---|
12/31/2023 | $21,155 | $18,286 | $25,101 |
|---|
1/31/2024 | $21,276 | $17,700 | $25,523 |
|---|
2/29/2024 | $23,266 | $19,137 | $26,886 |
|---|
3/31/2024 | $23,851 | $19,673 | $27,751 |
|---|
4/30/2024 | $22,413 | $18,158 | $26,617 |
|---|
5/31/2024 | $23,378 | $19,130 | $27,937 |
|---|
6/30/2024 | $24,092 | $19,098 | $28,939 |
|---|
7/31/2024 | $24,101 | $20,662 | $29,292 |
|---|
8/31/2024 | $25,031 | $20,433 | $30,002 |
|---|
9/30/2024 | $25,643 | $20,704 | $30,643 |
|---|
10/31/2024 | $25,402 | $20,430 | $30,365 |
|---|
11/30/2024 | $27,779 | $22,935 | $32,148 |
|---|
12/31/2024 | $25,881 | $21,057 | $31,381 |
|---|
1/31/2025 | $26,373 | $21,723 | $32,255 |
|---|
2/28/2025 | $23,611 | $20,252 | $31,834 |
|---|
3/31/2025 | $21,324 | $18,717 | $30,041 |
|---|
4/30/2025 | $22,153 | $18,597 | $29,837 |
|---|
5/31/2025 | $23,602 | $19,791 | $31,715 |
|---|
6/30/2025 | $25,656 | $20,956 | $33,328 |
|---|
7/31/2025 | $26,234 | $21,313 | $34,076 |
|---|
8/31/2025 | $27,831 | $22,574 | $34,766 |
|---|
9/30/2025 | $29,195 | $23,511 | $36,035 |
|---|
10/31/2025 | $30,558 | $24,272 | $36,879 |
|---|
11/30/2025 | $30,584 | $24,106 | $36,970 |
|---|
12/31/2025 | $29,704 | $23,797 | $36,992 |
|---|
1/31/2026 | $30,843 | $24,744 | $37,529 |
|---|
2/28/2026 | $30,877 | $24,684 | $37,243 |
|---|
3/31/2026 | $29,566 | $23,129 | $35,389 |
|---|
4/30/2026 | $34,778 | $26,527 | $39,102 |
|---|
5/31/2026 | $38,860 | $28,077 | $41,160 |
|---|
6/30/2026 | $41,129 | $29,075 | $40,768 |
|---|
7/31/2026 | $35,330 | $27,371 | $40,742 |
|---|
|
| Average Annual Return [Table Text Block] |
Table SummaryAATR | 1 Year | 5 Years | 10 Years |
|---|
Class R6 at NAV | 34.67% | 2.07% | 13.45% |
|---|
Russell 2000 Growth Index | 28.42% | 5.07% | 10.59% |
|---|
S&P 500 Index | 19.56% | 12.86% | 15.08% |
|---|
|
| No Deduction of Taxes [Text Block] |
The returns do not reflect the deduction of taxes that a shareholder would pay on Fund distributions or redemption of Fund shares.
|
| AssetsNet |
$ 2,220,280,642
|
| Holdings Count | Holding |
92
|
| Advisory Fees Paid, Amount |
$ 10,884,699
|
| InvestmentCompanyPortfolioTurnover |
110.00%
|
| Additional Fund Statistics [Text Block] |
Table SummaryTotal Net Assets | $2,220,280,642 |
|---|
# of Portfolio Holdings | 92 |
|---|
Portfolio Turnover Rate | 110% |
|---|
Total Advisory Fees Paid | $10,884,699 |
|---|
|
| Holdings [Text Block] |
Table SummaryPortfolio Holdings Presented by SectorFootnote Reference* | % Footnote Reference** |
|---|
Communication Services | 2.33% | Consumer Discretionary | 7.16% | Consumer Staples | 1.11% | Financials | 4.44% | Health Care | 28.41% | Industrials | 25.56% | Information Technology | 27.42% | Repurchase Agreements | 2.09% | Money Market FundsFootnote Reference† | 1.33% | Time DepositsFootnote Reference† | 0.15% | Total | 100.00% | | Footnote | Description | Footnote* | A sector may comprise several industries. | Footnote** | Represents percent of total investments, which excludes derivatives. | Footnote† | Securities were purchased with the cash collateral from loaned securities. |
|
| Material Fund Change [Text Block] |
There were no material changes to the Fund during the reporting period. |
| Summary of Change Legend [Text Block] |
There were no material changes to the Fund during the reporting period.
|