The following bar chart and tables provide an indication of the risks of investing in the Fund by showing changes in the Fund’s Institutional Class shares performance from year to year and by showing how the average annual total returns for each class compared to that of a broad-based securities market index. The Fund acquired all of the assets and liabilities of the Cantor Fitzgerald Equity Dividend Plus Fund (the “Surviving Fund”) and the Cantor FBP Appreciation & Income Opportunities Fund (together with the Surviving Fund, the “Predecessor Funds”), each a series of Williamsburg Investment Trust in tax-free reorganizations on July 28, 2023 (the “Reorganizations”). In connection with the Reorganizations, shares of each Predecessor Fund were exchanged for Institutional Class shares of the Fund. The Surviving Fund had an investment objective and strategies that were, in all material respects, the same as those of the Fund, and were managed in a manner that, in all material respects, complied with the investment guidelines and restrictions of the Fund. The performance information set forth below reflects the historical performance of the Surviving Fund shares, which are the Institutional Class shares of the Fund. Although Class A shares and Class C shares have similar annual returns to Institutional Class shares because the classes are invested in the same portfolio of securities, the returns for Class A shares and Class C shares are lower than Institutional Class shares because Class A and Class C shares have higher expenses than Institutional Class shares.
The Fund’s past performance is not necessarily an indication of how the Fund will perform in the future. Updated performance information is available online at https://equitydividendplusfund.cantorassetmanagement.com/.
You may obtain the Fund’s most recently available month-end performance by calling 1-833-764-2266 or 1-855-9-CANTOR (1-855-922-6867) by visiting the Fund’s website at https://equitydividendplusfund.cantorassetmanagement.com/.
As of the date of this prospectus, the Class C shares had not yet commenced operations, so no performance information is shown for Class C shares.
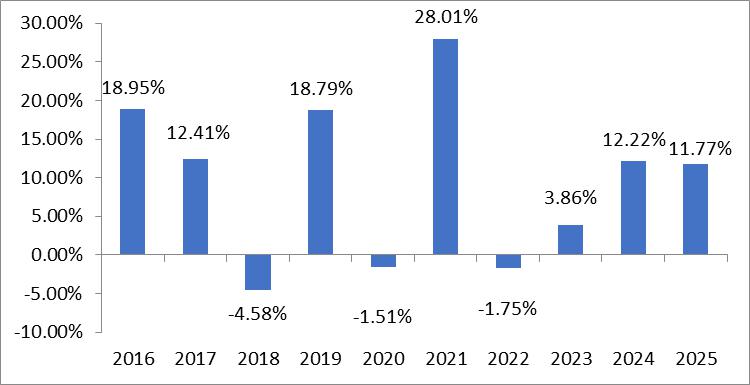
During the periods illustrated in this bar chart, the Fund’s shares highest quarterly return was 17.93% for the quarter ended December 31, 2020, and its lowest quarterly return was -28.92% for the quarter ended March 31, 2020.
| 1 year | 5 years | 10 years or lifetime | ||||
| Institutional Class Return Before Taxes | 11.77% | 10.38% | 9.35% | |||
| Institutional Class Return After Taxes on Distributions | 9.04% | 8.05% | 7.48% | |||
| Institutional Class Return After Taxes on Distributions and Sale of Fund Shares | 8.68% | 7.91% | 7.25% | |||
| Class A Shares Return Before Taxes | 5.11% | N/A* | 8.44%* | |||
| S&P 500® Index (reflects no deduction for fees, expenses, or taxes)** | 17.88% | 14.42% | 14.82% | |||
| Russell 1000 Value (reflects no deduction for fees, expenses, or taxes)*** | 15.91% | 11.33% | 10.53% |
| * | Class A commenced on July 31, 2023. |
| ** | Standard & Poor’s 500® and S&P 500® are registered trademarks of Standard & Poor’s Financial Services LLC, a division of S&P Global. All rights reserved. The primary index was changed from Russell 1000 Value Index to the S&P 500 Index because the latter is a broader-based market index. The Russell 1000 Value Index is now used as a secondary benchmark, because the Advisor believes it represents the portion of the market in which the Fund invests. |
| *** | Frank Russell Company is the source and owner of the trademarks, service marks, and copyrights related to the Russell Indexes. Russell® is a trademark of Frank Russell Company. |
After-tax performance is presented only for Institutional Class shares of the Fund. The after-tax returns for other Fund classes may vary. Actual after-tax returns depend on the investor’s individual tax situation and may differ from the returns shown. After-tax returns are not relevant for shares held in tax-advantaged investment vehicles such as employer-sponsored 401(k) plans and individual retirement accounts (IRAs). The after-tax returns shown are calculated using the highest individual federal marginal income tax rates in effect during the periods presented and do not reflect the impact of state and local taxes.
The following bar chart and tables provide an indication of the risks of investing in the Fund by showing changes in the Fund’s Class A performance from year to year and by showing how the average annual total returns for each class compared to that of a broad-based securities market index. The Fund acquired all of the assets and liabilities of the First Investors Select Growth Fund, a series of First Investors Equity Funds (the “First Predecessor Fund”) in a tax-free reorganization on October 4, 2019. The Fund acquired all of the assets and liabilities of the Delaware Growth Equity Fund, a series of Delaware Group Equity Funds IV, (the “Predecessor Fund”), (the “Second Predecessor Fund”) together with the First Predecessor Fund, the “Predecessor Funds”) in a tax-free reorganization on September 16, 2022 (the “Reorganization”). In connection with First Predecessor Fund acquisition, shares of the First Predecessor Fund’s Class A shares, Advisor Class shares, and Institutional Class shares were exchanged for Class A shares, Institutional Class shares, and Class R6 shares, respectively, of the Second Predecessor Fund. In connection with Second Predecessor Fund acquisition, shares of the Second Predecessor Fund’s Class A shares, Institutional Class shares, and Class R6 shares were exchanged for Class A shares, Institutional Class shares, and Class R6 shares of the Fund. The Predecessor Funds had an investment objective and strategies that were, in all material respects, the same as those of the Fund, and were managed in a manner that, in all material respects, complied with the investment guidelines and restrictions of the Fund. The performance information set forth below reflects the historical performance of the Predecessor Funds shares. Although Institutional Class shares, Class C shares, and Class R6 shares have similar annual returns to Class A shares because the classes are invested in the same portfolio of securities, (i) the returns for Institutional Class shares and Class R6 shares are higher than Class A shares because Institutional Class shares and Class R6 shares have lower expenses than Class A shares and (ii) the returns for Class C shares are lower than Class A shares because Class C shares have higher expenses than Class A shares.
Performance information for periods prior to September 16, 2022 does not reflect the Fund’s current Advisor. The Fund’s past performance is not necessarily an indication of how the Fund will perform in the future. Updated performance information is available online at https://largecapfocusedfund.cantorassetmanagement.com/.
You may obtain the Fund’s most recently available month-end performance by calling 1-833-764-2266 or 1-855-9-CANTOR (1-855-922-6867) or by visiting the Fund’s website at https://largecapfocusedfund.cantorassetmanagement.com/.
As of the date of this prospectus, the Class C shares had not yet commenced operations, so no performance information is shown for Class C shares.
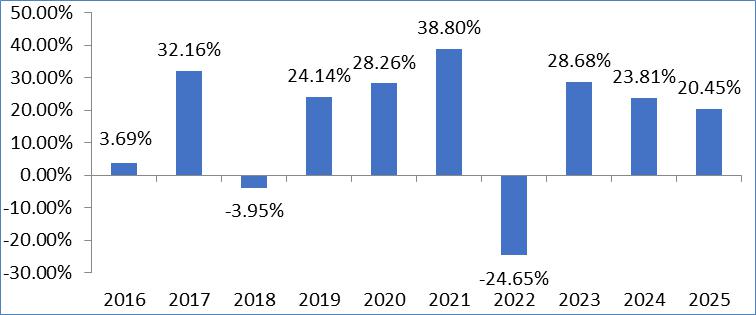
During the periods illustrated in this bar chart, Class A’s highest quarterly return was 25.42% for the quarter ended June 30, 2020, and its lowest quarterly return was -19.28% for the quarter ended June 30, 2022.
| 1 year | 5 years | 10 years or lifetime | ||||
| Class A return before taxes | 13.53% | 13.60% | 14.77% | |||
| Class A return after taxes on distributions | 12.32% | 10.05% | 11.70% | |||
| Class A return after taxes on distributions and sale of Fund shares | 8.49% | 9.89% | 11.25% | |||
| Institutional Class return before taxes (lifetime: 4/1/13–12/31/25) | 20.83% | 15.28% | 15.82% | |||
| Class R6 return before taxes (lifetime: 4/1/13–12/31/25) | 20.91% | 15.37% | 15.88% | |||
| Standard & Poor’s 500 Index (reflects no deduction for fees, expenses, or taxes) | 17.88% | 14.42% | 14.82% |
Standard & Poor’s 500® and S&P 500® are registered trademarks of Standard & Poor’s Financial Services LLC, a division of S&P Global. All rights reserved.
After-tax performance is presented only for Class A shares of the Fund. The after-tax returns for other Fund classes may vary. Actual after-tax returns depend on the investor’s individual tax situation and may differ from the returns shown. After-tax returns are not relevant for shares held in tax-advantaged investment vehicles such as employer-sponsored 401(k) plans and individual retirement accounts (IRAs). The after-tax returns shown are calculated using the highest individual federal marginal income tax rates in effect during the periods presented and do not reflect the impact of state and local taxes.
The following bar chart and tables provide an indication of the risks of investing in the Fund by showing changes in the Fund’s Class A performance from year to year and by showing how the average annual total returns for each class compared to that of a broad-based securities market index. Although Institutional Class shares, Class C shares, Class F shares, and Class R6 shares have similar annual returns to Class A shares because the classes are invested in the same portfolio of securities, (i) the returns for Institutional Class shares, Class F shares, and Class R6 shares are higher than Class A shares because Institutional Class shares, Class F shares, and Class R6 shares have lower expenses than Class A shares and (ii) the returns for Class C shares are lower than Class A shares because Class C shares have higher expenses than Class A shares.
The Fund’s past performance is not necessarily an indication of how the Fund will perform in the future. Updated performance information is available online at https://InternationalEquityFund.cantorassetmanagement.com/.
You may obtain the Fund’s most recently available month-end performance by calling 1-833-764-2266 or 1-855-9-CANTOR (1-855-922-6867) or by visiting the Fund’s website at https://InternationalEquityFund.cantorassetmanagement.com/.
As of the date of this prospectus, the Class C shares had not yet commenced operations, so no performance information is shown for Class C shares.
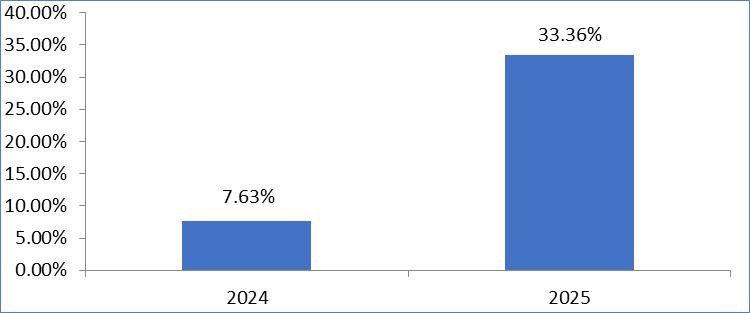
During the periods illustrated in this bar chart, Class A’s highest quarterly return was 11.75% for the quarter ended June 30, 2025, and its lowest quarterly return was -5.50% for the quarter ended December 31, 2024.
| 1 year | 10
years or lifetime* | |||
| Class A return before taxes | 25.69% | 18.01% | ||
| Class A return after taxes on distributions | 25.54% | 17.72% | ||
| Class A return after taxes on distributions and sale of Fund shares | 15.31% | 13.95% | ||
| Institutional Class return before taxes | 33.79% | 21.79% | ||
| Class F return before taxes | 34.01% | 22.04% | ||
| MSCI ACWI ex USA Index (reflects no deduction for fees, expenses, or taxes) | 32.38% | 19.07% |
| * | Class A commenced on December 15, 2023. |
After-tax performance is presented only for Class A shares of the Fund. The after-tax returns for other Fund classes may vary. Actual after-tax returns depend on the investor’s individual tax situation and may differ from the returns shown. After-tax returns are not relevant for shares held in tax-advantaged investment vehicles such as employer-sponsored 401(k) plans and individual retirement accounts (IRAs). The after-tax returns shown are calculated using the highest individual federal marginal income tax rates in effect during the periods presented and do not reflect the impact of state and local taxes.
The following bar chart and tables provide an indication of the risks of investing in the Fund by showing changes in the Fund’s Institutional Class (formerly, Class Y) performance from year to year and by showing how the average annual total returns for each class compared to that of a broad-based securities market index. The Fund acquired all of the assets and liabilities of the Aquila High Income Fund, a series of the Aquila Funds Trust (the “Predecessor Fund”) in a tax-free reorganization on November 22, 2024 (the “Reorganization”). In connection with the Predecessor Fund acquisition, (i) the Predecessor Fund’s Class A shares, Class C shares, and Class I shares were exchanged for Class A shares of the Fund; (ii) the Predecessor Fund’s Class Y shares were exchanged for Institutional Class shares of the Fund; and (iii) the Class F shares are no longer offered. The Predecessor Fund had an investment objective and strategies that were, in all material respects, the same as those of the Fund, and were managed in a manner that, in all material respects, complied with the investment guidelines and restrictions of the Fund. The performance information set forth below reflects the historical performance of the Predecessor Fund. Although Class A shares and Class C shares have similar annual returns to Institutional Class shares because the classes are invested in the same portfolio of securities, the returns for Class A shares and Class C shares are lower than Institutional Class shares because Class A and Class C shares have higher expenses than Institutional Class shares.
Performance information for the periods presented below includes performance of the Fund’s prior investment advisor. The Fund’s past performance is not necessarily an indication of how the Fund will perform in the future. Updated performance information is available online at https://highincomefund.cantorassetmanagement.com.
You may obtain the Fund’s most recently available month-end performance by calling 1-833-764-2266 or 1-855-9-CANTOR (1-855-922-6867) or by visiting the Fund’s website at https://highincomefund.cantorassetmanagement.com.
As of the date of this prospectus, the Class C shares had not yet commenced operations, so no performance information is shown for Class C shares.
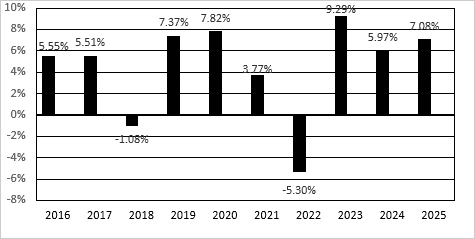
During the periods illustrated in this bar chart, the Institutional Class’s highest quarterly return was 5.02% for the quarter ended December 31, 2023, and its lowest quarterly return was (7.02)% for the quarter ended June 30, 2022.
| 1 year | 5 years | 10 years | ||||
| Institutional Class return before taxes | 7.08% | 4.04% | 4.51% | |||
| Institutional Class return after taxes on distributions | 4.65% | 1.96% | 2.58% | |||
| Institutional Class return after taxes on distributions and sale of Fund shares | 4.14% | 2.16% | 2.60% | |||
| Class A shares return before taxes | 2.60% | 2.97% | 3.86% | |||
| Bloomberg U.S. Aggregate Bond Index (reflects no deduction for fees, expenses, or taxes)* | 7.30% | -0.36% | 2.01% | |||
| Bloomberg US Corporate High Yield Total Return Index Value Unhedged (reflects no deduction for fees, expenses, or taxes)* | 8.62% | 4.51% | 6.53% |
| * | Bloomberg Index Services Limited. BLOOMBERG® is a trademark and service mark of Bloomberg Finance L.P. and its affiliates (collectively “Bloomberg”). The primary index was changed from Bloomberg US Corporate High Yield Total Return Index Value Unhedged to the Bloomberg U.S. Aggregate Bond Index because the latter is a broader-based market index. The Bloomberg US Corporate High Yield Total Return Index Value Unhedged is now used as a secondary benchmark, because the Advisor believes it represents the portion of the market in which the Fund invests. |
After-tax performance is presented only for Institutional Class shares of the Fund. The after-tax returns for other Fund classes may vary. Actual after-tax returns depend on the investor’s individual tax situation and may differ from the returns shown. After-tax returns are not relevant for shares held in tax-advantaged investment vehicles such as employer-sponsored 401(k) plans and individual retirement accounts (IRAs). The after-tax returns shown are calculated using the highest individual federal marginal income tax rates in effect during the periods presented and do not reflect the impact of state and local taxes.
The following bar chart and tables provide an indication of the risks of investing in the Fund by showing changes in the Fund’s Institutional Class performance from year to year and by showing how the average annual total returns for each class compared to that of a broad-based securities market index.
The Aquila Opportunity Growth Fund, a series of Aquila Funds Trust (the “Second Predecessor Fund”) acquired the assets and liabilities of Aquila Three Peaks Equity Opportunity Fund (the “First Predecessor Fund”) on October 11, 2013. The Fund acquired all of the assets and liabilities of the Second Predecessor Fund (together with the First Predecessor Fund, the “Predecessor Funds”) in a tax-free reorganization on November 22, 2024 (the “Reorganization”). In connection with the Predecessor Fund acquisition, (i) the Predecessor Fund’s Class A shares, Class C shares, and Class I shares were exchanged for Class A shares of the Fund; (ii) the Predecessor Fund’s Class Y shares were exchanged for Institutional Class shares of the Fund; and (iii) the Class F shares are no longer offered. The Predecessor Funds had an investment objective and strategies that were, in all material respects, the same as those of the Fund, and were managed in a manner that, in all material respects, complied with the investment guidelines and restrictions of the Fund. The performance information set forth below reflects the historical performance of the Predecessor Funds. Although Class A shares and Class C shares have similar annual returns to Institutional Class shares because the classes are invested in the same portfolio of securities, the returns for Class A shares and Class C shares are lower than Institutional Class shares because Class A and Class C shares have higher expenses than Institutional Class shares.
Performance information for the periods presented below includes performance of the Fund’s prior investment Advisor. The Fund’s past performance is not necessarily an indication of how the Fund will perform in the future. Updated performance information is available online at https://equityopportunityfund.cantorassetmanagement.com.
You may obtain the Fund’s most recently available month-end performance by calling 1-833-764-2266 or 1-855-9-CANTOR (1-855-922-6867) or by visiting the Fund’s website at https://equityopportunityfund.cantorassetmanagement.com.
As of the date of this prospectus, the Class C shares had not yet commenced operations, so no performance information is shown for Class C shares.
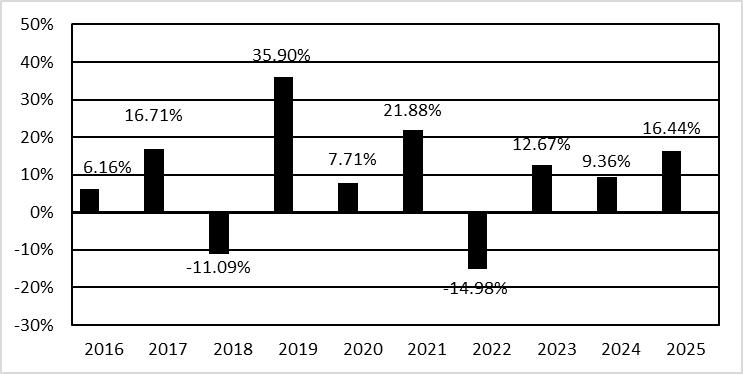
During the periods illustrated in this bar chart, the Institutional Class’s highest quarterly return was 16.53% for the quarter ended December 31, 2020, and its lowest quarterly return was (25.22)% for the quarter ended March 31, 2020.
| 1 year | 5 years | 10 years | ||||
| Institutional Class return before taxes | 16.44% | 8.26% | 9.14% | |||
| Institutional Class return after taxes on distributions | 15.17% | 5.06% | 6.72% | |||
| Institutional Class return after taxes on distributions and sale of Fund shares | 10.68% | 5.81% | 6.80% | |||
| Class A shares return before taxes | 11.19% | 7.01% | 8.34% | |||
| S&P 500 Index (reflects no deduction for fees, expenses, or taxes)* | 17.88% | 14.42% | 14.82% | |||
| MSCI USA Mid Cap Index (reflects no deduction for fees, expenses or taxes) | 8.14% | 11.86% | 11.03% |
| * | Standard & Poor’s 500® and S&P 500® are registered trademarks of Standard & Poor’s Financial Services LLC, a division of S&P Global. All rights reserved. The MSCI USA Mid Cap Index is used as a secondary benchmark because the Advisor believes it represents the portion of the market in which the Fund invests. |
After-tax performance is presented only for Institutional Class shares of the Fund. The after-tax returns for other Fund classes may vary. Actual after-tax returns depend on the investor’s individual tax situation and may differ from the returns shown. After-tax returns are not relevant for shares held in tax-advantaged investment vehicles such as employer-sponsored 401(k) plans and individual retirement accounts (IRAs). The after-tax returns shown are calculated using the highest individual federal marginal income tax rates in effect during the periods presented and do not reflect the impact of state and local taxes.