Pay vs Performance Disclosure - USD ($)
|
12 Months Ended |
Jun. 30, 2026 |
Jun. 30, 2025 |
Jun. 30, 2024 |
Jun. 30, 2023 |
Jun. 30, 2022 |
| Pay vs Performance Disclosure |
|
|
|
|
|
| Pay vs Performance Disclosure, Table |
| | | | | | | | | | | | | | | | | | | | | | | | | | | | | | | | | | | | | | | | | | | | | | | | | | | | Fiscal Year | Summary Compensation Table Total for PEO(1) | Compensation Actually Paid to PEO(2) | Average Summary Compensation Table Total for non-PEO NEOs(3) | Average Compensation Actually Paid to non-PEO NEOs(4) | Value of Initial Fixed $100
Investment Based On: | Net
Income ($M) | Adjusted Net Sales ($M)(6) | RMD Total
Shareholder Return | Dow Jones US Select Med. Equipment Total Shareholder Return(5) | 2026 | | $ | 16,201,649 | | | $ | (6,801,309) | | | $ | 3,576,611 | | | $ | 961,618 | | | $ | 79.05 | | | $ | 82.11 | | | $ | 1,523 | | | $ | 5,646 | | 2025 | | $ | 14,674,543 | | | $ | 29,631,927 | | | $ | 3,356,257 | | | $ | 5,832,409 | | | $ | 104.66 | | | $ | 104.20 | | | $ | 1,401 | | | $ | 5,137 | | 2024 | | $ | 14,120,829 | | | $ | 10,329,790 | | | $ | 3,129,017 | | | $ | 2,578,989 | | | $ | 77.65 | | | $ | 93.12 | | | $ | 1,021 | | | $ | 4,720 | | 2023 | | $ | 13,868,641 | | | $ | 16,867,038 | | | $ | 4,147,542 | | | $ | 4,909,275 | | | $ | 88.63 | | | $ | 93.84 | | | $ | 898 | | | $ | 4,163 | | 2022 | | $ | 11,659,215 | | | $ | 4,374,620 | | | $ | 3,625,326 | | | $ | (55,486) | | | $ | 85.04 | | | $ | 83.80 | | | $ | 779 | | | $ | 3,616 | |
|
|
|
|
|
| Company Selected Measure Name |
Adjusted Net Sales
|
|
|
|
|
| Named Executive Officers, Footnote |
Resmed has had one Principal Executive Officer or “PEO”, Mr. Michael Farrell, during fiscal years 2026, 2025, 2024, 2023, and 2022.Non-PEO NEOs included for the fiscal years 2026, 2025, 2024, 2023, and 2022 are reflected in the table below: | | | | | | | Fiscal Year | Non-PEO NEOs | | 2026 | Aaron Bloomer, Justin Leong, Michael Rider, Brett Sandercock | | 2025 | Bobby Ghoshal, Justin Leong, Michael Rider, Brett Sandercock | | 2024 | Bobby Ghoshal, Justin Leong, Michael Rider, Brett Sandercock | | 2023 | Lucile Blaise, Rob Douglas, Bobby Ghoshal, Brett Sandercock | | 2022 | Rob Douglas, Bobby Ghoshal, Jim Hollingshead, David Pendarvis, Brett Sandercock |
|
|
|
|
|
| Peer Group Issuers, Footnote |
We selected the Dow Jones (DJ) U.S. Select Medical Equipment index as our peer group for purposes of this disclosure. The index comprises 45 companies from the DJ U.S. Broad Stock Market Index classified in the DJICS Medical Equipment subsection and includes several companies from our compensation peer group. We are also including the DJ U.S. Medical Equipment Index from our 2025 proxy. The Company’s relative TSR PSUs use the S&P 500 index for their relative TSR performance measure. See the CD&A section titled “Long Term Incentives” in this Proxy Statement.
|
|
|
|
|
| PEO Total Compensation Amount |
$ 16,201,649
|
$ 14,674,543
|
$ 14,120,829
|
$ 13,868,641
|
$ 11,659,215
|
| PEO Actually Paid Compensation Amount |
$ (6,801,309)
|
29,631,927
|
10,329,790
|
16,867,038
|
4,374,620
|
| Adjustment To PEO Compensation, Footnote |
SEC rules require certain adjustments be made to the “Total” column as reported in the Summary Compensation Table to determine “Compensation Actually Paid” as reported in the Pay versus Performance Table (“PVP Table”). “Compensation Actually Paid” does not necessarily represent cash and/or equity value transferred to the applicable NEO without restriction, but rather is a value calculated under applicable SEC rules. The equity values are calculated in accordance with ASC Topic 718, with dividends being reflected in the fair value of the award. Valuation assumptions used to calculate fair values used a consistent process as done on the date of grant and were not materially different from those disclosed at the time of grant. The closing stock price of our common stock on June 30, 2021, June 30, 2022, June 30, 2023, June 28, 2024, June 30, 2025, and June 30, 2026 was $246.52, $209.63, $218.50, $191.42, $258.00, and $194.88 respectively. The following tables detail these adjustments for the PEO: | | | | | | | | | | | | | | | | | | | | | | | | | | | | | | | | | | PEO | | | | | | | | | | | | Prior FYE | 6/30/2021 | 6/30/2022 | 6/30/2023 | 6/30/2024 | 6/30/2025 | | Current FYE | 6/30/2022 | 6/30/2023 | 6/30/2024 | 6/30/2025 | 6/30/2026 | | Fiscal Year | 2022 | 2023 | 2024 | 2025 | 2026 | | Summary Compensation Table Total | | $ | 11,659,215 | | | $ | 13,868,641 | | | $ | 14,120,829 | | | $ | 14,674,543 | | | $ | 16,201,649 | | | - Grant Date Fair Value of Option Awards and Stock Awards Granted in Fiscal Year | | $ | (9,000,005) | | | $ | (10,999,975) | | | $ | (11,200,082) | | | $ | (11,700,066) | | | $ | (12,999,375) | | | + Fair Value at Fiscal Year-End of Outstanding and Unvested Option Awards and Stock Awards Granted in Fiscal Year | | $ | 6,170,624 | | | $ | 10,216,009 | | | $ | 15,633,403 | | | $ | 12,355,266 | | | $ | 7,237,345 | | | + Change in Fair Value of Outstanding and Unvested Option Awards and Stock Awards Granted in Prior Fiscal Years | | $ | (5,637,001) | | | $ | (1,315,735) | | | $ | (6,504,731) | | | $ | 12,832,494 | | | $ | (14,143,794) | | | + Fair Value at Vesting of Option Awards and Stock Awards Granted in Fiscal Year That Vested During Fiscal Year | | $ | — | | | $ | — | | | $ | — | | | $ | — | | | $ | — | | | + Change in Fair Value as of Vesting Date of Option Awards and Stock Awards Granted in Prior Fiscal Years For Which Applicable Vesting Conditions Were Satisfied During Fiscal Year | | $ | 1,181,787 | | | $ | 5,098,098 | | | $ | (1,719,629) | | | $ | 1,469,689 | | | $ | (3,097,134) | | | - Fair Value as of Prior Fiscal Year-End of Option Awards and Stock Awards Granted in Prior Fiscal Years That Failed to Meet Applicable Vesting Conditions During Fiscal Year | | $ | — | | | $ | — | | | $ | — | | | $ | — | | | $ | — | | | Total Adjustments | | $ | (7,284,595) | | | $ | 2,998,397 | | | $ | (3,791,039) | | | $ | 14,957,384 | | | $ | (23,002,958) | | | Compensation Actually Paid | | $ | 4,374,620 | | | $ | 16,867,038 | | | $ | 10,329,790 | | | $ | 29,631,927 | | | $ | (6,801,309) | |
|
|
|
|
|
| Non-PEO NEO Average Total Compensation Amount |
$ 3,576,611
|
3,356,257
|
3,129,017
|
4,147,542
|
3,625,326
|
| Non-PEO NEO Average Compensation Actually Paid Amount |
$ 961,618
|
5,832,409
|
2,578,989
|
4,909,275
|
(55,486)
|
| Adjustment to Non-PEO NEO Compensation Footnote |
As discussed in footnote 2, SEC rules require certain adjustments to be made to determine “compensation actually paid” as reported in the Pay versus Performance table above. The following table details these adjustments to the Average Summary Compensation Table Total for Non-PEO NEOs. | | | | | | | | | | | | | | | | | | | | | | | | | | | | | | | | | | Average of Non-PEO NEOs | | | | | | | | | | | | Prior FYE | 6/30/2021 | 6/30/2022 | 6/30/2023 | 6/30/2024 | 6/30/2025 | | Current FYE | 6/30/2022 | 6/30/2023 | 6/30/2024 | 6/30/2025 | 6/30/2026 | | Fiscal Year | 2022 | 2023 | 2024 | 2025 | 2026 | | Summary Compensation Table Total | | $ | 3,625,326 | | | $ | 4,147,542 | | | $ | 3,129,017 | | | $ | 3,356,257 | | | $ | 3,576,611 | | | - Grant Date Fair Value of Option Awards and Stock Awards Granted in Fiscal Year | | $ | (2,500,046) | | | $ | (2,821,097) | | | $ | (2,074,926) | | | $ | (2,250,039) | | | $ | (2,637,237) | | | + Fair Value at Fiscal Year-End of Outstanding and Unvested Option Awards and Stock Awards Granted in Fiscal Year | | $ | 1,328,777 | | | $ | 2,643,811 | | | $ | 2,725,662 | | | $ | 2,458,910 | | | $ | 2,062,029 | | | + Change in Fair Value of Outstanding and Unvested Option Awards and Stock Awards Granted in Prior Fiscal Years | | $ | (1,432,485) | | | $ | (346,310) | | | $ | (911,343) | | | $ | 2,059,298 | | | $ | (1,774,881) | | | + Fair Value at Vesting of Option Awards and Stock Awards Granted in Fiscal Year That Vested During Fiscal Year | | $ | — | | | $ | — | | | $ | — | | | $ | — | | | $ | — | | | + Change in Fair Value as of Vesting Date of Option Awards and Stock Awards Granted in Prior Fiscal Years For Which Applicable Vesting Conditions Were Satisfied During Fiscal Year | | $ | 390,289 | | | $ | 1,285,329 | | | $ | (289,421) | | | $ | 207,984 | | | $ | (264,904) | | | - Fair Value as of Prior Fiscal Year-End of Option Awards and Stock Awards Granted in Prior Fiscal Years That Failed to Meet Applicable Vesting Conditions During Fiscal Year | | $ | (1,467,347) | | | $ | — | | | $ | — | | | $ | — | | | $ | — | | | Total Adjustments | | $ | (3,680,812) | | | $ | 761,733 | | | $ | (550,028) | | | $ | 2,476,152 | | | $ | (2,614,993) | | | Compensation Actually Paid | | $ | (55,486) | | | $ | 4,909,275 | | | $ | 2,578,989 | | | $ | 5,832,409 | | | $ | 961,618 | |
|
|
|
|
|
| Compensation Actually Paid vs. Total Shareholder Return |
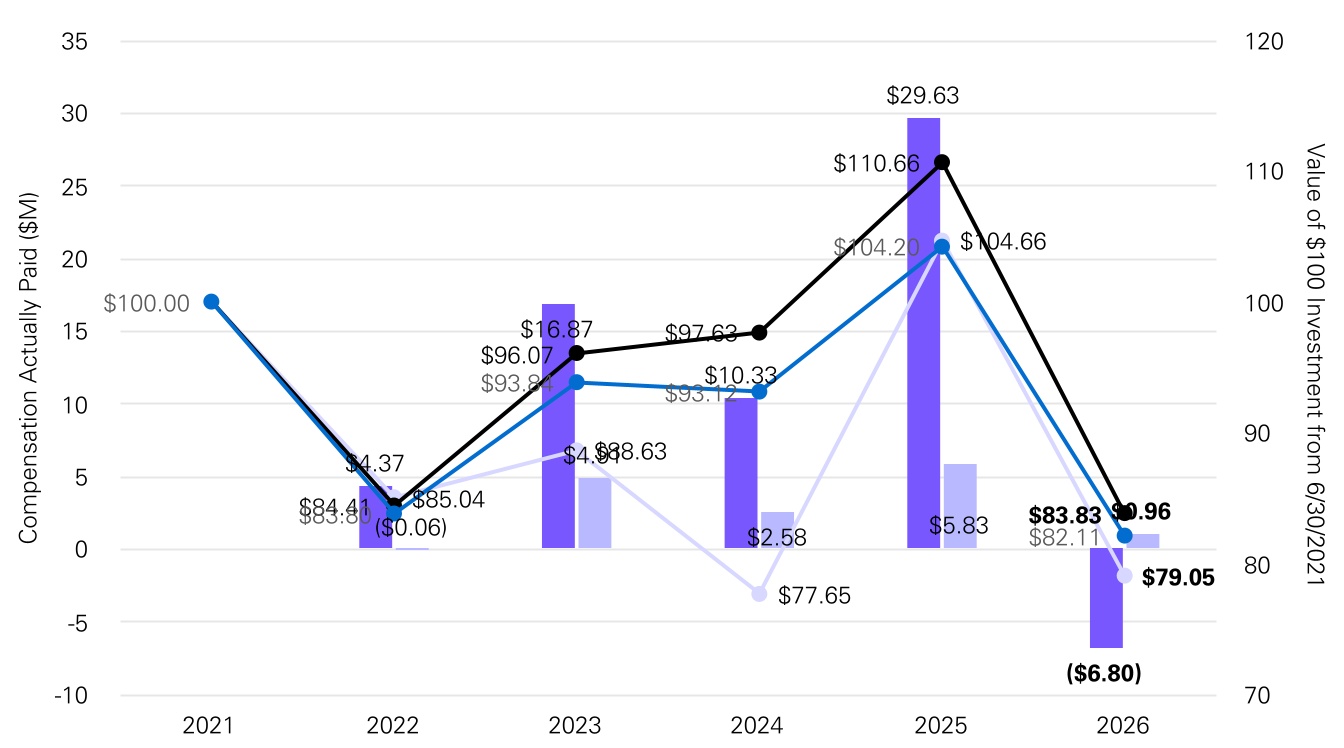
Compensation Actually Paid vs. Resmed & Peer Indices TSR | | | | | | | | | | | | | | | | | | | | | | | | n | PEO CAP ($M) | n | Average Non-PEO NEO CAP ($M) | | RMD TSR | | Dow Jones U.S. Medical Equipment Index TSR | | | | | | | | Dow Jones U.S. Select Medical Equipment Index TSR |
|
|
|
|
|
| Compensation Actually Paid vs. Net Income |
Compensation Actually Paid vs. RMD Net Income 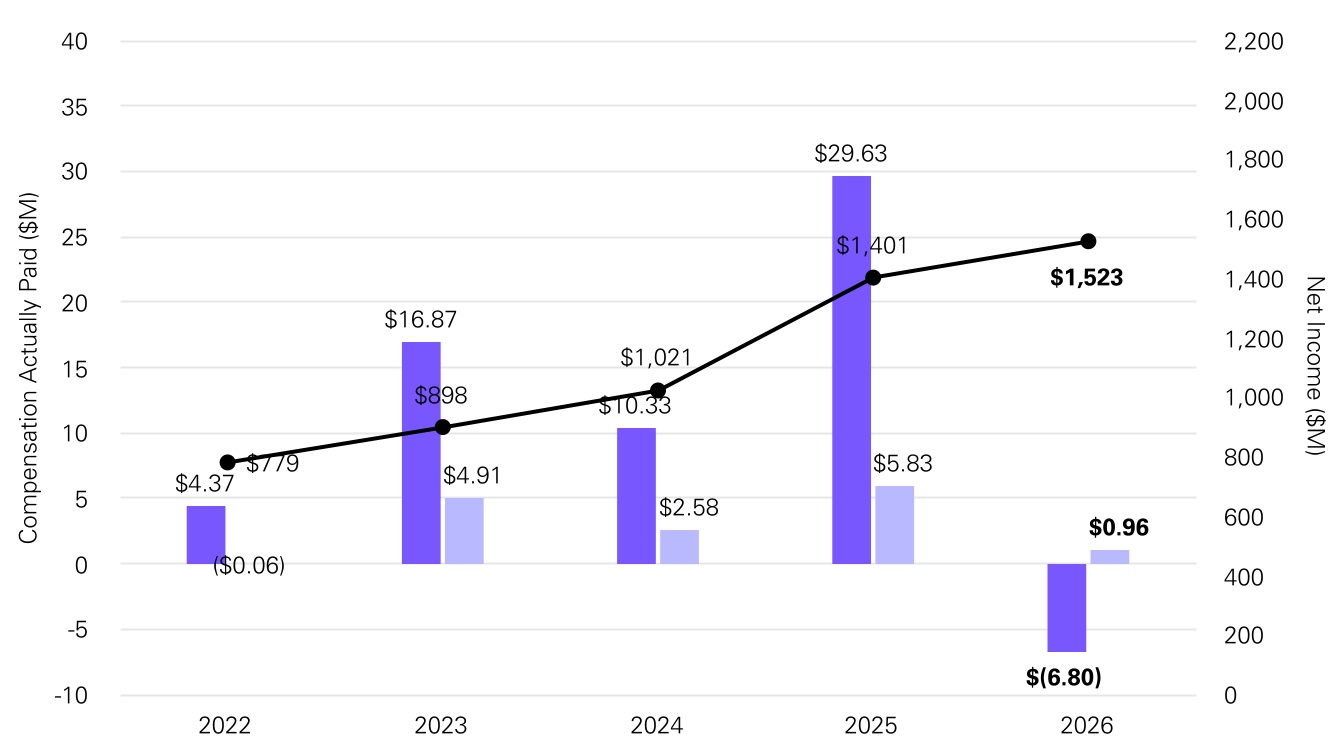 | | | | | | | | | | | | | | | | | | n | PEO CAP ($M) | n | Average Non-PEO NEO CAP ($M) | | Net Income($M) |
|
|
|
|
|
| Compensation Actually Paid vs. Company Selected Measure |
Compensation Actually Paid vs. Adjusted Net Sales 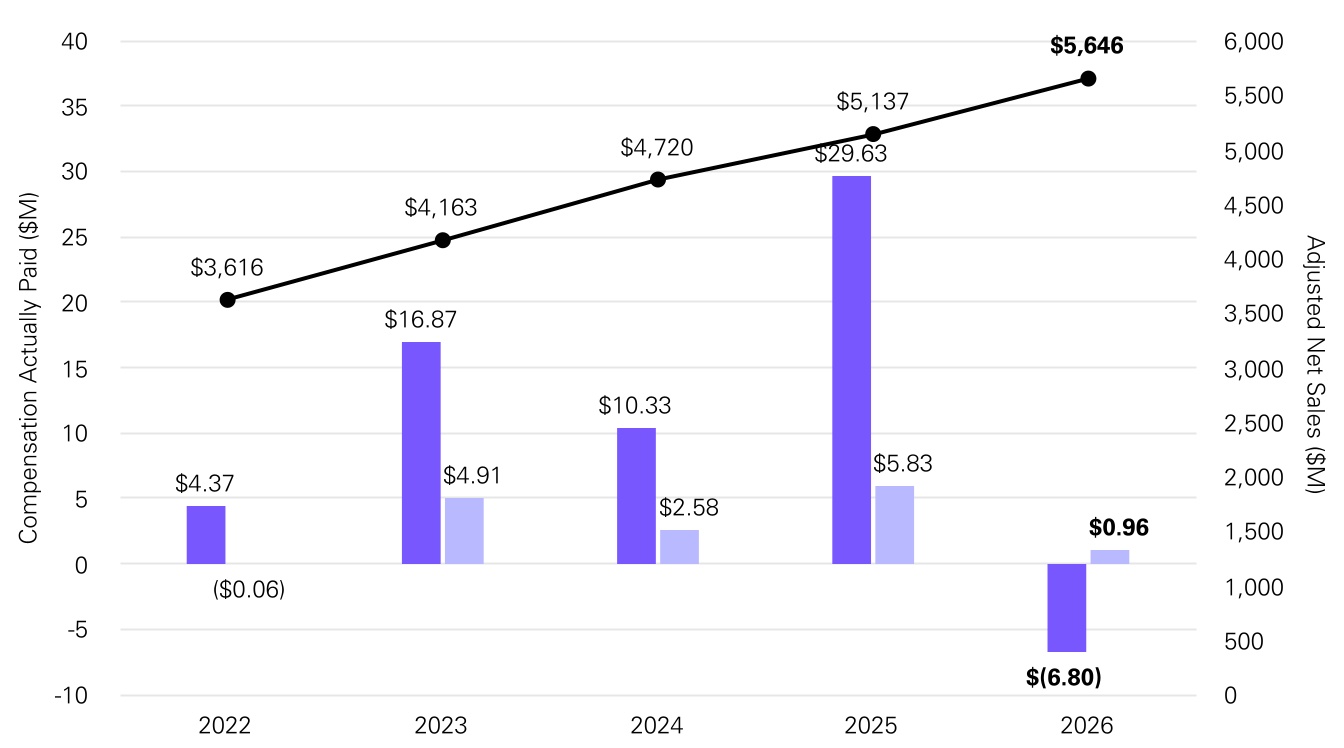 | | | | | | | | | | | | | | | | | | n | PEO CAP ($M) | n | Average Non-PEO NEO CAP ($M) | | Adjusted Net Sales ($M) |
|
|
|
|
|
| Total Shareholder Return Vs Peer Group |
Compensation Actually Paid vs. Resmed & Peer Indices TSR | | | | | | | | | | | | | | | | | | | | | | | | n | PEO CAP ($M) | n | Average Non-PEO NEO CAP ($M) | | RMD TSR | | Dow Jones U.S. Medical Equipment Index TSR | | | | | | | | Dow Jones U.S. Select Medical Equipment Index TSR |
|
|
|
|
|
| Tabular List, Table |
| | | | Financial Performance Measures | | Adjusted Net Sales | | Adjusted Net Operating Profit | | Total Shareholder Return (absolute TSR) | | Relative Total Shareholder Return (relative TSR) |
|
|
|
|
|
| Total Shareholder Return Amount |
$ 79.05
|
104.66
|
77.65
|
88.63
|
85.04
|
| Peer Group Total Shareholder Return Amount |
82.11
|
104.20
|
93.12
|
93.84
|
83.80
|
| Net Income (Loss) |
$ 1,523,000,000
|
$ 1,401,000,000
|
$ 1,021,000,000
|
$ 898,000,000
|
$ 779,000,000
|
| Company Selected Measure Amount |
5,646,000,000
|
5,137,000,000
|
4,720,000,000
|
4,163,000,000
|
3,616,000,000
|
| PEO Name |
Mr. Michael Farrell
|
Mr. Michael Farrell
|
Mr. Michael Farrell
|
Mr. Michael Farrell
|
Mr. Michael Farrell
|
| Additional 402(v) Disclosure |
Analysis of the Information Presented in the Pay versus Performance Table In this section, we provide a graphic analysis showing, for the past five years, the relationship between our PEO’s and the Average of the Non-PEO NEOs’ “Compensation Actually Paid” and (i) the Company’s Adjusted Net Sales, (ii) the Company’s Net Income and (iii) the Company’s TSR, the TSR of the Dow Jones U.S. Select Medical Equipment Index, one of the disclosed peer groups from our 10-K filing and the TSR of the Dow Jones U.S. Medical Equipment Index. For the year ended June 30, 2026, we have elected to use the Dow Jones U.S. Select Medical Equipment Index for our peer group comparison. We believe that the holdings of this index more accurately reflect our peer companies. Since the Dow Jones U.S. Medical Equipment Index was presented in the prior year, it has also been presented in the current year for comparison. The comparison assumes $100 was invested for the period starting June 30, 2021, through the end of the listed year in the company, the Dow Jones U.S. Medical Equipment Index and the Dow Jones U.S. Select Medical Equipment Industry, respectively. Historical stock performance is not necessarily indicative of the company's future stock performance. As described in more detail in the CD&A, our executive compensation program reflects a pay-for-performance philosophy that emphasizes long-term equity awards intended to align our executives’ interests with stockholders’ long-term interests. Thus, the value of these awards and, therefore, a large portion of the compensation actually paid to our NEOs is inherently correlated to the Company’s stock price over time. Please refer to the section entitled CD&A above for more information about our executive compensation program.
|
|
|
|
|
| Measure:: 1 |
|
|
|
|
|
| Pay vs Performance Disclosure |
|
|
|
|
|
| Name |
Adjusted Net Sales
|
|
|
|
|
| Non-GAAP Measure Description |
Adjusted Net Sales represents the most important financial performance measure (that is not otherwise required to be disclosed in the table) used by the Company to link compensation actually paid to our NEOs, including our Chief Executive Officer, for the most recently completed fiscal year to the Company’s performance. 50% of cash incentive opportunity for our NEOs is based on our Adjusted Net Sales performance. Adjusted Net Sales is a non-GAAP measure and is calculated as net sales on a GAAP basis excluding the impact of revenue from acquisitions completed after the establishment of the internal financial plan, as applicable, and foreign currency fluctuations. For a reconciliation of Adjusted Net Sales to the most directly comparable GAAP financial measure and insight into how Adjusted Net Sales is considered by management, please see Page 61 under “Elements of Compensation - Annual Cash Incentive Plan - Incentive Plan Adjustments.”
|
|
|
|
|
| Measure:: 2 |
|
|
|
|
|
| Pay vs Performance Disclosure |
|
|
|
|
|
| Name |
Adjusted Net Operating Profit
|
|
|
|
|
| Measure:: 3 |
|
|
|
|
|
| Pay vs Performance Disclosure |
|
|
|
|
|
| Name |
Total Shareholder Return (absolute TSR)
|
|
|
|
|
| Measure:: 4 |
|
|
|
|
|
| Pay vs Performance Disclosure |
|
|
|
|
|
| Name |
Relative Total Shareholder Return (relative TSR)
|
|
|
|
|
| PEO |
|
|
|
|
|
| Pay vs Performance Disclosure |
|
|
|
|
|
| Adjustment to Compensation, Amount |
$ (23,002,958)
|
$ 14,957,384
|
$ (3,791,039)
|
$ 2,998,397
|
$ (7,284,595)
|
| PEO | Aggregate Grant Date Fair Value of Equity Award Amounts Reported in Summary Compensation Table |
|
|
|
|
|
| Pay vs Performance Disclosure |
|
|
|
|
|
| Adjustment to Compensation, Amount |
(12,999,375)
|
(11,700,066)
|
(11,200,082)
|
(10,999,975)
|
(9,000,005)
|
| PEO | Year-end Fair Value of Equity Awards Granted in Covered Year that are Outstanding and Unvested |
|
|
|
|
|
| Pay vs Performance Disclosure |
|
|
|
|
|
| Adjustment to Compensation, Amount |
7,237,345
|
12,355,266
|
15,633,403
|
10,216,009
|
6,170,624
|
| PEO | Year-over-Year Change in Fair Value of Equity Awards Granted in Prior Years That are Outstanding and Unvested |
|
|
|
|
|
| Pay vs Performance Disclosure |
|
|
|
|
|
| Adjustment to Compensation, Amount |
(14,143,794)
|
12,832,494
|
(6,504,731)
|
(1,315,735)
|
(5,637,001)
|
| PEO | Vesting Date Fair Value of Equity Awards Granted and Vested in Covered Year |
|
|
|
|
|
| Pay vs Performance Disclosure |
|
|
|
|
|
| Adjustment to Compensation, Amount |
0
|
0
|
0
|
0
|
0
|
| PEO | Change in Fair Value as of Vesting Date of Prior Year Equity Awards Vested in Covered Year |
|
|
|
|
|
| Pay vs Performance Disclosure |
|
|
|
|
|
| Adjustment to Compensation, Amount |
(3,097,134)
|
1,469,689
|
(1,719,629)
|
5,098,098
|
1,181,787
|
| PEO | Prior Year End Fair Value of Equity Awards Granted in Any Prior Year that Fail to Meet Applicable Vesting Conditions During Covered Year |
|
|
|
|
|
| Pay vs Performance Disclosure |
|
|
|
|
|
| Adjustment to Compensation, Amount |
0
|
0
|
0
|
0
|
0
|
| Non-PEO NEO |
|
|
|
|
|
| Pay vs Performance Disclosure |
|
|
|
|
|
| Adjustment to Compensation, Amount |
(2,614,993)
|
2,476,152
|
(550,028)
|
761,733
|
(3,680,812)
|
| Non-PEO NEO | Aggregate Grant Date Fair Value of Equity Award Amounts Reported in Summary Compensation Table |
|
|
|
|
|
| Pay vs Performance Disclosure |
|
|
|
|
|
| Adjustment to Compensation, Amount |
(2,637,237)
|
(2,250,039)
|
(2,074,926)
|
(2,821,097)
|
(2,500,046)
|
| Non-PEO NEO | Year-end Fair Value of Equity Awards Granted in Covered Year that are Outstanding and Unvested |
|
|
|
|
|
| Pay vs Performance Disclosure |
|
|
|
|
|
| Adjustment to Compensation, Amount |
2,062,029
|
2,458,910
|
2,725,662
|
2,643,811
|
1,328,777
|
| Non-PEO NEO | Year-over-Year Change in Fair Value of Equity Awards Granted in Prior Years That are Outstanding and Unvested |
|
|
|
|
|
| Pay vs Performance Disclosure |
|
|
|
|
|
| Adjustment to Compensation, Amount |
(1,774,881)
|
2,059,298
|
(911,343)
|
(346,310)
|
(1,432,485)
|
| Non-PEO NEO | Vesting Date Fair Value of Equity Awards Granted and Vested in Covered Year |
|
|
|
|
|
| Pay vs Performance Disclosure |
|
|
|
|
|
| Adjustment to Compensation, Amount |
0
|
0
|
0
|
0
|
0
|
| Non-PEO NEO | Change in Fair Value as of Vesting Date of Prior Year Equity Awards Vested in Covered Year |
|
|
|
|
|
| Pay vs Performance Disclosure |
|
|
|
|
|
| Adjustment to Compensation, Amount |
(264,904)
|
207,984
|
(289,421)
|
1,285,329
|
390,289
|
| Non-PEO NEO | Prior Year End Fair Value of Equity Awards Granted in Any Prior Year that Fail to Meet Applicable Vesting Conditions During Covered Year |
|
|
|
|
|
| Pay vs Performance Disclosure |
|
|
|
|
|
| Adjustment to Compensation, Amount |
$ 0
|
$ 0
|
$ 0
|
$ 0
|
$ (1,467,347)
|