Pay Versus Performance
As required by Item 402(v) of Regulation S-K, we are providing the following information about the relationship between executive compensation deemed to be "actually paid" (as that term is used in Item 402(v)) and certain key metrics relating to Gold.com's financial performance. For further information concerning how our executive compensation program is structured and how we align executive compensation with Gold.com's performance, please see the section “Compensation Discussion and Analysis” above.
|
|
|
|
|
|
|
|
|
|
|
|
|
|
|
Value of initial fixed $100 investment from |
|
|
|
|
|
|
|
|||||||||||
|
Fiscal |
|
Summary compensation table total for CEO $ |
|
|
Compensation actually paid to CEO $ |
|
|
Average summary compensation table total for other NEOs $ |
|
|
Average compensation |
|
|
Gold.com total |
|
|
Peer group total stockholder return $ |
|
|
Net Income attributable to Gold.com |
|
|
Pre-tax profits |
|
||||||||
|
2026 |
|
|
2,087,219 |
|
|
|
4,584,053 |
|
|
|
958,886 |
|
|
|
1,257,045 |
|
|
|
216.17 |
|
|
|
154.18 |
|
|
|
82,341 |
|
|
|
109,522 |
|
|
2025 |
|
|
1,287,246 |
|
|
|
(909,765 |
) |
|
|
809,033 |
|
|
|
787,334 |
|
|
|
112.37 |
|
|
|
130.45 |
|
|
|
17,320 |
|
|
|
21,270 |
|
|
2024 |
|
|
6,988,581 |
|
|
|
4,568,494 |
|
|
|
618,057 |
|
|
|
590,917 |
|
|
|
159.76 |
|
|
|
70.41 |
|
|
|
68,546 |
|
|
|
82,778 |
|
|
2023 |
|
|
1,451,081 |
|
|
|
1,809,983 |
|
|
|
974,708 |
|
|
|
1,216,967 |
|
|
|
175.42 |
|
|
|
44.29 |
|
|
|
156,360 |
|
|
|
203,170 |
|
|
2022 |
|
|
1,661,309 |
|
|
|
4,550,182 |
|
|
|
1,152,770 |
|
|
|
1,691,984 |
|
|
|
143.54 |
|
|
|
35.88 |
|
|
|
132,536 |
|
|
|
166,417 |
|
The Principal Executive Officer (‘‘CEO’’) and other NEOs for the applicable fiscal years were as follows:
2026: Mr. Roberts served as our CEO, and Mr. Gjerdrum, Mr. Aquilino, Ms. Meltzer and Mr. Dickson served as our other NEOs.
2025 and 2024: Mr. Roberts served as our CEO, and Mr. Gjerdrum, Mr. Aquilino, Ms. Simpson-Taylor and Ms. Meltzer served as our other NEOs.
2023 and 2022: Mr. Roberts served as our CEO and Messrs. Gjerdrum, Wittmeyer, Aquilino and Ms. Simpson-Taylor served as our other NEOs.
The companies listed below are the peer companies included in the table above, in the indicated lines of business. The same companies constituted our peer companies for fiscal 2026, 2025, 2024 and 2023:
Alternative Brokerage Firms |
|
Alternative Financial Services |
|
E-Commerce |
BGC Group, Inc. (BGC) |
|
Enova International, Inc. (ENVA) |
|
Carvana Co. (CVNA) |
IG Group Holdings plc (IGG.L) |
|
EZCORP, Inc. (EZPW) |
|
Stitch Fix, Inc. (SFIX) |
StoneX Group Inc. (SNEX) |
|
FirstCash Holdings, Inc. (FCFS) |
|
The Lovesac Company (LOVE) |
Swissquote Group Holding Ltd (SQN.SW) |
|
Regional Management Corp. (RM) |
|
Liquidity Services, Inc. (LQDT) |
B. Riley Financial, Inc. (RILY) |
|
World Acceptance Corporation (WRLD) |
|
Beyond, Inc. (BBBY) |
Oppenheimer Holdings Inc. (OPY) |
|
GreenDot Corporation (GDOT) |
|
PC Connection, Inc. (CNXN) |
The Summary Compensation Table totals reported for our CEO for fiscal 2022 - 2026 and those amounts for the other NEOs reflected in the table above were subject to the following adjustments per Item 402(v)(2)(iii) of Regulation S-K to calculate “compensation actually paid”:
|
2026 |
|
|
2025 |
|
|
2024 |
|
|
2023 |
|
|
|
|
|
2022 |
|
|
||||||||||||||||||||||
|
CEO |
|
|
Average for |
|
|
CEO |
|
|
Average for |
|
|
CEO |
|
|
Average for |
|
|
CEO |
|
|
Average for |
|
|
CEO |
|
|
Average for |
|
|
||||||||||
Summary Compensation Table Total |
|
2,087,219 |
|
|
|
958,886 |
|
|
|
1,287,246 |
|
|
|
809,033 |
|
|
|
6,988,581 |
|
|
|
618,057 |
|
|
|
1,451,081 |
|
|
|
974,708 |
|
|
|
1,661,309 |
|
|
|
1,152,770 |
|
|
Adjustments: |
|
|
|
|
|
|
|
|
|
|
|
|
|
|
|
|
|
|
|
|
|
|
|
|
|
|
|
|
|
|
||||||||||
Deduction for amount reported under the “Stock Awards” and “Option Awards” Columns of the Summary Compensation Table |
|
— |
|
|
|
(11,764 |
) |
|
|
— |
|
|
|
(269,273 |
) |
|
|
(5,652,036 |
) |
|
|
— |
|
|
|
— |
|
|
|
(41,402 |
) |
|
|
(212,476 |
) |
|
|
(266,906 |
) |
|
Increase - year-end fair value of equity awards granted during year that remain unvested at year end (1) |
|
— |
|
|
|
15,754 |
|
|
|
— |
|
|
|
275,992 |
|
|
|
3,231,949 |
|
|
|
— |
|
|
|
— |
|
|
|
36,395 |
|
|
|
— |
|
|
|
232,780 |
|
|
Increase - vest-date fair value of equity awards granted during year that vested during year |
|
— |
|
|
|
— |
|
|
|
— |
|
|
|
— |
|
|
|
— |
|
|
|
— |
|
|
|
— |
|
|
|
— |
|
|
|
212,476 |
|
|
|
42,498 |
|
|
Increase/deduct - Change in fair value of all equity awards unvested at prior year end and at year end (year-end fair value minus prior-year-end fair value) |
|
2,496,834 |
|
|
|
181,552 |
|
|
|
(2,197,011 |
) |
|
|
— |
|
|
|
— |
|
|
|
(18,077 |
) |
|
|
— |
|
|
|
186,979 |
|
|
|
1,432,515 |
|
|
|
418,359 |
|
|
Increase/deduct - Change in fair value of all equity awards unvested at prior year end that vested during year (vest date fair value minus prior-year-end fair value) |
|
— |
|
|
|
112,617 |
|
|
|
— |
|
|
|
(28,418 |
) |
|
|
— |
|
|
|
(17,725 |
) |
|
|
358,902 |
|
|
|
48,738 |
|
|
|
1,456,358 |
|
|
|
112,483 |
|
|
Deduct - Fair value of equity awards unvested at prior year end but forfeited during year (deduct fair value at prior year end) |
|
— |
|
|
|
— |
|
|
|
— |
|
|
|
— |
|
|
|
— |
|
|
|
|
|
|
— |
|
|
|
— |
|
|
|
— |
|
|
|
— |
|
|
|
Increase - dividends paid on restricted stock and dividend equivalents accrued on unvested equity awards during the year (not otherwise counted in the Summary Compensation Table or year-end or vest-date fair value of equity awards) |
|
— |
|
|
|
— |
|
|
|
— |
|
|
|
— |
|
|
|
— |
|
|
|
8,662 |
|
|
|
— |
|
|
|
11,549 |
|
|
|
— |
|
|
|
— |
|
|
Total adjustments: |
|
2,496,834 |
|
|
|
298,159 |
|
|
|
(2,197,011 |
) |
|
|
(21,699 |
) |
|
|
(2,420,087 |
) |
|
|
(27,140 |
) |
|
|
358,902 |
|
|
|
242,259 |
|
|
|
2,888,873 |
|
|
|
539,214 |
|
|
Compensation actually paid |
|
4,584,053 |
|
|
|
1,257,045 |
|
|
|
(909,765 |
) |
|
|
787,334 |
|
|
|
4,568,494 |
|
|
|
590,917 |
|
|
|
1,809,983 |
|
|
|
1,216,967 |
|
|
|
4,550,182 |
|
|
|
1,691,984 |
|
|
The Principal Executive Officer (‘‘CEO’’) and other NEOs for the applicable fiscal years were as follows:
2026: Mr. Roberts served as our CEO, and Mr. Gjerdrum, Mr. Aquilino, Ms. Meltzer and Mr. Dickson served as our other NEOs.
2025 and 2024: Mr. Roberts served as our CEO, and Mr. Gjerdrum, Mr. Aquilino, Ms. Simpson-Taylor and Ms. Meltzer served as our other NEOs.
2023 and 2022: Mr. Roberts served as our CEO and Messrs. Gjerdrum, Wittmeyer, Aquilino and Ms. Simpson-Taylor served as our other NEOs.
The companies listed below are the peer companies included in the table above, in the indicated lines of business. The same companies constituted our peer companies for fiscal 2026, 2025, 2024 and 2023:
Alternative Brokerage Firms |
|
Alternative Financial Services |
|
E-Commerce |
BGC Group, Inc. (BGC) |
|
Enova International, Inc. (ENVA) |
|
Carvana Co. (CVNA) |
IG Group Holdings plc (IGG.L) |
|
EZCORP, Inc. (EZPW) |
|
Stitch Fix, Inc. (SFIX) |
StoneX Group Inc. (SNEX) |
|
FirstCash Holdings, Inc. (FCFS) |
|
The Lovesac Company (LOVE) |
Swissquote Group Holding Ltd (SQN.SW) |
|
Regional Management Corp. (RM) |
|
Liquidity Services, Inc. (LQDT) |
B. Riley Financial, Inc. (RILY) |
|
World Acceptance Corporation (WRLD) |
|
Beyond, Inc. (BBBY) |
Oppenheimer Holdings Inc. (OPY) |
|
GreenDot Corporation (GDOT) |
|
PC Connection, Inc. (CNXN) |
The Summary Compensation Table totals reported for our CEO for fiscal 2022 - 2026 and those amounts for the other NEOs reflected in the table above were subject to the following adjustments per Item 402(v)(2)(iii) of Regulation S-K to calculate “compensation actually paid”:
|
2026 |
|
|
2025 |
|
|
2024 |
|
|
2023 |
|
|
|
|
|
2022 |
|
|
||||||||||||||||||||||
|
CEO |
|
|
Average for |
|
|
CEO |
|
|
Average for |
|
|
CEO |
|
|
Average for |
|
|
CEO |
|
|
Average for |
|
|
CEO |
|
|
Average for |
|
|
||||||||||
Summary Compensation Table Total |
|
2,087,219 |
|
|
|
958,886 |
|
|
|
1,287,246 |
|
|
|
809,033 |
|
|
|
6,988,581 |
|
|
|
618,057 |
|
|
|
1,451,081 |
|
|
|
974,708 |
|
|
|
1,661,309 |
|
|
|
1,152,770 |
|
|
Adjustments: |
|
|
|
|
|
|
|
|
|
|
|
|
|
|
|
|
|
|
|
|
|
|
|
|
|
|
|
|
|
|
||||||||||
Deduction for amount reported under the “Stock Awards” and “Option Awards” Columns of the Summary Compensation Table |
|
— |
|
|
|
(11,764 |
) |
|
|
— |
|
|
|
(269,273 |
) |
|
|
(5,652,036 |
) |
|
|
— |
|
|
|
— |
|
|
|
(41,402 |
) |
|
|
(212,476 |
) |
|
|
(266,906 |
) |
|
Increase - year-end fair value of equity awards granted during year that remain unvested at year end (1) |
|
— |
|
|
|
15,754 |
|
|
|
— |
|
|
|
275,992 |
|
|
|
3,231,949 |
|
|
|
— |
|
|
|
— |
|
|
|
36,395 |
|
|
|
— |
|
|
|
232,780 |
|
|
Increase - vest-date fair value of equity awards granted during year that vested during year |
|
— |
|
|
|
— |
|
|
|
— |
|
|
|
— |
|
|
|
— |
|
|
|
— |
|
|
|
— |
|
|
|
— |
|
|
|
212,476 |
|
|
|
42,498 |
|
|
Increase/deduct - Change in fair value of all equity awards unvested at prior year end and at year end (year-end fair value minus prior-year-end fair value) |
|
2,496,834 |
|
|
|
181,552 |
|
|
|
(2,197,011 |
) |
|
|
— |
|
|
|
— |
|
|
|
(18,077 |
) |
|
|
— |
|
|
|
186,979 |
|
|
|
1,432,515 |
|
|
|
418,359 |
|
|
Increase/deduct - Change in fair value of all equity awards unvested at prior year end that vested during year (vest date fair value minus prior-year-end fair value) |
|
— |
|
|
|
112,617 |
|
|
|
— |
|
|
|
(28,418 |
) |
|
|
— |
|
|
|
(17,725 |
) |
|
|
358,902 |
|
|
|
48,738 |
|
|
|
1,456,358 |
|
|
|
112,483 |
|
|
Deduct - Fair value of equity awards unvested at prior year end but forfeited during year (deduct fair value at prior year end) |
|
— |
|
|
|
— |
|
|
|
— |
|
|
|
— |
|
|
|
— |
|
|
|
|
|
|
— |
|
|
|
— |
|
|
|
— |
|
|
|
— |
|
|
|
Increase - dividends paid on restricted stock and dividend equivalents accrued on unvested equity awards during the year (not otherwise counted in the Summary Compensation Table or year-end or vest-date fair value of equity awards) |
|
— |
|
|
|
— |
|
|
|
— |
|
|
|
— |
|
|
|
— |
|
|
|
8,662 |
|
|
|
— |
|
|
|
11,549 |
|
|
|
— |
|
|
|
— |
|
|
Total adjustments: |
|
2,496,834 |
|
|
|
298,159 |
|
|
|
(2,197,011 |
) |
|
|
(21,699 |
) |
|
|
(2,420,087 |
) |
|
|
(27,140 |
) |
|
|
358,902 |
|
|
|
242,259 |
|
|
|
2,888,873 |
|
|
|
539,214 |
|
|
Compensation actually paid |
|
4,584,053 |
|
|
|
1,257,045 |
|
|
|
(909,765 |
) |
|
|
787,334 |
|
|
|
4,568,494 |
|
|
|
590,917 |
|
|
|
1,809,983 |
|
|
|
1,216,967 |
|
|
|
4,550,182 |
|
|
|
1,691,984 |
|
|
|
2026 |
|
|
2025 |
|
|
2024 |
|
|
2023 |
|
|
|
|
|
2022 |
|
|
||||||||||||||||||||||
|
CEO |
|
|
Average for |
|
|
CEO |
|
|
Average for |
|
|
CEO |
|
|
Average for |
|
|
CEO |
|
|
Average for |
|
|
CEO |
|
|
Average for |
|
|
||||||||||
Summary Compensation Table Total |
|
2,087,219 |
|
|
|
958,886 |
|
|
|
1,287,246 |
|
|
|
809,033 |
|
|
|
6,988,581 |
|
|
|
618,057 |
|
|
|
1,451,081 |
|
|
|
974,708 |
|
|
|
1,661,309 |
|
|
|
1,152,770 |
|
|
Adjustments: |
|
|
|
|
|
|
|
|
|
|
|
|
|
|
|
|
|
|
|
|
|
|
|
|
|
|
|
|
|
|
||||||||||
Deduction for amount reported under the “Stock Awards” and “Option Awards” Columns of the Summary Compensation Table |
|
— |
|
|
|
(11,764 |
) |
|
|
— |
|
|
|
(269,273 |
) |
|
|
(5,652,036 |
) |
|
|
— |
|
|
|
— |
|
|
|
(41,402 |
) |
|
|
(212,476 |
) |
|
|
(266,906 |
) |
|
Increase - year-end fair value of equity awards granted during year that remain unvested at year end (1) |
|
— |
|
|
|
15,754 |
|
|
|
— |
|
|
|
275,992 |
|
|
|
3,231,949 |
|
|
|
— |
|
|
|
— |
|
|
|
36,395 |
|
|
|
— |
|
|
|
232,780 |
|
|
Increase - vest-date fair value of equity awards granted during year that vested during year |
|
— |
|
|
|
— |
|
|
|
— |
|
|
|
— |
|
|
|
— |
|
|
|
— |
|
|
|
— |
|
|
|
— |
|
|
|
212,476 |
|
|
|
42,498 |
|
|
Increase/deduct - Change in fair value of all equity awards unvested at prior year end and at year end (year-end fair value minus prior-year-end fair value) |
|
2,496,834 |
|
|
|
181,552 |
|
|
|
(2,197,011 |
) |
|
|
— |
|
|
|
— |
|
|
|
(18,077 |
) |
|
|
— |
|
|
|
186,979 |
|
|
|
1,432,515 |
|
|
|
418,359 |
|
|
Increase/deduct - Change in fair value of all equity awards unvested at prior year end that vested during year (vest date fair value minus prior-year-end fair value) |
|
— |
|
|
|
112,617 |
|
|
|
— |
|
|
|
(28,418 |
) |
|
|
— |
|
|
|
(17,725 |
) |
|
|
358,902 |
|
|
|
48,738 |
|
|
|
1,456,358 |
|
|
|
112,483 |
|
|
Deduct - Fair value of equity awards unvested at prior year end but forfeited during year (deduct fair value at prior year end) |
|
— |
|
|
|
— |
|
|
|
— |
|
|
|
— |
|
|
|
— |
|
|
|
|
|
|
— |
|
|
|
— |
|
|
|
— |
|
|
|
— |
|
|
|
Increase - dividends paid on restricted stock and dividend equivalents accrued on unvested equity awards during the year (not otherwise counted in the Summary Compensation Table or year-end or vest-date fair value of equity awards) |
|
— |
|
|
|
— |
|
|
|
— |
|
|
|
— |
|
|
|
— |
|
|
|
8,662 |
|
|
|
— |
|
|
|
11,549 |
|
|
|
— |
|
|
|
— |
|
|
Total adjustments: |
|
2,496,834 |
|
|
|
298,159 |
|
|
|
(2,197,011 |
) |
|
|
(21,699 |
) |
|
|
(2,420,087 |
) |
|
|
(27,140 |
) |
|
|
358,902 |
|
|
|
242,259 |
|
|
|
2,888,873 |
|
|
|
539,214 |
|
|
Compensation actually paid |
|
4,584,053 |
|
|
|
1,257,045 |
|
|
|
(909,765 |
) |
|
|
787,334 |
|
|
|
4,568,494 |
|
|
|
590,917 |
|
|
|
1,809,983 |
|
|
|
1,216,967 |
|
|
|
4,550,182 |
|
|
|
1,691,984 |
|
|
The chart below shows graphically, for the period of fiscal 2022 - 2026, the total stockholder return of an investment of $100 on June 30, 2021 in Gold.com common stock, as compared to the performance of an equal investment in the peer company group identified above. The chart also shows the "compensation actually paid" in each of the five fiscal years in that period.
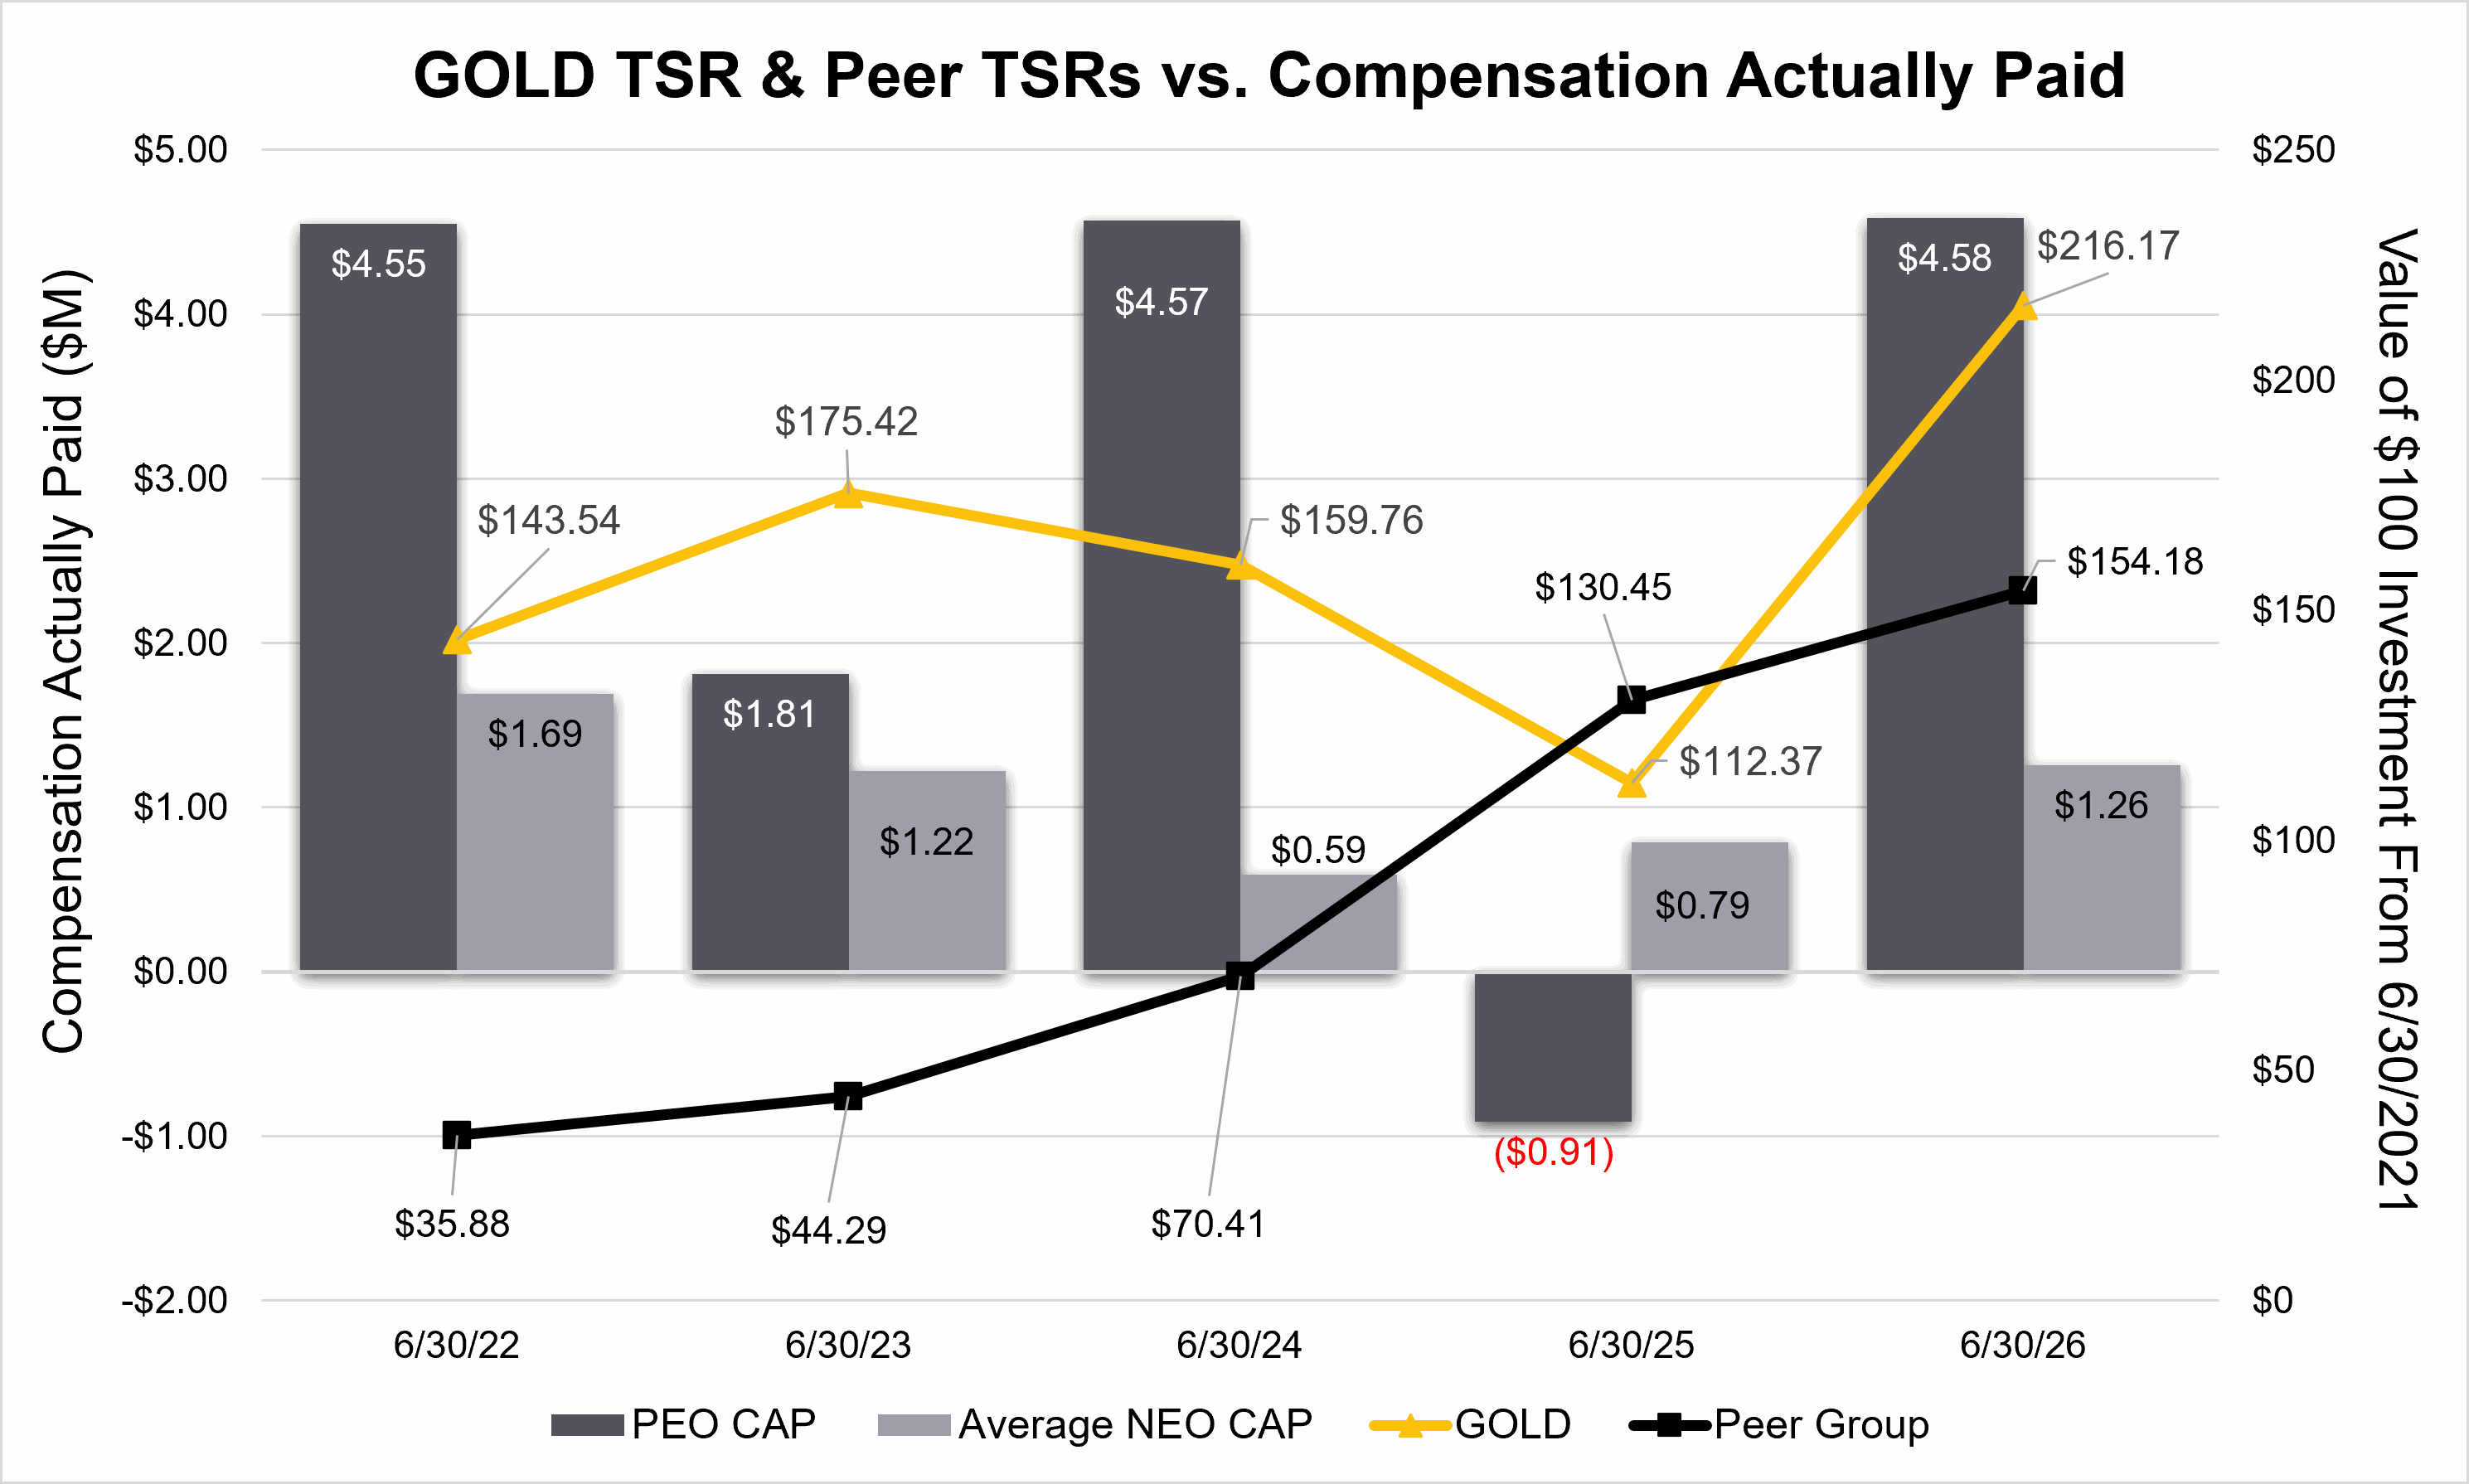
Gold.com's total stockholder return on an investment of $100 at June 30, 2021, has been substantial: 44% in 2022, 75% in the two-year period of fiscal 2022 and 2023, 60% in the three-year period of fiscal 2022 - 2024, 12% in the four-year period fiscal 2022 - 2025 and 116% in the five-year period of fiscal 2022-2026. Year-over-year results also were positive in fiscal 2023 (22%) but negative in fiscal 2024 (-9%) and fiscal 2025 (-29.7%), but bounced back vigorously in fiscal 2026 (92%).
In four of the five years since June 30, 2021, our total stockholder returns have exceeded the total stockholder returns of our peer group. Peer group returns were negative 64% in our fiscal 2022, negative 56% in the comparable two-year period of fiscal 2022 and 2023, negative 30% in the three-year period of fiscal 2022 - 2024, plus 30% in the four-year period of fiscal 2022 - 2025 and 54% in the five-year period of fiscal 2022 - 2026.
The "compensation actually paid" to our CEO, as shown above, was generally aligned with Gold.com's performance in fiscal 2022 - 2026. In the period 2022 - 2023, in line with Gold.com's exceptional performance, our CEO was paid annual bonuses at maximum pre-set levels, together with a discretionary bonus payout in fiscal 2022. A larger portion of the CEO's "compensation actually paid" in fiscal 2022 resulted from increases in the fair value of his stock options that remained unvested at any time in the fiscal year. Note that "compensation actually paid," as defined in SEC rules, includes year-over-year changes in the fair value of unvested stock options, which treats those values as "actually paid" even though the executive has not exercised and, until the final vesting date, cannot exercise the options that are factored into the "compensation actually paid."
In fiscal 2024, "compensation actually paid" to the CEO reflected the increased compensation levels under his then new employment agreement. The CEO's salary had not been increased in the five fiscal years prior to fiscal 2024. The CEO received no fiscal 2024 annual bonus, based on pre-tax profits performance in accordance with the terms of his employment agreement. The CEO was granted a cash-incentive award reflected as compensation in fiscal 2024; the award was intended as an incentive for four fiscal years of service, but under the SEC's "compensation actually paid" methodology initially results in a large increase in "compensation actually paid" in fiscal 2024.
The cash incentive award granted in fiscal 2024 will provide value to the CEO only if he achieves robust total stockholder return (from a base share value of $36.32) in the period of fiscal 2024 through fiscal 2027. He has been granted no other equity award in the three fiscal years completed since that award was granted. The fair value of this four-year incentive award is closely aligned with stock price and total stockholder return. However, the award reduces the payout by the amount of bonuses paid to the CEO in the four-year performance period, so it will result in a payout only if very substantial total stockholder returns are achieved by the end of fiscal 2027.
In fiscal 2025, "compensation actually paid" to the CEO was negative $909,765, which was both a result of and fully aligned with the negative total stockholder return for the year. The negative "compensation actually paid" resulted from a substantial decline in the fair value of the four-year cash incentive award. No equity award was granted to the CEO in fiscal 2025. No bonus was awarded based on profits in fiscal 2025; a discretionary bonus was awarded equal to 20% of the CEO's salary, in recognition of Gold.com's growth by completion of three significant acquisitions during fiscal 2025.
In fiscal 2026, our stock price rose 88% from fiscal 2025 and total stockholder return was 92%. As a result, the fair value of the CEO's four-year incentive award increased by approximately $2.5 million (267%) year-over-year, constituting more than half of "compensation actually paid" for the year.
Growth in the stock price represented the major portion of total stockholder return in fiscal 2022, 2023 and 2026 (dividends represent the remaining portion of total stockholder return), and the fair values of unvested stock options and the four-year cash incentive award have been closely aligned with both positive and negative changes in stock price. However, the CEO did not receive further grants of stock options after November 2019. As a result, his "compensation actually paid," although generally aligned with the favorable total stockholder returns in fiscal 2022 and fiscal 2023, in fact declined in those years due to the vesting of a portion of his stock options before the beginning of fiscal 2022 and 2023 (only unvested stock options are factored into the SEC's metric of "compensation actually paid"). The portion of the CEO's "compensation actually paid" attributable to stock options was 68% in 2022, 20% in 2023 and 0% in 2026.
For the other NEOs in the above table, equity grants during fiscal 2022 - 2023 tended to offset the vesting of equity awards granted before fiscal 2022, so that the "compensation actually paid" level averaged for the other NEOs remained relatively consistent in fiscal 2022 and 2023, except that the pay level for fiscal 2022 was higher mainly due to one equity award held by an executive who first became an NEO in that fiscal year. The other NEOs received no equity grants in fiscal 2024, held few remaining unvested equity awards and received annual incentive awards lower than in fiscal 2023, resulting in "compensation actually paid" that was aligned with fiscal 2024 total stockholder return.
In fiscal 2025, the average "compensation actually paid" to the other NEOs was boosted by equity awards granted to two NEOs at the time of renewal of their employment agreements. In fiscal 2026, only one of the NEOs received an equity award grant. Gold.com does not routinely grant equity awards as a component of annual compensation; grants at the time of employment agreement renewals require multiple years of service as a condition to vesting. The "compensation actually paid" methodology does not allocate value of new equity grants over the vesting years in the way GAAP accounting rules do, with the result that "compensation actually paid" to the other NEOs appears to have been not well aligned compared to fiscal 2025 total stockholder return. In fiscal 2026, "compensation actually paid" to other NEOs was directionally aligned with total stockholder return based on higher levels of annual bonuses and year-over-year growth in the value of previously granted equity awards.
"Compensation actually paid" in fiscal 2022 - 2026 generally was aligned with net income attributable to Gold.com ("Gold.com Net Income"). Gold.com Net Income in fiscal 2022 and 2023, $132.5 million and $156.4 million, respectively, were at high levels compared to historical levels achieved before fiscal 2021, and the amounts of "compensation actually paid" to the CEO and other NEOs generally corresponded to those results. Gold.com Net Income in fiscal 2024 ($68.5 million) and fiscal 2025 ($17.3 million) were lower than the fiscal 2022 and 2023 results, but rebounded well in fiscal 2026 ($82.3 million). Our year-end stock price has been aligned with these net income results (this cannot be expected to always be the case), with the result that "compensation actually paid" generally has been aligned with net income at those fiscal year-ends.
"Compensation actually paid" in fiscal 2022 - 2026 also was generally aligned with net income before provision for income taxes, a GAAP item we refer to as "pre-tax profit." Pre-tax profit in fiscal 2022 was robust, at $166.4 million, and in fiscal 2023 pre-tax profit set a new record, at $203.2 million. Pre-tax profit in fiscal 2024 and fiscal 2025 was down from the fiscal 2023 level. As discussed in the "Compensation Discussion and Analysis" above, annual incentive awards for our senior named executive officers are in part tied directly to pre-tax profits, and those awards, as a component of "compensation actually paid," are in direct alignment with that measure of performance. However, changes in the fair value of equity awards that are unvested at the beginning of a fiscal year (those fair value changes being tied mainly to changes in stock price) and the grant of equity awards only in certain years (mainly, years in which employment agreements are renewed) rather than as a component of annual compensation cause the SEC's "compensation actually paid" metric, for Gold.com and in some years, to be less well aligned with both Gold.com Net Income and pre-tax profit.
Most Important Financial Performance Measures
The following are the two most important financial performance measures used by Gold.com to link compensation actually paid to the CEO and other NEOs in fiscal 2026 to the Company’s performance:
(1) GAAP net income before provision for income taxes ("pre-tax profit"), a key metric for compensation determinations for the CEO, President and Chief Operating Officer profit.
(2) Increase in stock price, which directly and positively affects the fair value of unvested stock options and restricted stock units and the CEO's four-year cash incentive award (which is based on total stockholder return).