Shareholder Report
Jul. 31, 2026
USD ($)
Holding
What were the Fund costs for the last year?
(Based on a hypothetical $10,000 investment)
| Fund Name | Costs of a $10,000 investment | Costs paid as a percentage of a $10,000 investment |
| Hartford Multifactor Developed Markets (ex-US) ETF | $33 | 0.29% |
How did the Fund perform last year and what impacted its performance?
Management's Discussion of Fund Performance
International developed market equities generated strong returns over the trailing twelve-month period ending July 31, 2026 as measured by the MSCI World ex USA Index. Equities were positive across most countries within the index and led by performance from the Energy, Information Technology, and Financials sectors. The performance described below is relative to the MSCI World ex USA Index, the Fund’s reference benchmark.
Top Contributors to Performance
- The Fund’s positive active exposures to the Value and Dividend Yield risk factors contributed positively to performance as these factors generated positive excess return for the trailing twelve-month period.
- Positive stock selections in Communication Services and Financials were top contributors to performance during the period.
- Performance also benefited from positive security selection in the countries of Canada, Germany, and France.
Top Detractors to Performance
- The Fund was negatively affected from its positive active exposures to the Low Volatility and Small Size risk factors as these risk factors underperformed.
- Negative stock selections in Information Technology and Industrials were top detractors.
- Negative security selection in Japan and the Netherlands also detracted from performance during this period.
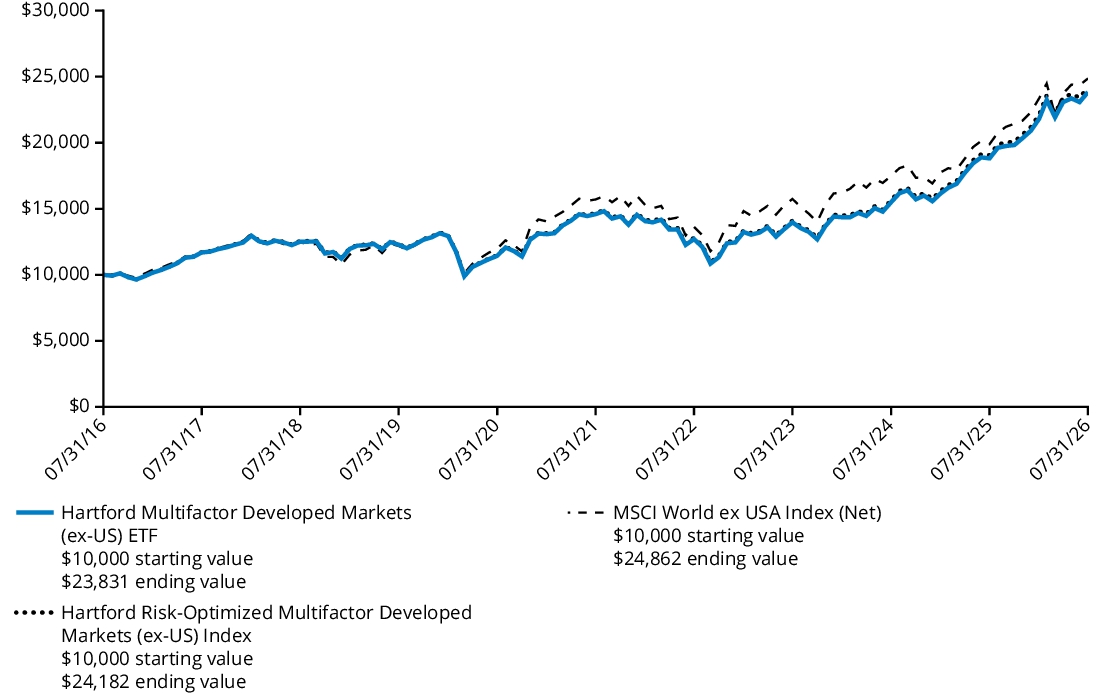
Comparison of Change in Value of $ 10,000 Investment
The graph below represents the hypothetical growth of a $10,000 investment in the Fund and the comparative indices. The Fund’s past performance is not a good predictor of the Fund’s future performance.
| Average Annual Total Returns For the Periods Ended July 31, 2026 |
1 Year | 5 Years | 10 Years |
| Fund | 26.64% | 10.30% | 9.07% |
| Hartford Risk-Optimized Multifactor Developed Markets (ex-US) Index | 26.89% | 10.50% | 9.23% |
| MSCI World ex USA Index (Net) | 25.00% | 9.62% | 9.53% |
sale of Fund shares.
Key Fund Statistics
as of July 31, 2026
| Fund's net assets | $1,626,174,668 |
| Total number of portfolio holdings (excluding derivatives, if any) | 338 |
| Total investment advisory fees paid | $3,997,551 |
| Portfolio turnover rate (excludes in-kind creation or redemption transactions, if any) | 48% |
Graphical Representation of Holdings
as of July 31, 2026
The table below shows the investment makeup of the Fund, representing the percentage of net assets of the Fund.
Composition by Country *
| Japan | 19.6 | % |
| Canada | 18.7 | % |
| Australia | 9.8 | % |
| United Kingdom | 6.4 | % |
| United States | 5.1 | % |
| France | 4.4 | % |
| Germany | 4.3 | % |
| Israel | 3.3 | % |
| Netherlands | 3.3 | % |
| Singapore | 3.1 | % |
| Other** | 21.5 | % |
| Short-Term Investments | 0.4 | % |
| Other Assets & Liabilities | 0.1 | % |
| Total | 100.0 | % |
| * | For Fund compliance purposes, the Fund may not use the same classification system. These classifications are used for financial reporting purposes. |
| ** | Ten largest country/geographic regions are presented. Additional country/geographic regions are found in Other. |
What were the Fund costs for the last year?
(Based on a hypothetical $10,000 investment)
| Fund Name | Costs of a $10,000 investment | Costs paid as a percentage of a $10,000 investment |
| Hartford Multifactor Emerging Markets ETF | $52 | 0.44% |
How did the Fund perform last year and what impacted its performance?
Management's Discussion of Fund Performance
Emerging market equities generated strong returns over the trailing twelve-month period ending July 31, 2026 as measured by the MSCI Emerging Markets Index. Equities were positive across most countries within the index and were led by strong returns in the Information Technology sector. The Financials, Materials, and Industrials sectors were also top contributors. The performance described below is relative to the MSCI Emerging Markets Index, the Fund’s reference benchmark.
Top Contributors to Performance
- The Fund’s positive active exposures to the Value and Dividend Yield risk factors contributed positively to performance as these factors generated positive excess returns for the trailing twelve-month period.
- Positive stock selections in Communication Services and Materials were top contributors to results during the period.
- Performance also benefited from positive security selection in China and India.
Top Detractors to Performance
- The Fund was negatively affected from its positive active exposures to the Small Size and Low Volatility risk factors as these factors generated negative excess return for the trailing twelve-month period.
- Negative stock selection in Information Technology was the top detractor from results.
- Negative stock selection in South Korea and Taiwan also detracted.
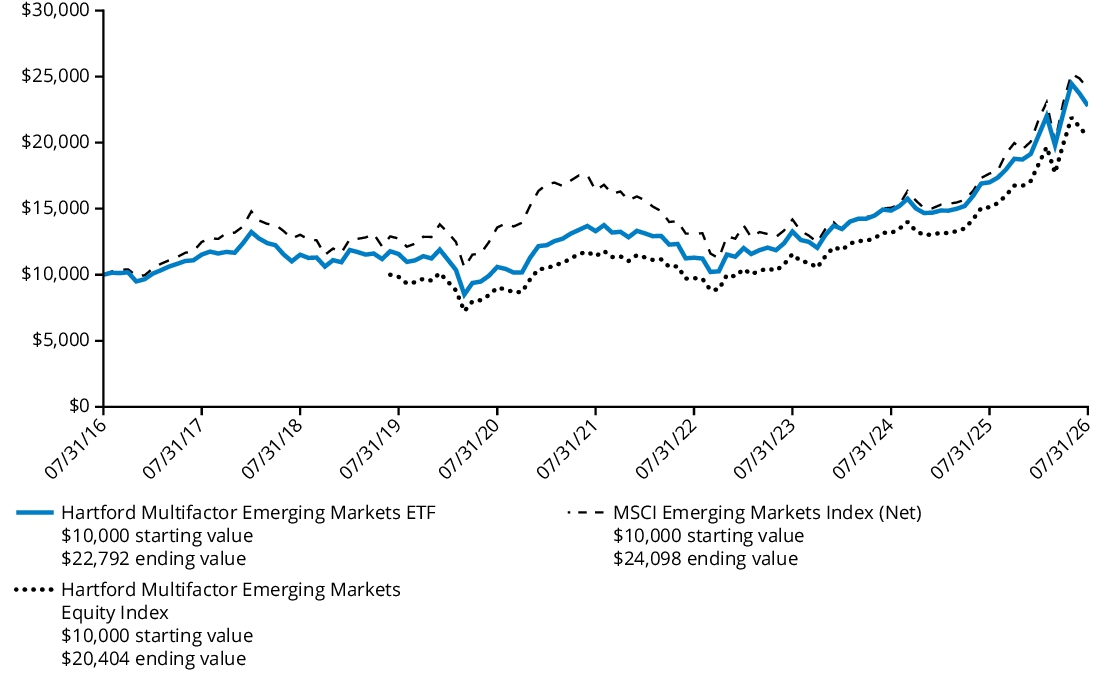
Comparison of Change in Value of $ 10,000 Investment
The graph below represents the hypothetical growth of a $10,000 investment in the Fund and the comparative indices. The Fund’s past performance is not a good predictor of the Fund’s future performance.
| Average Annual Total Returns For the Periods Ended July 31, 2026 |
1 Year | 5 Years | 10 Years |
| Fund | 34.10% | 11.37% | 8.59% |
| Hartford Multifactor Emerging Markets Equity Index | 35.03% | 12.34% | 0.00%* |
| MSCI Emerging Markets Index (Net) | 36.44% | 8.03% | 9.19% |
| * |
The Hartford Multifactor Emerging Markets Equity Index commenced operations on June 28, 2019. Reflects annualized returns starting on June 28, 2019. |
sale of Fund shares.
Key Fund Statistics
as of July 31, 2026
| Fund's net assets | $106,243,784 |
| Total number of portfolio holdings (excluding derivatives, if any) | 330 |
| Total investment advisory fees paid | $330,389 |
| Portfolio turnover rate (excludes in-kind creation or redemption transactions, if any) | 65% |
Graphical Representation of Holdings
as of July 31, 2026
The table below shows the investment makeup of the Fund, representing the percentage of net assets of the Fund.
Composition by Country *
| Taiwan | 21.5 | % |
| China | 19.2 | % |
| India | 12.8 | % |
| South Korea | 12.1 | % |
| Saudi Arabia | 5.0 | % |
| Brazil | 4.5 | % |
| Mexico | 3.7 | % |
| Malaysia | 3.2 | % |
| Thailand | 2.8 | % |
| Chile | 2.5 | % |
| Other** | 12.1 | % |
| Short-Term Investments | 1.2 | % |
| Other Assets & Liabilities | -0.6 | % |
| Total | 100.0 | % |
| * | For Fund compliance purposes, the Fund may not use the same classification system. These classifications are used for financial reporting purposes. |
| ** | Ten largest country/geographic regions are presented. Additional country/geographic regions are found in Other. |
What were the Fund costs for the last year?
(Based on a hypothetical $10,000 investment)
| Fund Name | Costs of a $10,000 investment | Costs paid as a percentage of a $10,000 investment |
| Hartford Multifactor US Equity ETF | $21 | 0.19% |
How did the Fund perform last year and what impacted its performance?
Management's Discussion of Fund Performance
United States (U.S.) large cap equities generated positive returns over the trailing twelve-month period ending July 31, 2026 as measured by the Russell 1000 Index. Returns were positive across all sectors over the trailing one-year period led by Energy, Health Care, and Information Technology. The performance described below is relative to the Russell 1000 Index, the Fund’s reference benchmark.
Top Contributors to Performance
- The Fund’s positive active exposures to the Value and Momentum risk factors were contributors to performance as these factors generated positive excess return for the trailing twelve-month period.
- Strong stock selections in Information Technology led performance. Positive selection in Financials and Consumer Discretionary were also top contributors.
Top Detractors to Performance.
- The Fund was negatively affected from its positive active exposures to Low Volatility and Small Size as these factors generated negative excess return for the trailing twelve-month period.
- Negative stock selection in Consumer Staples, Communication Services, and Industrials were detractors over the period.
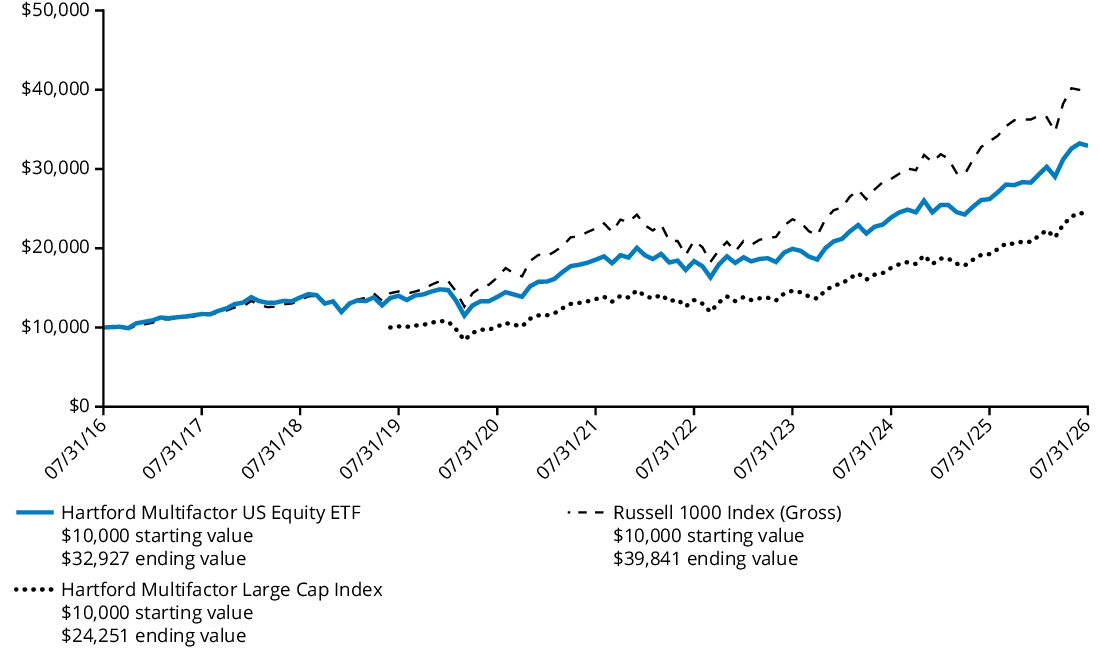
Comparison of Change in Value of $ 10,000 Investment
The graph below represents the hypothetical growth of a $10,000 investment in the Fund and the comparative indices. The Fund’s past performance is not a good predictor of the Fund’s future performance.
| Average Annual Total Returns For the Periods Ended July 31, 2026 |
1 Year | 5 Years | 10 Years |
| Fund | 25.66% | 12.16% | 12.66% |
| Hartford Multifactor Large Cap Index | 25.91% | 12.30% | 0.00%* |
| Russell 1000 Index (Gross) | 18.94% | 12.12% | 14.82% |
| * |
The Hartford Multifactor Large Cap Index commenced operations on June 28, 2019. Reflects annualized returns starting on June 28, 2019. |
sale of Fund shares.
Key Fund Statistics
as of July 31, 2026
| Fund's net assets | $705,833,765 |
| Total number of portfolio holdings (excluding derivatives, if any) | 322 |
| Total investment advisory fees paid | $1,047,919 |
| Portfolio turnover rate (excludes in-kind creation or redemption transactions, if any) | 50% |
Graphical Representation of Holdings
as of July 31, 2026
The table below shows the investment makeup of the Fund, representing the percentage of net assets of the Fund.
Composition by Sector *
| Information Technology | 34.4 | % |
| Financials | 11.3 | % |
| Health Care | 11.0 | % |
| Industrials | 10.4 | % |
| Consumer Discretionary | 8.6 | % |
| Communication Services | 7.7 | % |
| Consumer Staples | 5.7 | % |
| Utilities | 3.7 | % |
| Energy | 2.5 | % |
| Materials | 2.4 | % |
| Real Estate | 2.1 | % |
| Other Assets & Liabilities | 0.2 | % |
| Total | 100.0 | % |
| * |
For Fund compliance purposes, the Fund may not use the same classification system. These classifications are used for financial reporting purposes. |
What were the Fund costs for the last year?
(Based on a hypothetical $10,000 investment)
| Fund Name | Costs of a $10,000 investment | Costs paid as a percentage of a $10,000 investment |
| Hartford Multifactor Small Cap ETF | $40 | 0.34% |
How did the Fund perform last year and what impacted its performance?
Management's Discussion of Fund Performance
United States (U.S.) small-cap equities generated strong returns over the trailing twelve-month period ending July 31, 2026 as measured by the Russell 2000 Index. Performance was positive across all sectors over the period and led by Health Care, Energy, and Information Technology. The performance described below is relative to the Russell 2000 Index, the Fund’s reference benchmark.
Top Contributors to Performance
- The Fund’s positive active exposure to the Value and Dividend Yield risk factors contributed to performance as these factors generated positive excess return for the trailing twelve-month period.
- Positive stock selection in Financials led performance for the period. Positive selection in Industrials was also a top contributor.
- Information Technology also contributed to performance due to positive stock selection.
Top Detractors to Performance
- The Fund was negatively affected from its positive active exposures to Low Volatility and negative active exposure to Momentum during the period.
- Negative stock selection in Health Care detracted from performance for the period although the overweight in the sector was beneficial.
- An underweight in the Information Technology sector was a detractor.
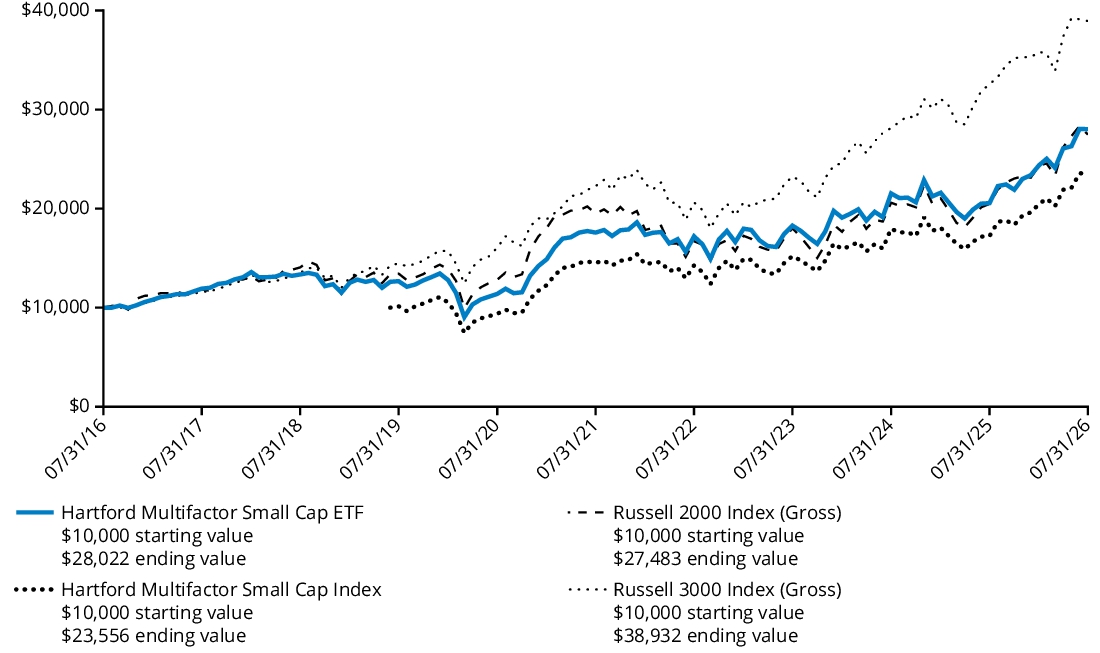
Comparison of Change in Value of $ 10,000 Investment
The graph below represents the hypothetical growth of a $10,000 investment in the Fund and the comparative indices. The Fund’s past performance is not a good predictor of the Fund’s future performance.
| Average Annual Total Returns For the Periods Ended July 31, 2026 |
1 Year | 5 Years | 10 Years |
| Fund | 36.32% | 9.77% | 10.85% |
| Hartford Multifactor Small Cap Index | 36.79% | 10.15% | 0.00%* |
| Russell 2000 Index (Gross) | 34.18% | 7.11% | 10.64% |
| Russell 3000 Index (Gross) | 19.60% | 11.82% | 14.56% |
| * |
The Hartford Multifactor Small Cap Index commenced operations on June 28, 2019. Reflects annualized returns starting on June 28, 2019. |
sale of Fund shares.
Key Fund Statistics
as of July 31, 2026
| Fund's net assets | $61,476,807 |
| Total number of portfolio holdings (excluding derivatives, if any) | 303 |
| Total investment advisory fees paid | $150,347 |
| Portfolio turnover rate (excludes in-kind creation or redemption transactions, if any) | 37% |
Graphical Representation of Holdings
as of July 31, 2026
The table below shows the investment makeup of the Fund, representing the percentage of net assets of the Fund.
Composition by Sector *
| Financials | 19.7 | % |
| Health Care | 19.2 | % |
| Industrials | 14.1 | % |
| Consumer Discretionary | 13.4 | % |
| Information Technology | 11.3 | % |
| Real Estate | 5.4 | % |
| Consumer Staples | 5.1 | % |
| Communication Services | 3.5 | % |
| Materials | 3.1 | % |
| Energy | 2.9 | % |
| Utilities | 2.0 | % |
| Short-Term Investments | 3.7 | % |
| Other Assets & Liabilities | -3.4 | % |
| Total | 100.0 | % |
| * |
For Fund compliance purposes, the Fund may not use the same classification system. These classifications are used for financial reporting purposes. |
What were the Fund costs for the last year?
(Based on a hypothetical $10,000 investment)
| Fund Name | Costs of a $10,000 investment | Costs paid as a percentage of a $10,000 investment |
| Hartford Disciplined US Equity ETF | $21 | 0.19% |
How did the Fund perform last year and what impacted its performance?
Management's Discussion of Fund Performance
United States (U.S.) large-cap equities generated positive returns over the trailing twelve-month period ending July 31, 2026 as measured by the Russell 1000 Index. Returns were positive across all sectors over the trailing one-year period led by Energy, Health Care, and Information Technology. The performance described below is relative to the Russell 1000 Index, the Fund’s reference benchmark.
Top Contributors to Performance
- The Fund’s positive active exposures to the Value and Dividend Yield risk factors were contributors to performance as these factors generated positive excess return for the trailing twelve-month period.
- Positive stock selection in Financials, Consumer Discretionary, and Communication Services also contributed to performance for the period.
Top Detractors to Performance
- The Fund was negatively affected from its positive active exposures to Low Volatility and Small Size as these factors generated negative excess return for the trailing twelve-month period.
- Negative stock selection in Materials and Consumer Staples were top detractors from performance for the period.
Comparison of Change in Value of $ 10,000 Investment
The graph below represents the hypothetical growth of a $10,000 investment in the Fund and the comparative indices. The Fund’s past performance is not a good predictor of the Fund’s future performance.
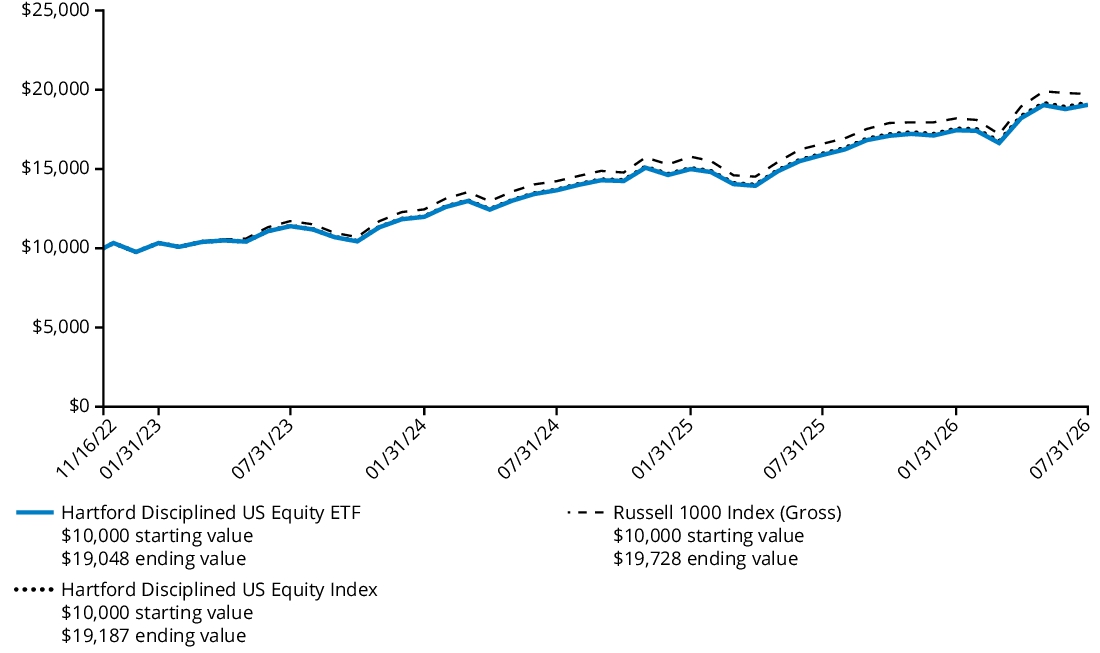
| Average Annual Total Returns For the Periods Ended July 31, 2026 |
1 Year | Since Inception (November 16, 2022) |
| Fund | 19.92% | 19.00% |
| Hartford Disciplined US Equity Index | 20.18% | 19.24% |
| Russell 1000 Index (Gross) | 18.94% | 19.81% |
sale of Fund shares.
Key Fund Statistics
as of July 31, 2026
| Fund's net assets | $203,614,024 |
| Total number of portfolio holdings (excluding derivatives, if any) | 240 |
| Total investment advisory fees paid | $312,420 |
| Portfolio turnover rate (excludes in-kind creation or redemption transactions, if any) | 56% |
Graphical Representation of Holdings
as of July 31, 2026
The table below shows the investment makeup of the Fund, representing the percentage of net assets of the Fund.
Composition by Sector *
| Information Technology | 34.3 | % |
| Financials | 14.6 | % |
| Communication Services | 10.3 | % |
| Consumer Discretionary | 9.4 | % |
| Industrials | 7.7 | % |
| Health Care | 7.1 | % |
| Consumer Staples | 5.4 | % |
| Real Estate | 3.9 | % |
| Energy | 3.2 | % |
| Utilities | 2.1 | % |
| Materials | 1.8 | % |
| Short-Term Investments | 0.2 | % |
| Other Assets & Liabilities | 0.0 | %† |
| Total | 100.0 | % |
| * |
For Fund compliance purposes, the Fund may not use the same classification system. These classifications are used for financial reporting purposes. |
| † |
Percentage rounds to zero. |
What were the Fund costs for the last year?
(Based on a hypothetical $10,000 investment)
| Fund Name | Costs of a $10,000 investment | Costs paid as a percentage of a $10,000 investment |
| Hartford US Quality Growth ETF | $37 | 0.34% |
How did the Fund perform last year and what impacted its performance?
Management's Discussion of Fund Performance
United States (U.S.) equities were positive over the reporting period as measured by the Russell 1000 Index. Large-cap growth stocks as measured by the Russell 1000 Growth Index underperformed the broad index but still generated positive returns. Within the Russell 1000 Growth Index, performance across sectors was mixed with strong performance from Energy while Utilities was the worst performer. The performance described below is relative to the Russell 1000 Growth Index, the Fund’s reference benchmark.
Top Contributors to Performance
- The Fund’s positive active exposure to the Value risk factor and negative active exposure to the Momentum risk factor were contributors to performance for the period.
- Strong stock selection in Information Technology led performance.
- Positive stock selection in Consumer Discretionary and Health Care also contributed to results.
Top Detractors to Performance
- The Fund was negatively affected from its positive active exposure to the Small Size risk factor.
- Negative stock selection in Energy was a detractor to performance over the period.
Comparison of Change in Value of $ 10,000 Investment
The graph below represents the hypothetical growth of a $10,000 investment in the Fund and the comparative indices. The Fund’s past performance is not a good predictor of the Fund’s future performance.
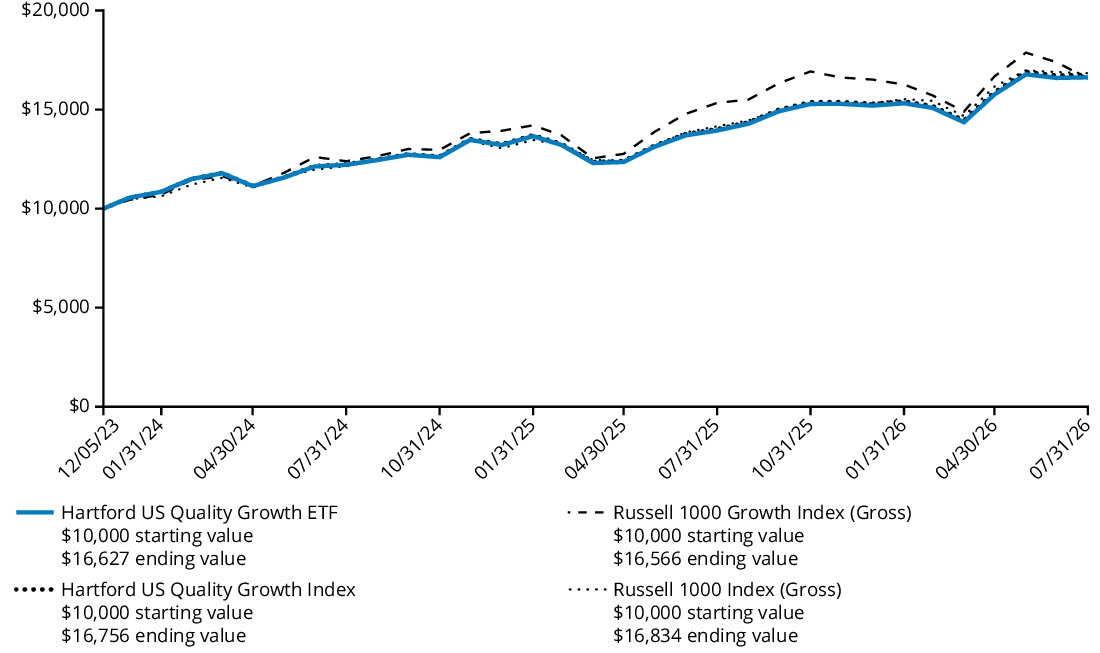
| Average Annual Total Returns For the Periods Ended July 31, 2026 |
1 Year | Since Inception (December 05, 2023) |
| Fund | 19.25% | 21.11% |
| Hartford US Quality Growth Index | 19.56% | 21.44% |
| Russell 1000 Growth Index (Gross) | 8.03% | 21.12% |
| Russell 1000 Index (Gross) | 18.94% | 21.59% |
sale of Fund shares.
Key Fund Statistics
as of July 31, 2026
| Fund's net assets | $49,175,947 |
| Total number of portfolio holdings (excluding derivatives, if any) | 163 |
| Total investment advisory fees paid | $165,683 |
| Portfolio turnover rate (excludes in-kind creation or redemption transactions, if any) | 42% |
Graphical Representation of Holdings
as of July 31, 2026
The table below shows the investment makeup of the Fund, representing the percentage of net assets of the Fund.
Composition by Sector *
| Information Technology | 41.5 | % |
| Consumer Discretionary | 13.1 | % |
| Communication Services | 11.0 | % |
| Health Care | 9.9 | % |
| Financials | 7.0 | % |
| Industrials | 6.7 | % |
| Consumer Staples | 3.9 | % |
| Energy | 3.8 | % |
| Materials | 1.9 | % |
| Real Estate | 1.0 | % |
| Utilities | 0.1 | % |
| Short-Term Investments | 0.0 | %† |
| Other Assets & Liabilities | 0.1 | % |
| Total | 100.0 | % |
| * |
For Fund compliance purposes, the Fund may not use the same classification system. These classifications are used for financial reporting purposes. |
| † |
Percentage rounds to zero. |
What were the Fund costs for the last year?
(Based on a hypothetical $10,000 investment)
| Fund Name | Costs of a $10,000 investment | Costs paid as a percentage of a $10,000 investment |
| Hartford US Value ETF | $33 | 0.29% |
How did the Fund perform last year and what impacted its performance?
Management's Discussion of Fund Performance
United States (U.S.) equities were positive over the trailing twelve-month period ending July 31, 2026 period as measured by the Russell 1000 Index. Large-cap value stocks as measured by the Russell 1000 Value Index strongly outperformed the broad index. Within the Russell 1000 Value Index, performance was positive across all sectors led by Information Technology. Health Care and Industrials were also top contributors to return. The performance described below is relative to the Russell 1000 Value Index, the Fund’s reference benchmark.
Top Contributors to Performance
- The Fund’s positive active exposure to the Value risk factor and negative active exposure to the Low Volatility risk factor contributed to performance for the period.
- Strong stock selection in Financials was the top contributor to performance.
- Positive stock selection in Consumer Discretionary, Industrials, and Health Care were also top contributors.
Top Detractors to Performance
- The Fund was negatively affected from its positive active exposure to the Quality risk factor as this factor generated negative excess return for the period.
- The underweight in Information Technology was the top detractor.
- Negative stock selection in Utilities and Communication Services also detracted.
Comparison of Change in Value of $ 10,000 Investment
The graph below represents the hypothetical growth of a $10,000 investment in the Fund and the comparative indices. The Fund’s past performance is not a good predictor of the Fund’s future performance.
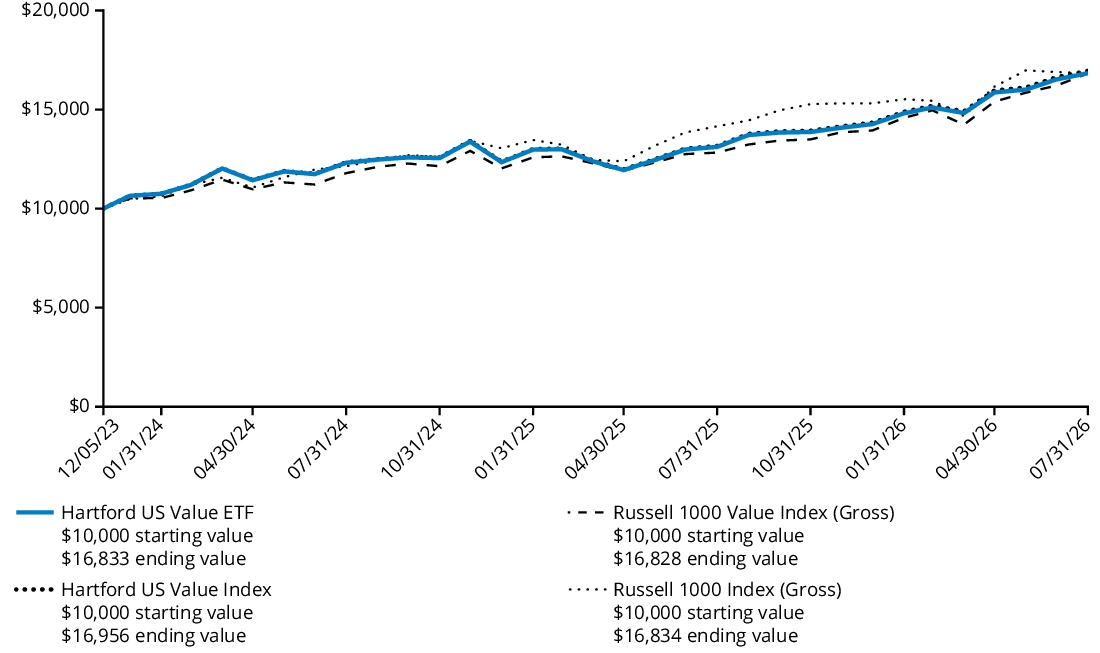
| Average Annual Total Returns For the Periods Ended July 31, 2026 |
1 Year | Since Inception (December 05, 2023) |
| Fund | 28.34% | 21.67% |
| Hartford US Value Index | 28.78% | 22.00% |
| Russell 1000 Value Index (Gross) | 31.19% | 21.26% |
| Russell 1000 Index (Gross) | 18.94% | 21.59% |
sale of Fund shares.
Key Fund Statistics
as of July 31, 2026
| Fund's net assets | $49,183,398 |
| Total number of portfolio holdings (excluding derivatives, if any) | 140 |
| Total investment advisory fees paid | $137,318 |
| Portfolio turnover rate (excludes in-kind creation or redemption transactions, if any) | 74% |
Graphical Representation of Holdings
as of July 31, 2026
The table below shows the investment makeup of the Fund, representing the percentage of net assets of the Fund.
Composition by Sector *
| Financials | 37.2 | % |
| Health Care | 11.2 | % |
| Energy | 10.2 | % |
| Information Technology | 10.1 | % |
| Communication Services | 6.0 | % |
| Utilities | 5.7 | % |
| Industrials | 5.0 | % |
| Real Estate | 4.7 | % |
| Consumer Discretionary | 3.9 | % |
| Consumer Staples | 3.5 | % |
| Materials | 2.4 | % |
| Other Assets & Liabilities | 0.1 | % |
| Total | 100.0 | % |
| * |
For Fund compliance purposes, the Fund may not use the same classification system. These classifications are used for financial reporting purposes. |