Shareholder Report
Jul. 31, 2026
USD ($)
holding
Jun. 30, 2026
This annual shareholder report contains important information about the MarketDesk Focused U.S. Dividend ETF (the “Fund”) for the period of August 1, 2025 to July 31, 2026 (the “Period”). You can find additional information about the Fund at https://www.marketdeskindices.com/fdiv. You can also request this information by contacting us at (215) 330-4476. For information regarding your Fund shares or account, including account balances, transactions, or distributions, please contact your financial intermediary. | |||||||||||
Availability of Additional Information
For additional information about the Fund, including its prospectus, financial information, holdings, and proxy information, visit https://www.marketdeskindices.com/fdiv. You can also request information by calling (215) 330-4476.
Householding
Householding is an option available to certain investors of the Fund. Householding is a method of delivery, based on the preference of the individual investor, in which a single copy of certain shareholder documents can be delivered to investors who share the same address, even if their accounts are registered under different names. Householding for the Fund is available through certain broker-dealers. If you are interested in enrolling in householding and receiving a single copy of prospectuses and other shareholder documents or you are currently enrolled in householding and wish to change your householding status, please contact your broker-dealer.
| WHAT WERE THE FUND COSTS FOR THE PERIOD? (based on a hypothetical $10,000 investment) | |||||||||||
| COST OF $10,000 INVESTMENT | COST PAID AS A PERCENTAGE OF $10,000 INVESTMENT | ||||||||||
| $37 | 0.35% | ||||||||||
| WHAT FACTORS INFLUENCED PERFORMANCE FOR THE PERIOD? | |||||||||||
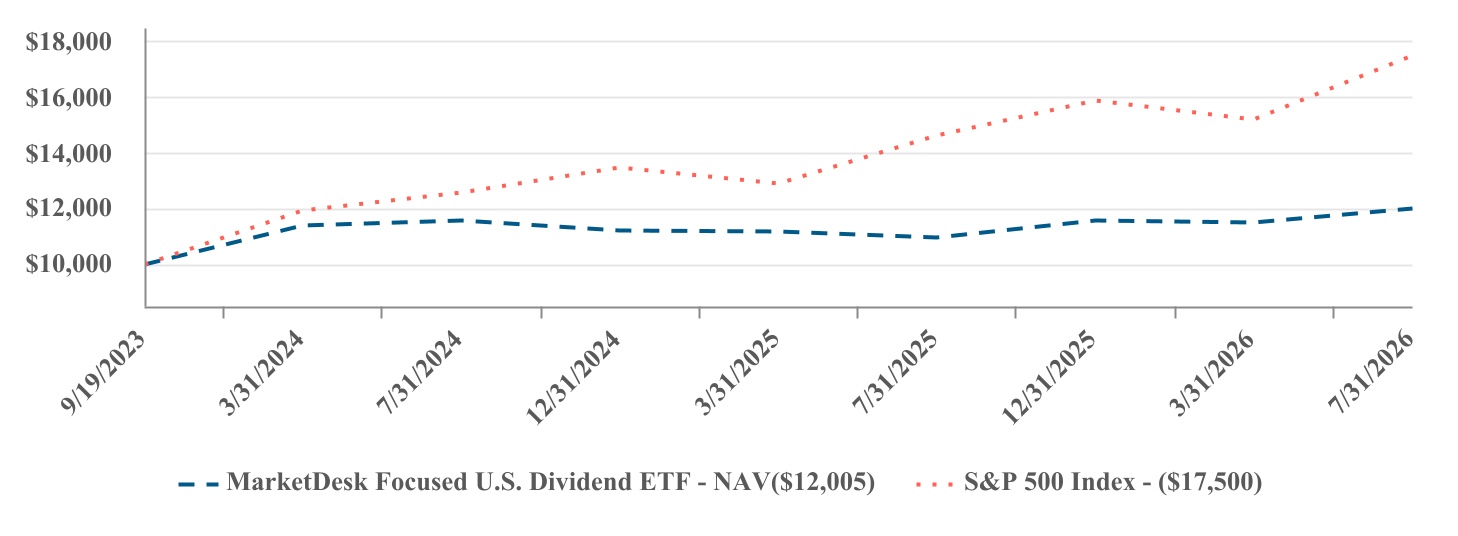
The Fund’s investment strategy seeks both capital appreciation and a high level of dividend income. During the Period, the Fund underperformed the broader U.S. equity market as elevated interest rates weighed on dividend-oriented equities, while market gains remained concentrated in large technology companies benefiting from increased investment in artificial intelligence (AI).
Dividend stocks continued to face headwinds from elevated interest rates as money market yields and other fixed income investments provided income-seeking investors with attractive alternatives. Higher borrowing costs also pressured capital-intensive and leverage-sensitive companies by increasing interest expense and limiting capital available for investment, expansion, and dividend growth. Meanwhile, AI-related infrastructure spending remained comparatively strong, contributing to a widening divergence in growth between AI-related businesses and more traditional segments of the economy.
This divergence was particularly meaningful for the Fund because its investment universe requires companies to meet certain dividend criteria. Many technology companies benefiting from AI-related spending paid dividends below the Fund’s required threshold or did not pay dividends at all, making them ineligible for investment. As a result, the Fund maintained greater exposure to mature, dividend-paying businesses that generally experienced slower growth. Some of these companies also faced pressure as investors assessed the potential for AI to disrupt their industries or limit future growth prospects, even though those risks had not yet materially affected underlying operating results.
| PERFORMANCE OF A HYPOTHETICAL $10,000 INVESTMENT | |||||||||||
| PERFORMANCE | ||||||||||||||
| One Year | Since Inception (9/19/2023) | |||||||||||||
| MarketDesk Focused U.S. Dividend ETF - NAV | 9.63% | 6.58% | ||||||||||||
| S&P 500 Index | 19.56% | 21.56% | ||||||||||||
The Fund’s past performance is not a good predictor of how the Fund will perform in the future. The graph and table do not reflect the deduction of taxes that a shareholder would pay on fund distributions or redemption of fund shares. | ||||||||||||||
Visit https://www.marketdeskindices.com/fdiv for more recent performance information. | ||||||||||||||
| KEY FUND STATISTICS (as of Period End) | ||||||||||||||||||||
| Net Assets | $58,674,845 | Portfolio Turnover Rate* | 465% | |||||||||||||||||
| # of Portfolio Holdings | 62 | Fund Advisory Fees Paid | $252,050 | |||||||||||||||||
| *Portfolio turnover is not annualized and is calculated without regard to short-term securities having a maturity of less than one year. Excludes impact of in-kind transactions. | ||||||||||||||||||||
| SECTOR WEIGHTING (as a % of Net Assets) | |||||
| Financials | 24.4% | ||||
| Consumer Discretionary | 17.8% | ||||
| Industrials | 17.3% | ||||
| Consumer Staples | 14.5% | ||||
| Health Care | 11.4% | ||||
| Utilities | 5.9% | ||||
| Materials | 4.7% | ||||
| Communication Services | 3.9% | ||||
| TOP 10 HOLDINGS (as a % of Net Assets) | |||||
| Lamb Weston Holdings, Inc. | 2.3% | ||||
| Allstate Corp. | 2.3% | ||||
| Hanover Insurance Group, Inc. | 2.2% | ||||
| Millicom International Cellular SA | 2.2% | ||||
| Amgen, Inc. | 2.2% | ||||
| Bank of America Corp. | 2.1% | ||||
| MSC Industrial Direct Co., Inc. - Class A | 2.1% | ||||
| Johnson & Johnson | 2.1% | ||||
| T Rowe Price Group, Inc. | 2.1% | ||||
| Brown-Forman Corp. - Class B | 2.1% | ||||
This annual shareholder report contains important information about the MarketDesk Focused U.S. Momentum ETF (the “Fund”) for the period of August 1, 2025 to July 31, 2026 (the “Period”). You can find additional information about the Fund at https://www.marketdeskindices.com/fmtm. You can also request this information by contacting us at (215) 330-4476. For information regarding your Fund shares or account, including account balances, transactions, or distributions, please contact your financial intermediary. | |||||||||||
Availability of Additional Information
For additional information about the Fund, including its prospectus, financial information, holdings, and proxy information, visit https://www.marketdeskindices.com/fmtm. You can also request information by calling (215) 330-4476.
Householding
Householding is an option available to certain investors of the Fund. Householding is a method of delivery, based on the preference of the individual investor, in which a single copy of certain shareholder documents can be delivered to investors who share the same address, even if their accounts are registered under different names. Householding for the Fund is available through certain broker-dealers. If you are interested in enrolling in householding and receiving a single copy of prospectuses and other shareholder documents or you are currently enrolled in householding and wish to change your householding status, please contact your broker-dealer.
| WHAT WERE THE FUND COSTS FOR THE PERIOD? (based on a hypothetical $10,000 investment) | |||||||||||
| COST OF $10,000 INVESTMENT | COST PAID AS A PERCENTAGE OF $10,000 INVESTMENT | ||||||||||
| $54 | 0.45% | ||||||||||
| WHAT FACTORS INFLUENCED PERFORMANCE FOR THE PERIOD? | |||||||||||
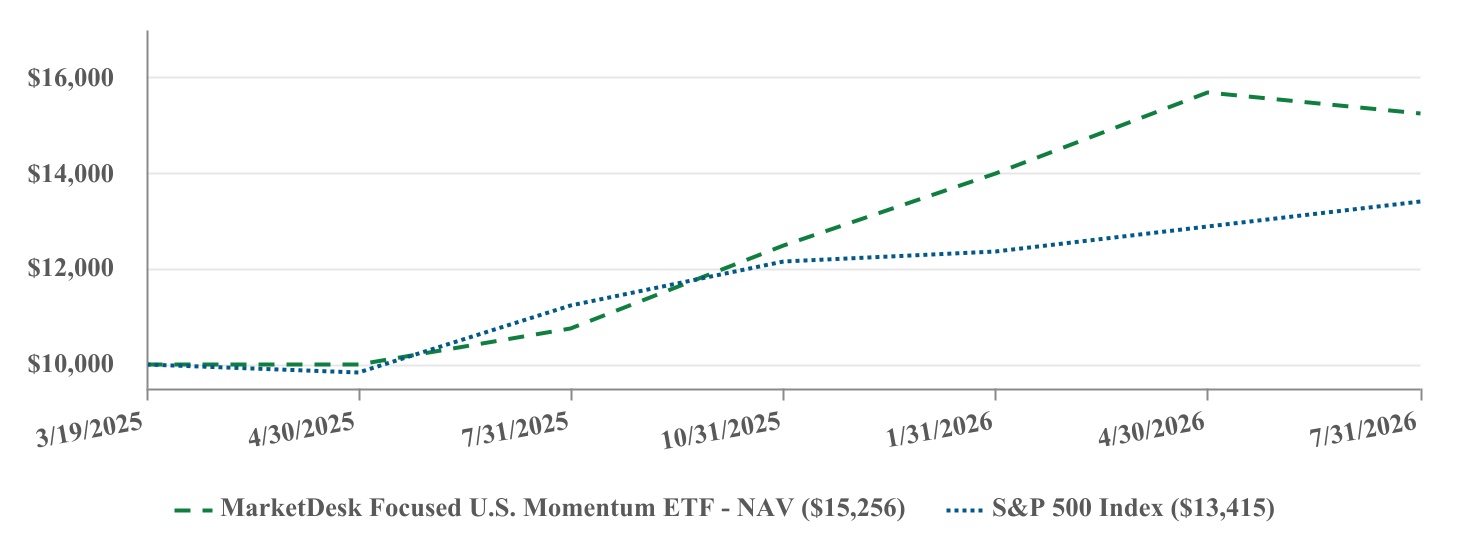
The Fund’s investment strategy seeks capital appreciation. During the Period, the Fund benefited from a market environment characterized by several strong momentum trends. These included companies tied to artificial intelligence (AI) infrastructure, semiconductors, and cloud computing, where the Fund's quantitative process identified companies exhibiting strengthening price momentum. The Fund also captured positive trends across the Industrials, Communication Services, and Financials sectors, helping broaden performance beyond the Technology sector.
AI-related infrastructure investment remained one of the strongest market themes during the Period as companies increased capital spending on computing infrastructure and other technology necessary to build and run AI models. The Fund’s quantitative investment process identified strengthening price momentum among companies benefiting from this spending, allowing the portfolio to participate as momentum built. Periodic concerns about the return on AI investment and the outlook for capital spending created volatility, but the broader trend remained relatively persistent.
| PERFORMANCE OF A HYPOTHETICAL $10,000 INVESTMENT | |||||||||||
| PERFORMANCE | ||||||||||||||
| One Year | Since Inception (3/19/2025) | |||||||||||||
| MarketDesk Focused U.S. Momentum ETF - NAV | 41.89% | 36.21% | ||||||||||||
| S&P 500 Index | 19.56% | 23.98% | ||||||||||||
The Fund’s past performance is not a good predictor of how the Fund will perform in the future. The graph and table do not reflect the deduction of taxes that a shareholder would pay on fund distributions or redemption of fund shares. | ||||||||||||||
Visit https://www.marketdeskindices.com/fmtm for more recent performance information. | ||||||||||||||
| KEY FUND STATISTICS (as of Period End) | ||||||||||||||||||||
| Net Assets | $252,248,950 | Portfolio Turnover Rate* | 720% | |||||||||||||||||
| # of Portfolio Holdings | 31 | Fund Advisory Fees Paid | $398,670 | |||||||||||||||||
| *Portfolio turnover is not annualized and is calculated without regard to short-term securities having a maturity of less than one year. Excludes impact of in-kind transactions. | ||||||||||||||||||||
| SECTOR WEIGHTING (as a % of Net Assets) | |||||
| Information Technology | 47.9% | ||||
| Industrials | 19.3% | ||||
| Financials | 13.1% | ||||
| Health Care | 9.7% | ||||
| Real Estate | 6.4% | ||||
| Consumer Discretionary | 3.4% | ||||
| Cash and Cash Equivalents | 0.2% | ||||
| TOP 10 HOLDINGS (as a % of Net Assets) | |||||
| Astera Labs, Inc. | 3.8% | ||||
| Western Digital Corp. | 3.7% | ||||
| Snowflake, Inc. - Class A | 3.5% | ||||
| Illumina, Inc. | 3.5% | ||||
| Crowdstrike Holdings, Inc. - Class A | 3.5% | ||||
| Fortinet, Inc. | 3.4% | ||||
| Lam Research Corp. | 3.4% | ||||
| NetApp, Inc. | 3.4% | ||||
| Datadog, Inc. - Class A | 3.4% | ||||
| Viking Holdings Ltd. | 3.4% | ||||