Shareholder Report
Jul. 31, 2026
USD ($)
holding
Jul. 31, 2025
This annual shareholder report contains important information about the Altrius Global Dividend ETF (the “Fund”) for the period of August 1, 2025 to July 31, 2026 (the “Period”). You can find additional information about the Fund at https://altriusfunds.com/. You can also request this information by contacting us at (215) 330-4476. For information regarding your Fund shares or account, including account balances, transactions, or distributions, please contact your financial intermediary. | |||||||||||
Availability of Additional Information
For additional information about the Fund, including its prospectus, financial information, holdings, and proxy information, visit https://altriusfunds.com/. You can also request information by calling (215) 330-4476.
Householding
Householding is an option available to certain investors of the Fund. Householding is a method of delivery, based on the preference of the individual investor, in which a single copy of certain shareholder documents can be delivered to investors who share the same address, even if their accounts are registered under different names. Householding for the Fund is available through certain broker-dealers. If you are interested in enrolling in householding and receiving a single copy of prospectuses and other shareholder documents or you are currently enrolled in householding and wish to change your householding status, please contact your broker-dealer.
| WHAT WERE THE FUND COSTS FOR THE PERIOD? (based on a hypothetical $10,000 investment) | |||||||||||
| COST OF $10,000 INVESTMENT | COST PAID AS A PERCENTAGE OF $10,000 INVESTMENT | ||||||||||
| $56 | 0.49% | ||||||||||
| WHAT FACTORS INFLUENCED PERFORMANCE FOR THE PERIOD? | ||
The Fund returned 30.08% (NAV) for the fiscal year ended July 31, 2026, vs 22.41% for Solactive GBS Global Markets All Cap USD Index (the “Index”). The Fund invests in a portfolio of U.S. and non-U.S. equities. The Fund’s performance was positively impacted by the Fund’s allocation to value-oriented stocks, both U.S. and non-U.S., as value outperformed growth during the Period. The Fund outperformed the Index and the broader market as the Index’s exposure to the Magnificent 7 stocks and to the Technology sector hampered performance.
This, coupled with the Fund’s exposure to the defensive sectors like Healthcare and Consumer Staples and its exposure to Financials and Industrials sectors, along with strong stock selection led to its outperformance.
On an absolute basis, the Fund’s performance has been in line with its philosophy of investing in companies that provide steady and growing dividends. To that extent, the Fund’s exposure to the Financial sector was the largest contributor as both U.S. and non-U.S. financials performed well. After decades of low interest rates, banks globally are seeing higher interest incomes and margins on their core lending businesses, strong capital markets activity and higher fees on wealth management leading to robust returns on equity and strong capital positions.
The Fund’s Industrials sector exposure, which is the Fund’s fourth largest sector after Healthcare, Financials and Consumer Staples, also contributed to its strong performance, aided by stock selection.
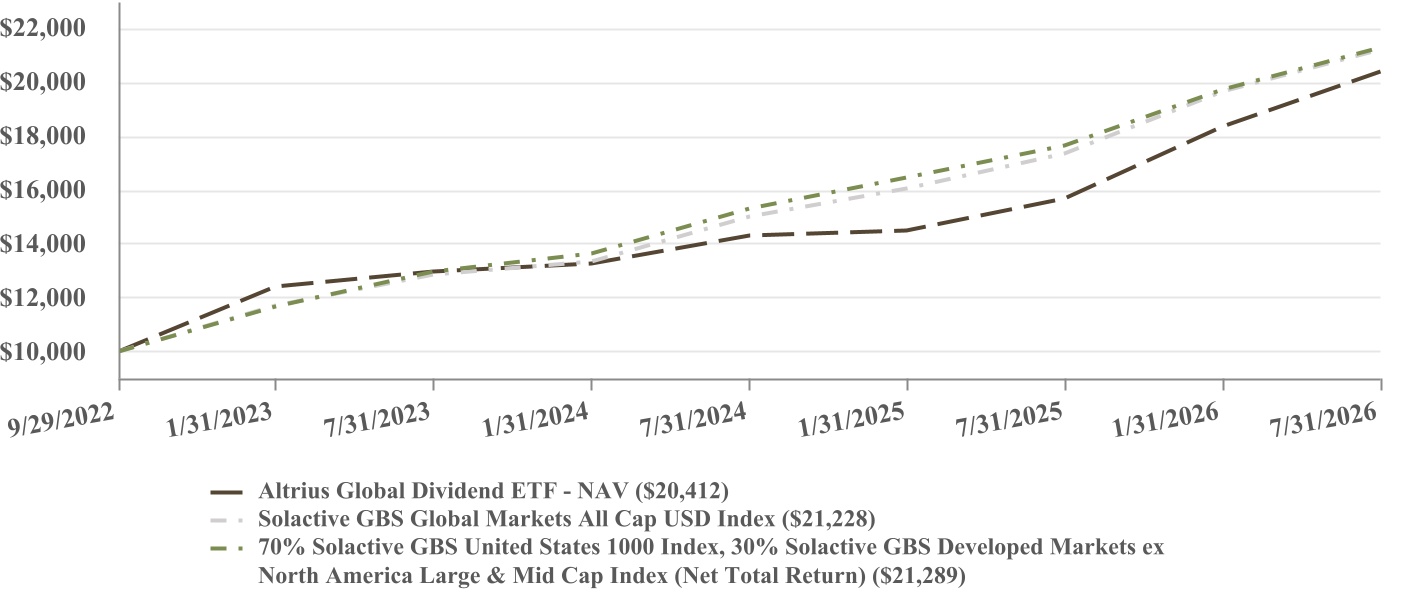
| PERFORMANCE OF A HYPOTHETICAL $10,000 INVESTMENT | |||||||||||
| AVERAGE ANNUAL TOTAL RETURNS | |||||||||||||||||
| One Year | Since Inception (9/29/2022) | ||||||||||||||||
| Altrius Global Dividend ETF - NAV | 30.08% | 20.45% | |||||||||||||||
| Solactive GBS Global Markets All Cap USD Index | 22.41% | 21.68% | |||||||||||||||
| 70% Solactive GBS United States 1000 Index, 30% Solactive GBS Developed Markets ex North America Large & Mid Cap Index (Net Total Return)* | 20.64% | 21.77% | |||||||||||||||
| * The Fund has changed its benchmark to the Solactive GBS Global Markets All Cap Index, which represents the overall global equity market in which the Fund invests. | |||||||||||||||||
The Fund’s past performance is not a good predictor of how the Fund will perform in the future. The graph and table do not reflect the deduction of taxes that a shareholder would pay on Fund distributions or redemption of Fund shares. Net total return figures assume the reinvestment of dividends after deduction of withholding tax, applying the maximum rate to nonresident individual investors who do not benefit from double taxation treaties. | |||||||||||||||||
Visit https://altriusfunds.com/ for more recent performance information. | |||||||||||||||||
| KEY FUND STATISTICS (as of Period End) | ||||||||||||||||||||
| Net Assets | $21,402,874 | Portfolio Turnover Rate* | 37% | |||||||||||||||||
| # of Portfolio Holdings | 64 | Fund Advisory Fees Paid | $74,138 | |||||||||||||||||
| *Portfolio turnover is not annualized and is calculated without regard to short-term securities having a maturity of less than one year. Excludes impact of in-kind transactions. | ||||||||||||||||||||
| SECTOR WEIGHTING (as a % of Net Assets) | |||||
| Financials | 20.7% | ||||
| Health Care | 20.0% | ||||
| Consumer Staples | 18.2% | ||||
| Industrials | 13.6% | ||||
| Energy | 7.8% | ||||
| Materials | 5.6% | ||||
| Consumer Discretionary | 4.6% | ||||
| Information Technology | 4.4% | ||||
| Communication Services | 3.5% | ||||
| Real Estate | 1.2% | ||||
| TOP 10 HOLDINGS (as a % of Net Assets) | |||||
| Capgemini SE - ADR | 2.6% | ||||
| Banco Bilbao Vizcaya Argentaria SA - ADR | 2.3% | ||||
| BAE Systems PLC - ADR | 2.3% | ||||
| Publicis Groupe SA - ADR | 2.3% | ||||
| Siemens AG - ADR | 2.3% | ||||
| BNP Paribas SA - ADR | 2.3% | ||||
| Toyota Motor Corp. - ADR | 2.3% | ||||
| Reckitt Benckiser Group PLC - ADR | 2.2% | ||||
| Vinci SA - ADR | 2.2% | ||||
| Muenchener Rueckversicherungs-Gesellschaft AG in Muenchen - ADR | 2.2% | ||||